Changes in Biochemical Parameters of the Calcium-Phosphorus Homeostasis in Relation to Nutritional Intake in Very-Low-Birth-Weight Infants

Abstract
:1. Introduction
2. Materials and Methods
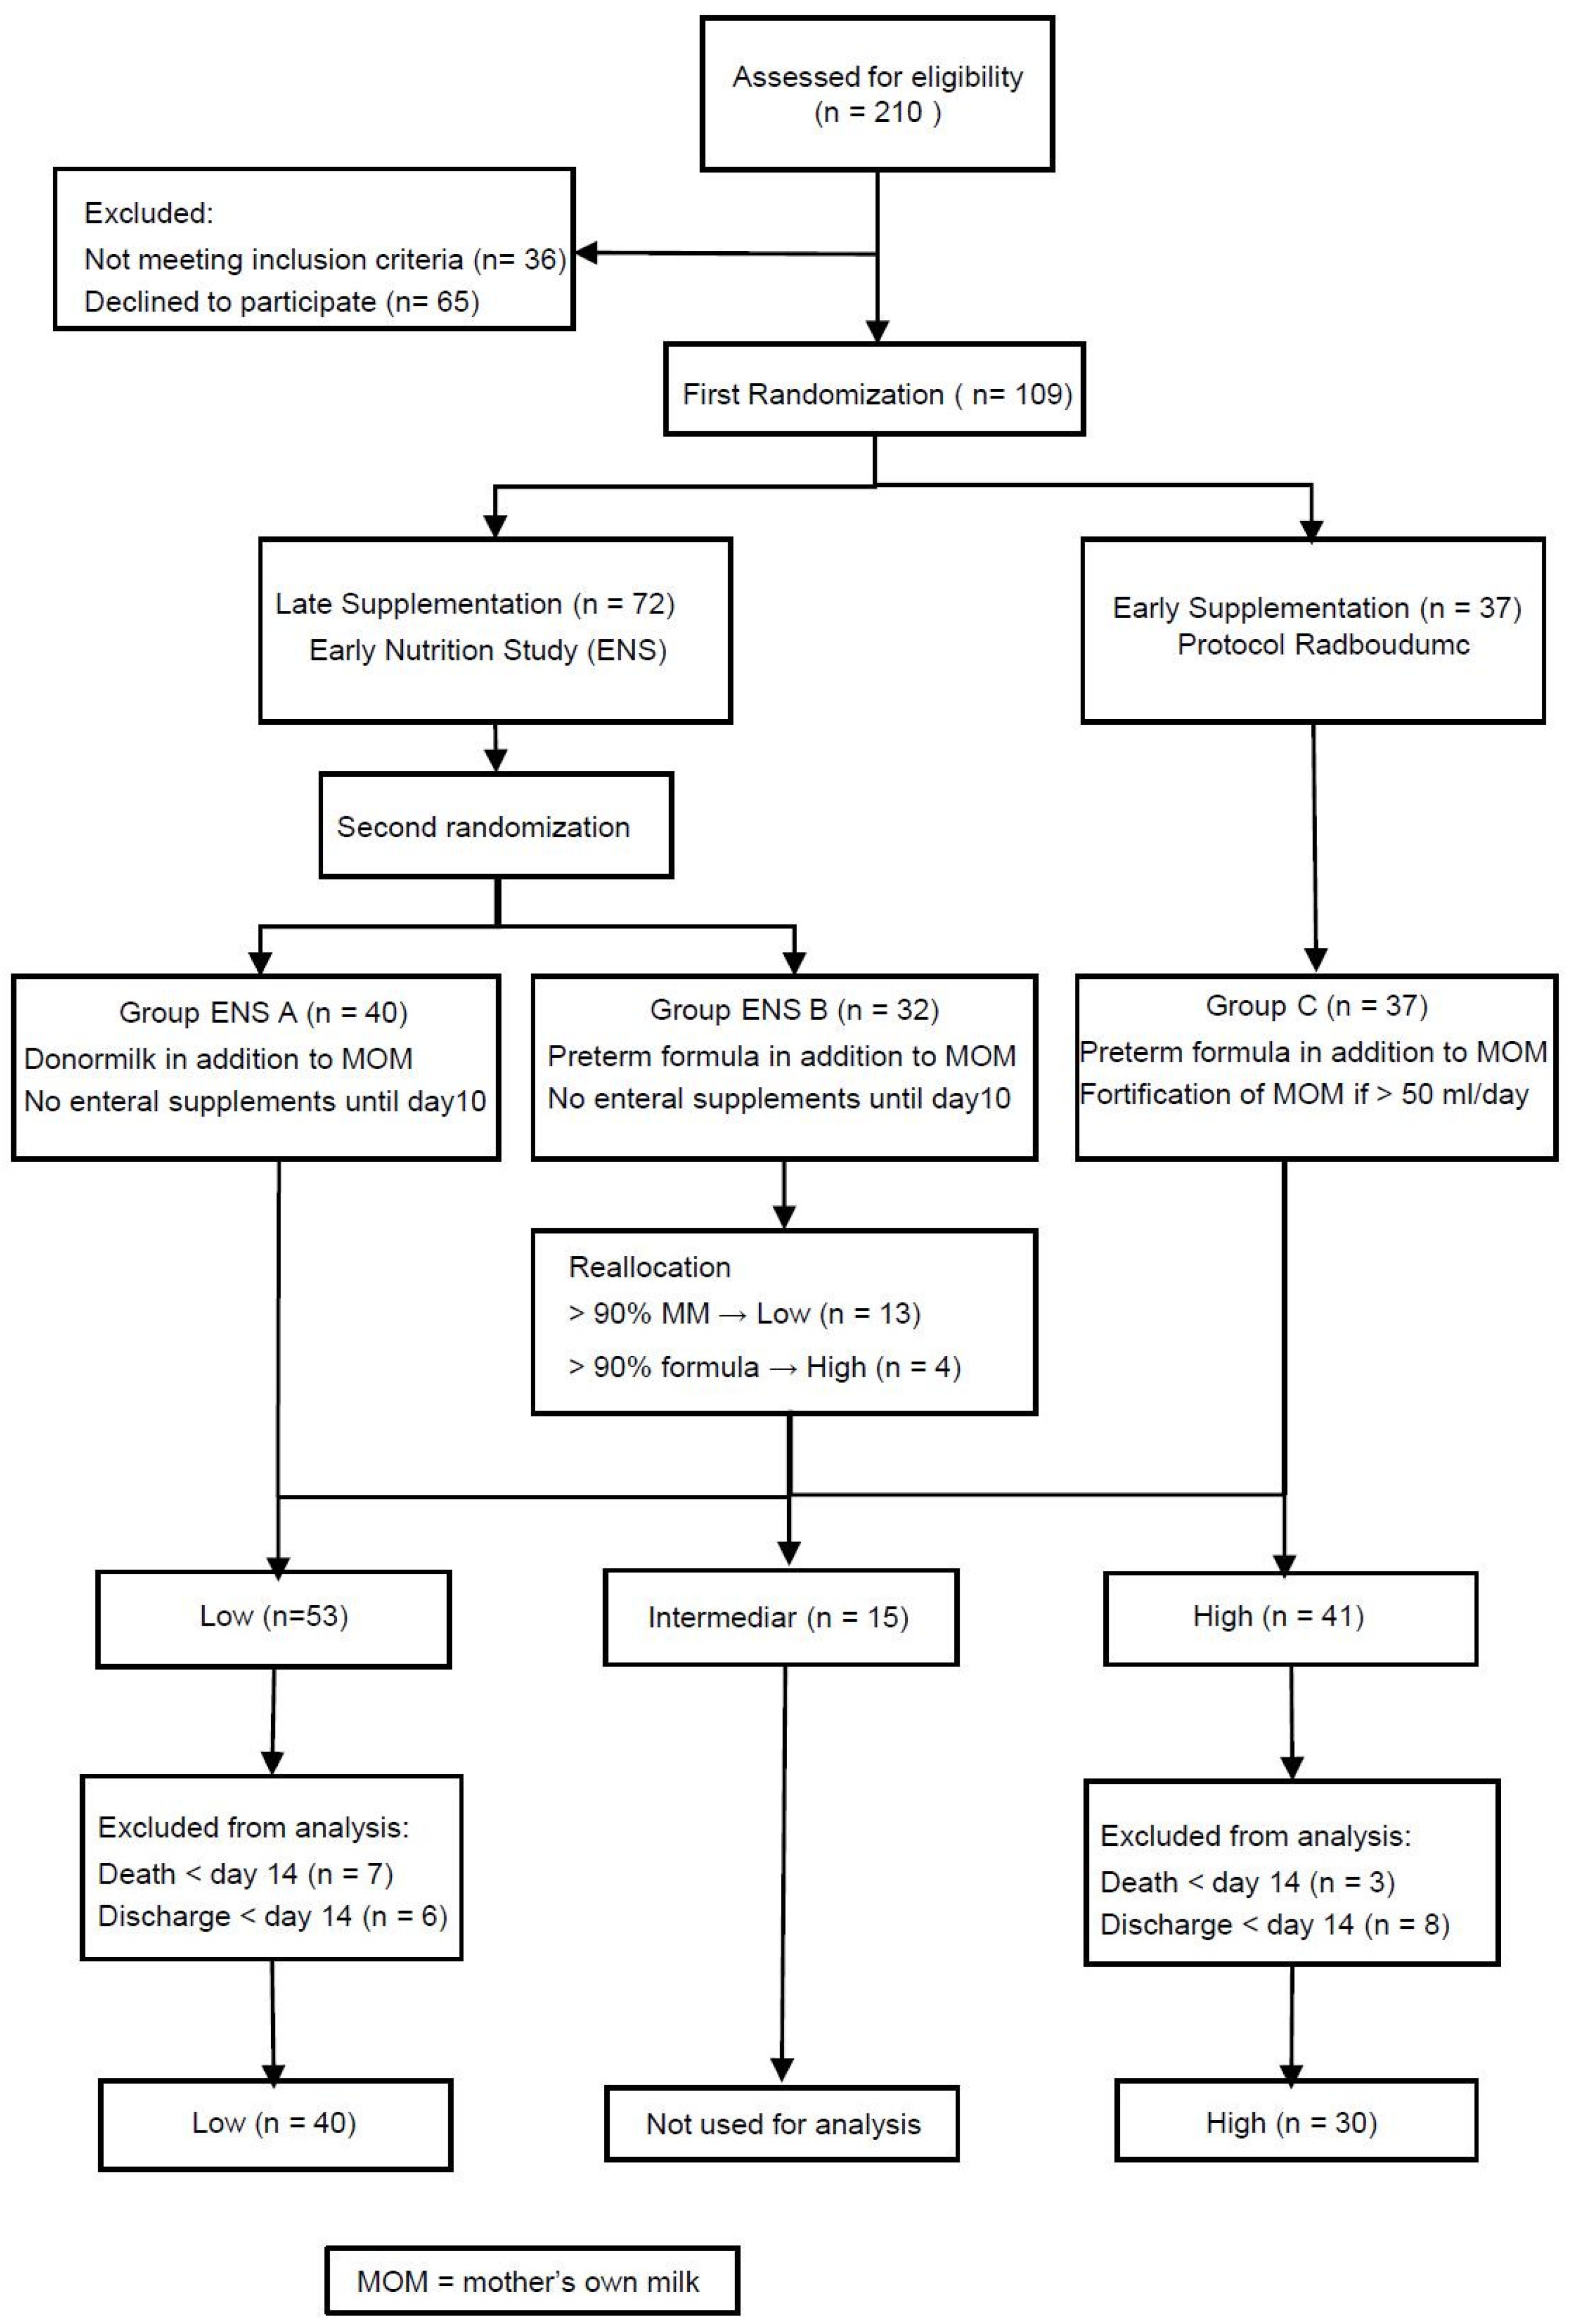
2.1. Study Design and Randomization
2.2. Study Population
2.3. Intervention and Nutritional Protocol
2.4. Biochemical Parameters of Bone Mineralization
2.5. Data Registration and Handling
2.6. Statistical Analysis
3. Results
3.1. Patient Characteristics
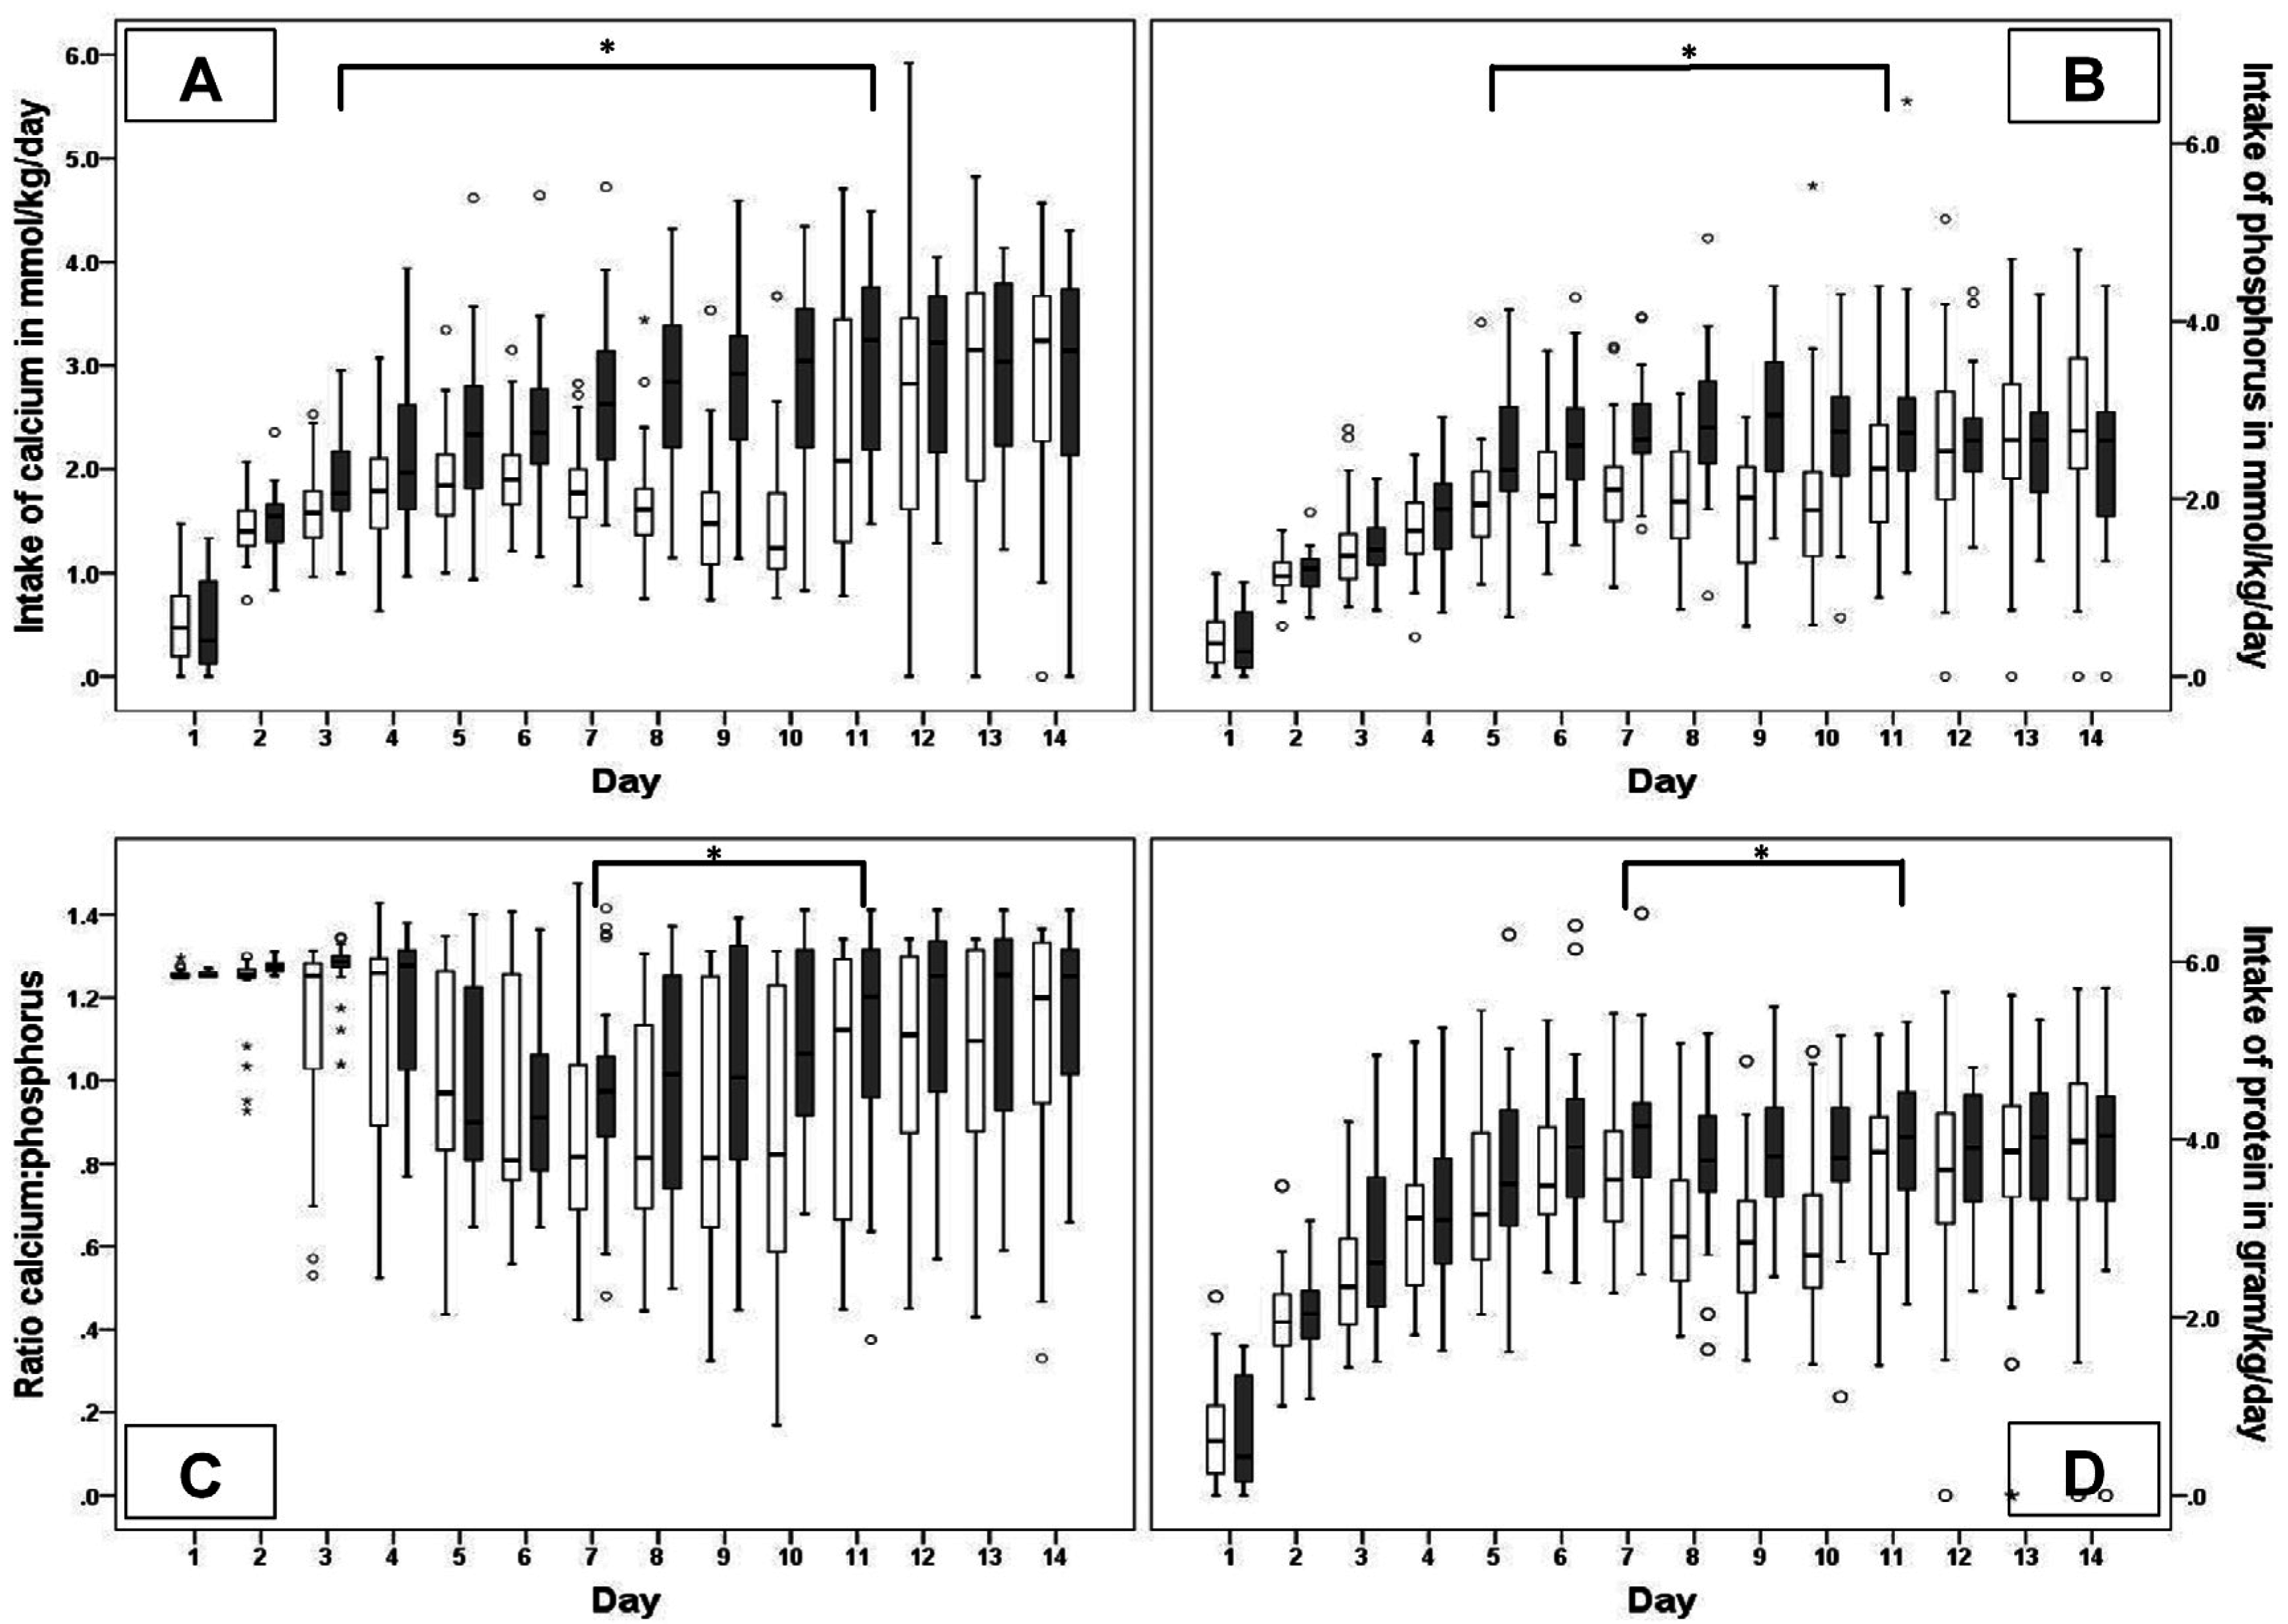
3.2. Nutritional Intake
3.3. Biochemical Parameters
- The sCa concentration was not related to intake of Ca/P and was only marginally affected by a number of co-variables except for daily protein intake that caused an increase of 0.107 mmol/L per gram/kg protein.
- The sP concentration increased in relation to phosphorus intake (0.13 mmol/L per mmol/kg phosphorus) and birth weight (0.0004 mmol/L per gram birth weight), whereas protein intake (−0.13 mmol/L per gram/kg/day protein), gestational age (−0.05 mmol/L per week), furosemide (−0.11 mmol/L per day) and caffeine (−0.02 mmol/L per day) decreased in sP concentration.
- The urinary excretion of Ca seemed to increase in relation to Calcium intake (0.35 mmol/L per mmol/kg calcium), and increased in relation to protein (0.36 mmol/L per gram/kg protein) and being born by cesarean section (0.65 mmol/L if born by cesarean section), whereas it was not affected by the phosphorus intake.
- The urinary excretion of P increased in relation to daily phosphorus intake (3.18 mmol/L per mmol/kg phosphorus) and gender (1.88 mmol/L if infant was a boy), whereas P excretion lowered in relation to daily intake of protein (−1.18 mmol/L per mmol/kg protein), gestational age (−0.71 mmol/L per week) and caffeine (−0.29 mmol/L per day). Calcium intake did not affect the urinary P excretion.
- The TrP increased in relation the daily Calcium intake (3.10% per mmol/kg calcium) and gestational age (3.05% per week). The reabsorption of phosphorus lowered in relation to daily phosphorus intake (−6.21% per mmol/kg phosphorus), gender (−4.60% if infant was a boy), being born by cesarean section (−5.12%), and sepsis (−6.78%).
- The ALP increased in relation protein intake (30.54 U/L per mmol/kg) and daily intake of phosphorus (23.64 U/L per mmol/kg phosphorus). A decrease in ALP was related to calcium intake (−44.94 U/L per mmol/kg calcium), gestational age (−20.71 U/L per week) and the number of days of steroid use (−23.86 U/L per day).
- The uCa/creat ratio increased in relation to daily protein intake (0.54 L/L per gram/day protein) and sepsis (0.66 L/L), but it was not affected by the total calcium and phosphorus intake.
- The uP/creat ratio increased in relation to daily phosphorus intake (4.01 L/L per mmol/kg phosphorus), gender (2.31 L/L if infant was a boy), while the P/creat ratio seemed lower in relation to daily protein intake (−0.81 L/L per gram/kg protein), and decreased with gestational age (−0.94 L/L per week), and caffeine (−0.30 L/L per day).
4. Discussion
5. Conclusions
Acknowledgments
Author Contributions
Conflicts of Interest
Appendix A

| Day 1 | Day 2 | Day 3 | Day 4 | |
|---|---|---|---|---|
| Fluid mL/kg/day | 80 | 100 | 125 | 150 |
| CH grams/kg/day | 8 | 9.6 | 11.7 | 13.8 |
| AA grams/kg/day | 0.75 | 1.5 | 2.25 | 3 |
| Lipids grams/kg/day | 1 | 2 | 3 | 3 |
| EQ Kcal/kg/day | 44 | 62 | 82 | 94 |
| Calcium mmol/kg/day | 0.75 | 1.5 | 2.25 | 3.00 |
| Phosphorus mmol/kg/day | 0.48 | 0.96 | 1.44 | 1.92 |
| Characteristics | Group ENS A (n = 40) | Group ENS B (n = 32) | Group C (n = 37) |
|---|---|---|---|
| GA, weeks; med (IQR) | 28.2 (25.7–30.1) | 28.3 (26.5–30.7) | 27.9 (26.1–29.7) |
| Birth weight, grams; med (IQR) | 967 (753–1245) | 1012 (847–1199) | 1006 (771–1220) |
| SGA; n (%) | 9 (23) | 8 (25) | 6 (16) |
| Male; n (%) | 21 (53) | 20 (63) | 18 (49) |
| Singletons; n (%) | 25 (63) | 24 (74) | 25 (68) |
| Antenatal Steroids compl.; n (%) | 36 (90) | 31 (97) | 31 (86) |
| Cesarean section; n (%) | 19 (48) | 20 (63) | 25 (68) |
| Apgar score (5 min); med (IQR) | 7.5 (6.3–9.0) | 8.0 (7.0–9.0) | 7.0 (7.0–8.0) |
| Apgar score (5 min) <7; n (%) | 10 (25) | 5 (16) | 8 (22) |
| Mortality; n (%) | 6 (15) | 3 (9) | 7 (19) |
| Morbidity | |||
| IRDS | 24 (60) | 19 (59) | 23 (62) |
| Days of MV; med (IQR) | 1.5 (0.0–4.8) | 1.0 (0.0–4.0) | 1.0 (0.0–7.0) |
| Days of N-CPAP; med (IQR) | 18.0 (6.5–38.8) | 28.0 (7.0–40.8) | 16.0 (6.0–36.5) |
| CLD; n (%) | 12 (30) | 14 (44) | 10 (27) |
| PDA; n (%) | 20 (50) | 20 (63) | 21 (57) |
| Ductal ligation; n (%) | 4 (10) | 2 (6.3) | 1 (3) |
| IVH grade ≤ 2; n (%) | 15 (38) | 5 (16) | 5 (14) |
| IVH grade ≥ 3; n (%) | 2 (5) | 7 (21) | 4 (11) |
| Sepsis; n (%) | 13 (33) | 10 (32) | 14 (38) |
| NEC; n (%) | 4 (10) | 5 (16) | 3 (8) |
| Bell stage 2; n | 2 | 3 | 1 |
| Bell stage 3; n | 2 | 2 | 2 |
| Laparotomy; n | 2 | 1 | 2 |
| ROP; n (%) | 4 (10) | 1 (3) | 5 (14) |
| ROP grade ≥ 3 | 1 | 0 | 1 |
| Medication | |||
| Caffeine; n (%) | 38 (95) | 30 (94) | 33 (90) |
| Furosemide; n (%) | 11 (28) | 10 (31) | 7 (19) |
| Diuretics (maintenance); n (%) | 3 (8) | 0 | 3 (8) |
| Corticosteroids; n (%) | 1 (3) | 2 (6) | 4 (11) |
| Sedation; n (%) | 13 (33) | 11 (34) | 15 (41) |
| Nutritional characteristics | |||
| Days of PN; med (IQR) | 10.0 (8.0–13.0) | 10.5 (9.0–14.8) | 10.5 (8.3–21.0) |
| 120 mL/kg enteral, day; med (IQR) | 9.0 (7.0–12.5) | 9.0 (8.0–13.0) | 9.0 (7.2–14.8) |
| 150 mL/kg enteral, day; med (IQR) | 12.0 (9.0–17.0) | 11.0 (10.0–17.0) | 12.0 (10.0–20.0) |
| Start day of BMF; med (IQR) | 11.0 (11.0–12.7) | 12.0 (11.0–14.0) | 6.0 (4.0–8.0) |
| Nutritional Intake (mmol/kg/Week) | Low (n = 40) Median (IQR) | High (n = 30) Median (IQR) | p-Value |
|---|---|---|---|
| Ca (total) W1 | 10.7 (9.9–12.0) | 13.1 (11.1–14.6) | 0.00 |
| Ca (total) W2 | 16.4 (12.9–17.7) | 21.7 (15.3–24.4) | 0.00 |
| Ca (enteral) W1 | 1.7 (1.1–2.2) | 3.3 (1.1–5.7) | 0.00 |
| Ca (enteral) W2 | 10.8 (6.2–16.0) | 17.5 (2.3–22.8) | 0.07 |
| Ca (enteral suppl) W1 | 0.0 (0.0–0.0) | 0.0 (0.0–0.0) | 1.0 |
| Ca (enteral suppl) W2 | 0.0 (0.0–0.0) | 0.0 (0.0–0.0) | 0.22 |
| Ca (PN) W1 | 9.4 (8.0–10.2) | 9.8 (7.9–11.5) | 0.34 |
| Ca (PN) W2 | 3.1 (0.7–7.9) | 5.1 ( 1.9–10.9) | 0.14 |
| Ca (PNsuppl) W1 | 0.0 (0.0–0.0) | 0.0 (0.0–0.0) | 1.0 |
| Ca (PNsuppl) W2 | 0.0 (0.0–0.0) | 0.0 (0.0–0.0) | 0.74 |
| P (total) W1 | 10.8 (9.2–12.4) | 12.3 (11.1–14.2) | 0.00 |
| P (total) W2 | 16.4 (12.9–19.6) | 18.9 (16.0–22.1) | 0.02 |
| P (enteral) W1 | 1.0 (0.6–1.4) | 2.1 (0.7–3.9) | 0.00 |
| P (enteral) W2 | 8.1 (5.0–12.0) | 10.4 (1.7–17.2) | 0.08 |
| P (enteral suppl) W1 | 0.0 (0.0–0.0) | 0.0 (0.0–0.9) | 0.03 |
| P (enteral suppl) W2 | 0.0 (0.0–0.0) | 0.0 (0.0–1.4) | 0.33 |
| P (PN) W1 | 7.5 (6.4–8.2) | 7.8 (6.3–9.2) | 0.34 |
| P (PN) W2 | 2.5 (0.6–6.3) | 4.1 (1.5–8.7) | 0.14 |
| P (PN suppl) W1 | 2.4 (0.5–3.8) | 1.8 (0.0–2.7) | 0.16 |
| P (PN suppl) W2 | 2.3 (0.0–4.2) | 0.7 (0.0–4.3) | 0.30 |
| Day 1 | Day 3 | Day 5 | Day 7 | Day 10 | Day 14 | ||
|---|---|---|---|---|---|---|---|
| Serum Ca (mmol/L) | Low | 2.2 (2.0–2.4) | 2.4(2.2–2.5) | 2.5 (2.4–2.7) | 2.6 (2.4–2.7) | 2.5 (2.4–2.7) | 2.6 (2.4–2.8) |
| High | 2.2 (2.0–2.4) | 2.4 (2.3–2.6) | 2.5 (2.4–2.7) | 2.4 (2.3–2.6) | 2.5 (2.3–2.7) | 2.6 (2.5–2.8) | |
| p-Value | 0.94 | 0.17 | 0.34 | 0.15 | 0.69 | 0.17 | |
| Urine Ca (mmol/L) | Low | 1.3 (1.0–1.9) | 2.1 (1.5–3.4) | 2.6 (2.0–3.9) | 2.7 (1.6–3.8) | 2.0 (1.6–3.3) | 1.8 (1.4–3.5) |
| High | 1.5 (1.2–1.7) | 3.3 (2.0–4.7) | 3.1 (2.3–5.8) | 2.5 (1.8–3.8) | 2.7 (2.0–3.4) | 2.3 (1.6–3.4) | |
| p-Value | 0.66 | 0.03 | 0.06 | 0.84 | 0.21 | 0.50 | |
| Serum P (mmol/L) | Low | 1.8 (1.7–2.2) | 1.8 (1.5–2.0) | 1.7 (1.5–2.0) | 1.9 (1.8–2.2) | 2.0 (1.8–2.2) | 2.3 (2.1–2.4) |
| High | 2.1 (1.8–2.3) | 1.8 (1.5–2.0) | 1.6 (1.3–2.2) | 2.1 (1.8–2.4) | 2.1 (2.0–2.4) | 2.2 (2.0–2.3) | |
| p-Value | 0.22 | 0.88 | 0.71 | 0.21 | 0.08 | 0.16 | |
| Urine P (mmol/L) | Low | 1.7 (0.3–3.8) | 2.1 (0.7–5.5) | 1.3 (0.7–3.5) | 4.1 (0.7–6.8) | 5.4 (2.2–8.2) | 10.4 (6.8–18.4) |
| High | 2.3 (0.2–4.6) | 2.6 (0.9–4.1) | 3.1 (1.6–6.9) | 5.4 (3.5–9.8) | 7.4 (4.5–13.7) | 9.5 (5.5–16.4) | |
| p-Value | 0.68 | 0.98 | 0.04 | 0.02 | 0.04 | 0.46 | |
| Tubular reabsorption of P (%) | Low | 94.0 (76.8–98.2) | 86.5 (76.1–95.3) | 92.2 (83.8–96.9) | 83.1 (72.4–96.3) | 80.8 (68.8–92.7) | 75.9 (64.9–85.2) |
| High | 85.3 (76.4–98.1) | 92.7 (73.3–95.7) | 88.1 (80.8–95.1) | 79.4 (51.9–87.6) | 76.6 (59.1–83.2) | 67.4 (53.9–82.4) | |
| p-Value | 0.59 | 0.62 | 0.21 | 0.08 | 0.23 | 0.36 | |
| Alkaline Phosphatase (U/L) | Low | 167.0 (138.0–236.0) | 213.0 (182.0–291.0) | 263.5 (202.3–368.5) | 329 (261.3–455.0) | 379 (311.0–503.0) | 423.0 (301.8–506.0) |
| High | 203 (146.5–232.8) | 244.0 (174.3–270.8) | 275.5 (206.3–307.0) | 304.5 (249.3–375.0) | 342.0 (213.8–414.3) | 380.0 (281.8–509.8) | |
| p-Value | 0.76 | 0.94 | 0.76 | 0.22 | 0.10 | 0.66 | |
| uCa/Crea ratio (mmol/mmol) | Low | 2.1 (1.3–3.5) | 2.5 (1.8–3.1) | 3.6 (2.3–5.2) | 3.8 (2.3–6.2) | 2.9 (1.8–4.1) | 2.3 (1.6–3.7) |
| High | 1.7 (1.4–3.7) | 2.7 (2.0–6.1) | 4.0 (2.9–6.3) | 3.0 (2.1–5.4) | 3.8 (2.4–5.0) | 3.4 (1.9–4.8) | |
| p-Value | 0.98 | 0.30 | 0.35 | 0.49 | 0.21 | 0.14 | |
| uP/Crea ratio (mmol/mmol) | Low | 1.6 (0.5–5.9) | 2.8 (1.0–6.8) | 1.9 (0.8–5.4) | 5.1 (1.1–9.3) | 7.2 (2.5–12.3) | 11.2 (6.2–18.6) |
| High | 3.8 (0.5–6.7) | 1.8 (1.1–5.8) | 3.5 (1.6–6.1) | 7.7 (5.0–10.9) | 9.4 (7.0–16.5) | 14.5 (9.3–18.7) | |
| p-Value | 0.64 | 0.72 | 0.15 | 0.14 | 0.06 | 0.73 |
References
- Rauch, F.; Schoenau, E. The developing bone: Slave or master of its cells and molecules? Pediatr. Res. 2001, 50, 309–314. [Google Scholar] [CrossRef] [PubMed]
- Greer, F.R. Osteopenia of prematurity. Annu. Rev. Nutr. 1994, 14, 169–185. [Google Scholar] [CrossRef] [PubMed]
- Harrison, C.M.; Johnson, K.; McKechnie, E. Osteopenia of prematurity: A national survey and review of practice. Acta Paediatr. 2008, 97, 407–413. [Google Scholar] [CrossRef] [PubMed]
- Demarini, S. Calcium and phosphorus nutrition in preterm infants. Acta Paediatr. Suppl. 2005, 94, 87–92. [Google Scholar] [CrossRef] [PubMed]
- Kovacs, C.S. Calcium, phosphorus, and bone metabolism in the fetus and newborn. Early Hum. Dev. 2015, 91, 623–628. [Google Scholar] [CrossRef] [PubMed]
- Ribeiro Dde, O.; Lobo, B.W.; Volpato, N.M.; da Veiga, V.F.; Cabral, L.M.; de Sousa, V.P. Influence of the calcium concentration in the presence of organic phosphorus on the physicochemical compatibility and stability of all-in-one admixtures for neonatal use. Nutr. J. 2009, 8, 51. [Google Scholar] [CrossRef] [PubMed]
- Rigo, J.; Pieltain, C.; Salle, B.; Senterre, J. Enteral calcium, phosphate and vitamin d requirements and bone mineralization in preterm infants. Acta Paediatr. 2007, 96, 969–974. [Google Scholar] [CrossRef] [PubMed]
- Carnielli, V.P.; Luijendijk, I.H.; van Goudoever, J.B.; Sulkers, E.J.; Boerlage, A.A.; Degenhart, H.J.; Sauer, P.J. Feeding premature newborn infants palmitic acid in amounts and stereoisomeric position similar to that of human milk: Effects on fat and mineral balance. Am. J. Clin. Nutr. 1995, 61, 1037–1042. [Google Scholar] [PubMed]
- Abrams, S.A.; Hawthorne, K.M.; Placencia, J.L.; Dinh, K.L. Micronutrient requirements of high-risk infants. Clin. Perinatol. 2014, 41, 347–361. [Google Scholar] [CrossRef] [PubMed]
- Schanler, R.J.; Abrams, S.A.; Garza, C. Mineral balance studies in very low birth weight infants fed human milk. J. Pediatr. 1988, 113, 230–238. [Google Scholar] [CrossRef]
- Lapillonne, A.A.; Glorieux, F.H.; Salle, B.L.; Braillon, P.M.; Chambon, M.; Rigo, J.; Putet, G.; Senterre, J. Mineral balance and whole body bone mineral content in very low-birth-weight infants. Acta Paediatr. Suppl. 1994, 405, 117–122. [Google Scholar] [CrossRef] [PubMed]
- Rigo, J.; Senterre, J. Nutritional needs of premature infants: Current issues. J. Pediatr. 2006, 149, S80–S88. [Google Scholar] [CrossRef]
- Bert, S.; Gouyon, J.B.; Semama, D.S. Calcium, sodium and potassium urinary excretion during the first five days of life in very preterm infants. Biol. Neonate 2004, 85, 37–41. [Google Scholar] [CrossRef] [PubMed]
- Catache, M.; Leone, C.R. Role of plasma and urinary calcium and phosphorus measurements in early detection of phosphorus deficiency in very low birthweight infants. Acta Paediatr. 2003, 92, 76–80. [Google Scholar] [CrossRef] [PubMed]
- De Curtis, M.; Rigo, J. Nutrition and kidney in preterm infant. J. Matern. Fetal. Neonatal Med. 2012, 25, 55–59. [Google Scholar] [CrossRef] [PubMed]
- Boehm, G.; Wiener, M.; Schmidt, C.; Ungethum, A.; Ungethum, B.; Moro, G. Usefulness of short-term urine collection in the nutritional monitoring of low birthweight infants. Acta Paediatr. 1998, 87, 339–343. [Google Scholar] [CrossRef] [PubMed]
- Aladangady, N.; Coen, P.G.; White, M.P.; Rae, M.D.; Beattie, T.J. Urinary excretion of calcium and phosphate in preterm infants. Pediatr. Nephrol. 2004, 19, 1225–1231. [Google Scholar] [CrossRef] [PubMed]
- Giapros, V.I.; Papaloukas, A.L.; Andronikou, S.K. Urinary mineral excretion in preterm neonates during the first month of life. Neonatology 2007, 91, 180–185. [Google Scholar] [CrossRef] [PubMed]
- Giles, M.M.; Fenton, M.H.; Shaw, B.; Elton, R.A.; Clarke, M.; Lang, M.; Hume, R. Sequential calcium and phosphorus balance studies in preterm infants. J. Pediatr. 1987, 110, 591–598. [Google Scholar] [CrossRef]
- Hellstern, G.; Poschl, J.; Linderkamp, O. Renal phosphate handling of premature infants of 23–25 weeks gestational age. Pediatr. Nephrol. 2003, 18, 756–758. [Google Scholar] [CrossRef] [PubMed]
- Hillman, L.S.; Rojanasathit, S.; Slatopolsky, E.; Haddad, J.G. Serial measurements of serum calcium, magnesium, parathyroid hormone, calcitonin, and 25-hydroxy-vitamin D in premature and term infants during the first week of life. Pediatr. Res. 1977, 11, 739–744. [Google Scholar] [CrossRef] [PubMed]
- Mihatsch, W.A.; Muche, R.; Pohlandt, F. The renal phosphate threshold decreases with increasing postmenstrual age in very low birth weight infants. Pediatr. Res. 1996, 40, 300–303. [Google Scholar] [CrossRef] [PubMed]
- Pohlandt, F. Prevention of postnatal bone demineralization in very low-birth-weight infants by individually monitored supplementation with calcium and phosphorus. Pediatr. Res. 1994, 35, 125–129. [Google Scholar] [CrossRef] [PubMed]
- Senterre, J.; Salle, B. Renal aspects of calcium and phosphorus metabolism in preterm infants. Biol. Neonate 1988, 53, 220–229. [Google Scholar] [CrossRef] [PubMed]
- Trotter, A.; Stoll, M.; Leititis, J.U.; Blatter, A.; Pohlandt, F. Circadian variations of urinary electrolyte concentrations in preterm and term infants. J. Pediatr. 1996, 128, 253–256. [Google Scholar] [CrossRef]
- Trotter, A.; Pohlandt, F. Calcium and phosphorus retention in extremely preterm infants supplemented individually. Acta Paediatr. 2002, 91, 680–683. [Google Scholar] [CrossRef] [PubMed]
- Abrams, S.A.; Schanler, R.J.; Garza, C. Relation of bone mineralization measures to serum biochemical measures. Am. J. Dis. Child. 1988, 142, 1276–1278. [Google Scholar] [CrossRef] [PubMed]
- Acar, D.B.; Kavuncuoglu, S.; Cetinkaya, M.; Petmezci, E.; Dursun, M.; Korkmaz, O.; Altuncu, E.K. Assessment of the place of tubular reabsorption of phosphorus in the diagnosis of osteopenia of prematurity. Turk Pediatri Ars. 2015, 50, 45–50. [Google Scholar] [CrossRef] [PubMed]
- Visser, F.; Sprij, A.J.; Brus, F. The validity of biochemical markers in metabolic bone disease in preterm infants: A systematic review. Acta Paediatr. 2012, 101, 562–568. [Google Scholar] [CrossRef] [PubMed]
- Tinnion, R.J.; Embleton, N.D. How to use... alkaline phosphatase in neonatology. Arch. Dis. Child. Educ. Pract. Ed. 2012, 97, 157–163. [Google Scholar] [CrossRef] [PubMed]
- Kelly, A.; Kovatch, K.J.; Garber, S.J. Metabolic bone disease screening practices among US Neonatologists. Clin. Pediatr. (Phila.) 2014, 53, 1077–1083. [Google Scholar] [CrossRef] [PubMed]
- Staub, E.; Wiedmer, N.; Staub, L.P.; Nelle, M.; von Vigier, R.O. Monitoring of urinary calcium and phosphorus excretion in preterm infants: Comparison of 2 methods. J. Pediatr. Gastroenterol. Nutr. 2014, 58, 404–408. [Google Scholar] [CrossRef] [PubMed]
- Corpeleijn, W.E.; de Waard, M.; Christmann, V.; van Goudoever, J.B.; Jansen-van der Weide, M.C.; Kooi, E.M.; Koper, J.F.; Kouwenhoven, S.M.; Lafeber, H.N.; Mank, E.; et al. Effect of Donor Milk on Severe Infections and Mortality in Very Low-Birth-Weight Infants: The Early Nutrition Study Randomized Clinical Trial. JAMA Pediatr. 2016, 170, 654–661. [Google Scholar] [CrossRef] [PubMed]
- Gidrewicz, D.A.; Fenton, T.R. A systematic review and meta-analysis of the nutrient content of preterm and term breast milk. BMC Pediatr. 2014, 14, 216. [Google Scholar] [CrossRef] [PubMed]
- Christmann, V.; de Grauw, A.M.; Visser, R.; Matthijsse, R.P.; van Goudoever, J.B.; van Heijst, A.F. Early postnatal calcium and phosphorus metabolism in preterm infants. J. Pediatr. Gastroenterol. Nutr. 2014, 58, 398–403. [Google Scholar] [CrossRef] [PubMed]
- Bell, M.J.; Ternberg, J.L.; Feigin, R.D.; Keating, J.P.; Marshall, R.; Barton, L.; Brotherton, T. Neonatal necrotizing enterocolitis. Therapeutic decisions based upon clinical staging. Ann. Surg. 1978, 187, 1–7. [Google Scholar] [CrossRef] [PubMed]
- Papile, L.A.; Burstein, J.; Burstein, R.; Koffler, H. Incidence and evolution of subependymal and intraventricular hemorrhage: A study of infants with birth weights less than 1500 gm. J. Pediatr. 1978, 92, 529–534. [Google Scholar] [CrossRef]
- Koletzko, B.; Goulet, O.; Hunt, J.; Krohn, K.; Shamir, R.; Parenteral Nutrition Guidelines Working Group; European Society for Clinical Nutrition and Metabolism; European Society of Paediatric Gastroenterology, Hepatology and Nutrition (ESPGHAN); European Society of Paediatric Research. 1. Guidelines on paediatric parenteral nutrition of the European Society of Paediatric Gastroenterology, Hepatology and Nutrition (Espghan) and the European Society for Clinical Nutrition and Metabolism (ESPEN), Supported by the European Society of Paediatric Research (ESPR). J. Pediatr. Gastroenterol. Nutr. 2005, 41, S1–S87. [Google Scholar] [PubMed]
- Agostoni, C.; Buonocore, G.; Carnielli, V.P.; De Curtis, M.; Darmaun, D.; Decsi, T.; Domellof, M.; Embleton, N.D.; Fusch, C.; Genzel-Boroviczeny, O.; et al. Enteral nutrient supply for preterm infants: Commentary from the European Society of Paediatric Gastroenterology, Hepatology and Nutrition Committee on Nutrition. J. Pediatr. Gastroenterol. Nutr. 2010, 50, 85–91. [Google Scholar] [CrossRef] [PubMed]
- Fenton, T.R.; Lyon, A.W.; Rose, M.S. Cord blood calcium, phosphate, magnesium, and alkaline phosphatase gestational age-specific reference intervals for preterm infants. BMC Pediatr. 2011, 11, 76. [Google Scholar] [CrossRef] [PubMed]
- Ehrenkranz, R.A.; Dusick, A.M.; Vohr, B.R.; Wright, L.L.; Wrage, L.A.; Poole, W.K. Growth in the neonatal intensive care unit influences neurodevelopmental and growth outcomes of extremely low birth weight infants. Pediatrics 2006, 117, 1253–1261. [Google Scholar] [CrossRef] [PubMed]
- Klingenberg, C.; Embleton, N.D.; Jacobs, S.E.; O’Connell, L.A.; Kuschel, C.A. Enteral feeding practices in very preterm infants: An international survey. Arch. Dis. Child. Fetal. Neonatal. Ed. 2012, 97, F56–F61. [Google Scholar] [CrossRef] [PubMed]
- Sullivan, S.; Schanler, R.J.; Kim, J.H.; Patel, A.L.; Trawoger, R.; Kiechl-Kohlendorfer, U.; Chan, G.M.; Blanco, C.L.; Abrams, S.; Cotten, C.M.; et al. An exclusively human milk-based diet is associated with a lower rate of necrotizing enterocolitis than a diet of human milk and bovine milk-based products. J. Pediatr. 2010, 156, 562–567; 562.e1–567.e1. [Google Scholar] [CrossRef] [PubMed]
- Cristofalo, E.A.; Schanler, R.J.; Blanco, C.L.; Sullivan, S.; Trawoeger, R.; Kiechl-Kohlendorfer, U.; Dudell, G.; Rechtman, D.J.; Lee, M.L.; Lucas, A.; et al. Randomized trial of exclusive human milk versus preterm formula diets in extremely premature infants. J. Pediatr. 2013, 163, 1592.e1–1595.e1. [Google Scholar] [CrossRef] [PubMed]
- Moltu, S.J.; Strommen, K.; Blakstad, E.W.; Almaas, A.N.; Westerberg, A.C.; Braekke, K.; Ronnestad, A.; Nakstad, B.; Berg, J.P.; Veierod, M.B.; et al. Enhanced feeding in very-low-birth-weight infants may cause electrolyte disturbances and septicemia—A randomized, controlled trial. Clin. Nutr. 2013, 32, 207–212. [Google Scholar] [CrossRef] [PubMed]
- Jamin, A.; D’Inca, R.; Le Floc’h, N.; Kuster, A.; Orsonneau, J.L.; Darmaun, D.; Boudry, G.; Le Huerou-Luron, I.; Seve, B.; Gras-Le Guen, C. Fatal effects of a neonatal high-protein diet in low-birth-weight piglets used as a model of intrauterine growth restriction. Neonatology 2010, 97, 321–328. [Google Scholar] [CrossRef] [PubMed]
- Mehanna, H.M.; Moledina, J.; Travis, J. Refeeding syndrome: What it is, and how to prevent and treat it. BMJ 2008, 336, 1495–1498. [Google Scholar] [CrossRef] [PubMed]
- Walmsley, R.S. Refeeding syndrome: Screening, incidence, and treatment during parenteral nutrition. J. Gastroenterol. Hepatol. 2013, 28, 113–117. [Google Scholar] [CrossRef] [PubMed]
- Ross, J.R.; Finch, C.; Ebeling, M.; Taylor, S.N. Refeeding syndrome in very-low-birth-weight intrauterine growth-restricted neonates. J. Perinatol. 2013, 33, 717–720. [Google Scholar] [CrossRef] [PubMed]
- Bonsante, F.; Iacobelli, S.; Latorre, G.; Rigo, J.; De Felice, C.; Robillard, P.Y.; Gouyon, J.B. Initial amino acid intake influences phosphorus and calcium homeostasis in preterm infants—It is time to change the composition of the early parenteral nutrition. PLoS ONE 2013, 8, e72880. [Google Scholar] [CrossRef] [PubMed]
- Lucas, A.; Brooke, O.G.; Baker, B.A.; Bishop, N.; Morley, R. High alkaline phosphatase activity and growth in preterm neonates. Arch. Dis. Child. 1989, 64, 902–909. [Google Scholar] [CrossRef] [PubMed]
- Peacock, J.L.; Marston, L.; Marlow, N.; Calvert, S.A.; Greenough, A. Neonatal and infant outcome in boys and girls born very prematurely. Pediatr. Res. 2012, 71, 305–310. [Google Scholar] [CrossRef] [PubMed]
- Christmann, V.; Visser, R.; Engelkes, M.; de Grauw, A.; van Goudoever, J.; van Heijst, A. The enigma to achieve normal postnatal growth in preterm infants—Using parenteral or enteral nutrition? Acta Paediatr. 2013, 102, 471–479. [Google Scholar] [CrossRef] [PubMed]
- Fenton, T.R.; Kim, J.H. A systematic review and meta-analysis to revise the Fenton growth chart for preterm infants. BMC Pediatr. 2013, 13, 59. [Google Scholar] [CrossRef] [PubMed]
| Low (n = 40) | High (n = 30) | p-Value | |
|---|---|---|---|
| Characteristics | |||
| Birth weight, grams; median (IQR) | 948 (772–1225) | 939 (776–1163) | 0.85 |
| <1000 gram, n (%) | 22 (55.0) | 16 (53.3) | 0.89 |
| Gestational age, median (IQR) | 28.2 (26.5–29.6) | 27.8 (26.1–29.4) | 0.76 |
| SGA, n (%) | 8 (20.0) | 4 (13.3) | 0.46 |
| Male, n (%) | 19 (47.5) | 15 (50.0) | 0.84 |
| Singletons, n (%) | 28 (70.0) | 16 (53.3) | 0.15 |
| Cesarean section, n (%) | 18 (45.0) | 20 (66.7) | 0.07 |
| Apgar score (5 min), median (IQR) | 7.0 (6.3–9.0) | 7.5 (7.0–8.0) | 0.71 |
| Apgar score (5 min) <7, n (%) | 10 (25.0%) | 6 (20.0%) | 0.62 |
| Morbidity | |||
| Sepsis, n (%) | 8 (20.0%) | 9 (30.0%) | 0.33 |
| NEC ≥ stage 2, n (%) | 1 (2.5%) | 2 (6.7%) | 0.39 |
| IVH Grade 3–4 n (%) | 5 (12.5) | 3 (10) | 0.75 |
| Medication | |||
| Caffeïne; n (%) | 39 (97.5%) | 28 (93.3%) | 0.39 |
| Furosemide, n (%) | 3 (7.5%) | 4 (13.3%) | 0.42 |
| Corticosteroids | 3 (7.5) | 1 (3.3) | 0.46 |
| Sedation, n (%) | 8 (20.0%) | 9 (30.0%) | 0.33 |
| Nutritional characteristics | |||
| PN, days, median (IQR) | 11.0 (9.0–14.0) | 12.0 (10.0–14.0) | 0.10 |
| 150 mL/kg enteral, study day, median (IQR) | 12.0 (9.8–17.0) | 13.0 (10.5–20.0) | 0.59 |
| Start day of BMF, median (IQR) | 11 (11.0–13.0) | 7.9 (5.0–10.0) | 0.00 |
| Human milk in mL/kg/day *, median (IQR) | 50.9 (24.0–82.2) | 30.0 (8.5–54.6) | 0.01 |
| Formula in mL/kg/day *, median (IQR) | 0.0 (0.0–0.2) | 1.1 (0.1–7.3) | 0.00 |
| Nutritional intake | |||
| Ca (total) W1, mmol/kg; median (IQR) | 10.7 (9.9–12.0) | 13.1 (11.1–14.6) | 0.00 |
| Ca (total) W2, mmol/kg; median (IQR) | 16.4 (12.9–17.7) | 21.7 (15.3–24.4) | 0.00 |
| P (total) W1, mmol/kg; median (IQR) | 10.8 (9.3–12.4 | 12.3 (11.1–14.2) | 0.00 |
| P (total) W2, mmol/kg; median (IQR) | 16.4 (12.9–19.6) | 18.2 (16.0–22.1) | 0.02 |
| Prot (total) W1, grams/kg; median (IQR) | 18.6 (15.9–21.1) | 20.0 (16.9–23.4) | 0.16 |
| Prot (total) W2, grams/kg; median (IQR) | 23.2 (21.0–26.6) | 27.0 (24.1–30.6) | 0.00 |
| Dependant Variable | Covariates | Estimate | 95% CI | p-Value |
|---|---|---|---|---|
| Serum Calcium | Total intake of Ca (mmol/kg/day) | 0.004 | −0.046–0.054 | 0.89 |
| Total intake of P (mmol/kg/day) | −0.036 | −0.073–0.002 | 0.06 | |
| Enteral intake of P (%) | 0.001 | −0.000–0.001 | 0.06 | |
| Intake of protein (grams/kg /day) | 0.107 | 0.075–0.139 | 0.00 | |
| Gestational age (weeks) | 0.027 | 0.013–0.042 | 0.00 | |
| Singleton (yes) | 0.081 | 0.021–0.140 | 0.01 | |
| Sepsis (yes) | −0.092 | −0.167–−0.019 | 0.02 | |
| Sedation (days) | −0.007 | −0.016–0.001 | 0.07 | |
| Serum Phosphorus | Total intake of Ca (mmol/kg/day) | 0.0345 | −0.0473–0.1164 | 0.41 |
| Total intake of P (mmol/kg/day) | 0.1252 | 0.0586–0.1918 | 0.00 | |
| Enteral intake of Ca (%) | 0.0035 | 0.0023–0.0048 | 0.00 | |
| Intake of protein (grams/kg/day) | −0.1274 | −0.1825–−0.0723 | 0.00 | |
| Birth weight (grams) | 0.0004 | 0.0002–0.0006 | 0.00 | |
| Gestational age (weeks) | −0.0479 | −0.0701–−0.0258 | 0.00 | |
| Gender (boy) | −0.0698 | −0.1493–0.096 | 0.08 | |
| Caffeine (days) | −0.0215 | −0.0354–−0.0075 | 0.00 | |
| Furosemide (days) | −0.1116 | −0.2029–−0.0203 | 0.02 | |
| Urine Calcium | Total intake of Ca (mmol/kg/day) | 0.35 | 0.01–0.70 | 0.05 |
| Total intake of P (mmol/kg/day) | −0.01 | −0.29–0.27 | 0.94 | |
| Enteral intake of Ca (%) | −0.02 | −0.02–−0.01 | 0.00 | |
| Intake of protein (grams/kg/day) | 0.36 | 0.12–0.61 | 0.00 | |
| Cesarean section (yes) | 0.65 | 0.32–0.98 | 0.00 | |
| Urine Phosphorus | Total intake of Ca (mmol/kg/day) | −0.05 | −1.56–1.45 | 0.94 |
| Total intake of P (mmol/kg/day) | 3.18 | 2.06–4.30 | 0.00 | |
| Enteral intake of P (%) | 0.07 | 0.04–0.09 | 0.00 | |
| Intake of protein (grams/kg/day) | −1.18 | −2.20–−0.16 | 0.02 | |
| Gestational age (weeks) | −0.71 | −1.09–−0.33 | 0.00 | |
| Gender (boy) | 1.88 | 0.26–3.50 | 0.02 | |
| Caffeine (days) | −0.29 | −0.54–−0.01 | 0.04 | |
| Tubular reabsorption of P | Total intake of Ca (mmol/kg/day) | 3.10 | 0.160–6.04 | 0.04 |
| Total intake of P (mmol/kg/day) | −6.21 | −8.78–−3.65 | 0.00 | |
| Enteral intake of P (%) | −0.09 | −0.15–−0.03 | 0.01 | |
| Gestational age (weeks) | 3.05 | 1.92–4.17 | 0.00 | |
| Gender (boy) | −4.60 | −9.22–0.01 | 0.05 | |
| Cesarean section (yes) | −5.12 | −9.95–−0.29 | 0.04 | |
| Sepsis (yes) | −6.78 | −12.72–−0.85 | 0.03 | |
| Furosemide (days) | 4.75 | −0.53–10.03 | 0.07 | |
| Alkaline Phosphatase | Total intake of Ca (mmol/kg/day) | −44.94 | −69.51–−20.37 | 0.00 |
| Total intake of P (mmol/kg/day) | 23.64 | 4.14–43.14 | 0.02 | |
| Enteral intake of Ca (%) | 2.07 | 1.69–2.45 | 0.00 | |
| Intake of protein (grams/kg/day) | 30.54 | 14.08–47.01 | 0.00 | |
| Gestational age (weeks) | −20.71 | −30.37–−11.05 | 0.00 | |
| Postnatal steroids (days) | −23.86 | −44.29–−3.43 | 0.02 | |
| Urine Ca/Crea ratio | Total intake of Ca (mmol/kg/day) | 0.138 | −0.292–0.568 | 0.53 |
| Total intake of P (mmol/kg/day) | 0.139 | −0.204–0.481 | 0.43 | |
| Enteral intake of Ca (%) | −0.023 | −0.029–−0.016 | 0.00 | |
| Intake of protein (grams/kg/day) | 0.497 | 0.206–0.787 | 0.01 | |
| Sepsis (yes) | 0.584 | 0.003–1.166 | 0.05 | |
| Urine P/Crea ratio | Total intake of Ca (mmol/kg/day) | −1.10 | −2.51–0.31 | 0.12 |
| Total intake of P (mmol/kg/day) | 4.01 | 2.97–5.05 | 0.00 | |
| Enteral intake of P (%) | 0.06 | 0.04–0.08 | 0.00 | |
| Intake of protein (grams/kg/day) | −0.81 | −1.76–0.14 | 0.10 | |
| Gestational age (weeks) | −0.94 | −1.32–−0.55 | 0.00 | |
| Gender (boy) | 2.31 | 0.72–3.89 | 0.01 | |
| Sepsis (yes) | 1.72 | −0.24–3.68 | 0.09 | |
| Caffeine (days) | −0.30 | −0.56–−0.03 | 0.03 |
© 2016 by the authors; licensee MDPI, Basel, Switzerland. This article is an open access article distributed under the terms and conditions of the Creative Commons Attribution (CC-BY) license (http://creativecommons.org/licenses/by/4.0/).
Share and Cite
Christmann, V.; Gradussen, C.J.W.; Körnmann, M.N.; Roeleveld, N.; Van Goudoever, J.B.; Van Heijst, A.F.J. Changes in Biochemical Parameters of the Calcium-Phosphorus Homeostasis in Relation to Nutritional Intake in Very-Low-Birth-Weight Infants. Nutrients 2016, 8, 764. https://doi.org/10.3390/nu8120764
Christmann V, Gradussen CJW, Körnmann MN, Roeleveld N, Van Goudoever JB, Van Heijst AFJ. Changes in Biochemical Parameters of the Calcium-Phosphorus Homeostasis in Relation to Nutritional Intake in Very-Low-Birth-Weight Infants. Nutrients. 2016; 8(12):764. https://doi.org/10.3390/nu8120764
Chicago/Turabian StyleChristmann, Viola, Charlotte J. W. Gradussen, Michelle N. Körnmann, Nel Roeleveld, Johannes B. Van Goudoever, and Arno F. J. Van Heijst. 2016. "Changes in Biochemical Parameters of the Calcium-Phosphorus Homeostasis in Relation to Nutritional Intake in Very-Low-Birth-Weight Infants" Nutrients 8, no. 12: 764. https://doi.org/10.3390/nu8120764
APA StyleChristmann, V., Gradussen, C. J. W., Körnmann, M. N., Roeleveld, N., Van Goudoever, J. B., & Van Heijst, A. F. J. (2016). Changes in Biochemical Parameters of the Calcium-Phosphorus Homeostasis in Relation to Nutritional Intake in Very-Low-Birth-Weight Infants. Nutrients, 8(12), 764. https://doi.org/10.3390/nu8120764