Effect of 12 Weeks High Oleic Peanut Consumption on Cardio-Metabolic Risk Factors and Body Composition


 , ,
, , 
Abstract
:1. Introduction
2. Subjects and Methods
2.1. Subjects
2.2. Study Protocol
2.3. Test Product

| Nutrient | Amount Per 100 g * | Nutrient | Amount Per 100 g |
|---|---|---|---|
| Energy (kJ) | 2376 | Fibre (g) | 8.5 |
| MUFA (oleic) (g) | 38 | Vitamin E (mg) | 8.3 |
| PUFA (linoleic) (g) | 2 | Folate (μg) | 240 |
| SFA (palmitic) (g) | 3 | Magnesium (mg) | 168 |
| Protein (g) | 26 | Potassium (mg) | 705 |
| Arginine (g) | 3 | Iron (mg) | 4.6 |
| Resveratrol (mg) | 0.2 | Zinc (mg) | 3.3 |
2.4. Anthropometric Measures
2.5. Body Composition
2.6. Blood Sampling
2.7. Nutrient Intake and Physical Activity Measurements
2.8. Statistical Analysis
3. Results
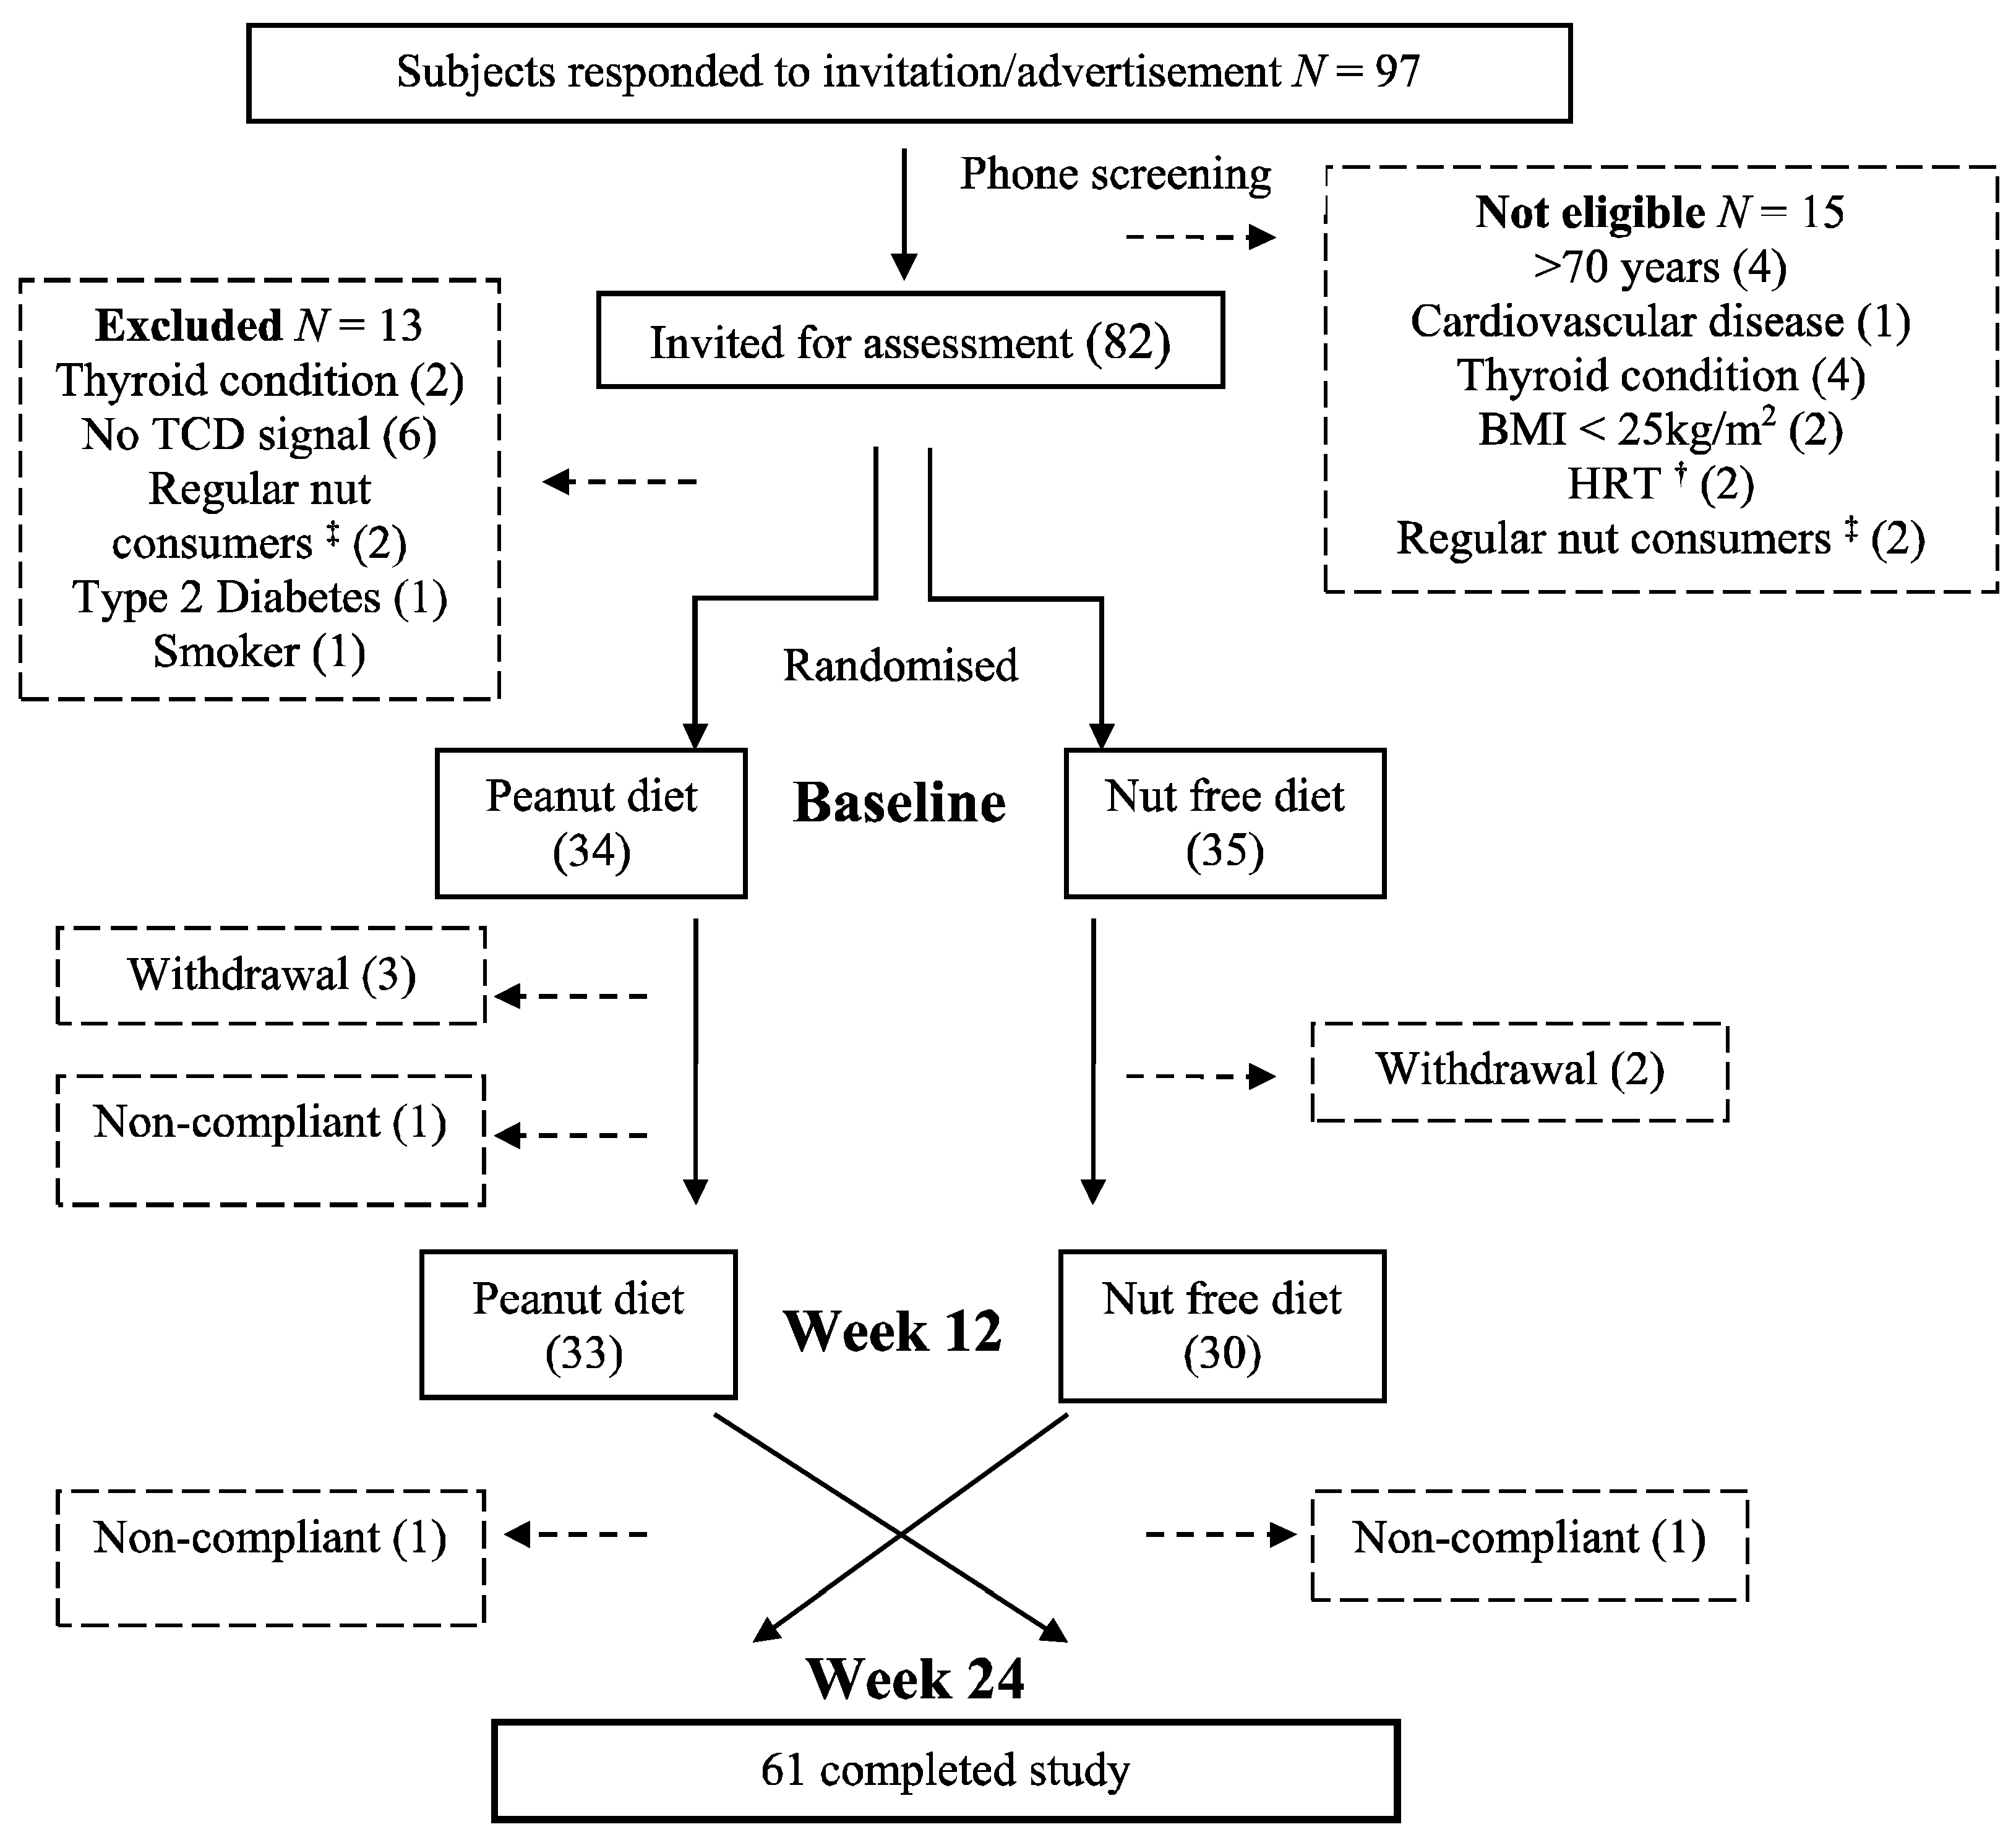
3.1. Subjects
3.2. Nutrient Intake and Energy Balance
3.3. Anthropometric Measures and Body Composition
| Nutrient Intake | Baseline (SD) | Peanut Diet (SD) | Control Diet (SD) | Difference Peanut-Control (SEM) | p Value |
|---|---|---|---|---|---|
| Protein (g) | 95.8 (31.1) | 104.2 (27.4) | 95.2 (25.9) | 8.9 (2.7) | 0.005 |
| Carbohydrate (g) | 221.2 (61.9) | 202.0 (47.5) | 206.4 (52.7) | −4.3 (4.7) | 0.630 |
| Total fat (g) | 68.3 (23.4) | 93.4 (20.7) | 71.0 (20.7) | 22.7 (2.4) | <0.001 |
| MUFA (g) | 25.6 (8.3) | 47.5 (11.3) | 25.2 (7.7) | 22.3 (1.2) | <0.001 |
| PUFA (g) | 10.1 (4.1) | 11.2 (3.3) | 9.8 (3.3) | 1.5 (0.4) | <0.001 |
| SFA (g) | 26.8 (8.4) | 31.8 (8.7) | 29.6 (9.7) | 2.2 (0.9) | 0.141 |
| Alcohol (g) | 7.5 (7.1) | 8.6 (8.9) | 9.6 (10.1) | −1.1 (14.4) | 0.454 |
| Fibre (g) | 27.2 (7.9) | 27.0 (6.9) | 23.4 (7.0) | 3.5 (0.6) | <0.001 |
| Baseline (SD) | 6 Week Peanut (SD) | 6 Week Control (SD) | Peanut-Control (SEM) | p Value | 12 Week Peanut (SD) | 12 Week Control (SD) | Peanut-Control (SEM) | p Value | |
|---|---|---|---|---|---|---|---|---|---|
| Daily energy intake (kJ) | 8253 (2061) | 9004 (2117) | 8262 (1925) | 1137 (317) | <0.001 | 9227 (1800) | 8292 (1828) | 617 (371) | <0.001 |
| Daily PA energy expenditure (kJ) | 3801 (807) | 3628 (640) | 3877 (1128) | −411 (261) | 0.520 | 3879 (965) | 3689 (698) | −79 (232) | 0.940 |
| Body mass per kJ consumed (g/kJ) | 11.4 (4.2) | 10.3 (2.6) | 11.3 (3.2) | −1.0 (0.3) | <0.001 | 9.7 (1.9) | 11.0 (2.5) | −1.3 (0.3) | <0.001 |
| Body mass (kg) | 87.7 (14.1) | 88.4 (14.1) | 88.0 (14.2) | 0.4 (0.2) | 0.010 | 88.3 (14.3) | 87.8 (14.5) | 0.5 (0.2) | 0.010 |
| Waist circumference (cm) | 100.0 (11.0) | 100.3 (11.2) | 100.2 (12.0) | −0.5 (0.3) | 0.590 | 99.8 (11.4) | 99.5 (11.9) | 0.3 (0.3) | 0.780 |
| BMI (kg/m2) | 30.6 (4.1) | 30.9 (4.2) | 30.7 (4.1) | 0.1 (0.1) | 0.050 | 30.9 (4.2) | 30.6 (4.2) | 0.2 (0.1) | 0.742 |
| % body fat | - | - | - | - | - | 38.9 (9.1) | 38.4 (9.3) | 0.3 (0.2) | 0.144 |
| Non bone lean mass (g) | - | - | - | - | - | 49174 (1344) | 49268 (1392) | −97.1 (160.2) | 0.611 |
| Bone mineral content (g) | - | - | - | - | - | 2999 (668) | 2998 (658) | 1.1 (10.3) | 0.856 |
3.4. Fasting Blood Glucose, Insulin, Lipids and C-Reactive Protein
| Measure | Baseline (SD) | 12 Weeks Peanuts (SD) | 12 Weeks Control (SD) | Difference Peanut-Control (SEM) | p Value |
|---|---|---|---|---|---|
| Total chol. (mmol/L) | 5.1 (0.8) | 5.2 (0.8) | 5.1 (0.8) | 0.0 (0.1) | 0.662 |
| LDL-C (mmol/L) | 3.3 (0.7) | 3.6 (0.8) | 3.5 (0.8) | 0.0 (0.1) | 0.421 |
| HDL-C (mmol/L) | 1.4 (0.3) | 1.4 (0.3) | 1.4 (0.4) | 0.0 (0.0) | 0.190 |
| Triglyceride (mmol/L) | 1.2 (0.6) | 1.2 (0.7) | 1.3 (0.6) | −0.1 (0.1) | 0.129 |
| LDL/HDL | 2.6 (0.2) | 2.6 (0.2) | 2.6 (0.2) | 0.0 (0.0) | 0.819 |
| C-reactive protein (mg/L) | 1.8 (2.2) | 2.1 (1.7) | 2.3 (1.9) | −0.3 (0.2) | 0.620 |
| Glucose (mmol/L) | 5.5 (0.7) | 5.5 (0.6) | 5.5 (0.5) | 0.0 (0.1) | 0.614 |
| Insulin (mU/L) | 7.9 (4.5) | 7.8 (5.4) | 7.9 (5.1) | −0.1 (0.5) | 0.412 |
| HOMA IR | 1.1 (0.6) | 1.1 (0.7) | 1.1 (0.6) | 0.1 (0.1) | 0.769 |
| HOMA IS | 114.3 (54.5) | 124.2 (58.1) | 119.9 (56.3) | 7.3 (9.0) | 0.701 |
| β cell | 83.0 (31.7) | 80.2 (30.4) | 80.4 (32.1) | 1.3 (3.9) | 0.900 |
4. Discussion
5. Conclusions
Acknowledgments
Author Contributions
Conflicts of Interest
References
- Souza, R.; Gomes, A.; Naves, M.; Mota, J. Nuts and legume seeds for cardiovascular risk reduction: Scientific evidence and mechanisms of action. Nutr. Rev. 2015, 73, 335–347. [Google Scholar] [CrossRef] [PubMed]
- Barbour, J.A.; Howe, P.R.C.; Buckley, J.D.; Wright, G.C.; Bryan, J.; Coates, A.M. Lower energy intake following consumption of Hi-oleic and regular peanuts compared with iso-energetic consumption of potato crisps. Appetite 2014, 82, 124–130. [Google Scholar] [CrossRef] [PubMed]
- Kendall, C.W.C.; Josse, A.R.; Esfahani, A.; Jenkins, D.J.A. Nuts, metabolic syndrome and diabetes. Br. J. Nutr. 2010, 104, 465–473. [Google Scholar] [CrossRef] [PubMed]
- Biesalski, H. Polyphenols and inflammation: Basic interactions. Curr. Opin. Clin. Nutr. Metab. Care 2007, 10, 724–728. [Google Scholar] [CrossRef] [PubMed]
- Singh, U.; Devaraj, S.; Jialal, I. Vitamin E, oxidative stress, and inflammation. Ann. Rev. Nutr. 2005, 25, 151–174. [Google Scholar] [CrossRef] [PubMed]
- Peanut Company of Australia. Available online: http://www.pca.com.au/nutritional-value-of-peanuts.php (accessed on 1 August 2015).
- Derbyshire, E.J. A review of the nutritional composition, organoleptic characteristics and biological effects of the high oleic peanuts. Int. J. Food Sci. Nutr. 2014, 65, 781–790. [Google Scholar] [CrossRef] [PubMed]
- Mattes, R.D.; Kris-Etherton, P.; Foster, G.D. Impact of peanuts and tree nuts on body weight and healthy weight loss in adults. J. Nutr. 2008, 138, 1741S–1745S. [Google Scholar] [PubMed]
- Karen Jaceldo-Siegl, K.; Haddad, H.; Oda, K.; Fraser, G.E.; Sabaté, J. Tree nuts are inversely associated with metabolic syndrome and obesity: The Adventist health study-2. PLoS ONE 2014, 9, e85133. [Google Scholar] [CrossRef] [PubMed]
- Ellsworth, J.; Kushi, L.; Folsom, A. Frequent nut intake and risk of death from coronary heart disease and all causes in postmenopausal women: The Iowa womens health study. Nutr. Metab. Cardiovasc. 2001, 11, 327–377. [Google Scholar]
- Djousse’, L.; Rudich, T.; Gaziano, M. Nut consumption and risk of hypertension in US male physicians. Clin. Nutr. 2008, 28, 10–14. [Google Scholar] [CrossRef] [PubMed]
- Bes-Rastrollo, M.; Sabaté, J.; Gómez-Gracia, E.; Alonso, A.; Martínez, J.; Martínez-González, M. Nut consumption and weight gain in a Mediterranean cohort: The SUN study. Obesity 2007, 15, 107. [Google Scholar] [CrossRef] [PubMed]
- Bes-Rastrollo, M.; Wedick, N.M.; Martinez-Gonzalez, M.A.; Li, T.Y.; Sampson, L.; Hu, F.B. Prospective study of nut consumption, long-term weight change, and obesity risk in women. Am. J. Clin. Nutr. 2009, 89, 1913–1919. [Google Scholar] [CrossRef] [PubMed]
- Flores-Mateo, G.; Rojas-Rueda, D.; Basora, J.; Ros, E.; Salas-Salvadó, J. Nut intake and adiposity: Meta-analysis of clinical trials. Am. J. Clin. Nutr. 2013, 97, 1346–1357. [Google Scholar] [CrossRef] [PubMed]
- Alper, C.; Mattes, R. Effects of chronic peanut consumption on body weight and lipid levels in humans. FASEB J. 2001, 15, A601. [Google Scholar]
- O’Byrne, D.J.; Knauft, D.A.; Shireman, R.B. Low fat-monounsaturated rich diets containing high-oleic peanuts improve serum lipoprotein profiles. Lipids 1997, 32, 687–695. [Google Scholar] [CrossRef] [PubMed]
- Novotny, J.; Gebauer, S.; Baer, D.J. Discrepancy between the Atwater factor predicted and empirically measured energy values of almonds in human diets. Am. J. Clin. Nutr. 2012, 96, 296–301. [Google Scholar] [CrossRef] [PubMed]
- Jiang, R.; Liu, S.; Manson, J.; Hu, F.; Willett, W.; Stampfer, M. Nut and peanut butter consumption and risk of type 2 diabetes in women. J. Am. Med. Assoc. 2002, 288, 2554–2560. [Google Scholar] [CrossRef]
- Nettleton, J.; Schulze, M.; Jiang, R.; Jenny, N.; Burke, G.; Jacobs, J.D. A priori-defined dietary patterns and markers of cardiovascular disease risk in the multi-ethnic study of atherosclerosis (MESA). Am. J. Clin. Nutr. 2008, 88, 185–194. [Google Scholar] [PubMed]
- Pan, A.; Sun, Q.; Manson, J.E.; Willett, W.; Hu, F.B. Walnut consumption is associated with lower risk of type 2 diabetes in women. J. Nutr. 2013, 143, 512–518. [Google Scholar] [CrossRef] [PubMed]
- Adamsson, V.; Reumark, A.; Fredriksson, I.; Hammarström, E.; Vessby, B.; Johansson, G.; Risérus, U. Effects of a healthy Nordic diet on cardiovascular risk factors in hypercholesterolaemic subjects: A randomized controlled trial (NORDIET). J. Int. Med. 2011, 269, 150–159. [Google Scholar] [CrossRef] [PubMed]
- Sari, I.; Baltaci, Y.; Bagci, C.; Davutoglu, V.; Erel, O.; Celik, H.; Ozer, O.; Aksoy, M.; Aksoy, N. Effect of pistachio diet on lipid parameters, endothelial function, inflammation, and oxidative status: A prospective study. Nutr. J. 2010, 26, 399–404. [Google Scholar] [CrossRef] [PubMed]
- Barbour, J.A.; Howe, P.R.C.; Buckley, J.D.; Bryan, J.; Coates, A.M. Nut consumption for vascular health and cognitive function. Nutr. Res. Rev. 2014, 27, 131–158. [Google Scholar]
- Mena, M.P.; Casas, R.; Lamuela-Raventós, R.; Masanes, F.; Ros, E.; Estruch, R.; Sacanella, E.; Vazquez-Agell, M.; Morales, M.; Fitó, M.; et al. Inhibition of circulating immune cell activation: A molecular antiinflammatory effect of the Mediterranean diet. Am. J. Clin. Nutr. 2009, 89, 248–256. [Google Scholar] [CrossRef] [PubMed]
- Solà, R.; Domenech, G.; Torres, F.; Masana, L.; Anglés, N.; Reguant, J.; Ramírez, B.; Barriach, J.; Valls, R.; Godàs, G.; et al. Cocoa, hazelnuts, sterols and soluble fiber cream reduces lipids and inflammation biomarkers in hypertensive patients: A randomized controlled trial. PLoS ONE 2012, 7, e31103–e31109. [Google Scholar] [CrossRef] [PubMed]
- Esposito, K.; Giugliano, G.; Giugliano, F.; Ciotola, M.; Giugliano, D.; D’Andrea, F.; D’Armiento, M.; Marfella, R.; di Palo, C. Effect of a Mediterranean-style diet on endothelial dysfunction and markers of vascular inflammation in the metabolic syndrome: A randomized trial. J. Am. Med. Assoc. 2004, 292, 1440–1446. [Google Scholar] [CrossRef] [PubMed]
- Estruch, R.; Vinyoles, E.; Arós, F.; Conde, M.; Lahoz, C.; Lapetra, J.; Sáez, G.; Ros, E.; Martínez-González, M.; Corella, D.; et al. Effects of a Mediterranean-style diet on cardiovascular risk factors: A randomized trial. Ann. Int. Med. 2006, 145, 1–11. [Google Scholar] [CrossRef] [PubMed]
- Mukuddem-Petersen, J.; Oosthuizen, W.; Jerling, J. A systematic review of the effects of nuts on blood lipid profiles in humans. J. Nutr. 2005, 135, 2082–2089. [Google Scholar] [PubMed]
- Griel, A.; Kris-Etherton, P. Tree nuts and the lipid profile: A review of clinical studies. Br. J. Nutr. 2006, 96, S68–S78. [Google Scholar] [CrossRef] [PubMed]
- Good, D.; Lavie, C.; Ventura, H. Dietary intake of nuts and cardiovascular prognosis. Ochsner. J. 2009, 9, 32–36. [Google Scholar] [PubMed]
- Sabate, J.; Oda, K.; Ros, E. Nut consumption and blood lipid levels a pooled analysis of 25 intervention trials. Arch. Int. Med. 2010, 170, 821–827. [Google Scholar] [CrossRef] [PubMed]
- Banel, D.; Hu, F. Effects of walnut consumption on blood lipids and other cardiovascular risk factors: A meta-analysis and systematic review. Am. J. Clin. Nutr. 2009, 90, 56–63. [Google Scholar] [CrossRef] [PubMed]
- Pelkman, C.; Fishell, V.; Maddox, D.; Pearson, T.; Mauger, D.; Kris-Etherton, P. Effects of moderate-fat (from monounsaturated fat) and low-fat weight-loss diets on the serum lipid profile in overweight and obese men and women. Am. J. Clin. Nutr. 2004, 79, 204–208. [Google Scholar] [PubMed]
- Stunkard, A.; Messick, S. The three-factor eating questionnaire to measure dietary restraint, disinhibition and hunger. J. Psychosom. Res. 1985, 29, 71–83. [Google Scholar] [CrossRef]
- Barbour, J.A.; Howe, P.R.C.; Buckley, J.D.; Bryan, J.; Coates, A.M. (University of South Australia, Adelaide, South Australia, Australia). Unpublished work. 2015. [Google Scholar]
- Bouchard, C.; Tremblay, A.; Leblanc, C.; Lortie, G.; Savard, R.; Thériault, G. A method to assess energy expenditure in children and adults. Am. J. Clin. Nutr. 1983, 37, 461–467. [Google Scholar] [PubMed]
- Keogh, J.; Brinkworth, G.; Noakes, M.; Belobrajdic, D.; Buckley, J.; Clifton, P. Effects of weight loss from a very-low-carbohydrate diet on endothelial function and markers of cardiovascular disease risk in subjects with abdominal obesity. Am. J. Clin. Nutr. 2008, 87, 567–576. [Google Scholar] [PubMed]
- HOMA Calculator. Available online: https://www.dtu.ox.ac.uk/homacalculator/ (accessed on 24 March 2014).
- Friedewald, W.; Levy, R.; Fredrickson, D. Estimation of the concentration of low-density lipoprotein cholesterol in plasma, without use of the preparative ultracentrifuge. Clin. Chem. 1972, 18, 499–504. [Google Scholar] [PubMed]
- Alper, C.; Mattes, R. Effects of chronic peanut consumption on energy balance and hedonics. Int. J. Obes. Relat. Metab. Disord. 2002, 26, 1129–1137. [Google Scholar] [CrossRef] [PubMed]
- Traoret, C.; Lokko, P.; Cruz, A.; Oliveira, C.; Costa, N.; Bressan, J.; Alfenas, R.; Mattes, R. Peanut digestion and energy balance. Int. J. Obes. 2008, 32, 322–328. [Google Scholar] [CrossRef] [PubMed]
- Cassady, B.A.; Hollis, J.H.; Fulford, A.D.; Considine, R.V.; Mattes, R.D. Mastication of almonds: Effects of lipid bioaccessibility, appetite, and hormone response. Am. J. Clin. Nutr. 2009, 89, 794–800. [Google Scholar] [CrossRef] [PubMed]
- Hermsdorff, H.; Volp, A.; Bressan, J. Macronutrient profile affects diet-induced thermogenesis and energy intake. Arch. Lat. Am. Nutr. 2007, 57, 33–42. [Google Scholar]
- Jones, P.J.; Pencharz, P.B.; Clandinin, M.T. Whole body oxidation of dietary fatty acids: Implications for energy utilization. Am. J. Clin. Nutr. 1985, 42, 769–777. [Google Scholar] [PubMed]
- Alves, R.; Moreira, A.; Macedo, V.; de Cássia, G.; Bressan, J.; Mattes, R.; Costa, N. High-oleic peanuts increase diet-induced thermogenesis in overweight and obese men. Obesity 2014, 22, 1422–1429. [Google Scholar] [CrossRef] [PubMed]
- Moussavi, N.; Gavino, V.; Receveur, O. Could the quality of dietary fat, and not just its quantity, be related to risk of obesity? Obesity Res. 2008, 16, 7–15. [Google Scholar] [CrossRef] [PubMed]
- Field, A.; Willett, W.; Lissner, L.; Colditz, G.A. Dietary fat and weight gain among women in the nurses’ health study. Obesity 2007, 15, 967–976. [Google Scholar] [CrossRef] [PubMed]
- Gillingham, L.; Harris-Janz, S.; Jones, P. Dietary monounsaturated fatty acids are protective against metabolic syndrome and cardiovascular disease risk factors. Lipids 2011, 46, 209–228. [Google Scholar] [CrossRef] [PubMed]
- Bergouignan, A.; Momkena, I.; Schoeller, D.; Simon, C.; Blanc, S. This high MUFA oxidation favour lipid oxidation and according to the oxidative balance concept reduces the risk of obesity. Prog. Lipid Res. 2009, 48, 128–147. [Google Scholar] [CrossRef] [PubMed]
- Lefevre, M.; Champagne, C.; Tulley, R.; Rood, J.; Most, M. Individual variability in cardiovascular disease risk factor responses to low-fat and low-saturated-fat diets in men: Body mass index, adiposity, and insulin resistance predict changes in ldl cholesterol. Am. J. Clin. Nutr. 2005, 82, 957–963. [Google Scholar] [PubMed]
- Mukuddem-Petersen, J.; Stonehouse-Oosthuizen, W.; Jerling, J.; Hanekom, S.; White, Z. Effects of a high walnut and high cashew nut diet on selected markers of the metabolic syndrome: A controlled feeding trial. Br. J. Nutr. 2007, 97, 1144–1153. [Google Scholar] [CrossRef] [PubMed]
- Lovejoy, J.; Most, M.; Lefevre, M.; Greenway, F.; Rood, J. Effect of diets enriched in almonds on insulin action and serum lipids in adults with normal glucose tolerance or type 2 diabetes. Am. J. Clin. Nutr. 2002, 76, 1000–1006. [Google Scholar] [PubMed]
- Jenkins, D.; Srichaikul, K.; Banach, M.; Josse, R.; Mitchell, S.; Parker, T.; Ireland, C.; de Souza, R.; Vidgen, E.; Kendall, C.; et al. Nuts as a replacement for carbohydrates in the diabetic diet. Diabetes Care 2011, 34, 1706–1711. [Google Scholar] [CrossRef] [PubMed]
- Llorente-Cortés, V.; Estruch, R.; Mena, M.; Ros, E.; González, M.; Fitó, M.; Lamuela-Raventós, R.; Badimon, L. Effect of Mediterranean diet on the expression of pro-atherogenic genes in a population at high cardiovascular risk. Atherosclerosis 2010, 208, 442–450. [Google Scholar] [CrossRef] [PubMed]
- Hongyu, W.; Chen, X.; Tang, L.; Feng, Y.; Zhou, H.; Chen, X.; Li, H.; Demark-Wahnefried, W.; Hu, F.; Lin, X.; et al. Lifestyle counseling and supplementation with flaxseed or walnuts influence the management of metabolic syndrome. J. Nutr. 2010, 140, 1937–1942. [Google Scholar]
- Tapsell, L.; Gillen, L.; Patch, C.; Batterham, M.; Owen, A.; Baré, M.; Kennedy, M. Including walnuts in a low-fat/modified-fat diet improves HDL cholesterol-to-total cholesterol ratios in patients with type 2 diabetes. Diabetes Care 2004, 27, 2777–2783. [Google Scholar] [CrossRef] [PubMed]
- Ma, Y.; Njike, V.; Millet, J.; Dutta, S.; Doughty, K.; Treu, J.; Katz, D. Effects of walnut consumption on endothelial function in type 2 diabetic subjects: A randomized controlled crossover trial. Diabetes Care 2010, 33, 227–232. [Google Scholar] [CrossRef] [PubMed]
- Mercanligil, S.; Arslan, P.; Alasalvar, C.; Okut, E.; Akgül, E.; Pinar, A.; Geyik, P.O.; Tokgözoğlu, L.; Shahidi, F. Effects of hazelnut-enriched diet on plasma cholesterol and lipoprotein profiles in hypercholesterolemic adult men. Eur. J. Clin. Nutr. 2007, 61, 212–220. [Google Scholar] [CrossRef] [PubMed]
- Thomazella, M.; Góes, M.; Andrade, C.; Debbas, V.; Barbeiro, D.; Correia, R.; Marie, S.; Cardounel, A.; daLuz, P.; Laurindo, F. Effects of high adherence to Mediterranean or low-fat diets in medicated secondary prevention patients. Am. J. Cardiol. 2011, 108, 1523–1529. [Google Scholar] [CrossRef] [PubMed]
- Wien, M.; Kandeel, F.; Sabate, J.; Cole, S.; Ikle, D. Effects of almonds vs. complex carbohydrates on metabolic syndrome and anthropometric parameters during weight reduction. Diabetes 2003, 52, A395–A399. [Google Scholar]
- Zaveri, S.; Drummond, S. The effect of including a conventional snack (cereal bar) and a nonconventional snack (almonds) on hunger, eating frequency, dietary intake and body weight. J. Hum. Nutr. Diet. 2009, 22, 461–468. [Google Scholar] [CrossRef] [PubMed]
- Casas-Agustench, P.; López-Uriarte, P.; Bulló, M.; Ros, E.; Cabré-Vila, J.; Salas-Salvadó, J. Effects of one serving of mixed nuts on serum lipids, insulin resistance and inflammatory markers in patients with the metabolic syndrome. Nutr. Metab. Cardiovasc. Dis. 2011, 21, 126–135. [Google Scholar] [CrossRef] [PubMed]
- Wien, M.; Bleich, D.; Raghuwanshi, M.; Gould-Forgerite, S.; Gomes, J.; Monahan-Couch, L.; Oda, K. Almond consumption and cardiovascular risk factors in adults with prediabetes. J. Am. Coll. Nutr. 2010, 29, 189–197. [Google Scholar] [CrossRef] [PubMed]
- Pérez-Jiménez, F.; López-Miranda, J.; Pinillos, M.; Gómez, P.; Paz-Rojas, E.; Montilla, P.; Marín, C.; Velasco, M.; Blanco-Molina, A.; Jiménez Perepérez, J.; et al. A Mediterranean and a high-carbohydrate diet improve glucose metabolism in healthy young persons. Diabetologia 2001, 44, 2038–2043. [Google Scholar] [CrossRef] [PubMed]
- López, S.; Bermúdez, B.; Pacheco, Y.; Villar, J.; Abia, R.; Muriana, F. Distinctive postprandial modulation of beta cell function and insulin sensitivity by dietary fats: Monounsaturated compared with saturated fatty acids. Am. J. Clin. Nutr. 2008, 88, 638–644. [Google Scholar] [PubMed]
- Vessby, B.; Uusitupa, M.; Hermansen, K.; Riccardi, G.; Rivellese, A.; Tapsell, L.; Nälsén, C.; Berglund, L.; Louheranta, A.; Rasmussen, B.; et al. Substituting dietary saturated for monounsaturated fat impairs insulin sensitivity in healthy men and women: The Kanwu study. Diabetologia 2001, 44, 312–319. [Google Scholar] [CrossRef] [PubMed]
- Due, A.; Larsen, T.; Hermansen, K.; Stender, S.; Holst, J.; Toubro, S.; Martinussen, T.; Astrup, A. Comparison of the effects on insulin resistance and glucose tolerance of 6-mo high-monounsaturated-fat, low-fat, and control diets. Am. J. Clin. Nutr. 2008, 87, 855–862. [Google Scholar] [PubMed]
- Shah, M.; Adams-Huet, B.; Brinkley, L.; Grundy, S.; Garg, A. Lipid, glycemic, and insulin responses to meals rich in saturated, cis-monounsaturated, and polyunsaturated (n-3 and n-6) fatty acids in subjects with type 2 diabetes. Diabetes Care 2007, 30, 2993–2998. [Google Scholar] [CrossRef] [PubMed]
- Paniagua, J.; de la Sacristana, A.; Sánchez, E.; Romero, I.; Vidal-Puig, A.; Berral, F.; Escribano, A.; Moyano, M.; Peréz-Martinez, P.; López-Miranda, J.; et al. A MUFA-rich diet improves posprandial glucose, lipid and GLP-1 responses in insulin-resistant subjects. J. Am. Coll. Nutr. 2007, 26, 434–444. [Google Scholar] [CrossRef] [PubMed]
- Tey, S.L.; Gray, A.R.; Chisholm, A.W.; Delahunty, C.M.; Brown, R.C. The dose of hazelnuts influences acceptance and diet quality but not inflammatory markers and body composition in overweight and obese individuals. J. Nutr. 2013, 8, 1254–1262. [Google Scholar] [CrossRef] [PubMed]
- Pai, J.; Pischon, T.; Ma, J.; Manson, J.; Hankinson, S.; Joshipura, K.; Curhan, G.; Rifai, N.; Cannuscio, C.; Stampfer, M.; et al. Inflammatory markers and the risk of coronary heart disease in men and women. N. Engl. J. Med. 2004, 351, 2599–2610. [Google Scholar] [CrossRef] [PubMed]
- Mathieu, P.; Lemieux, I.; Després, J. Obesity, inflammation, and cardiovascular risk. Clin. Pharmacol. Ther. 2010, 87, 407–416. [Google Scholar] [CrossRef] [PubMed]
- Ros, E.; Núñez, I.; Pérez-Heras, A.; Serra, M.; Gilabert, R.; Casals, E.; Deulofeu, R. A walnut diet improves endothelial function in hypercholesterolemic subjects: A randomized crossover trial. Circulation 2004, 109, 1609–1614. [Google Scholar] [CrossRef] [PubMed]
- Wong, R.; Berry, N.M.; Buckley, J.D.; Coates, A.; Howe, P.R.C. Regular consumption of a wild green oat extract enhances systemic and cerebral vasodilator function. Hypertension 2012, 60, 498–499. [Google Scholar]
- Australian Bureau of Statistics. Australian Health Survey: Nutrition First Results—Foods and Nutrients 2011-12. Available online: http://www.abs.gov.au/AUSSTATS/abs@.nsf/DetailsPage/4364.0.55.0072011–12 (accessed on 14 October 2014).
- Kris-Etherton, P.; Zhao, G.; Binkoski, A.; Coval, S.; Etherton, T.D. The effects of nuts on coronary heart disease risk. Nutr. Rev. 2001, 59, 103–111. [Google Scholar] [CrossRef] [PubMed]
© 2015 by the authors; licensee MDPI, Basel, Switzerland. This article is an open access article distributed under the terms and conditions of the Creative Commons Attribution license (http://creativecommons.org/licenses/by/4.0/).
Share and Cite
Barbour, J.A.; Howe, P.R.C.; Buckley, J.D.; Bryan, J.; Coates, A.M. Effect of 12 Weeks High Oleic Peanut Consumption on Cardio-Metabolic Risk Factors and Body Composition. Nutrients 2015, 7, 7381-7398. https://doi.org/10.3390/nu7095343
Barbour JA, Howe PRC, Buckley JD, Bryan J, Coates AM. Effect of 12 Weeks High Oleic Peanut Consumption on Cardio-Metabolic Risk Factors and Body Composition. Nutrients. 2015; 7(9):7381-7398. https://doi.org/10.3390/nu7095343
Chicago/Turabian StyleBarbour, Jayne A., Peter R. C. Howe, Jonathan D. Buckley, Janet Bryan, and Alison M. Coates. 2015. "Effect of 12 Weeks High Oleic Peanut Consumption on Cardio-Metabolic Risk Factors and Body Composition" Nutrients 7, no. 9: 7381-7398. https://doi.org/10.3390/nu7095343
APA StyleBarbour, J. A., Howe, P. R. C., Buckley, J. D., Bryan, J., & Coates, A. M. (2015). Effect of 12 Weeks High Oleic Peanut Consumption on Cardio-Metabolic Risk Factors and Body Composition. Nutrients, 7(9), 7381-7398. https://doi.org/10.3390/nu7095343