A Protein Extract from Chicken Reduces Plasma Homocysteine in Rats

Abstract
:1. Introduction
2. Materials and Methods
2.1. Animals and Diets

| Amino Acid (mg/kg) | Control | 20% CP |
|---|---|---|
| Ala | 6.37 | 11.79 |
| Arg | 5.77 | 9.98 |
| Asx | 15.87 | 11.58 |
| Glx | 49.44 | 22.11 |
| Gly | 3.65 | 22.67 |
| His | 5.39 | 3.20 |
| Hyp | 0 | 11.86 |
| Ile | 11.20 | 4.11 |
| Leu | 19.65 | 8.49 |
| Lys | 17.15 | 7.69 |
| Met | 5.73 | 2.60 |
| Phe | 10.32 | 5.01 |
| Pro | 23.46 | 15.04 |
| Ser | 11.07 | 5.68 |
| Tau | 0.01 | 0.64 |
| Thr | 9.15 | 4.71 |
| Tyr | 8.24 | 2.34 |
| Val | 13.47 | 5.41 |
2.2. Biochemical Analyses
2.3. Gene Expression Analysis
2.4. Statistical Analysis
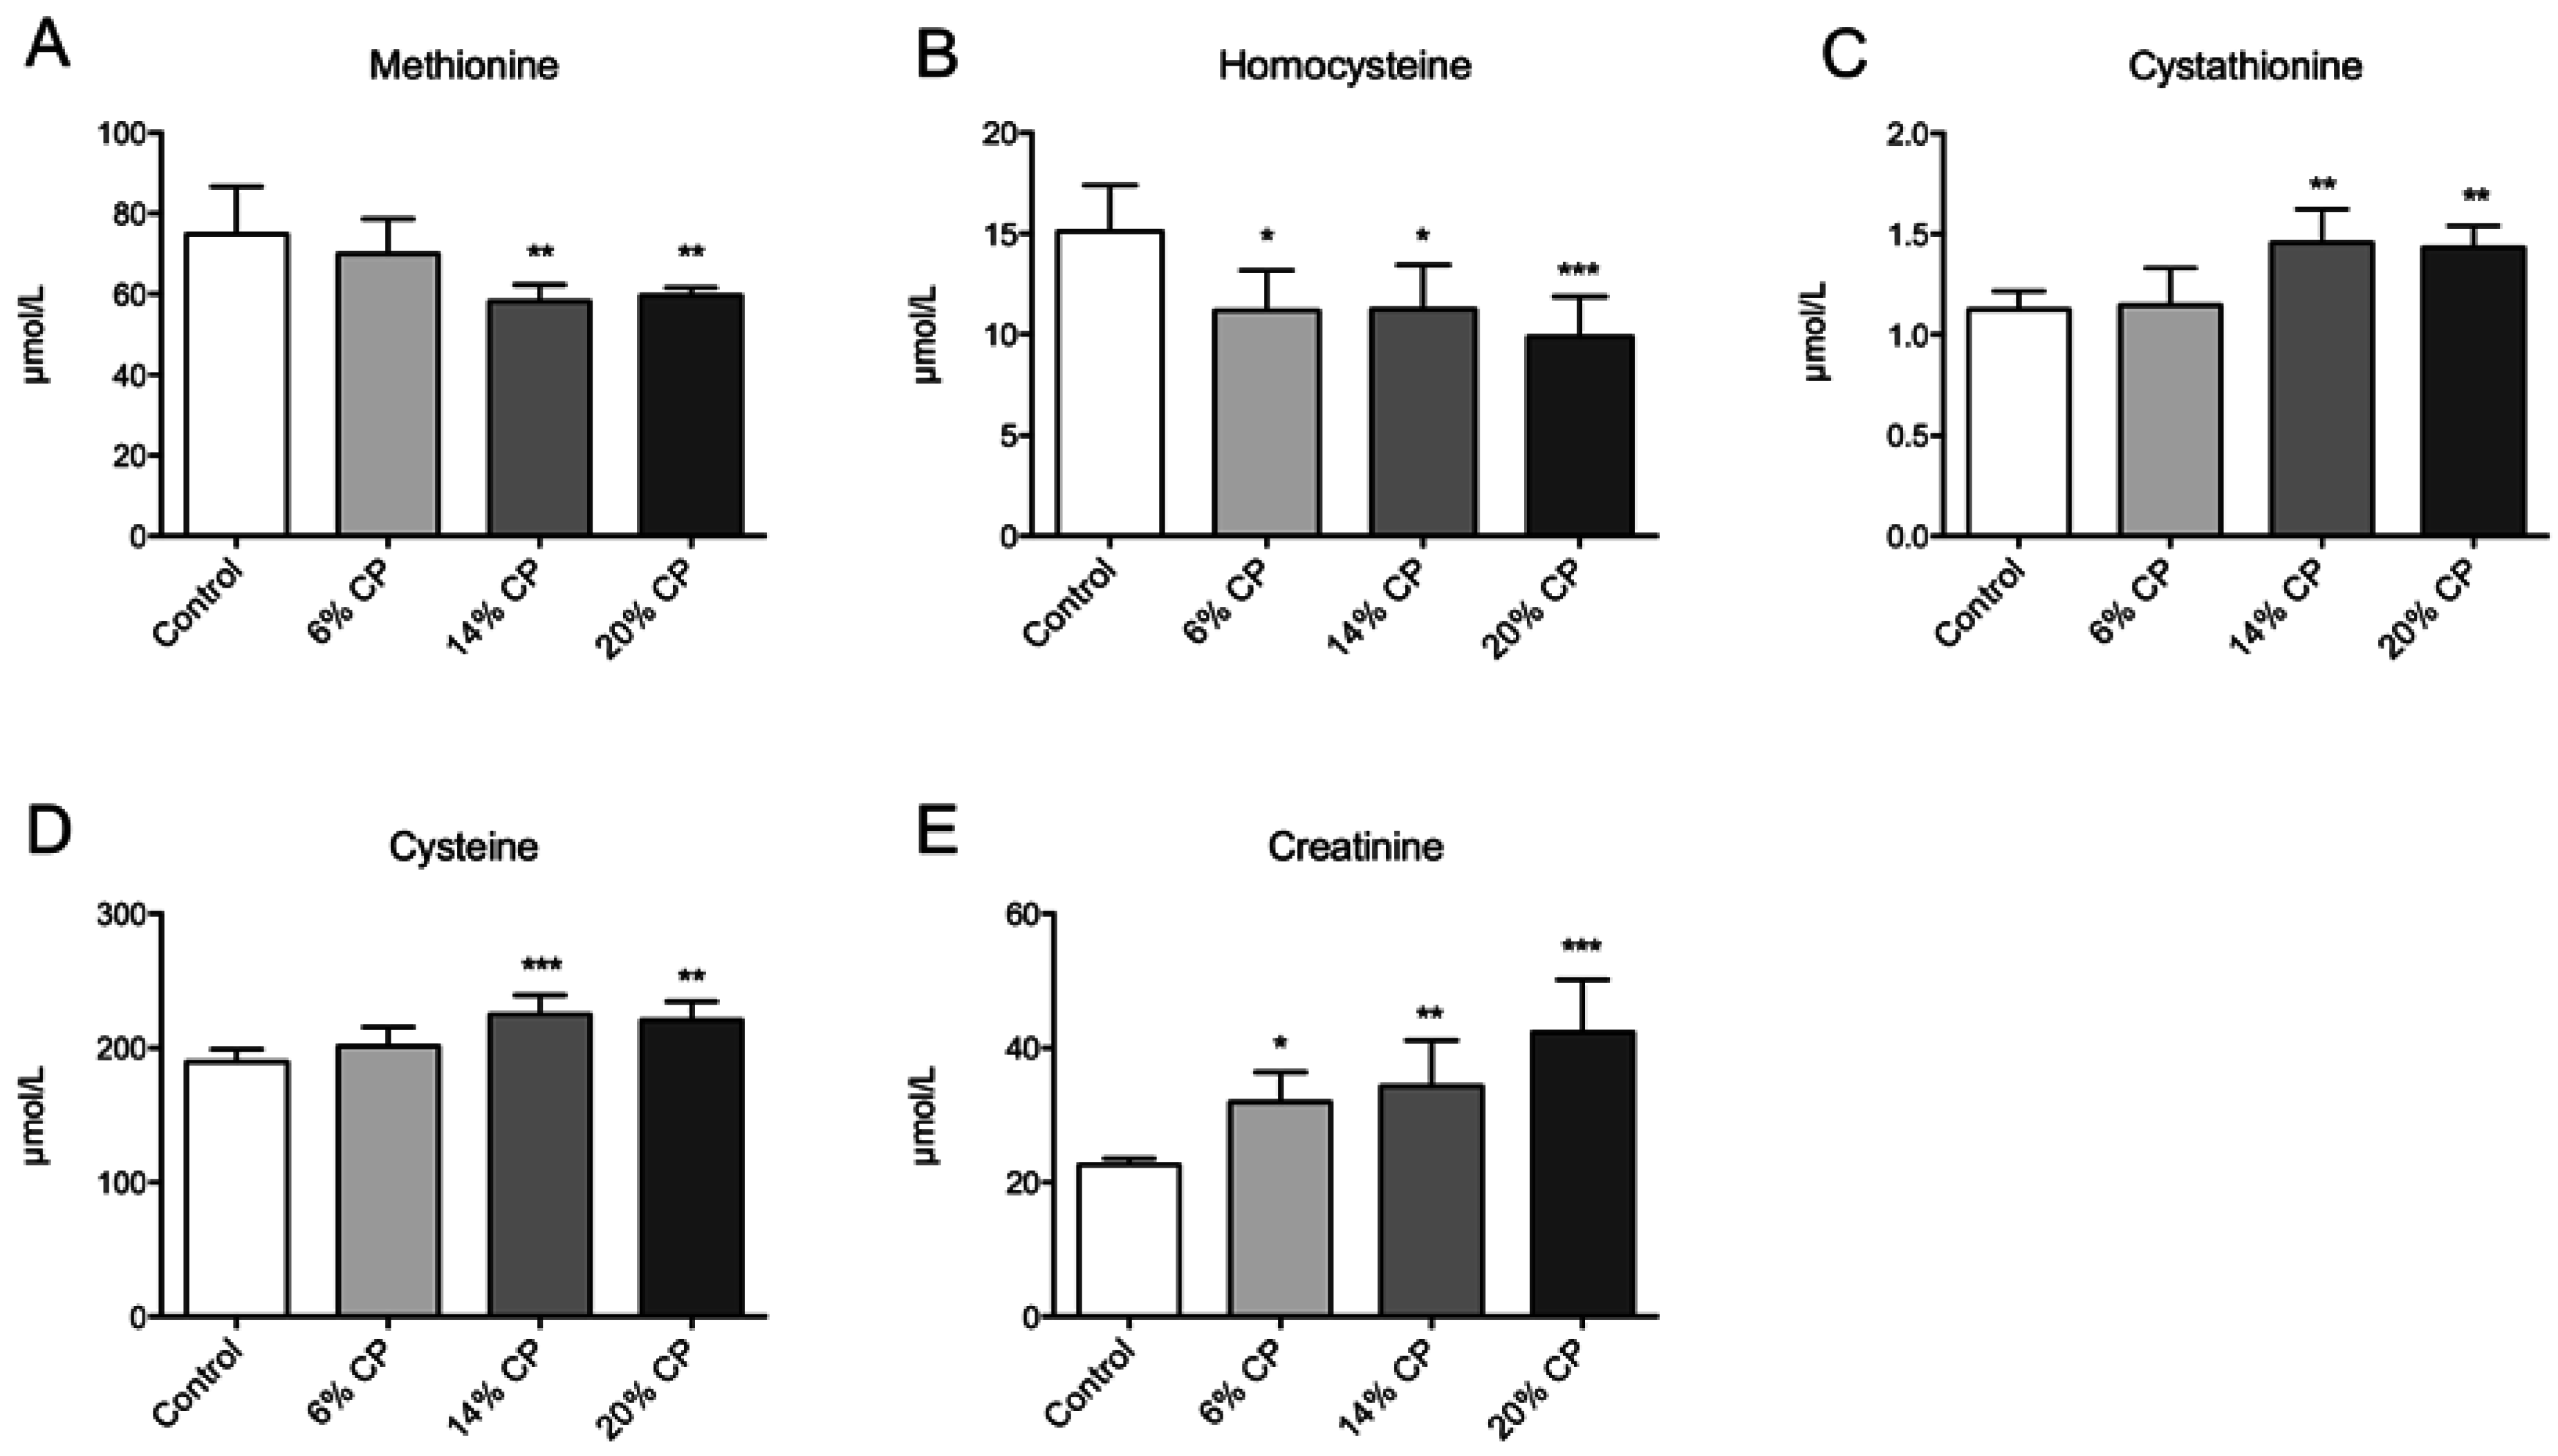
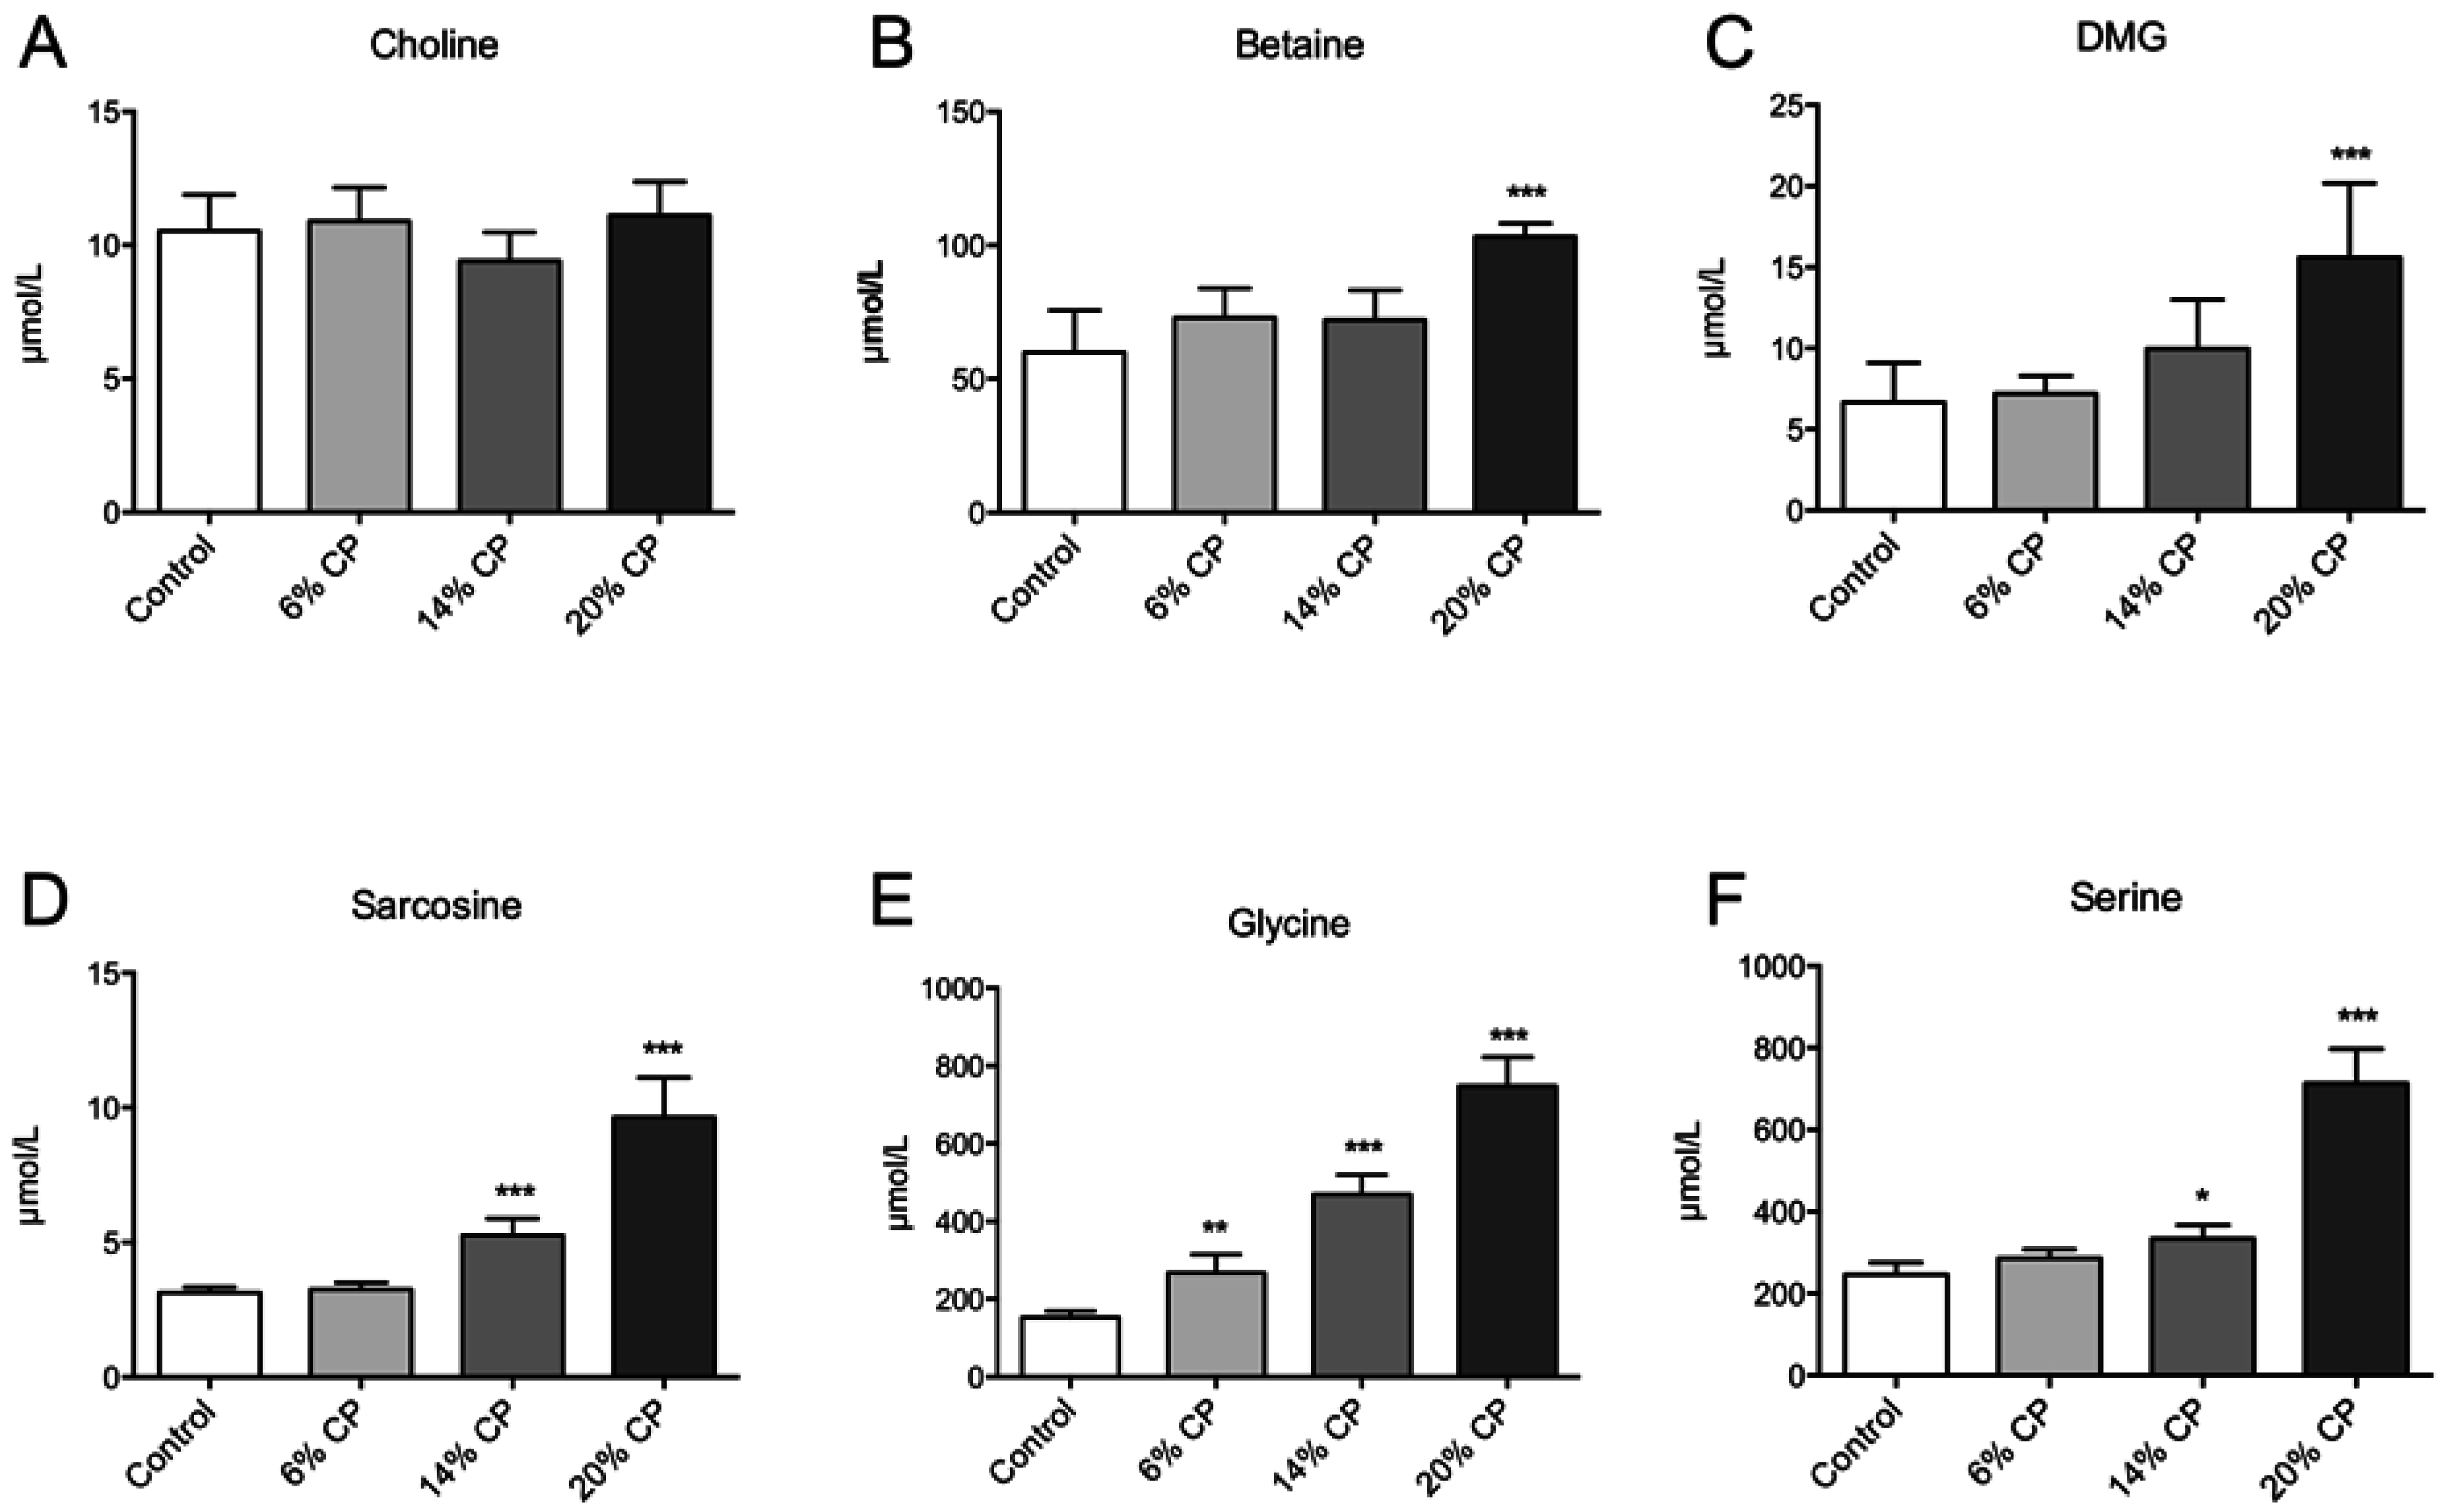
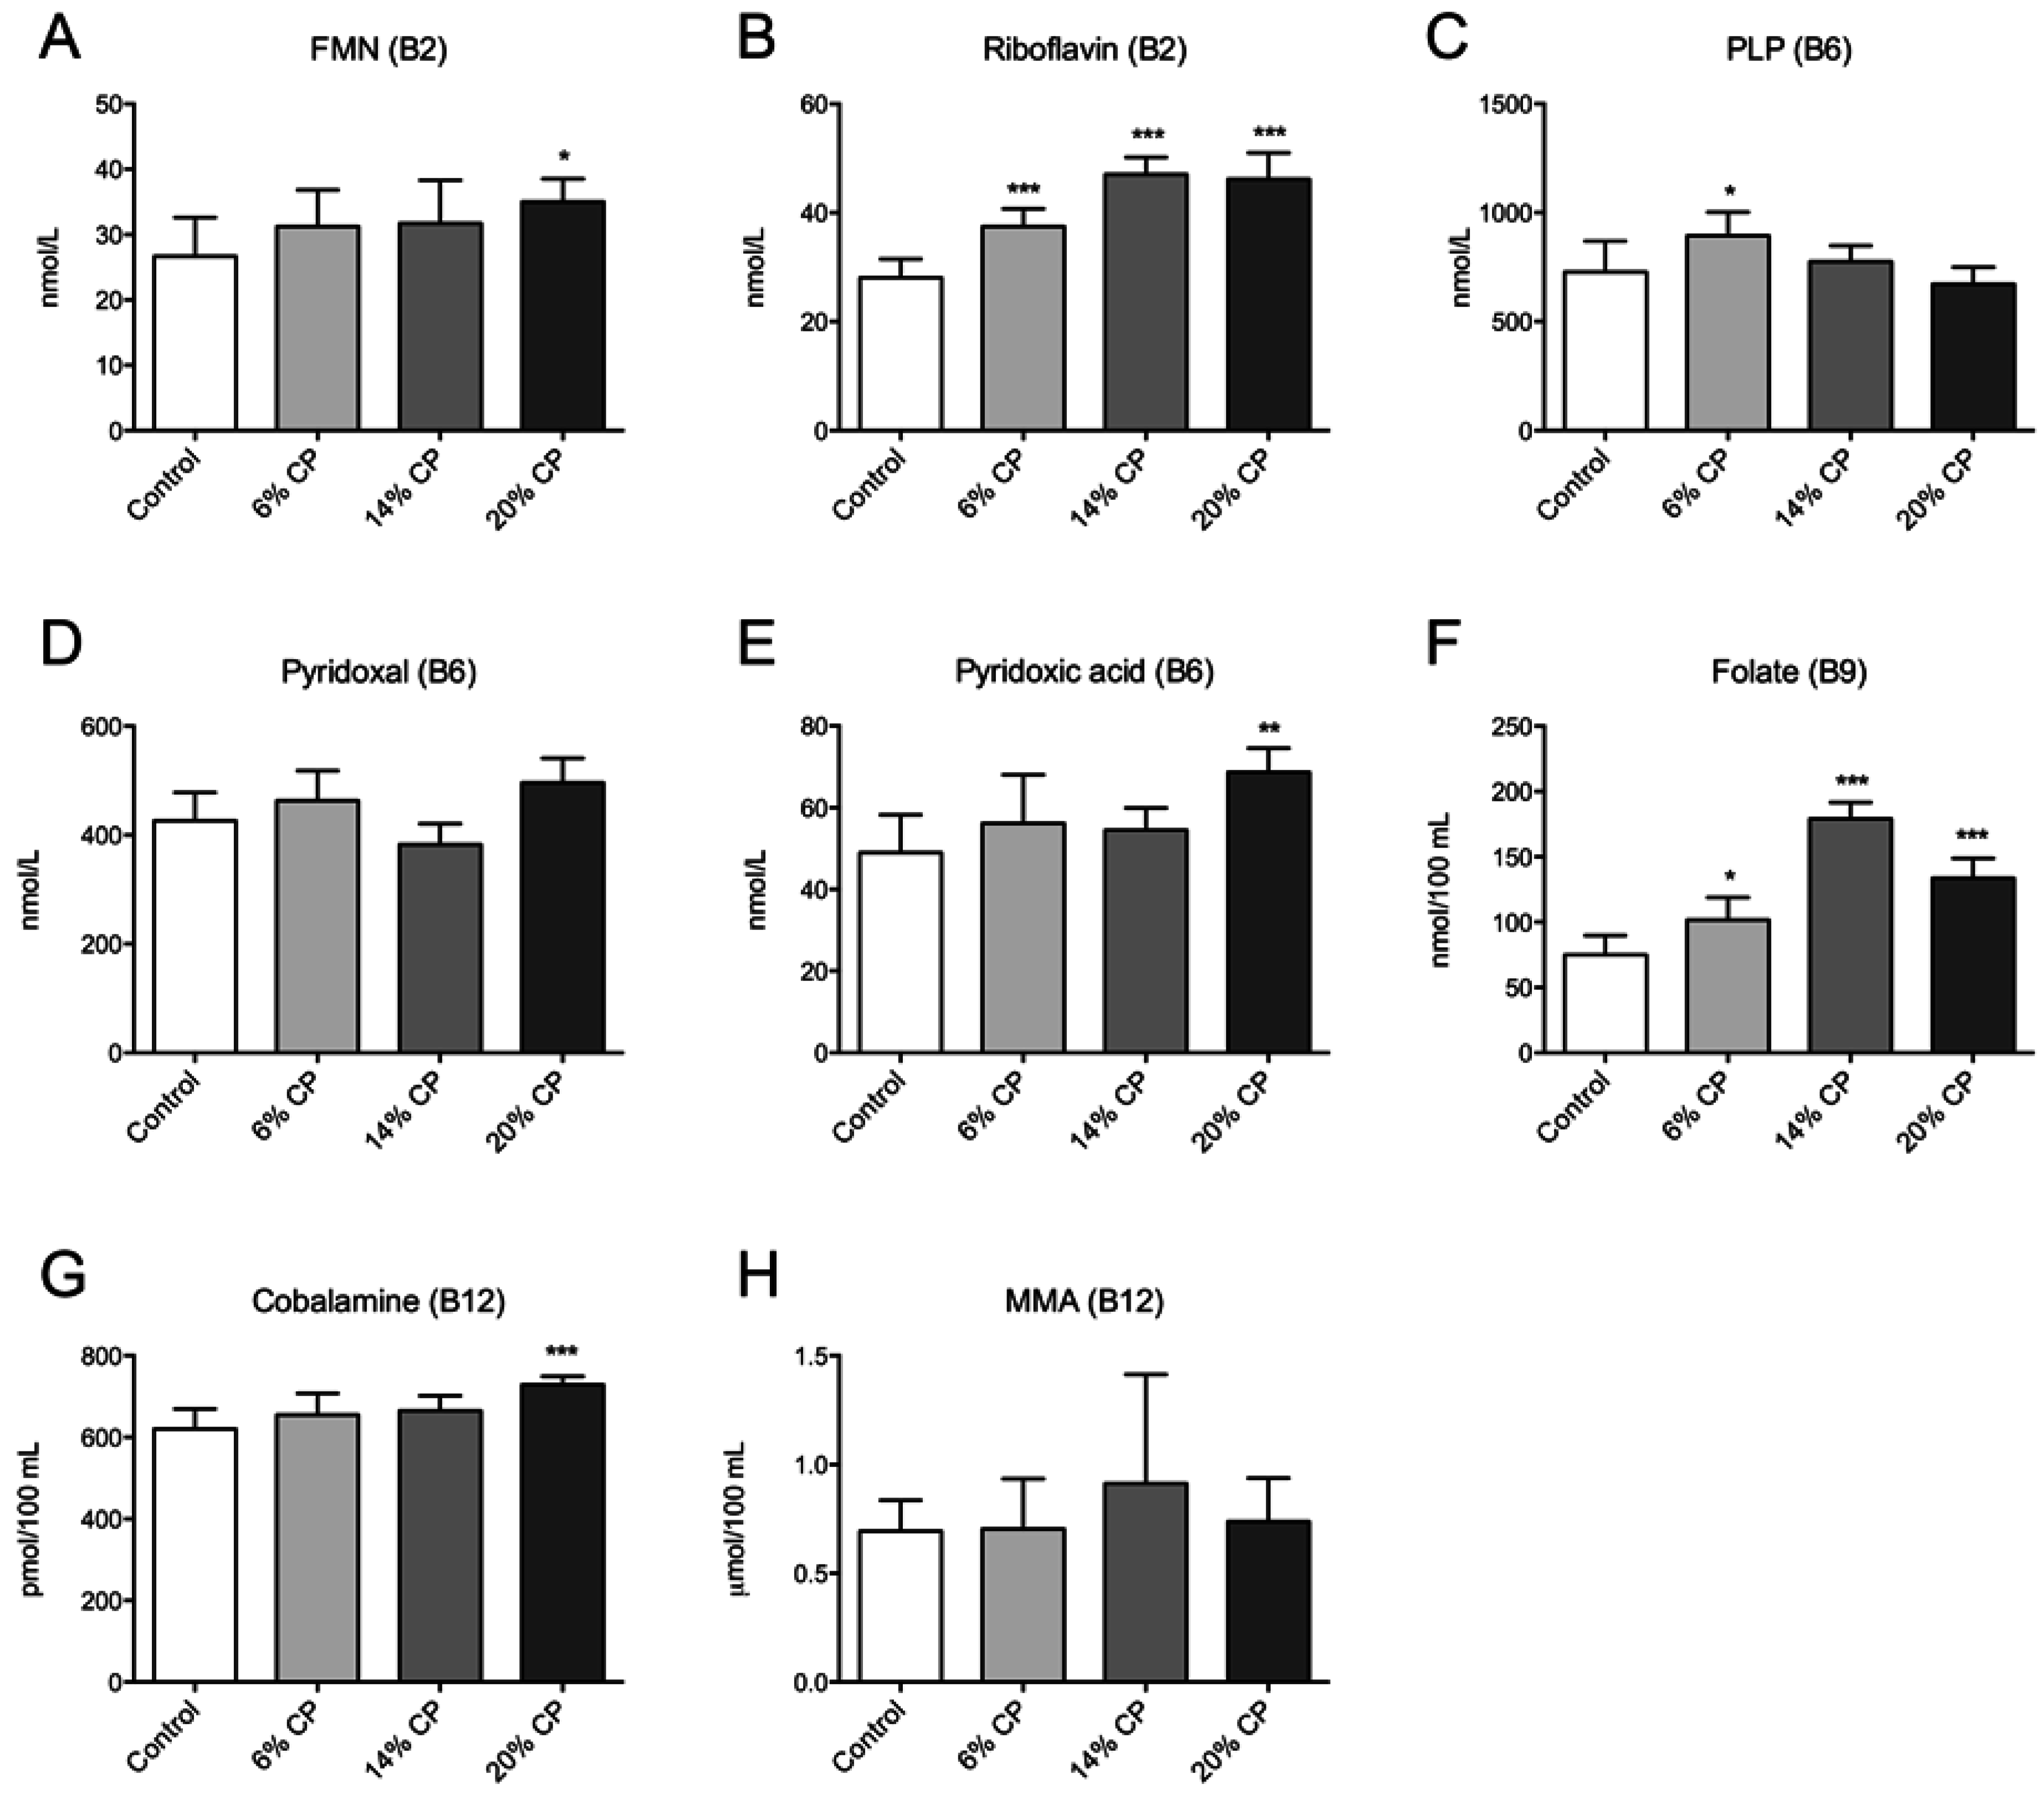
3. Results
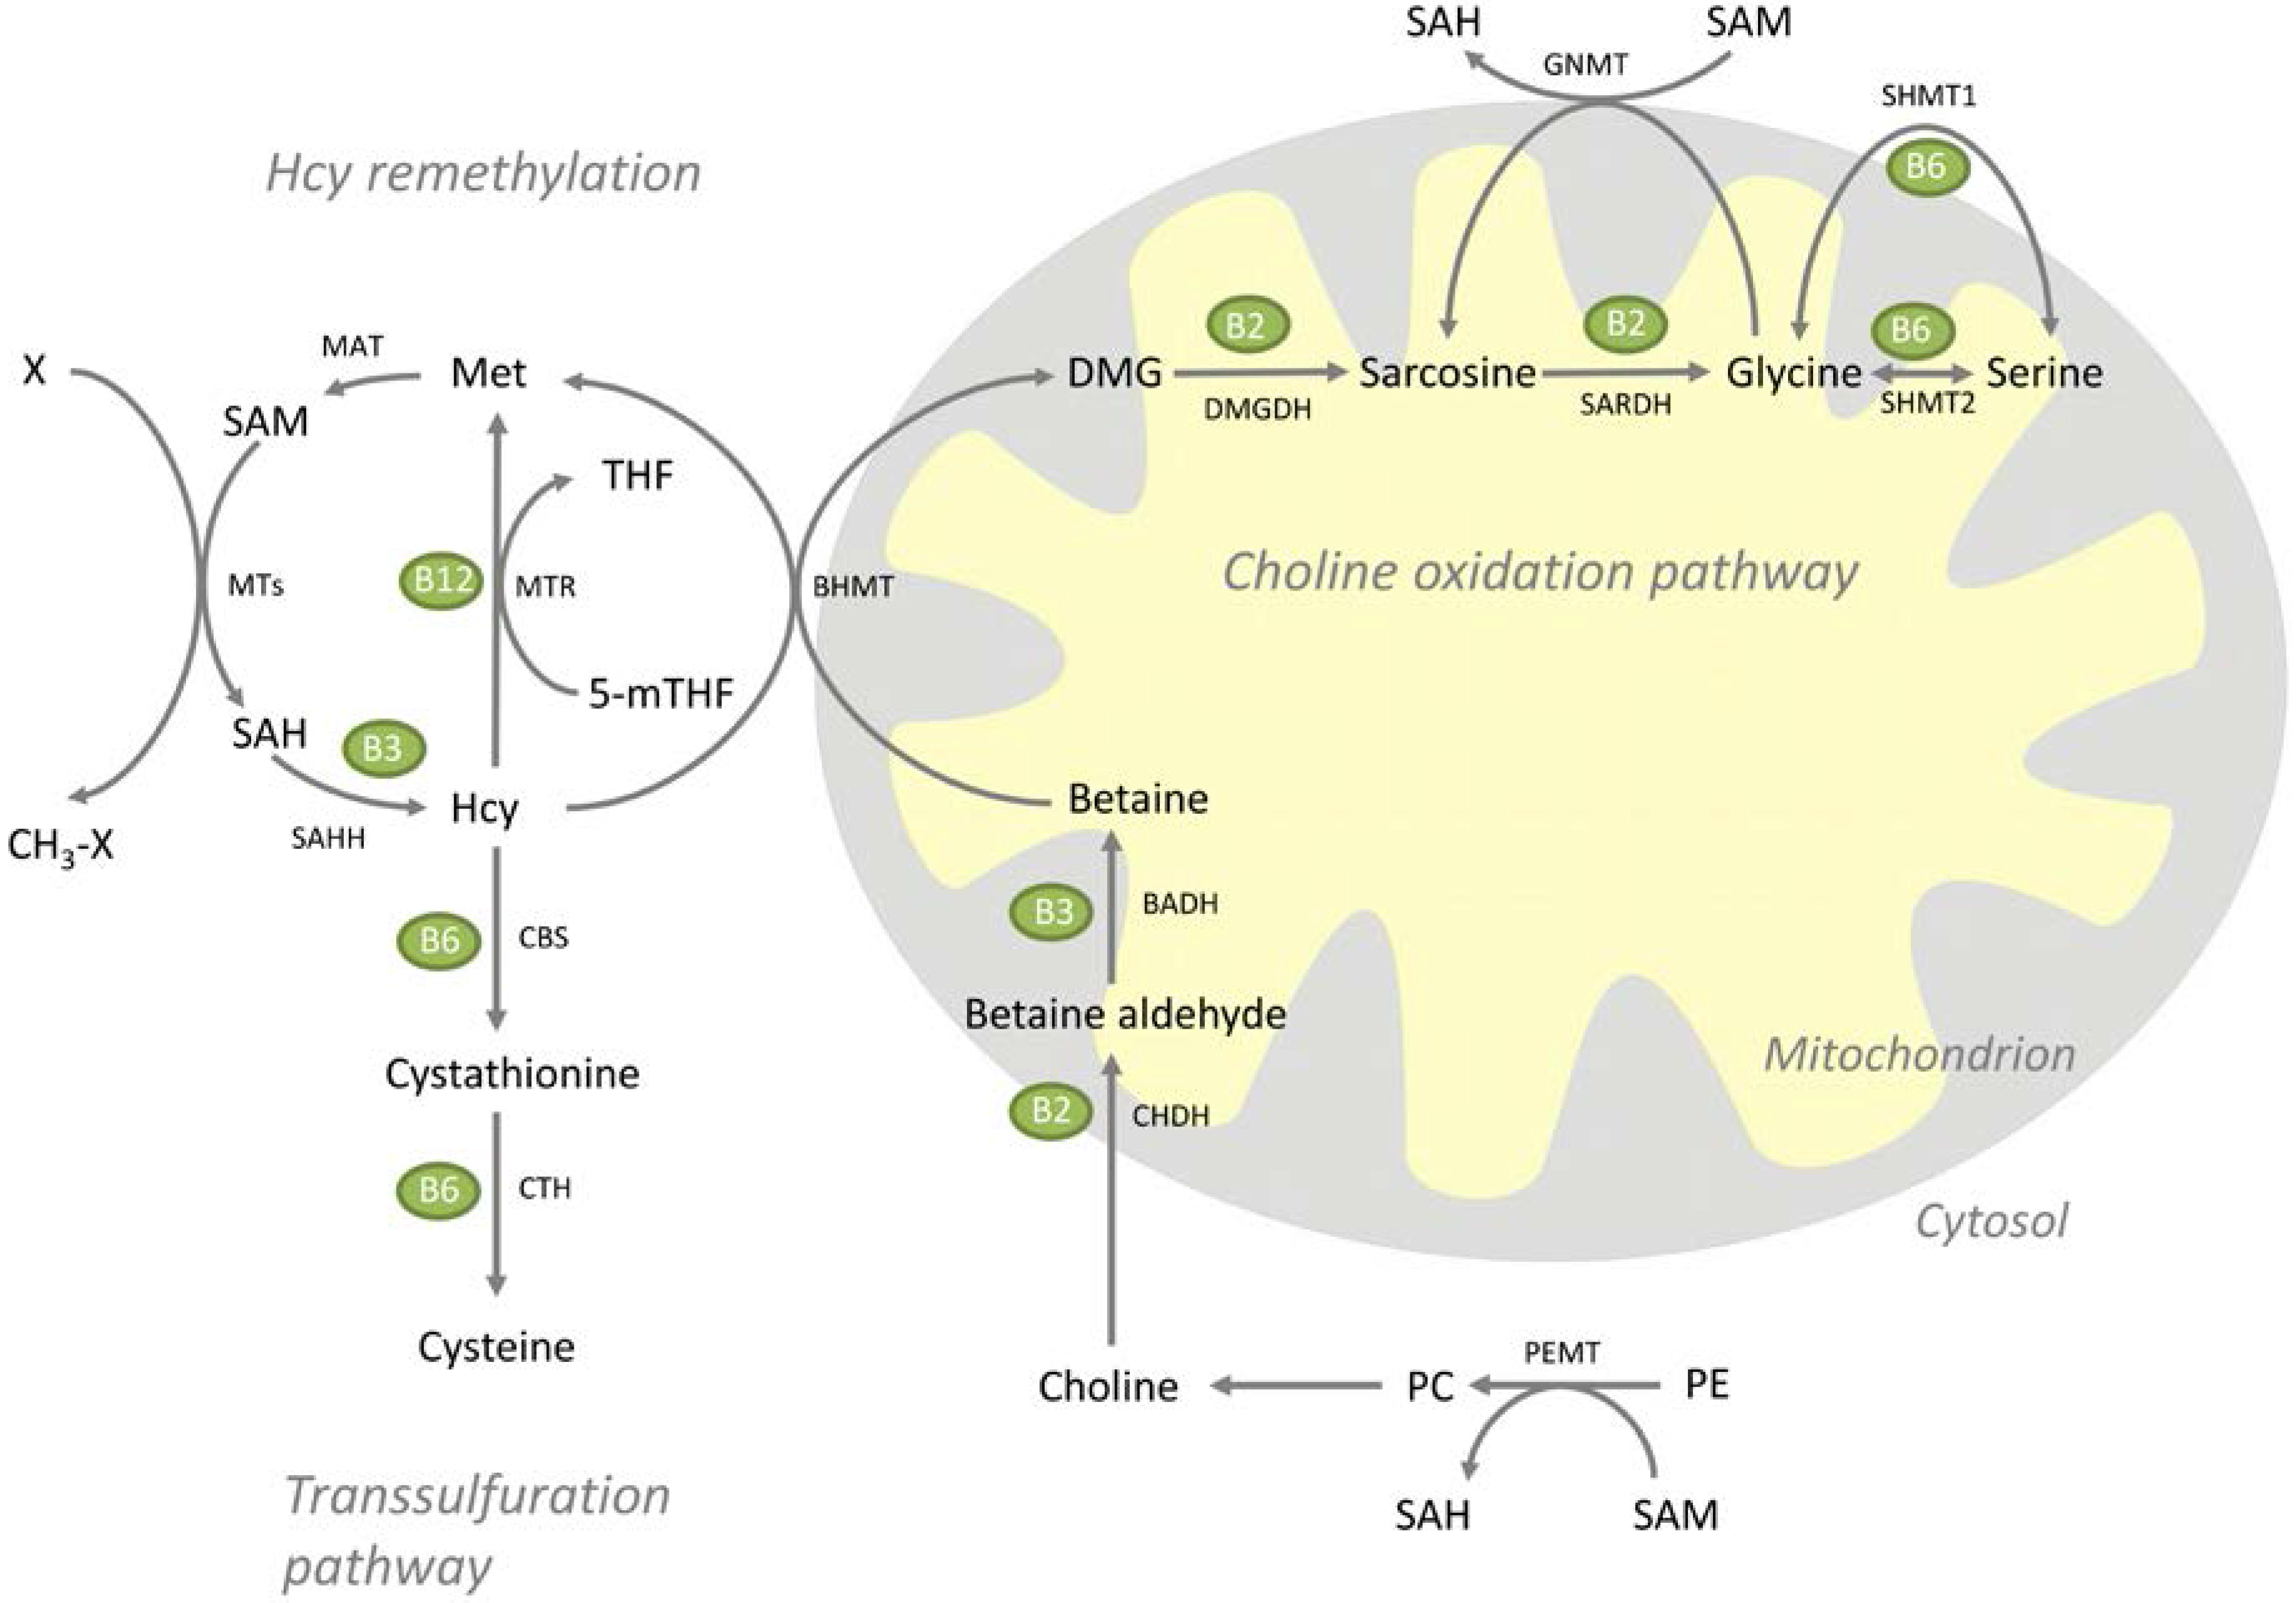
3.1. Metabolites


3.2. Hepatic Gene Expression
| Gene | Diet Groups | |||
|---|---|---|---|---|
| Symbol | Name | Control | Chicken Protein | p-Value |
| Homocysteine Remethylation | ||||
| Mtr | Methionine synthase (5-methyltetrahydrofolate-homocysteine methyltransferase) | 1.00 ± 0.19 | 0.98 ± 0.23 | 0.856 |
| Mtrr | Methionine synthase reductase (5-methyltetrahydrofolate-homocystein ) | 1.00 ± 0.03 | 1.11 ± 0.07 | 0.005 |
| Transsulfuration | ||||
| Cbs | Cystathionine-beta-synthase | 1.00 ± 0.25 | 0.94 ± 0.26 | 0.663 |
| Cth | Cystathionase (cystathionine gamma lyase) Cse, Cys3 | 1.00 ± 0.14 | 1.41 ± 0.24 | 0.005 |
| Choline Synthesis | ||||
| Pemt | Phosphatidyletanolamine N-methyltransferase | 1.00 ± 0.14 | 1.14 ± 0.12 | 0.095 |
| Chka | Choline kinase (alpha) | 1.00 ± 0.21 | 0.82 ± 0.15 | 0.119 |
| Chkb | Ethanolamine kinase/Choline kinase beta | 1.00 ± 0.14 | 1.17 ± 0.16 | 0.084 |
| Choline Oxidation Pathway, Mitochondria | ||||
| Chdh | Choline dehydrogenase | 1.00 ± 0.10 | 1.01 ± 0.10 | 0.899 |
| Dmgdh | Dimethylglycine dehydrogenase | 1.00 ± 0.29 | 0.87 ± 0.19 | 0.377 |
| Sardh | Sarcosine dehydrogenase | 1.00 ± 0.11 | 1.18 ± 0.30 | 0.212 |
| Shmt2 | Serine hydroxymethyltransferase 2 (mit) | 1.00 ± 0.08 | 1.49 ± 0.25 | 0.001 |
| Choline Oxidation Pathway, Cytosol | ||||
| Bhmt | betaine-homocysteine S-methyltransferase | 1.00 ± 0.34 | 0.76 ± 0.11 | 0.139 |
| Gnmt | Glycine N-methyltransferase | 1.00 ± 0.21 | 1.12 ± 0.20 | 0.338 |
| Shmt1 | Serine hydroxymethyltransferase (soluble) | 1.00 ± 0.14 | 1.33 ± 0.14 | 0.002 |
3.3. Vitamin B Status

4. Discussion
5. Conclusions
Acknowledgments
Author Contributions
Conflicts of Interest
References
- Gudbrandsen, O.A.; Wergedahl, H.; Liaset, B.; Espe, M.; Berge, R.K. Dietary proteins with high isoflavone content or low methionine-glycine and lysine-arginine ratios are hypocholesterolaemic and lower the plasma homocysteine level in male zucker fa/fa rats. Br. J. Nutr. 2005, 94, 321–330. [Google Scholar] [CrossRef] [PubMed]
- Liaset, B.; Hao, Q.; Jorgensen, H.; Hallenborg, P.; Du, Z.Y.; Ma, T.; Marschall, H.U.; Kruhoffer, M.; Li, R.; Li, Q.; et al. Nutritional regulation of bile acid metabolism is associated with improved pathological characteristics of the metabolic syndrome. J. Biol. Chem. 2011, 286, 28382–28395. [Google Scholar] [CrossRef] [PubMed]
- Wergedahl, H.; Liaset, B.; Gudbrandsen, O.A.; Lied, E.; Espe, M.; Muna, Z.; Mork, S.; Berge, R.K. Fish protein hydrolysate reduces plasma total cholesterol, increases the proportion of hdl cholesterol, and lowers acyl-coa:Cholesterol acyltransferase activity in liver of zucker rats. J. Nutr. 2004, 134, 1320–1327. [Google Scholar] [PubMed]
- Shukla, A.; Bettzieche, A.; Hirche, F.; Brandsch, C.; Stangl, G.I.; Eder, K. Dietary fish protein alters blood lipid concentrations and hepatic genes involved in cholesterol homeostasis in the rat model. Br. J. Nutr. 2006, 96, 674–682. [Google Scholar] [PubMed]
- Rigamonti, E.; Parolini, C.; Marchesi, M.; Diani, E.; Brambilla, S.; Sirtori, C.R.; Chiesa, G. Hypolipidemic effect of dietary pea proteins: Impact on genes regulating hepatic lipid metabolism. Mol. Nutr. Food Res. 2010, 54, S24–S30. [Google Scholar] [CrossRef] [PubMed]
- Hosomi, R.; Fukunaga, K.; Arai, H.; Nishiyama, T.; Yoshida, M. Effects of dietary fish protein on serum and liver lipid concentrations in rats and the expression of hepatic genes involved in lipid metabolism. J. Agric. Food Chem. 2009, 57, 9256–9262. [Google Scholar] [CrossRef] [PubMed]
- Hosomi, R.; Fukunaga, K.; Arai, H.; Kanda, S.; Nishiyama, T.; Yoshida, M. Fish protein decreases serum cholesterol in rats by inhibition of cholesterol and bile acid absorption. J. Food Sci. 2011, 76, H116–H121. [Google Scholar] [CrossRef] [PubMed]
- Kritchevsky, D.; Tepper, S.A.; Czarnecki, S.K.; Klurfeld, D.M. Atherogenicity of animal and vegetable protein. Influence of the lysine to arginine ratio. Atherosclerosis 1982, 41, 429–431. [Google Scholar] [CrossRef]
- Morita, T.; Oh-hashi, A.; Takei, K.; Ikai, M.; Kasaoka, S.; Kiriyama, S. Cholesterol-lowering effects of soybean, potato and rice proteins depend on their low methionine contents in rats fed a cholesterol-free purified diet. J. Nutr. 1997, 127, 470–477. [Google Scholar] [PubMed]
- Sugiyama, K.; Ohkawa, S.; Muramatsu, K. Relationship between amino acid composition of diet and plasma cholesterol level in growing rats fed a high cholesterol diet. J. Nutr. Sci. Vitaminol. 1986, 32, 413–423. [Google Scholar] [CrossRef] [PubMed]
- Vik, R.; Bjorndal, B.; Bohov, P.; Brattelid, T.; Svardal, A.; Nygard, O.K.; Nordrehaug, J.E.; Skorve, J.; Berge, R.K. Hypolipidemic effect of dietary water-soluble protein extract from chicken: Impact on genes regulating hepatic lipid and bile acid metabolism. Eur. J. Nutr. 2014, 54, 193–204. [Google Scholar] [CrossRef] [PubMed]
- Selhub, J. Homocysteine metabolism. Annu. Rev. Nutr. 1999, 19, 217–246. [Google Scholar] [CrossRef] [PubMed]
- Refsum, H.; Ueland, P.M.; Nygard, O.; Vollset, S.E. Homocysteine and cardiovascular disease. Annu. Rev. Med. 1998, 49, 31–62. [Google Scholar] [CrossRef] [PubMed]
- Clarke, R.; Halsey, J.; Lewington, S.; Lonn, E.; Armitage, J.; Manson, J.E.; Bonaa, K.H.; Spence, J.D.; Nygard, O.; Jamison, R.; et al. Effects of lowering homocysteine levels with b vitamins on cardiovascular disease, cancer, and cause-specific mortality: Meta-analysis of 8 randomized trials involving 37,485 individuals. Arch. Intern. Med. 2010, 170, 1622–1631. [Google Scholar] [PubMed]
- Zeisel, S.H.; Corbin, K.D. Choline. In Present Knowledge in Nutrition, 10th ed.; Erdman, J.W., Macdonald, I.A., Zeisel, S.H., Eds.; International Life Sciences Institute: Washington, DC, USA, 2012; pp. 405–418. [Google Scholar]
- Porter, D.H.; Cook, R.J.; Wagner, C. Enzymatic properties of dimethylglycine dehydrogenase and sarcosine dehydrogenase from rat liver. Arch. Biochem. Biophys. 1985, 243, 396–407. [Google Scholar] [CrossRef]
- Ogawa, H.; Gomi, T.; Takusagawa, F.; Fujioka, M. Structure, function and physiological role of glycine N-methyltransferase. Int. J. Biochem. Cell Biol. 1998, 30, 13–26. [Google Scholar] [CrossRef]
- Luka, Z.; Mudd, S.H.; Wagner, C. Glycine N-methyltransferase and regulation of S-adenosylmethionine levels. J. Biol. Chem. 2009, 284, 22507–22511. [Google Scholar] [CrossRef] [PubMed]
- Schirch, V.; Szebenyi, D.M. Serine hydroxymethyltransferase revisited. Curr. Opin. Chem. Biol. 2005, 9, 482–487. [Google Scholar] [CrossRef] [PubMed]
- Ueland, P.M.; Midttun, O.; Windelberg, A.; Svardal, A.; Skalevik, R.; Hustad, S. Quantitative profiling of folate and one-carbon metabolism in large-scale epidemiological studies by mass spectrometry. Clin. Chem. Lab. Med.: CCLM/FESCC 2007, 45, 1737–1745. [Google Scholar] [CrossRef] [PubMed]
- Midttun, O.; Kvalheim, G.; Ueland, P.M. High-throughput, low-volume, multianalyte quantification of plasma metabolites related to one-carbon metabolism using hplc-ms/ms. Anal. Bioanal. Chem. 2013, 405, 2009–2017. [Google Scholar] [CrossRef] [PubMed]
- Midttun, O.; Hustad, S.; Ueland, P.M. Quantitative profiling of biomarkers related to b-vitamin status, tryptophan metabolism and inflammation in human plasma by liquid chromatography/tandem mass spectrometry. Rapid Commun. Mass spectrom.: RCM 2009, 23, 1371–1379. [Google Scholar] [CrossRef] [PubMed]
- Kelleher, B.P.; Broin, S.D. Microbiological assay for vitamin B12 performed in 96-well microtitre plates. J. Clin. Pathol. 1991, 44, 592–595. [Google Scholar] [CrossRef] [PubMed]
- Molloy, A.M.; Scott, J.M. Microbiological assay for serum, plasma, and red cell folate using cryopreserved, microtiter plate method. Methods Enzymol. 1997, 281, 43–53. [Google Scholar] [PubMed]
- Andersen, C.L.; Jensen, J.L.; Orntoft, T.F. Normalization of real-time quantitative reverse transcription-pcr data: A model-based variance estimation approach to identify genes suited for normalization, applied to bladder and colon cancer data sets. Cancer Res. 2004, 64, 5245–5250. [Google Scholar] [CrossRef] [PubMed]
- Mudd, S.H.; Poole, J.R. Labile methyl balances for normal humans on various dietary regimens. Metabolism 1975, 24, 721–735. [Google Scholar] [CrossRef]
- Wilson, F.A.; van den Borne, J.J.; Calder, A.G.; O'Kennedy, N.; Holtrop, G.; Rees, W.D.; Lobley, G.E. Tissue methionine cycle activity and homocysteine metabolism in female rats: Impact of dietary methionine and folate plus choline. Am. J. Physiol. Endocrinol. Metab. 2009, 296, E702–E713. [Google Scholar] [CrossRef] [PubMed]
- Finkelstein, J.D.; Harris, B.J.; Martin, J.J.; Kyle, W.E. Regulation of hepatic betaine-homocysteine methyltransferase by dietary methionine. Biochem. Biophys. Res. Commun. 1982, 108, 344–348. [Google Scholar] [CrossRef]
- Clarke, R.; Armitage, J. Vitamin supplements and cardiovascular risk: Review of the randomized trials of homocysteine-lowering vitamin supplements. Semin Thromb Hemost 2000, 26, 341–348. [Google Scholar] [CrossRef] [PubMed]
- Van Oort, F.V.; Melse-Boonstra, A.; Brouwer, I.A.; Clarke, R.; West, C.E.; Katan, M.B.; Verhoef, P. Folic acid and reduction of plasma homocysteine concentrations in older adults: A dose-response study. Am. J. Clin Nutr 2003, 77, 1318–1323. [Google Scholar] [PubMed]
- Nieman, K.M.; Hartz, C.S.; Szegedi, S.S.; Garrow, T.A.; Sparks, J.D.; Schalinske, K.L. Folate status modulates the induction of hepatic glycine n-methyltransferase and homocysteine metabolism in diabetic rats. Am. J. Physiol. Endocrinol. Metab. 2006, 291, E1235–E1242. [Google Scholar] [CrossRef] [PubMed]
- Davis, S.R.; Quinlivan, E.P.; Shelnutt, K.P.; Ghandour, H.; Capdevila, A.; Coats, B.S.; Wagner, C.; Shane, B.; Selhub, J.; Bailey, L.B.; et al. Homocysteine synthesis is elevated but total remethylation is unchanged by the methylenetetrahydrofolate reductase 677c->t polymorphism and by dietary folate restriction in young women. J. Nutr. 2005, 135, 1045–1050. [Google Scholar] [PubMed]
- Kutzbach, C.; Stokstad, E.L. Mammalian methylenetetrahydrofolate reductase. Partial purification, properties, and inhibition by s-adenosylmethionine. Biochim. Biophys. Acta 1971, 250, 459–477. [Google Scholar] [CrossRef]
- Leclerc, D.; Wilson, A.; Dumas, R.; Gafuik, C.; Song, D.; Watkins, D.; Heng, H.H.; Rommens, J.M.; Scherer, S.W.; Rosenblatt, D.S.; et al. Cloning and mapping of a cdna for methionine synthase reductase, a flavoprotein defective in patients with homocystinuria. Proc. Natl. Acad. Sci. USA 1998, 95, 3059–3064. [Google Scholar] [CrossRef] [PubMed]
- Finkelstein, J.D.; Martin, J.J. Methionine metabolism in mammals. Distribution of homocysteine between competing pathways. J. Biol. Chem. 1984, 259, 9508–9513. [Google Scholar] [PubMed]
- Wang, W.; Wu, Z.; Dai, Z.; Yang, Y.; Wang, J.; Wu, G. Glycine metabolism in animals and humans: Implications for nutrition and health. J. Amino Acids 2013, 45, 463–477. [Google Scholar] [CrossRef] [PubMed]
- Kikuchi, G.; Motokawa, Y.; Yoshida, T.; Hiraga, K. Glycine cleavage system: Reaction mechanism, physiological significance, and hyperglycinemia. Proc. Jpn. Acad. Ser. B Phys. Biol. Sci. 2008, 84, 246–263. [Google Scholar] [CrossRef] [PubMed]
© 2015 by the authors; licensee MDPI, Basel, Switzerland. This article is an open access article distributed under the terms and conditions of the Creative Commons Attribution license (http://creativecommons.org/licenses/by/4.0/).
Share and Cite
Lysne, V.; Bjørndal, B.; Vik, R.; Nordrehaug, J.E.; Skorve, J.; Nygård, O.; Berge, R.K. A Protein Extract from Chicken Reduces Plasma Homocysteine in Rats. Nutrients 2015, 7, 4498-4511. https://doi.org/10.3390/nu7064498
Lysne V, Bjørndal B, Vik R, Nordrehaug JE, Skorve J, Nygård O, Berge RK. A Protein Extract from Chicken Reduces Plasma Homocysteine in Rats. Nutrients. 2015; 7(6):4498-4511. https://doi.org/10.3390/nu7064498
Chicago/Turabian StyleLysne, Vegard, Bodil Bjørndal, Rita Vik, Jan Erik Nordrehaug, Jon Skorve, Ottar Nygård, and Rolf K. Berge. 2015. "A Protein Extract from Chicken Reduces Plasma Homocysteine in Rats" Nutrients 7, no. 6: 4498-4511. https://doi.org/10.3390/nu7064498
APA StyleLysne, V., Bjørndal, B., Vik, R., Nordrehaug, J. E., Skorve, J., Nygård, O., & Berge, R. K. (2015). A Protein Extract from Chicken Reduces Plasma Homocysteine in Rats. Nutrients, 7(6), 4498-4511. https://doi.org/10.3390/nu7064498