Obesity Promotes Alterations in Iron Recycling

 ,
,
Abstract
:1. Introduction
2. Experimental Section
2.1. Materials
2.2. Ethics Statement
2.3. Animals and Diet Protocol
2.4. Intraperitoneal Glucose Tolerance Test
2.5. Sample Collection
2.6. Measurements of Leptin and IL-6
2.7. RNA Extraction and qRT-PCR Analysis

| Target Gene | Forward Primer (5′–3′) | Reverse Primer (5′–3′) | GenBank Accession Number |
|---|---|---|---|
| DMT1 | CTCCACCATGACTGGAACCT | TTCAGGAATCCCTCCATGAC | NM_001146161 |
| Ferritin | TGATGAAGCTGCAGAACCAG | GTGCACACTCCATTGCATTC | NM_010239 |
| Ferroportin | TTGCAGGAGTCATTGCTGCTA | TGGAGTTCTGCACACCATTGAT | NM_016917 |
| GAPDH | CCTCGTCCCGTAGACAAAATG | TGAAGGGGTCGTTGATGGC | NM_008084 |
| Hepcidin | CCTATCTCCATCAACAGATG | AACAGATACCACACTGGGAA | NM_032541 |
| XBP1 | GAACCAGGAGTTAAGAACACG | AGGCAACAGTGTCAGAGTCC | NM_0012717301 |
2.8. Semi-Quantitative RT-PCR
2.9. Western Blotting
2.10. Isolation and Culture of Splenic Macrophages
2.11. Immunofluorescence Microscopy
Immunocytochemistry
2.12. Iron Concentrations in Liver and Spleen
2.13. Statistical Analysis
3. Results
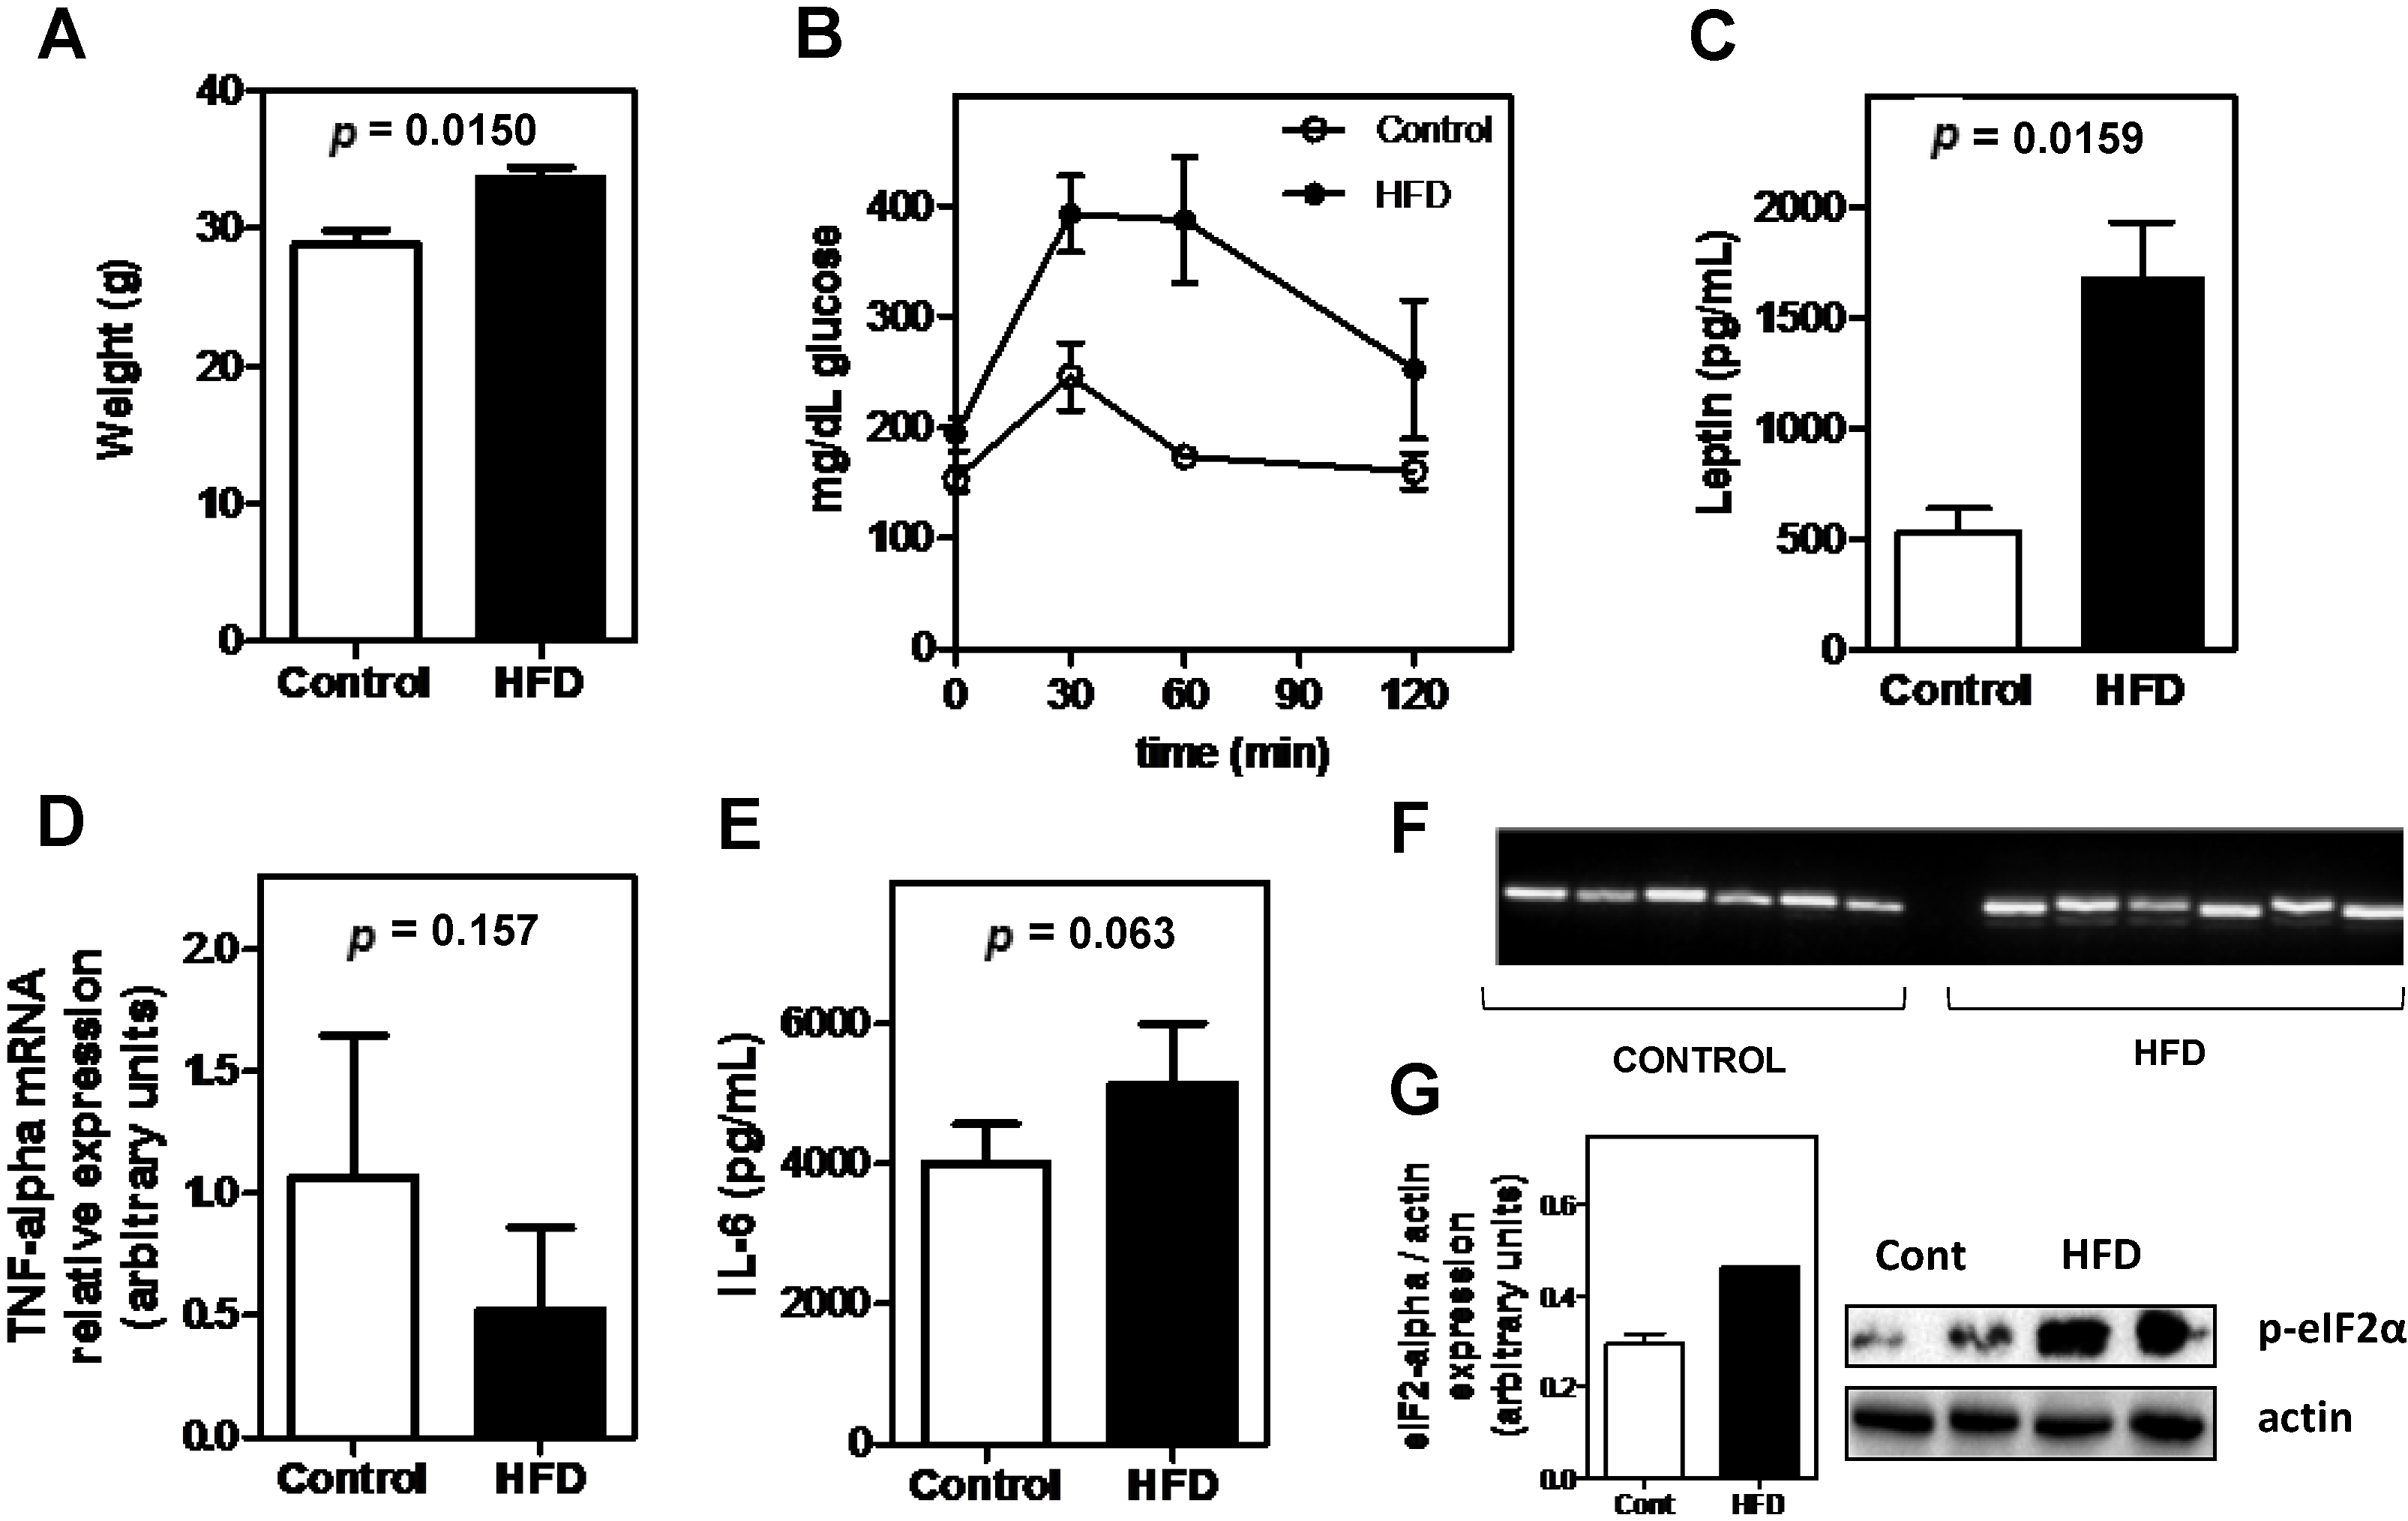
3.1. Effects of High-Fat Diet on Metabolic Parameters
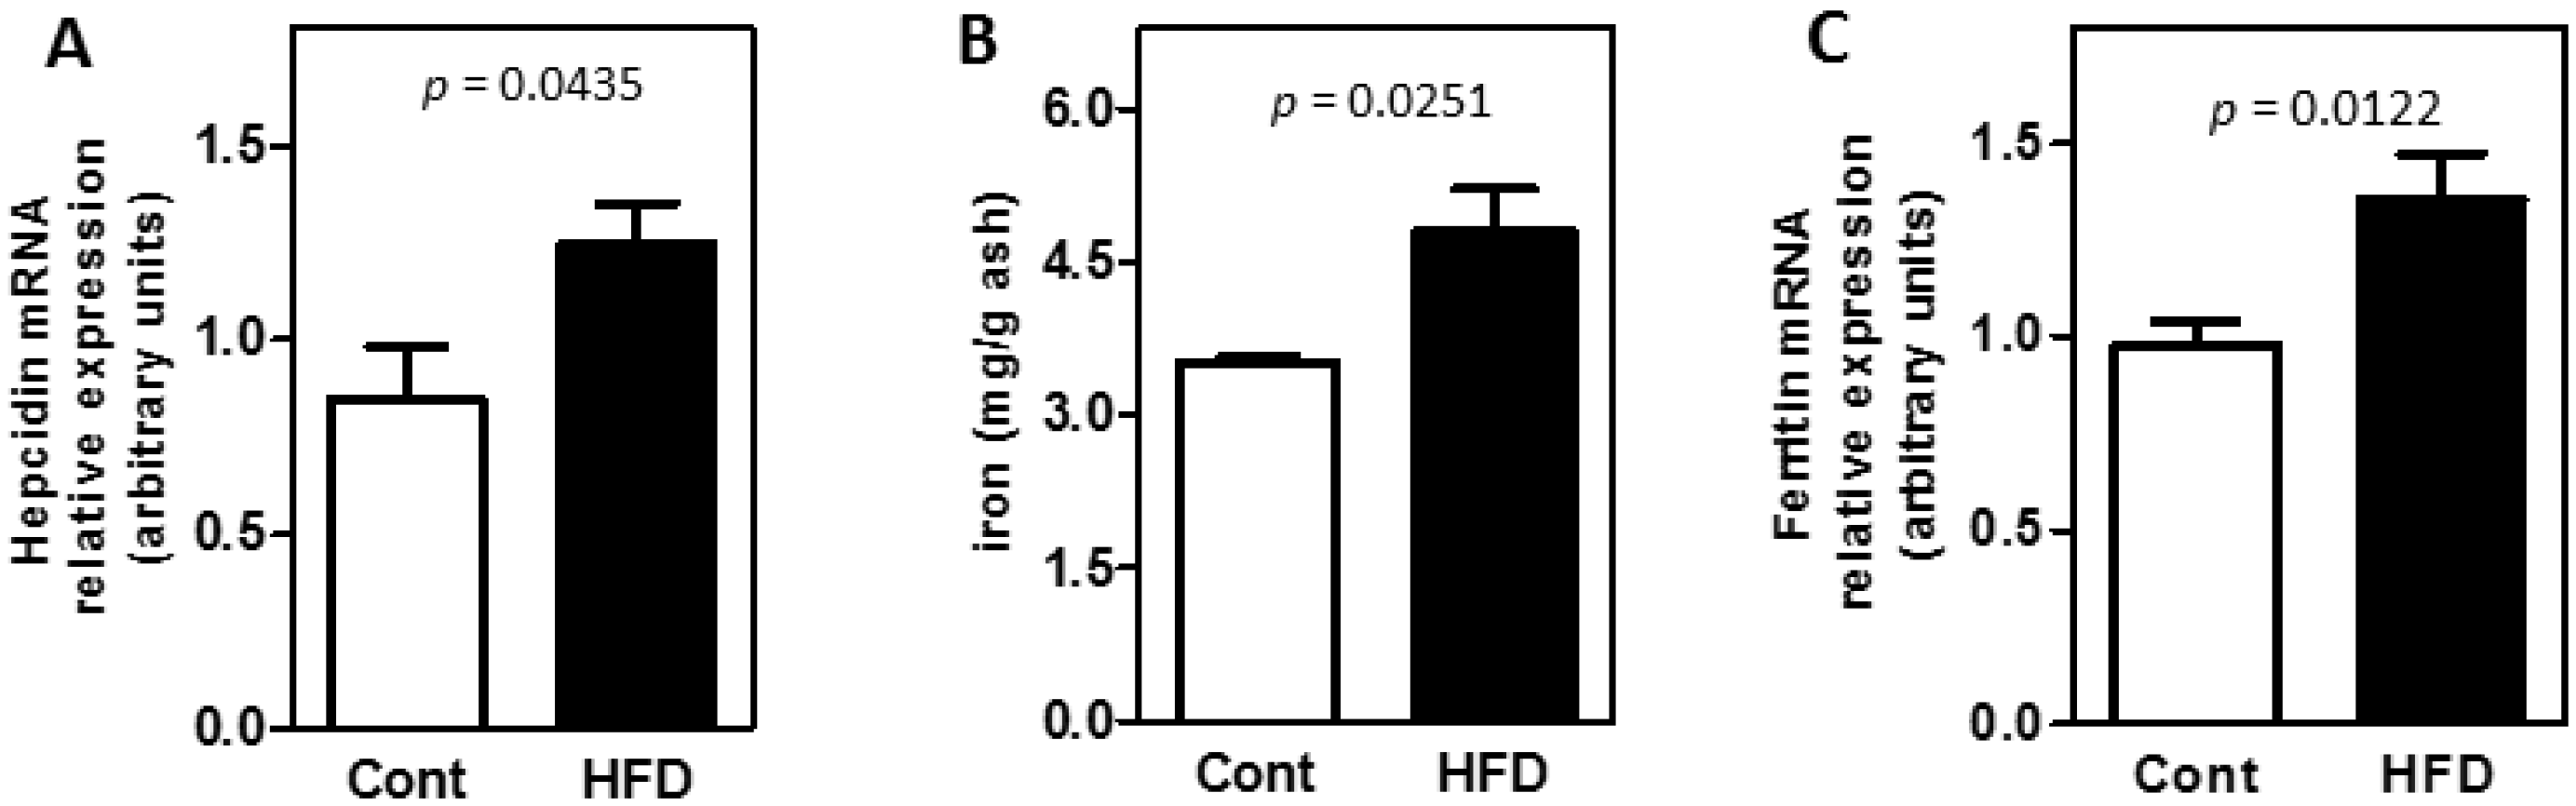
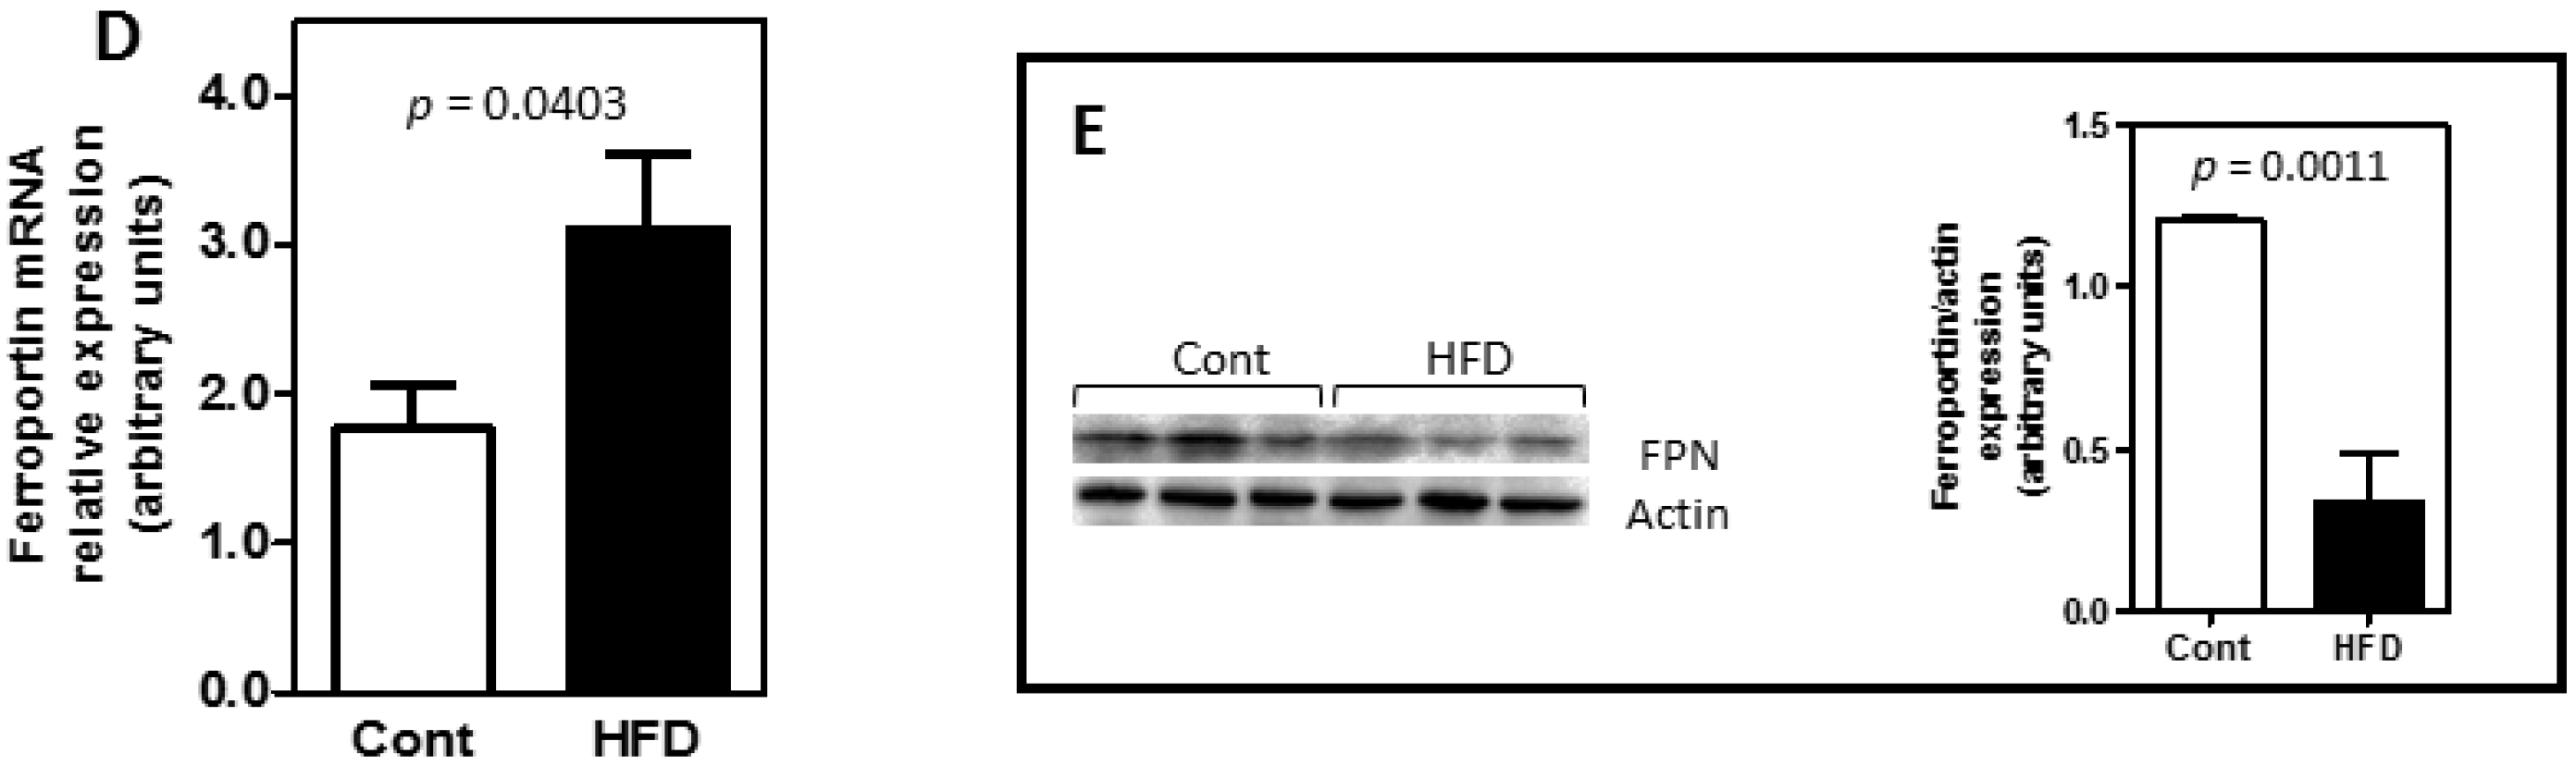
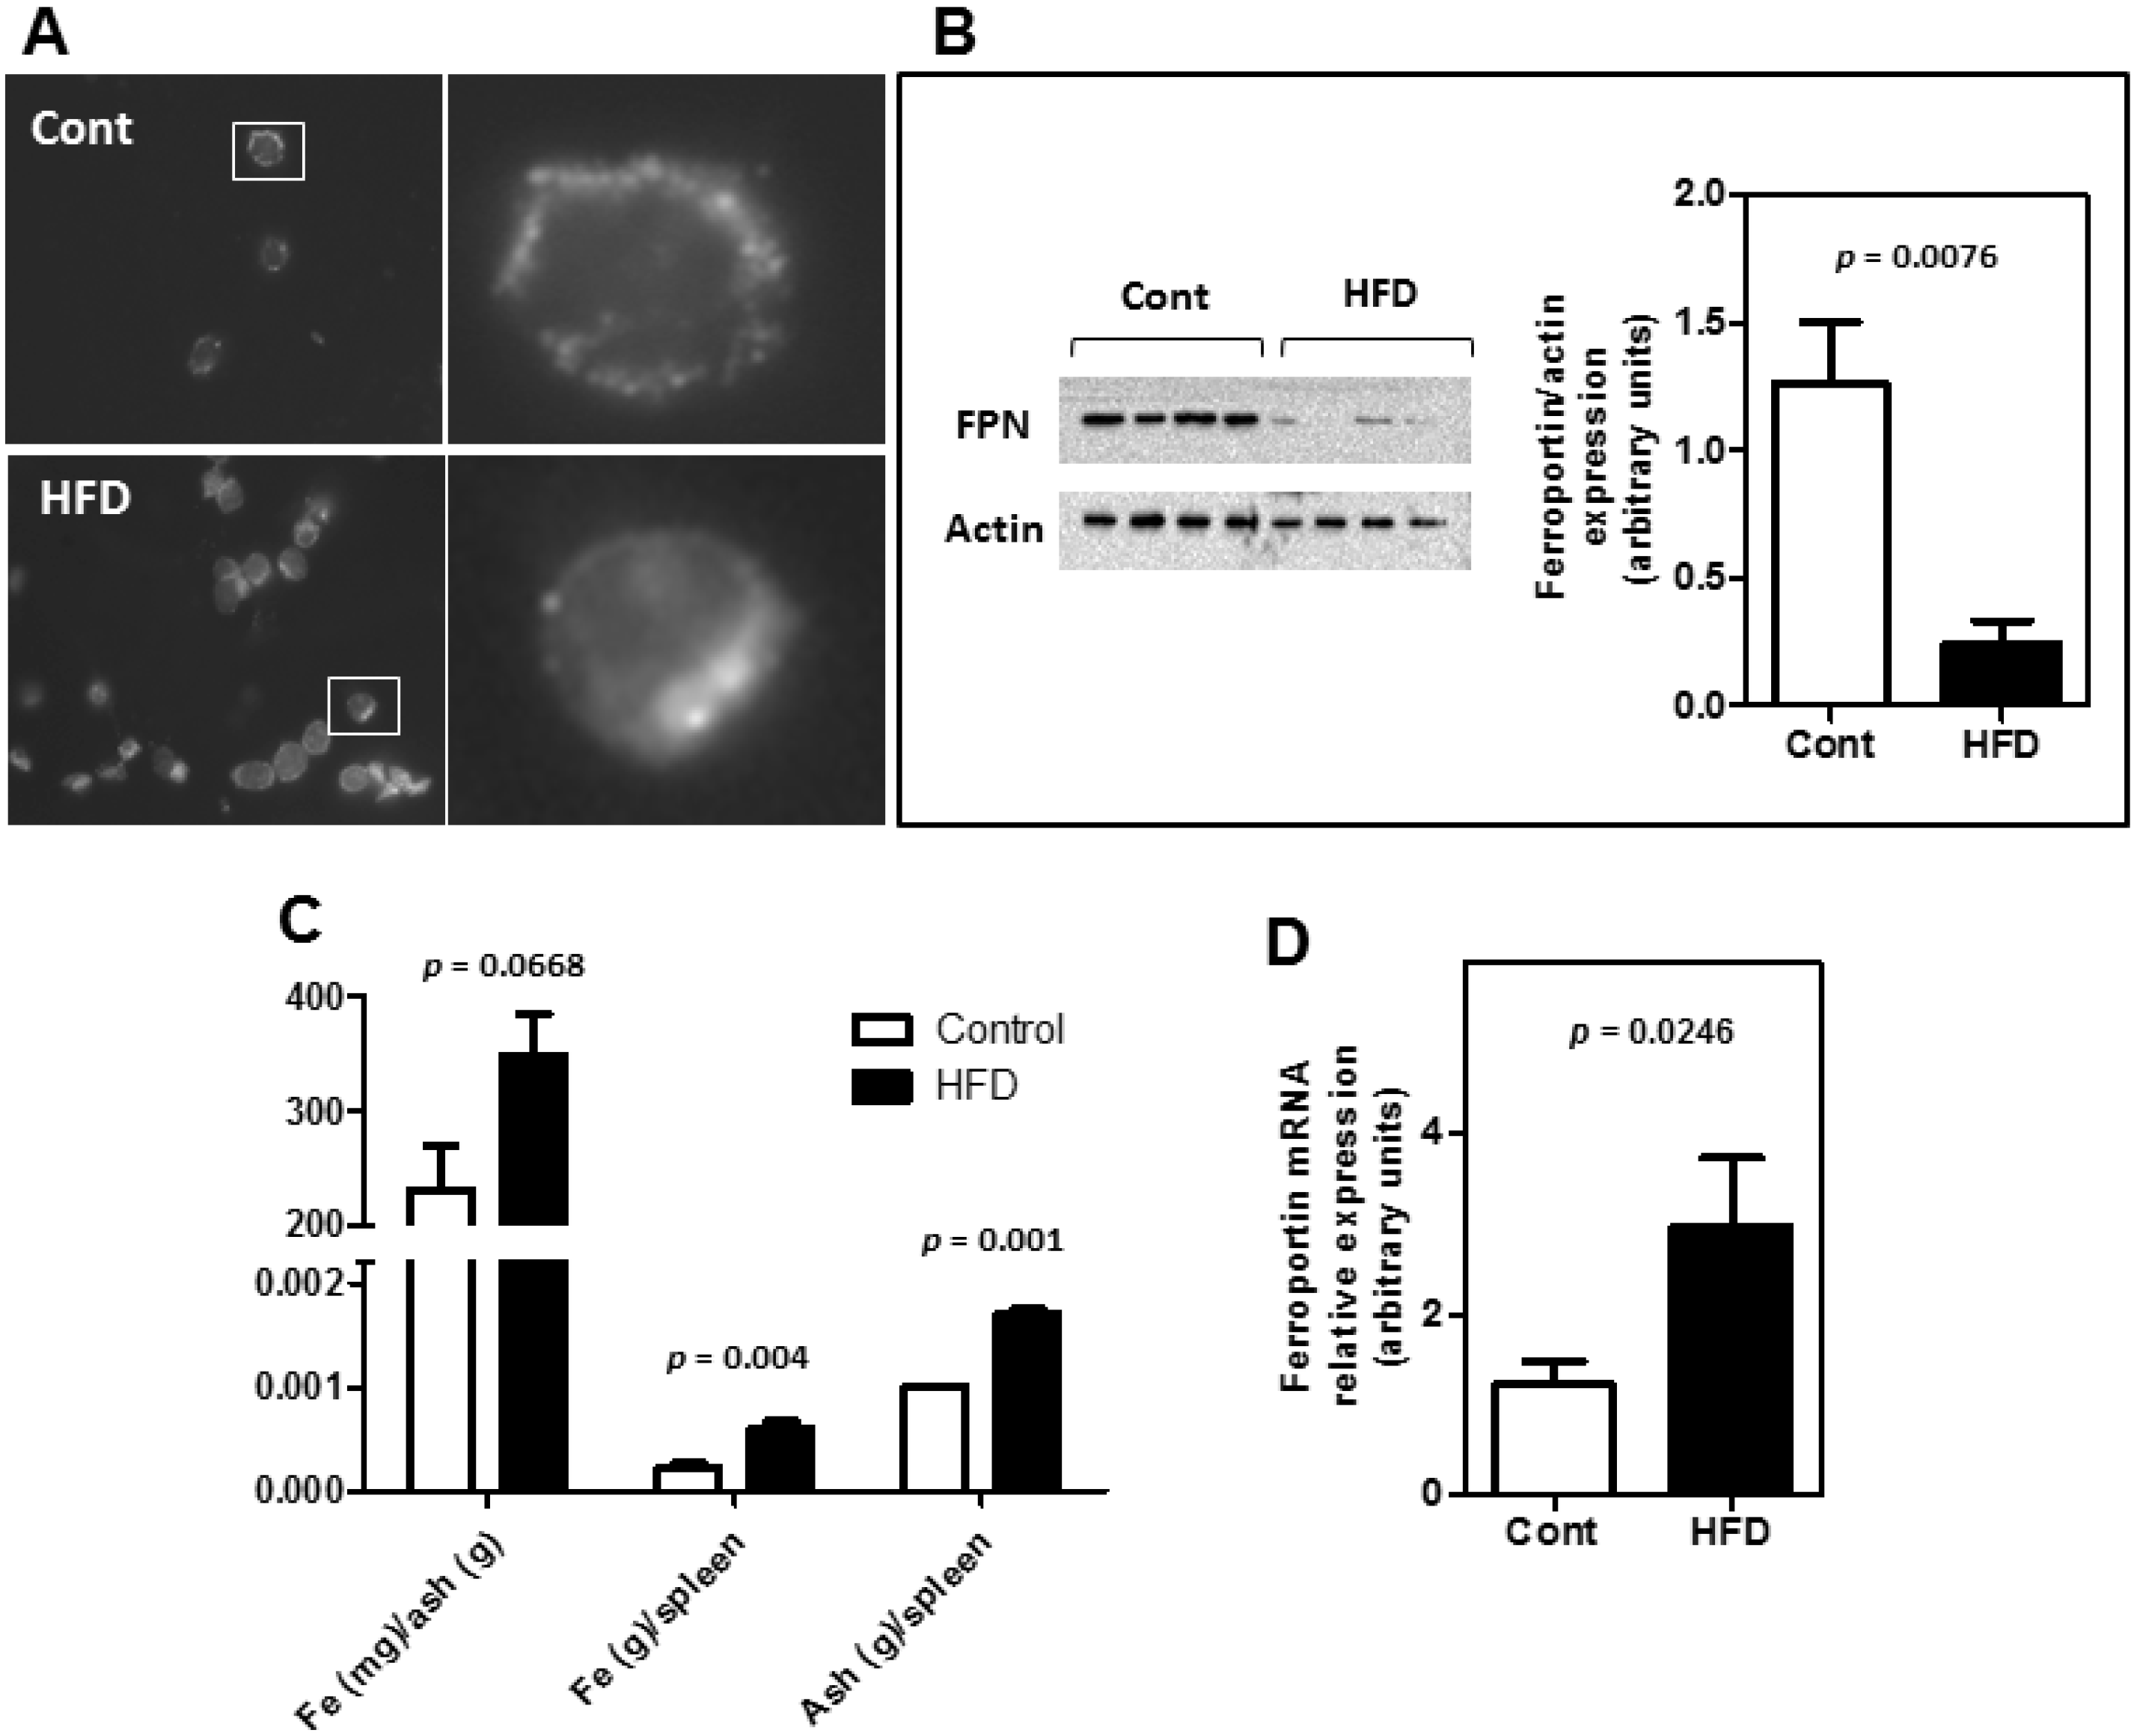
3.2. Obesity Altered the Bioavailability of Hepatic and Splenic Iron
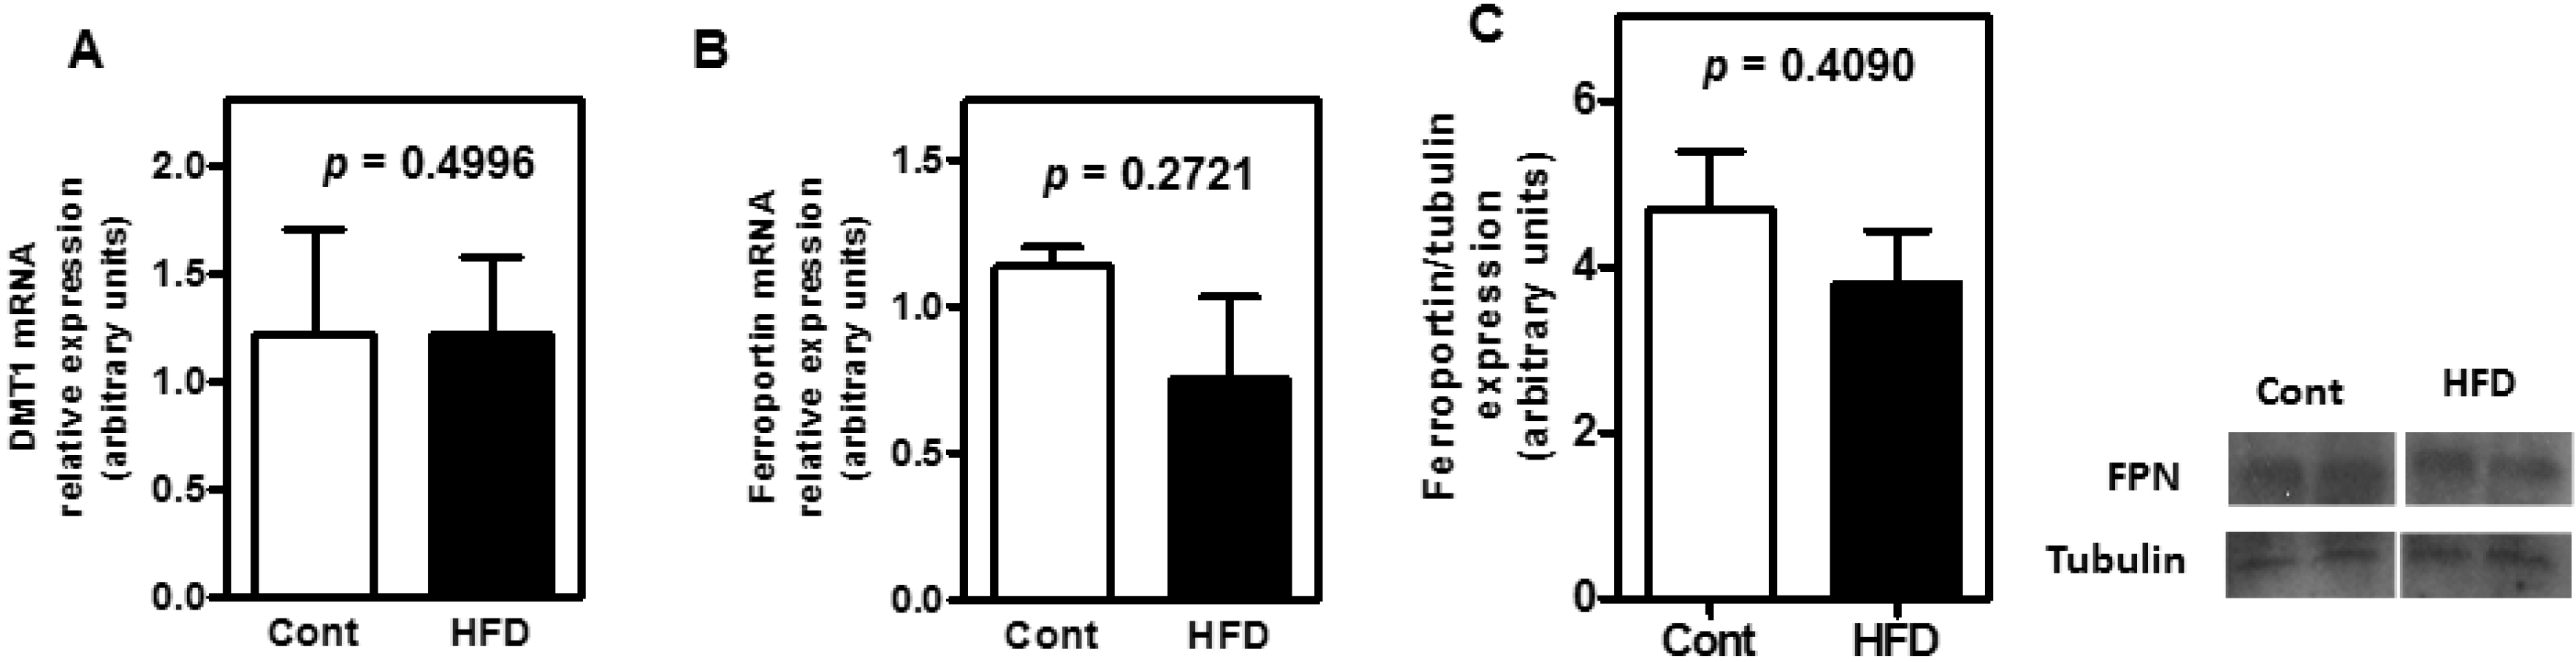
3.3. The Expression of Key Molecules Involved with Intestinal Iron Absorption Was Not Altered by Obesity
4. Discussion
5. Conclusions

Supplementary Files
Supplementary File 1Acknowledgments
Author Contributions
Conflicts of Interest
References
- Nemeth, E.; Tuttle, M.S.; Powelson, J.; Vaughn, M.B.; Donovan, A.; Ward, D.M.; Ganz, T.; Kaplan, J. Hepcidin regulates cellular iron efflux by binding to ferroportin and inducing its internalization. Science 2004, 306, 2090–2093. [Google Scholar] [PubMed]
- Nead, K.G.; Halterman, J.S.; Kaczorowski, J.M.; Auinger, P.; Weitzman, M. Overweight children and adolescents: A risk group for iron deficiency. Pediatric 2004, 114, 104–108. [Google Scholar] [CrossRef]
- Lecube, A.; Carrera, A.; Losada, E.; Hernández, C.; Simó, R.; Mesa, J. Iron deficiency in obese postmenopausal women. Obesity 2006, 14, 1724–1730. [Google Scholar] [CrossRef] [PubMed]
- Amato, A.; Santoro, N.; Calabrò, P.; Grandone, A.; Swinkels, D.W.; Perrone, L.; del Giudice, E.M. Effect of body mass index reduction on serum hepcidin levels and iron status in obese children. Int. J. Obes. 2010, 34, 1772–1774. [Google Scholar] [CrossRef]
- Aeberli, I.; Hurrell, R.F.; Zimmermann, M.B. Overweight children have higher circulating hepcidin concentrations and lower iron status but have dietary iron intakes and bioavailability comparable with normal weight children. Int. J. Obes. 2009, 33, 1111–1117. [Google Scholar] [CrossRef]
- Aigner, E.; Feldman, A.; Datz, C. Obesity as an emerging risk factor for iron deficiency. Nutrients 2014, 6, 3587–3600. [Google Scholar] [CrossRef] [PubMed]
- Dongiovanni, P.; Fracanzani, A.L.; Fargion, S.; Valenti, L. Iron in fatty liver and in the metabolic syndrome: A promising therapeutic target. J. Hepatol. 2011, 55, 920–932. [Google Scholar] [CrossRef] [PubMed]
- Vecchi, C.; Montosi, G.; Zhang, K.; Lamberti, I.; Duncan, S.A.; Kaufman, R.J.; Pietrangelo, A. ER stress controls iron metabolism through induction of hepcidin. Science 2009, 325, 877–880. [Google Scholar] [CrossRef] [PubMed]
- Oliveira, S.J.; Pinto, J.P.; Picarote, G.; Costa, V.M.; Carvalho, F.; Rangel, M.; de Sousa, M.; de Almeida, S.F. ER stress-inducible factor CHOP affects the expression of hepcidin by modulating C/EBPalpha activity. PLoS One 2009, 4. [Google Scholar] [CrossRef] [PubMed]
- Fischer-Posovszky, P.; Wabitsch, M.; Hochberg, Z. Endocrinology of adipose tissue—An update. Horm. Metab. Res. 2007, 39, 314–321. [Google Scholar] [CrossRef] [PubMed]
- Chung, B.; Matak, P.; McKie, A.T.; Sharp, P. Leptin increases the expression of the iron regulatory hormone hepcidin in HuH7 human hepatoma cells. J. Nutr. 2007, 137, 2366–2370. [Google Scholar] [PubMed]
- Shi, Y.; Taylor, S.I.; Tan, S.L.; Sonenberg, N. When translation meets metabolism: Multiple links to diabetes. Endocr. Rev. 2003, 24, 91–101. [Google Scholar] [CrossRef] [PubMed]
- Shi, Y.; Vattem, K.M.; Sood, R.; An, J.; Liang, J.; Stramm, L.; Wek, R.C. Identification and characterization of pancreatic eukaryotic initiation factor 2 alpha-subunit kinase, PEK, involved in translational control. Mol. Cell. Biol. 1998, 18, 7499–7509. [Google Scholar] [PubMed]
- Harding, H.P.; Zhang, Y.; Ron, D. Protein translation and folding are coupled by an endoplasmic-reticulum-resident kinase. Nature 1999, 397, 271–274. [Google Scholar] [CrossRef] [PubMed]
- Gregorio, B.M.; Souza-Mello, V.; Carvalho, J.J.; Mandarim-de-Lacerda, C.A.; Aguila, M.B. Maternal high-fat intake predisposes nonalcoholic fatty liver disease in C57BL/6 offspring. Am. J. Obstet. Gynecol. 2010, 203, 1–8. [Google Scholar] [CrossRef] [PubMed]
- Wahlang, B.; Falkner, K.C.; Gregory, B.; Ansert, D.; Young, D.; Conklin, D.J.; Bhatnagar, A.; McClain, C.J.; Cave, M. Polychlorinated biphenyl 153 is a diet-dependent obesogen that worsens nonalcoholic fatty liver disease in male C57BL6/J mice. J. Nutr. Biochem. 2013, 24, 1587–1595. [Google Scholar] [CrossRef] [PubMed]
- Bradford, M. A rapid and sensitive method for quantification of microgram quantities of protein utilizing the principle—Dye binding. Anal. Biochem. 1976, 72, 48–54. [Google Scholar] [CrossRef]
- Heuff, G.; Meyer, S.; Beelen, R. Isolation of rat and human Kupffer cells by a modified enzymatic assay. J. Immunol. Methods 1994, 174, 61–65. [Google Scholar] [CrossRef] [PubMed]
- Nascimento-Silva, V.; Arruda, M.A.; Barja-Fidalgo, C.; Fierro, I.M. Aspirin-triggered lipoxin A4 blocks reactive oxygen species generation in endothelial cells: A novel antioxidative mechanism. Thromb. Haemost. 2007, 97, 88–98. [Google Scholar] [PubMed]
- Arruda, S.F.; Siqueira, E.M.A.; Valência, F.F. Vitamin A deficiency increases hepcidin expression and oxidative stress in rat. Nutrition 2009, 25, 472–478. [Google Scholar] [CrossRef] [PubMed]
- Citelli, M.; Bittencourt, L.L.; da Silva, S.V.; Pierucci, A.P.; Pedrosa, C. Vitamin A modulates the expression of genes involved in iron bioavailability. Biol. Trace Elem. Res. 2012, 149, 64–70. [Google Scholar] [CrossRef] [PubMed]
- Akiyama, M.; Liew, C.W.; Lu, S.; Hu, J.; Martinez, R.; Hambro, B.; Kennedy, R.T.; Kulkarni, R.N. X-box binding protein 1 is essential for insulin regulation of pancreatic α-cell function. Diabetes 2013, 62, 2439–2449. [Google Scholar] [CrossRef] [PubMed]
- Pierre, N.; Deldicque, L.; Barbé, C.; Naslain, D.; Cani, P.D.; Francaux, M. Toll-like receptor 4 knockout mice are protected against endoplasmic reticulum stress induced by a high-fat diet. PLoS One 2013, 8. [Google Scholar] [CrossRef] [PubMed]
- Delaby, C.; Pilard, N.; Puy, H.; Canonne-Hergaux, F. Sequential regulation of ferroportin expression after erythrophagocytosis in murine macrophages: Early mRNA induction by haem, followed by iron-dependent protein expression. Biochem. J. 2008, 411, 123–131. [Google Scholar] [CrossRef] [PubMed]
- Knutson, M.D.; Vafa, M.R.; Haile, D.J.; Wessling-Resnick, M. Iron loading and erythrophagocytosis increase ferroportin 1 (FPN1) expression in J774 macrophages. Blood 2003, 102, 4191–4207. [Google Scholar] [CrossRef] [PubMed]
- Chaston, T.; Chung, B.; Mascarenhas, M.; Marks, J.; Patel, B.; Srai, S.K.; Sharp, P. Evidence for differential effects of hepcidin in macrophages and intestinal epithelial cells. Gut 2008, 57, 374–382. [Google Scholar] [CrossRef] [PubMed]
- Zimmermann, M.B.; Zeder, C.; Muthayya, S.; Winichagoon, P.; Chaouki, N.; Aeberli, I.; Hurrell, R.F. Adiposity in women and children from transition countries predicts decreased iron absorption, iron deficiency and a reduced response to iron fortification. Int. J. Obes. 2008, 32, 1098–1104. [Google Scholar] [CrossRef]
- Mujica-Coopman, M.F.; Brito, A.; López de Romaña, D.; Pizarro, F.; Olivares, M. Body mass index, iron absorption and iron status in childbearing age women. J. Trace Elem. Med. Biol. 2014, 28. [Google Scholar] [CrossRef]
- Burke, R.M.; Leon, J.S.; Suchdev, P.S. Identification, prevention and treatment of iron deficiency during the first 1000 days. Nutrients 2014, 6, 4093–4114. [Google Scholar] [CrossRef] [PubMed]
- Chung, J.; Kim, M.S.; Han, S.N. Diet-induced obesity leads to decreased hepatic iron storage in mice. Nutr. Res. 2011, 31, 915–921. [Google Scholar] [CrossRef] [PubMed]
- Le Guenno, G.; Chanséaume, E.; Ruivard, M.; Morio, B.; Mazur, A. Study of iron metabolism disturbances in an animal model of insulin resistance. Diabetes Res. Clin. Pract. 2007, 77, 363–370. [Google Scholar] [CrossRef] [PubMed]
- Orr, J.S.; Kennedy, A.; Anderson-Baucum, E.K.; Webb, C.D.; Fordahl, S.C.; Erikson, K.M.; Zhang, Y.; Etzerodt, A.; Moestrup, S.K.; Hasty, A.H. Obesity alters adipose tissue macrophage iron content and tissue iron distribution. Diabetes 2014, 63, 421–432. [Google Scholar] [CrossRef] [PubMed]
- Sonnweber, T.; Ress, C.; Nairz, M.; Theurl, I.; Schroll, A.; Murphy, A.T.; Wroblewski, V.; Witcher, D.R.; Moser, P.; Ebenbichler, C.F.; et al. High-fat diet causes iron deficiency via hepcidin-independent reduction of duodenal iron absorption. J. Nutr. Biochem. 2012, 23, 1600–1608. [Google Scholar] [CrossRef] [PubMed]
- Ahmed, U.; Oates, P.S. Dietary fat level affects tissue iron levels but not the iron regulatory gene HAMP in rats. Nutr. Res. 2013, 33, 126–135. [Google Scholar] [CrossRef] [PubMed]
© 2015 by the authors; licensee MDPI, Basel, Switzerland. This article is an open access article distributed under the terms and conditions of the Creative Commons Attribution license (http://creativecommons.org/licenses/by/4.0/).
Share and Cite
Citelli, M.; Fonte-Faria, T.; Nascimento-Silva, V.; Renovato-Martins, M.; Silva, R.; Luna, A.S.; Silva, S.V.d.; Barja-Fidalgo, C. Obesity Promotes Alterations in Iron Recycling. Nutrients 2015, 7, 335-348. https://doi.org/10.3390/nu7010335
Citelli M, Fonte-Faria T, Nascimento-Silva V, Renovato-Martins M, Silva R, Luna AS, Silva SVd, Barja-Fidalgo C. Obesity Promotes Alterations in Iron Recycling. Nutrients. 2015; 7(1):335-348. https://doi.org/10.3390/nu7010335
Chicago/Turabian StyleCitelli, Marta, Thaís Fonte-Faria, Vany Nascimento-Silva, Mariana Renovato-Martins, Raphael Silva, Aderval Severino Luna, Simone Vargas da Silva, and Christina Barja-Fidalgo. 2015. "Obesity Promotes Alterations in Iron Recycling" Nutrients 7, no. 1: 335-348. https://doi.org/10.3390/nu7010335
APA StyleCitelli, M., Fonte-Faria, T., Nascimento-Silva, V., Renovato-Martins, M., Silva, R., Luna, A. S., Silva, S. V. d., & Barja-Fidalgo, C. (2015). Obesity Promotes Alterations in Iron Recycling. Nutrients, 7(1), 335-348. https://doi.org/10.3390/nu7010335