Fruit and Vegetable Intake and Body Mass Index in a Large Sample of Middle-Aged Australian Men and Women

 ,
, 
Abstract
:1. Introduction
2. Experimental Section
2.1. Study Population
2.2. Materials
2.3. Statistical Analysis
3. Results

| Men | Women | Total | |
|---|---|---|---|
| (n = 116,029) | (n = 130,966) | (n = 246,995) | |
| (%) | (%) | (%) | |
| Age (year) | |||
| 45–49 | (9.8) | (13.1) | (11.6) |
| 50–59 | (30.7) | (35.9) | (33.5) |
| 60–69 | (29.3) | (27.5) | (28.4) |
| 70–79 | (18.5) | (14.2) | (16.2) |
| 80–89 | (10.9) | (8.5) | (9.6) |
| 90+ | (0.7) | (0.8) | (0.8) |
| Place of Residence | |||
| Major city | (46.3) | (44.2) | (45.2) |
| Inner regional | (34.4) | (35.9) | (35.2) |
| Outer regional | (17.4) | (17.9) | (17.7) |
| Remote | (1.9) | (2.0) | (2.0) |
| Highest Educational Qualification | |||
| No qualification | (10.5) | (12.0) | (11.3) |
| School leaving certificate | (24.8) | (37.8) | (31.7) |
| Trade/certificate | (37.8) | (26.8) | (32.0) |
| University | (25.3) | (22.1) | (23.6) |
| Missing | (1.5) | (1.4) | (1.4) |
| Marital Status | |||
| Single | (5.9) | (5.4) | (5.7) |
| Married | (74.7) | (64.7) | (69.4) |
| Partner | (5.5) | (5.4) | (5.4) |
| Widowed | (4.8) | (11.8) | (8.5) |
| Divorced | (5.5) | (9.5) | (7.6) |
| Separated | (2.7) | (2.9) | (2.8) |
| Missing | (1.0) | (0.4) | (0.6) |
| Men n = 116,029 n (%) | Women
n = 130,966 n (%) | Total n = 246,995 n (%) | |
|---|---|---|---|
| Fruit Intake | |||
| <2 servings/daily (Low) | 54,546 (47.0) | 44,397 (33.9) | 98,943 (40.1) |
| ≥2 servings/daily (Adequate) | 51,452 (44.3) | 77,876 (59.5) | 129,328 (52.4) |
| Missing * | 10,031 (8.6) | 8693 (6.6) | 18,724 (7.6) |
| Vegetable Intake | |||
| <5 servings/daily (Low) | 86,664 (74.7) | 77,878 (59.5) | 164,542 (66.6) |
| ≥5 servings/daily (Adequate) | 19,623 (16.9) | 37,442 (28.6) | 57,065 (23.1) |
| Missing * | 9742 (8.4) | 15,646 (11.9) | 25,388 (10.3) |
| Fruit and Vegetable Intake (“2 & 5”) | |||
| Low (<2F and/or <5V) | 88,171 (76.0) | 84,331 (64.4) | 172,502 (69.8) |
| Adequate (at least 2F and 5V) | 11,308 (9.7) | 26,101 (19.9) | 37 409 (15.1) |
| Missing * | 16,550 (14.3) | 20,534 (15.7) | 37,084 (15.0) |
| Body Mass Index | |||
| Underweight (BMI <18.5) | 867 (0.7) | 2494 (1.9) | 3361 (1.4) |
| Normal weight (BMI 18.5–24.9) | 35,118 (30.3) | 53,781 (41.1) | 88,899 (36.0) |
| Overweight (BMI 25–29.9) | 54,719 (47.2) | 44,346 (33.9) | 99,065 (40.1) |
| Obese (BMI ≥ 30) | 25,325 (21.8) | 30,345 (23.2) | 55,670 (22.5) |

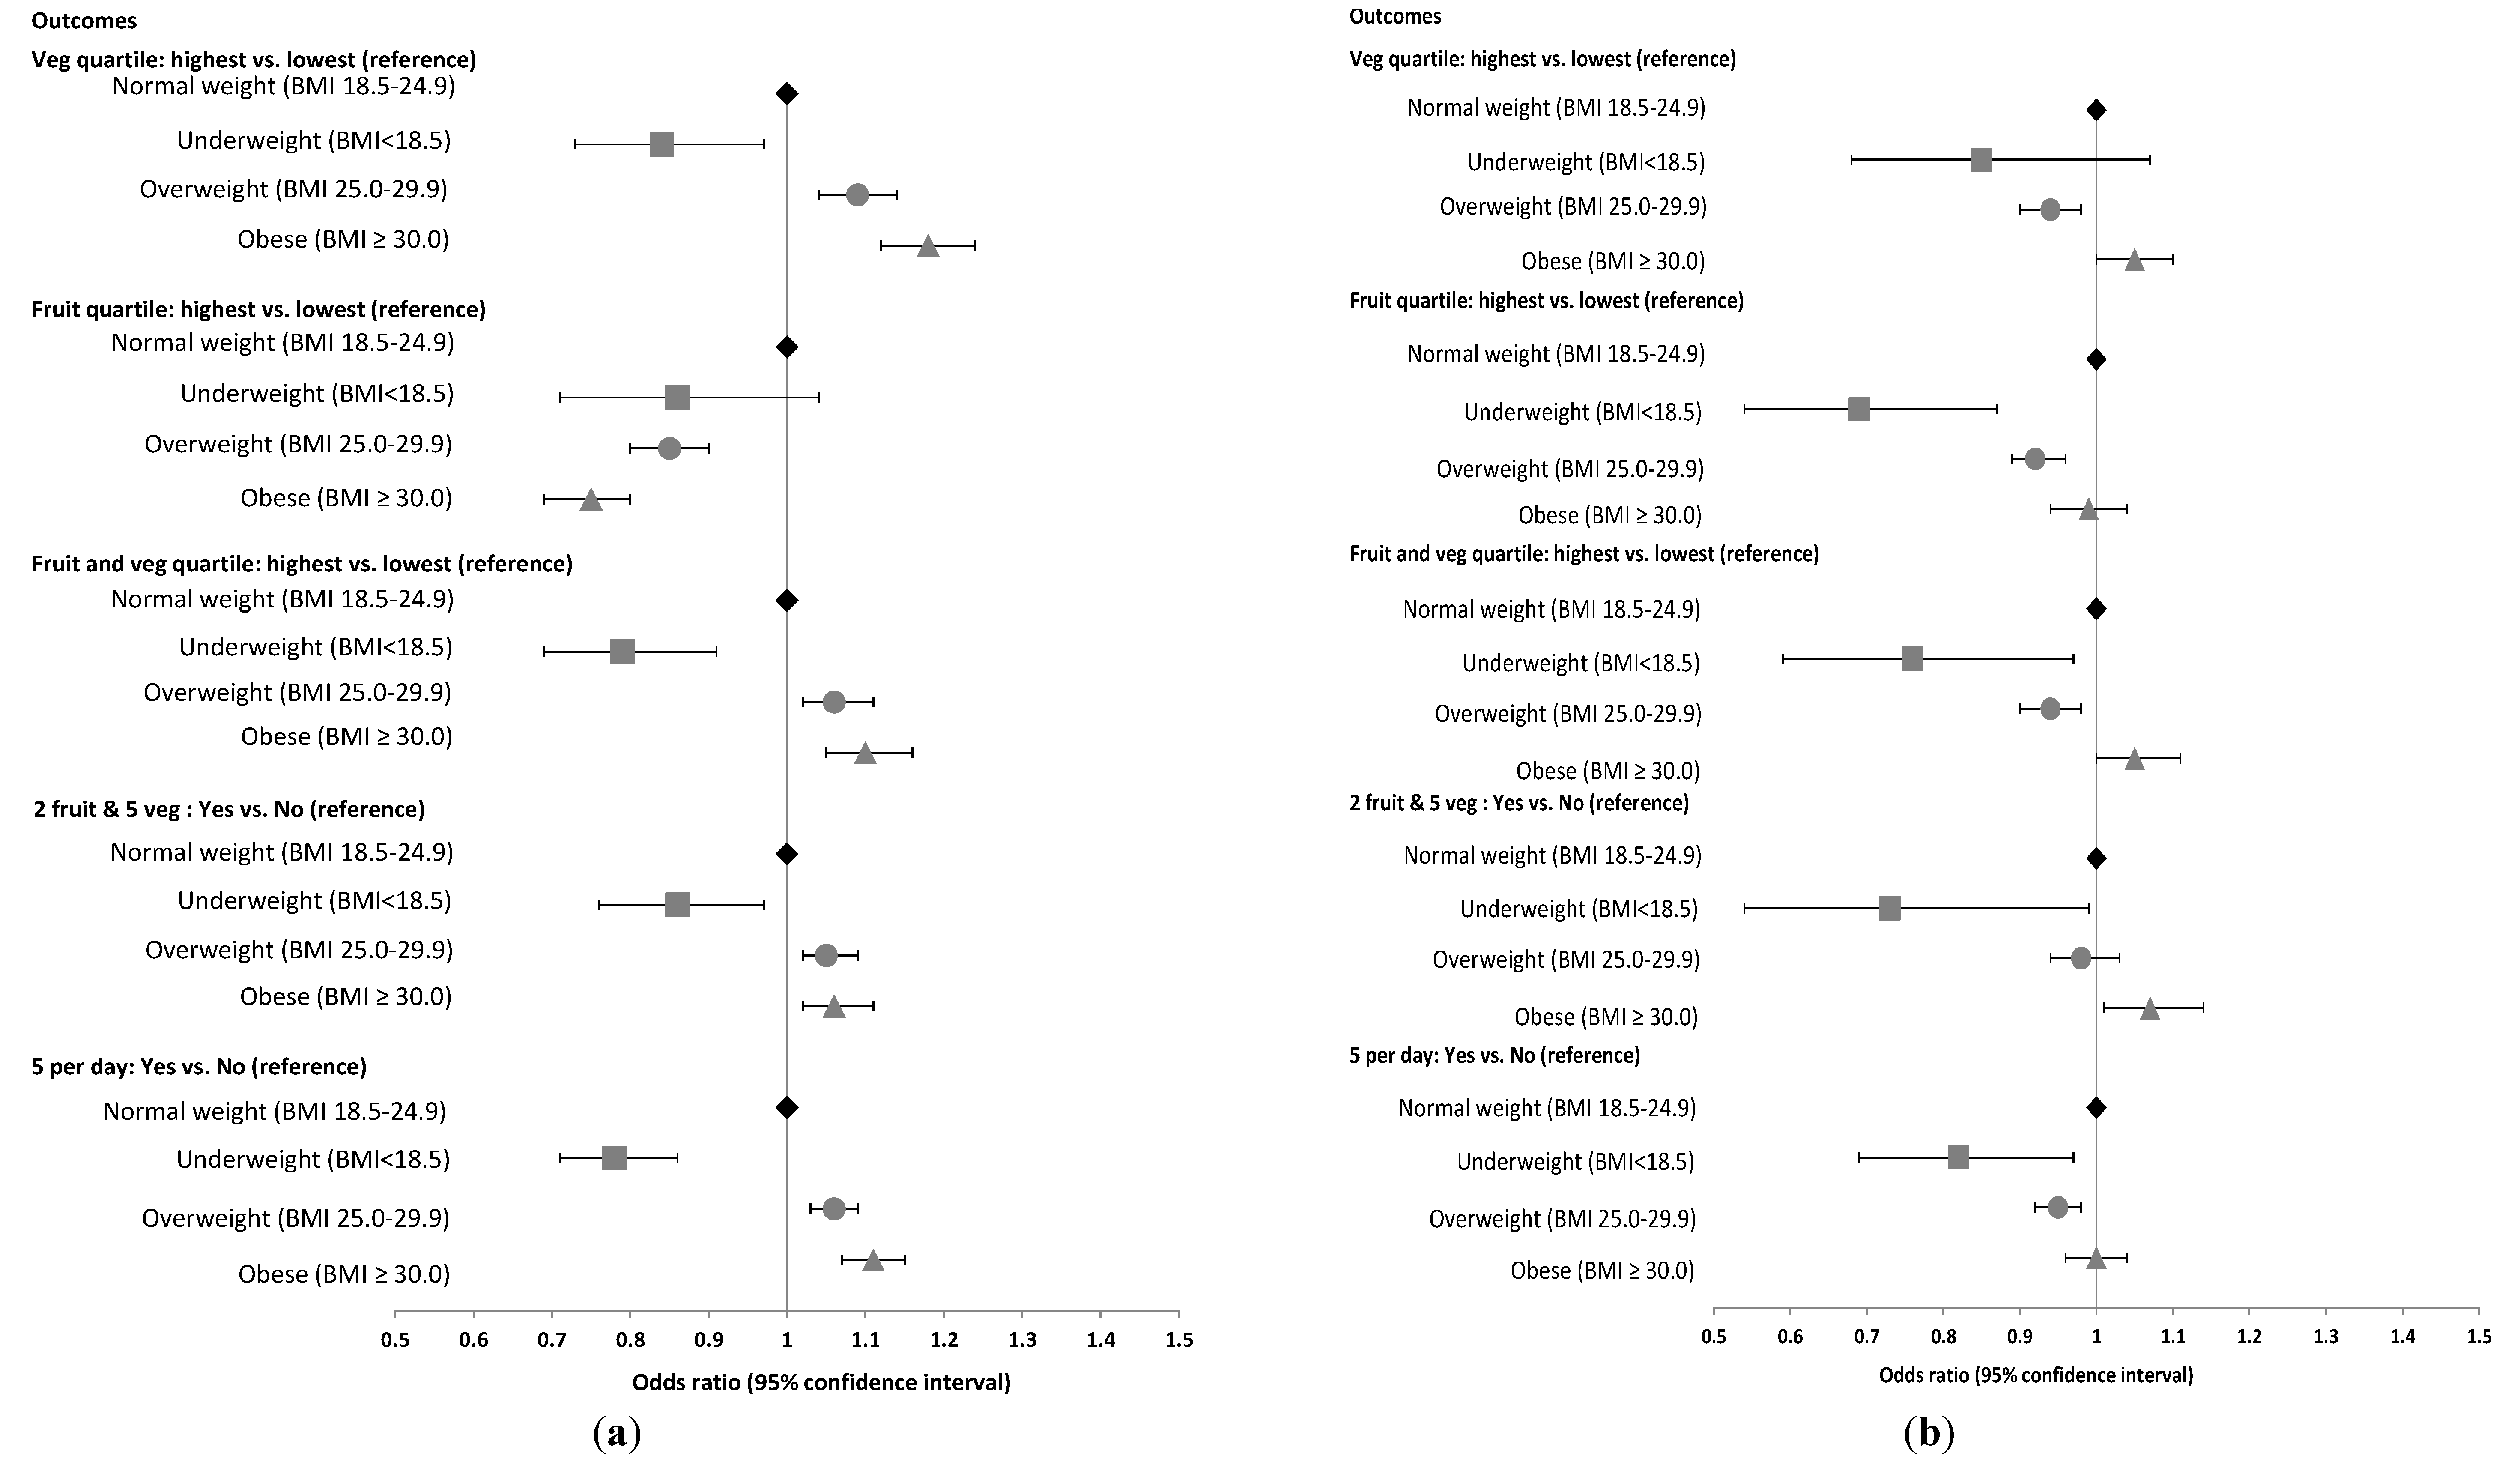
| Highest Vegetable Quartile | Highest Fruit Quartile | Highest F & V Quartile | 2F & 5V = Yes | 5 Per Day = Yes | |
|---|---|---|---|---|---|
| OR (95% CI) | OR (95% CI) | OR (95% CI) | OR (95% CI) | OR (95% CI) | |
| BMI categories—Women | |||||
| Normal weight * (BMI 18.5–24.9) | 1 | 1 | 1 | 1 | 1 |
| Underweight (BMI < 18.5) | 0.84 (0.73; 0.97) | 0.86 (0.71; 1.04) | 0.79 (0.69; 0.91) | 0.86 (0.76; 0.97) | 0.78 (0.71; 0.86) |
| Overweight (BMI 25.0–29.9) | 1.09 (1.04; 1.14) | 0.85 (0.80; 0.90) | 1.06 (1.02; 1.11) | 1.05 (1.02; 1.09) | 1.06 (1.03; 1.09) |
| Obese (BMI ≥ 30.0) | 1.18 (1.12; 1.24) | 0.75 (0.69; 0.80) | 1.10 (1.05; 1.16) | 1.06 (1.02, 1.11) | 1.11 (1.07; 1.15) |
| BMI categories—Men | |||||
| Normal weight * (BMI 18.5–24.9) | 1 | 1 | 1 | 1 | 1 |
| Underweight (BMI < 18.5) | 0.85 (0.68; 1.07) | 0.69 (0.54; 0.87) | 0.76 (0.59; 0.97) | 0.73 (0.54; 0.99) | 0.82 (0.69; 0.97) |
| Overweight (BMI 25.0–29.9) | 0.94 (0.90; 0.98) | 0.92 (0.89; 0.96) | 0.94 (0.90; 0.98) | 0.98 (0.94; 1.03) | 0.95 (0.92; 0.98) |
| Obese (BMI ≥ 30.0) | 1.05 (1.00; 1.10) | 0.99 (0.94; 1.04) | 1.05 (1.00; 1.11) | 1.07 (1.01; 1.14) | 1.00 (0.96; 1.04) |
4. Discussion
5. Conclusions
Acknowledgments
Author Contributions
Conflicts of Interest
References
- WHO. Obesity and Overweight; World Health Organization: Geneva, Switzerland, 2006. [Google Scholar]
- World Health Organization. Diet, Nutrition and the Prevention of Chronic Diseases: Report of a Joint Who/Fao Expert Consultation; World Health Organization: Geneva, Switzerland, 2003. [Google Scholar]
- World Cancer Research Fund; American Institute for Cancer Research. Food, Nutrition, Physical Activity, and the Prevention of Cancer: A Global Perspective; AICR: Washington, DC, USA, 2007. [Google Scholar]
- Pomerleau, J.; Lock, K.; McKee, M.; Altmann, D.R. The challenge of measuring global fruit and vegetable intake. J. Nutr. 2004, 134, 1175–1180. [Google Scholar]
- Cameron, A.J.; Welborn, T.A.; Zimmet, P.Z.; Dunstan, D.W.; Owen, N.; Salmon, J.; Dalton, M.; Jolley, D.; Shaw, J.E. Overweight and obesity in australia: The 1999–2000 australian diabetes, obesity and lifestyle study (ausdiab). Med. J. Aust. 2003, 178, 427–432. [Google Scholar]
- Colagiuri, S.; Lee, C.M.Y.; Colagiuri, R.; Magliano, D.; Shaw, J.E.; Zimmet, P.Z.; Caterson, I.D. The cost of overweight and obesity in australia. Med. J. Aust. 2010, 192, 260–264. [Google Scholar]
- Obesity Update. Available online: http://www.oecd.org/els/health-systems/Obesity-Update-2014.pdf (accessed on 10 June 2014).
- WHO. Obesity: Preventing and Managing the Global Epidemic, Report of a WHO Consultation (WHO Technical Report Series 894); World Health Organization: Geneva, Switzerland, 2000; p. 252. [Google Scholar]
- Lim, S.S.; Vos, T.; Flaxman, A.D.; Danaei, G.; Shibuya, K.; Adair-Rohani, H.; AlMazroa, M.A.; Amann, M.; Anderson, H.R.; Andrews, K.G.; et al. A comparative risk assessment of burden of disease and injury attributable to 67 risk factors and risk factor clusters in 21 regions, 1990–2010: A systematic analysis for the global burden of disease study 2010. Lancet 2012, 380, 2224–2260. [Google Scholar] [CrossRef]
- Kellet, E.; Smith, A.; Schmerlaib, Y. The Australian Guide to Healthy Eating; Australian Government Department of Health and Ageing: Canberra, Australia, 1998. [Google Scholar]
- U.S. Department of Health and Human Services; U.S. Department of Agriculture. Dietary Guidelines for Americans, 2005, 6th ed.; U.S. Government Printing Office: Washington, DC, USA, 2005. [Google Scholar]
- Pollard, C.M.; Miller, M.R.; Daly, A.M.; Crouchley, K.E.; O’Donoghue, K.J.; Lang, A.J.; Binns, C.W. Increasing fruit and vegetable consumption: Success of the western australian go for 2 & 5® campaign. Public Health Nutr. 2008, 11, 314–320. [Google Scholar]
- Beer-Borst, S.; Hercberg, S.; Morabia, A.; Bernstein, M.S.; Galan, P.; Galasso, R.; Giampaoli, S.; McCrum, E.; Panico, S.; Preziosi, P.; et al. Dietary patterns in six european populations: Results from euralim, a collaborative European data harmonization and information campaign. Eur. J. Clin. Nutr. 2000, 54, 253–262. [Google Scholar] [CrossRef]
- Milligan, R.A.K.; Burke, V.; Beilin, L.J.; Dunbar, D.L.; Spencer, M.J.; Balde, E.; Gracey, M.P. Influence of gender and socio-economic status on dietary patterns and nutrient intakes in 18-year-old australians. Aust. N. Z. J. Public Health 1998, 22, 485–493. [Google Scholar]
- Prättälä, R.; Paalanen, L.; Grinberga, D.; Helasoja, V.; Kasmel, A.; Petkeviciene, J. Gender differences in the consumption of meat, fruit and vegetables are similar in finland and the baltic countries. Eur. J. Public Health 2007, 17, 520–525. [Google Scholar] [CrossRef]
- Riediger, N.D.; Moghadasian, M.H. Patterns of fruit and vegetable consumption and the influence of sex, age and socio-demographic factors among canadian elderly. J. Am. Coll. Nutr. 2008, 27, 306–313. [Google Scholar] [CrossRef]
- Schroder, K.E.E. Effects of fruit consumption on body mass index and weight loss in a sample of overweight and obese dieters enrolled in a weight-loss intervention trial. Nutrition 2010, 26, 727–734. [Google Scholar] [CrossRef]
- Banks, E.; Redman, S.; Jorm, L.; Armstrong, B.; Bauman, A.; Beard, J.; Beral, V.; Byles, J.; Corbett, S.; Cumming, R.; et al. Cohort profile: The 45 and up study. Int. J. Epidemiol. 2008, 37, 941–947. [Google Scholar] [CrossRef]
- Rolls, B.J.; Ello-Martin, J.A.; Tohill, B.C. What can intervention studies tell us about the relationship between fruit and vegetable consumption and weight management? Nutr. Rev. 2004, 62, 1–17. [Google Scholar] [CrossRef]
- Sartorelli, D.S.; Franco, L.J.; Cardoso, M.A. High intake of fruits and vegetables predicts weight loss in brazilian overweight adults. Nutr. Res. 2008, 28, 233–238. [Google Scholar] [CrossRef]
- Oliveira, M.; Sichieri, R.; Moura, A. Weight loss associated with a daily intake of three apples or three pears among overweight women. Nutrition 2003, 19, 253–256. [Google Scholar] [CrossRef]
- He, K.; Hu, F.B.; Colditz, G.A.; Manson, J.E.; Willett, W.C.; Liu, S. Changes in intake of fruits and vegetables in relation to risk of obesity and weight gain among middle-aged women. Int. J. Obes. 2004, 28, 1569–1574. [Google Scholar] [CrossRef]
- Vioque, J.; Weinbrenner, T.; Castello, A.; Asensio, L.; de la Hera, M.G. Intake of fruits and vegetables in relation to 10-year weight gain among spanish adults. Obesity 2008, 16, 664–670. [Google Scholar] [CrossRef]
- Te Velde, S.J.; Twisk, J.W.R.; Brug, J. Tracking of fruit and vegetable consumption from adolescence into adulthood and its longitudinal association with overweight. Br. J. Nutr. 2007, 98, 431–438. [Google Scholar] [CrossRef]
- Field, A.E.; Gillman, M.W.; Rosner, B.; Rockett, H.R.; Colditz, G.A. Association between fruit and vegetable intake and change in body mass index among a large sample of children and adolescents in the united states. Int. J. Obes. 2003, 27, 821–826. [Google Scholar] [CrossRef]
- Heo, M.; Kim, R.S.; Wylie-Rosett, J.; Allison, D.B.; Heymsfield, S.B.; Faith, M.S. Inverse association between fruit and vegetable intake and bmi even after controlling for demographic, socioeconomic and lifestyle factors. Obes. Facts 2011, 4, 449–455. [Google Scholar] [CrossRef]
- Drapeau, V.; Despres, J.P.; Bouchard, C.; Allard, L.; Fournier, G.; Leblanc, C.; Tremblay, A. Modifications in food-group consumption are related to long-term body-weight changes. Am. J. Clin. Nutr. 2004, 80, 29–37. [Google Scholar]
- Giskes, K.; Turrell, G.; Patterson, C.; Newman, B. Socioeconomic differences among australian adults in consumption of fruit and vegetables and intakes of vitamins A, C and folate. J. Hum. Nutr. Diet. 2002, 15, 375–385. [Google Scholar] [CrossRef]
- Kamphuis, C.B.M.; Giskes, K.; de Bruijn, G.-J.; Wendel-Vos, W.; Brug, J.; van Lenthe, F.J. Environmental determinants of fruit and vegetable consumption among adults: A systematic review. Br. J. Nutr. 2006, 96, 620–635. [Google Scholar]
- Williams, L.; Ball, K.; Crawford, D. Why do some socioeconomically disadvantaged women eat better than others? An investigation of the personal, social and environmental correlates of fruit and vegetable consumption. Appetite 2010, 55, 441–446. [Google Scholar]
- Australian Bureau of Statistics. 4364.0.55.003 Australian Health Survey: Updated Results 2011–2012; ABS: Canberra, Australia, 2013.
- Hall, J.N.; Moore, S.; Harper, S.B.; Lynch, J.W. Global variability in fruit and vegetable consumption. Am. J. Prev. Med. 2009, 36, 402–409. [Google Scholar] [CrossRef]
- Henderson, L.; Gregory, J.; Swan, G. The National Diet & Nutrition Survey: Adults Aged 19 to 64 Years. Types and Quantities of Foods Consumed; The Stationery Office: Norwich, UK, 2002. [Google Scholar]
- Grimm, K.A.; Blanck, H.M.; Scanlon, K.S.; Moore, L.V.; Grummer-Strawn, L.M. State-specific trends in fruit and vegetable consumption among adults—United states, 2000–2009. MMWR 2010, 59, 1125–1130. [Google Scholar]
- Marks, G.C.; Webb, K.; Rutishauser, I.H.E.; Riley, M. Monitoring Food Habits in the Australian Population Using Short Questions; Commonwealth of Australia: Canberra, Australia, 2001. [Google Scholar]
- Price, G.M.; Paul, A.A.; Cole, T.J.; Wadsworth, M.E.J. Characteristics of the low-energy reporters in a longitudinal national dietary survey. Br. J. Nutr. 1997, 77, 833–851. [Google Scholar] [CrossRef]
- Miller, T.M.; Abdel-Maksoud, M.F.; Crane, L.A.; Marcus, A.C.; Byers, T.E. Effects of social approval bias on self-reported fruit and vegetable consumption: A randomized controlled trial. Nutr. J. 2008, 7, 18. [Google Scholar] [CrossRef]
- Bogaert, A.; McCreary, D. Masculinity and the distortion of self-reported height in men. Sex. Roles 2011, 65, 548–556. [Google Scholar] [CrossRef]
- Burton, N.W.; Brown, W.; Dobson, A. Accuracy of body mass index estimated from self-reported height and weight in mid-aged australian women. Aust. N. Z. J. Public Health 2010, 34, 620–623. [Google Scholar] [CrossRef]
- Gorber, S.C.; Tremblay, M.; Moher, D.; Gorber, B. A comparison of direct vs. Self-report measures for assessing height, weight and body mass index: A systematic review. Obes. Rev. 2007, 8, 307–326. [Google Scholar]
- Dhaliwal, S.S.; Howat, P.; Bejoy, T.; Welborn, T.A. Self-reported weight and height for evaluating obesity control programs. Am. J. Health Behav. 2010, 34, 489–499. [Google Scholar]
- Ng, S.P.; Korda, R.; Clements, M.; Latz, I.; Bauman, A.; Bambrick, H.; Liu, B.; Rogers, K.; Herbert, N.; Banks, E. Validity of self-reported height and weight and derived body mass index in middle-aged and elderly individuals in australia. Aust. N. Z. J. Public Health 2011, 35, 557–563. [Google Scholar] [CrossRef]
- Togo, P.; Osler, M.; Sorensen, T.I.; Heitmann, B.L. Food intake patterns and body mass index in observational studies. Int. J. Obes. Relat. Metab. Disord. 2001, 25, 1741–1751. [Google Scholar] [CrossRef]
© 2014 by the authors; licensee MDPI, Basel, Switzerland. This article is an open access article distributed under the terms and conditions of the Creative Commons Attribution license (http://creativecommons.org/licenses/by/3.0/).
Share and Cite
Charlton, K.; Kowal, P.; Soriano, M.M.; Williams, S.; Banks, E.; Vo, K.; Byles, J. Fruit and Vegetable Intake and Body Mass Index in a Large Sample of Middle-Aged Australian Men and Women. Nutrients 2014, 6, 2305-2319. https://doi.org/10.3390/nu6062305
Charlton K, Kowal P, Soriano MM, Williams S, Banks E, Vo K, Byles J. Fruit and Vegetable Intake and Body Mass Index in a Large Sample of Middle-Aged Australian Men and Women. Nutrients. 2014; 6(6):2305-2319. https://doi.org/10.3390/nu6062305
Chicago/Turabian StyleCharlton, Karen, Paul Kowal, Melinda M. Soriano, Sharon Williams, Emily Banks, Kha Vo, and Julie Byles. 2014. "Fruit and Vegetable Intake and Body Mass Index in a Large Sample of Middle-Aged Australian Men and Women" Nutrients 6, no. 6: 2305-2319. https://doi.org/10.3390/nu6062305
APA StyleCharlton, K., Kowal, P., Soriano, M. M., Williams, S., Banks, E., Vo, K., & Byles, J. (2014). Fruit and Vegetable Intake and Body Mass Index in a Large Sample of Middle-Aged Australian Men and Women. Nutrients, 6(6), 2305-2319. https://doi.org/10.3390/nu6062305