Influence of Posture and Frequency Modes in Total Body Water Estimation Using Bioelectrical Impedance Spectroscopy in Boys and Adult Males


Abstract
:1. Introduction
2. Experimental Section
2.1. Anthropometry
2.2. Bioelectrical Impedance Spectroscopy (BIS)
2.3. Deuterium Dilution Technique
3. Results

| Boys ( n = 23) Mean ± SE | Males ( n = 26) Mean ± SE | |
|---|---|---|
| Age (years) | 9.8 ± 0.5 | 36.9 ± 2.7 |
| Stature (cm) | 144.1 ± 3.2 | 174.3 ± 1.4 |
| Body weight (kg) | 36.6 ± 2.4 | 76.5 ± 3.2 |
| BMI (kg/m2) | 17.2 ± 0.5 | 25.0 ± 0.8 |
| WHtR | 0.44 ± 0.01 | 0.49 ± 0.01 |
| Boys (n = 23) Mean ± SE | Adult Males (n = 26) Mean ± SE | ||||||
|---|---|---|---|---|---|---|---|
| Posture | Supine | Standing | p-value | Supine | Standing | p-value | |
| Multi-Frequency | TBW (L) | 21.3 ± 1.4 | 21.2 ± 1.5 | 0.348 | 44.3 ± 1.5 | 44.2 ± 1.5 | 0.823 |
| ECF (L) | 9.7 ± 0.6 | 10.0 ± 0.6 | <0.001 | 18.9 ± 0.6 | 19.2 ± 0.6 | < 0.001 | |
| ICF (L) | 11.6 ± 0.9 | 11.3 ± 0.8 | 0.005 | 25.4 ± 0.9 | 25.0 ± 0.9 | 0.005 | |
| FFM (kg) | 29.1 ± 2.0 | 29.0 ± 2.0 | 0.353 | 60.5 ± 2.0 | 60.4 ± 2.1 | 0.819 | |
| FM (kg) | 7.4 ± 0.8 | 7.6 ± 0.8 | 0.353 | 16.0 ± 1.4 | 16.0 ± 1.5 | 0.824 | |
| %BF (%) | 20.1 ± 1.3 | 20.5 ± 1.3 | 0.340 | 20.1 ± 1.2 | 20.1 ± 1.3 | 0.820 | |
| Single-Frequency | Z50 (Ω) | 665.3 ± 16.1 | 656.9 ± 16.3 | <0.001 | 473.1 ± 8.9 | 472.2 ± 9.4 | 0.524 |
| Z100 (Ω) | 635.0 ± 15.8 | 626.5 ± 16.2 | <0.001 | 447.5 ± 8.6 | 444.3 ± 9.0 | 0.021 | |
| Boys ( n = 23) Mean ± SE | Males ( n = 26) Mean ± SE | |||
|---|---|---|---|---|
| TBW(2H dilution) (L) | 21.7 ± 1.4 | 41.9 ± 1.5 | ||
| Supine | ||||
| Device | Mean ± SE | p-value | Mean ± SE | p-value |
| Multi-Frequency (L) | 21.3 ± 1.4 | 0.333 | 44.3 ± 1.5 | <0.001 |
| Single-Frequency Z50 (L) † | 19.0 ± 1.3 | <0.001 | 42.6 ± 1.4 | 0.566 |
| Single-Frequency Z 100 (L) ‡ | - | NA | 42.2 ± 1.3 | 1.000 |
| Standing | ||||
| Device | Mean ± SE | p-value | Mean ± SE | p-value |
| Multi-Frequency (L) | 21.2 ± 1.5 | 0.250 | 44.2 ± 1.5 | <0.001 |
| Single-Frequency Z50 (L) † | 19.3 ± 1.3 | <0.001 | 42.7 ± 1.4 | 0.461 |
| Single-Frequency Z 100 (L) ‡ | - | NA | 42.4 ± 1.4 | 1.000 |
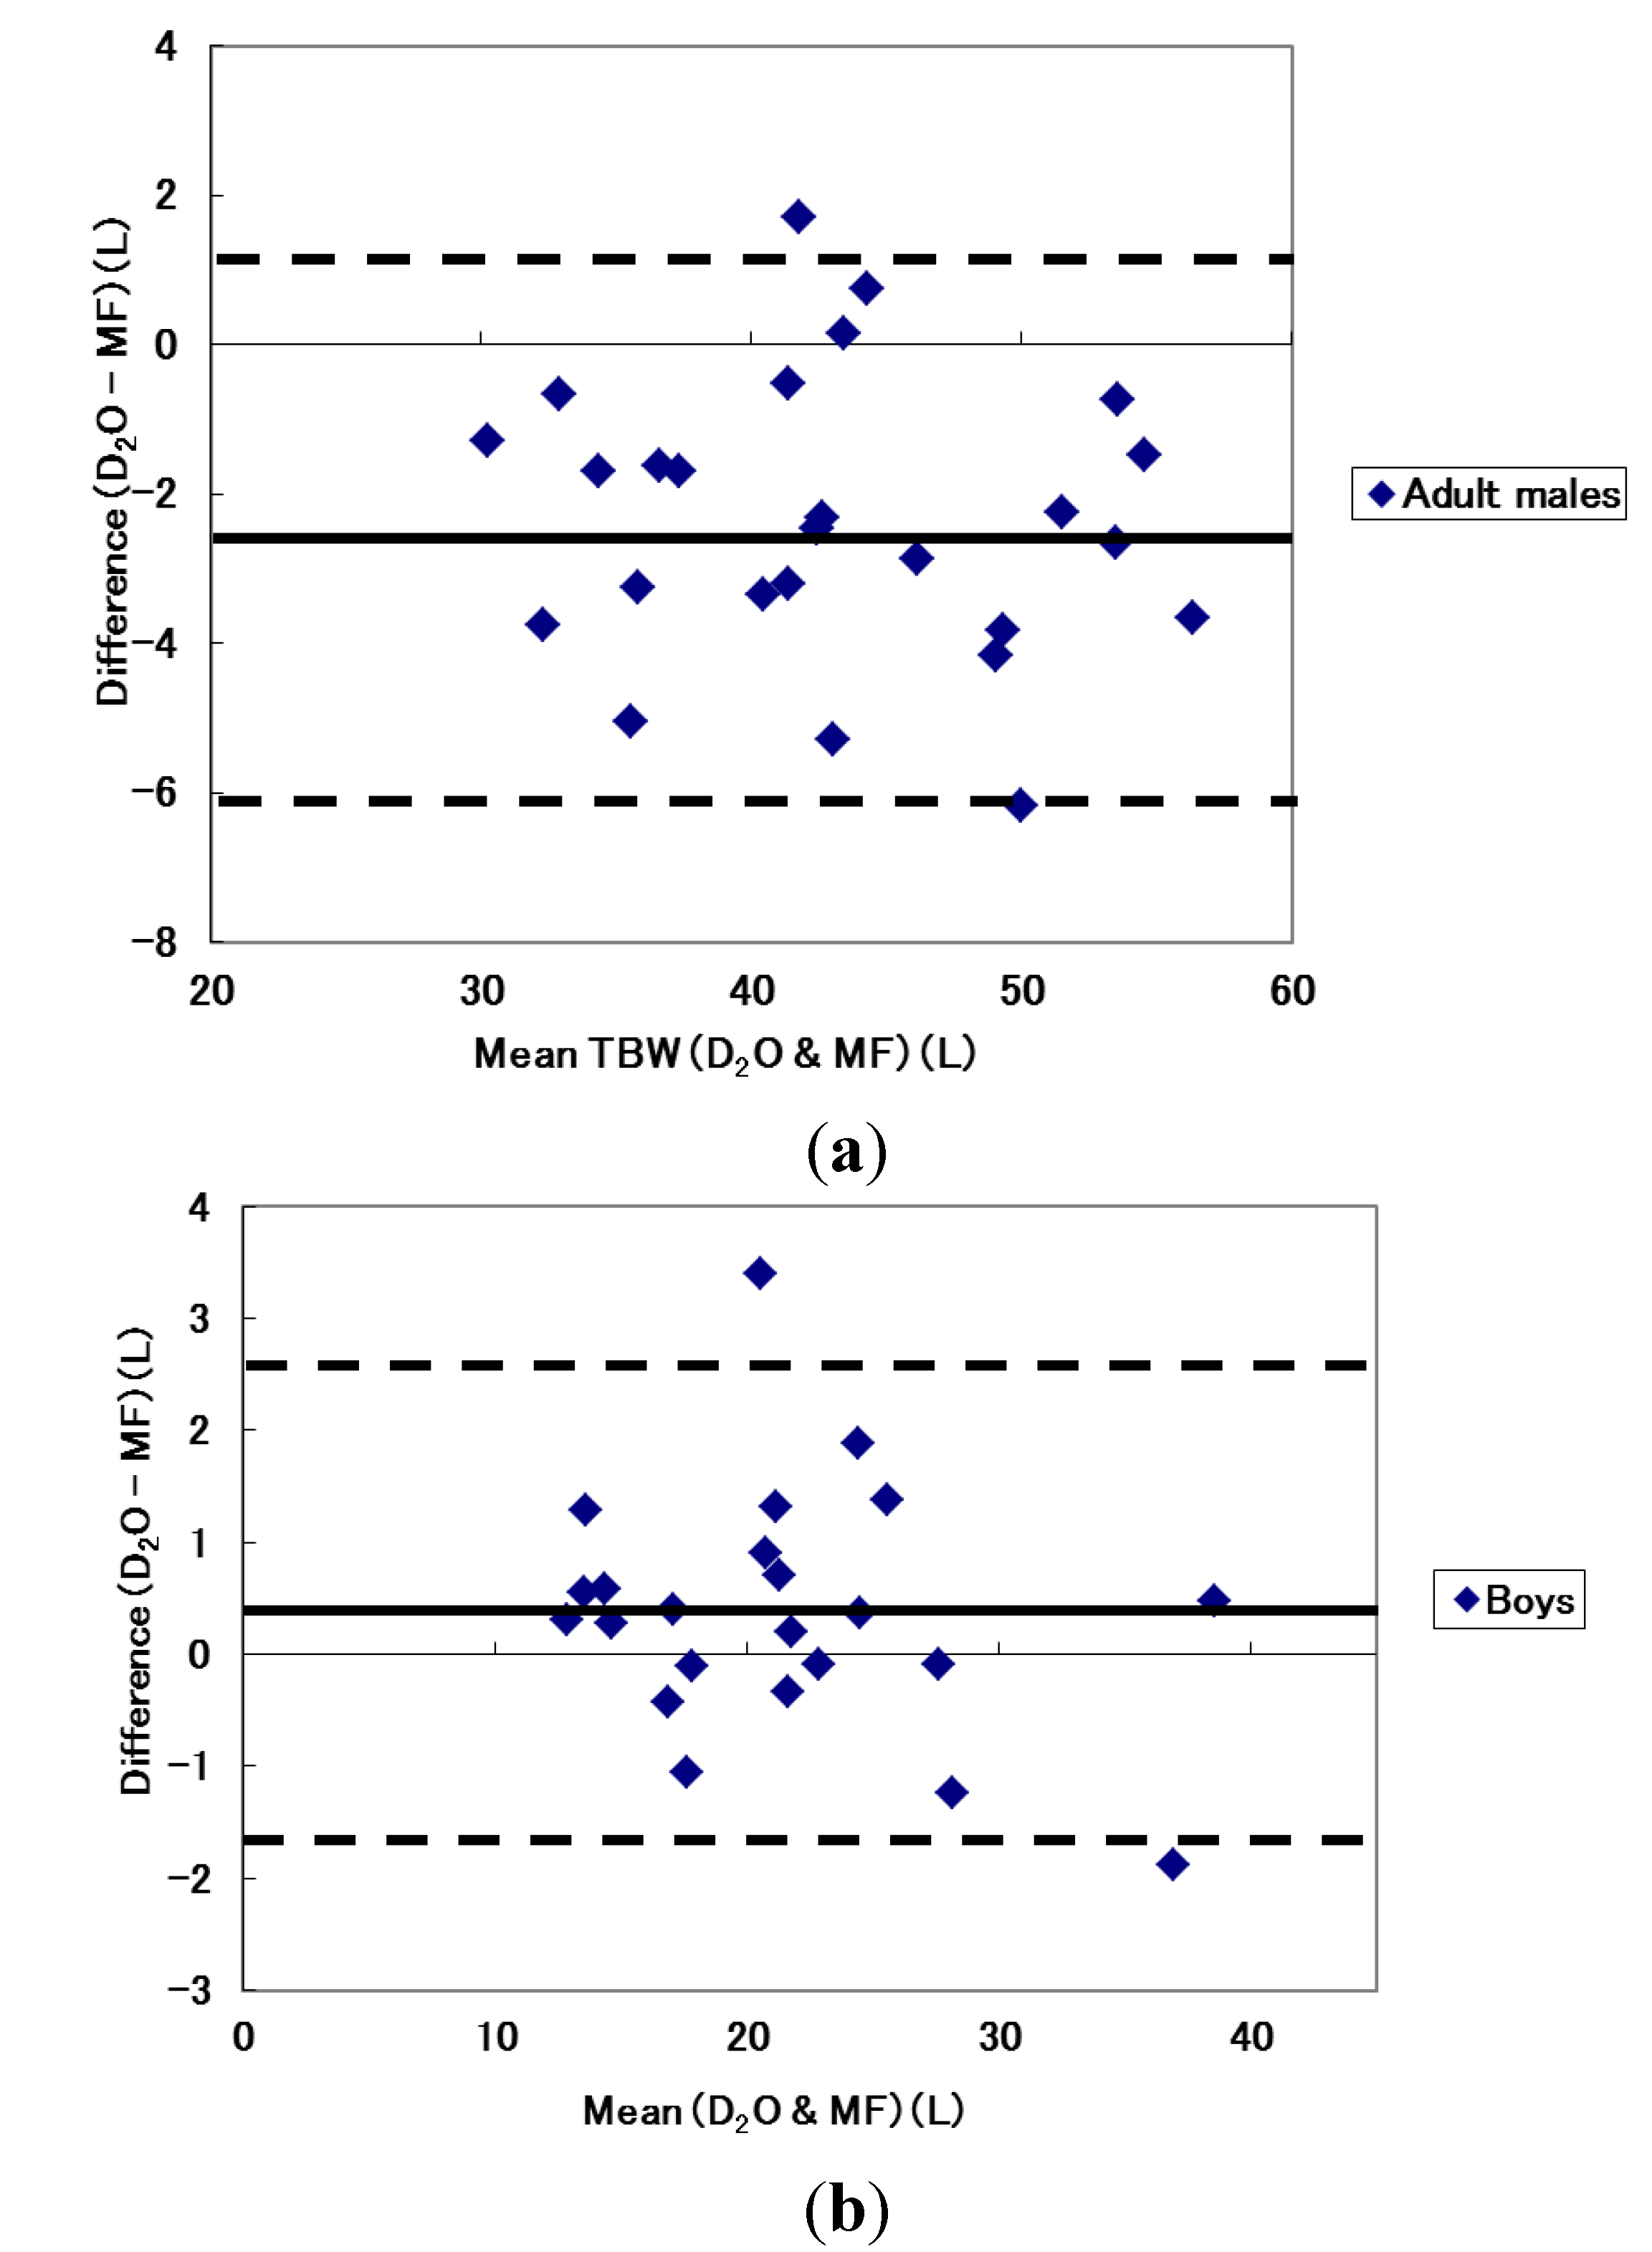
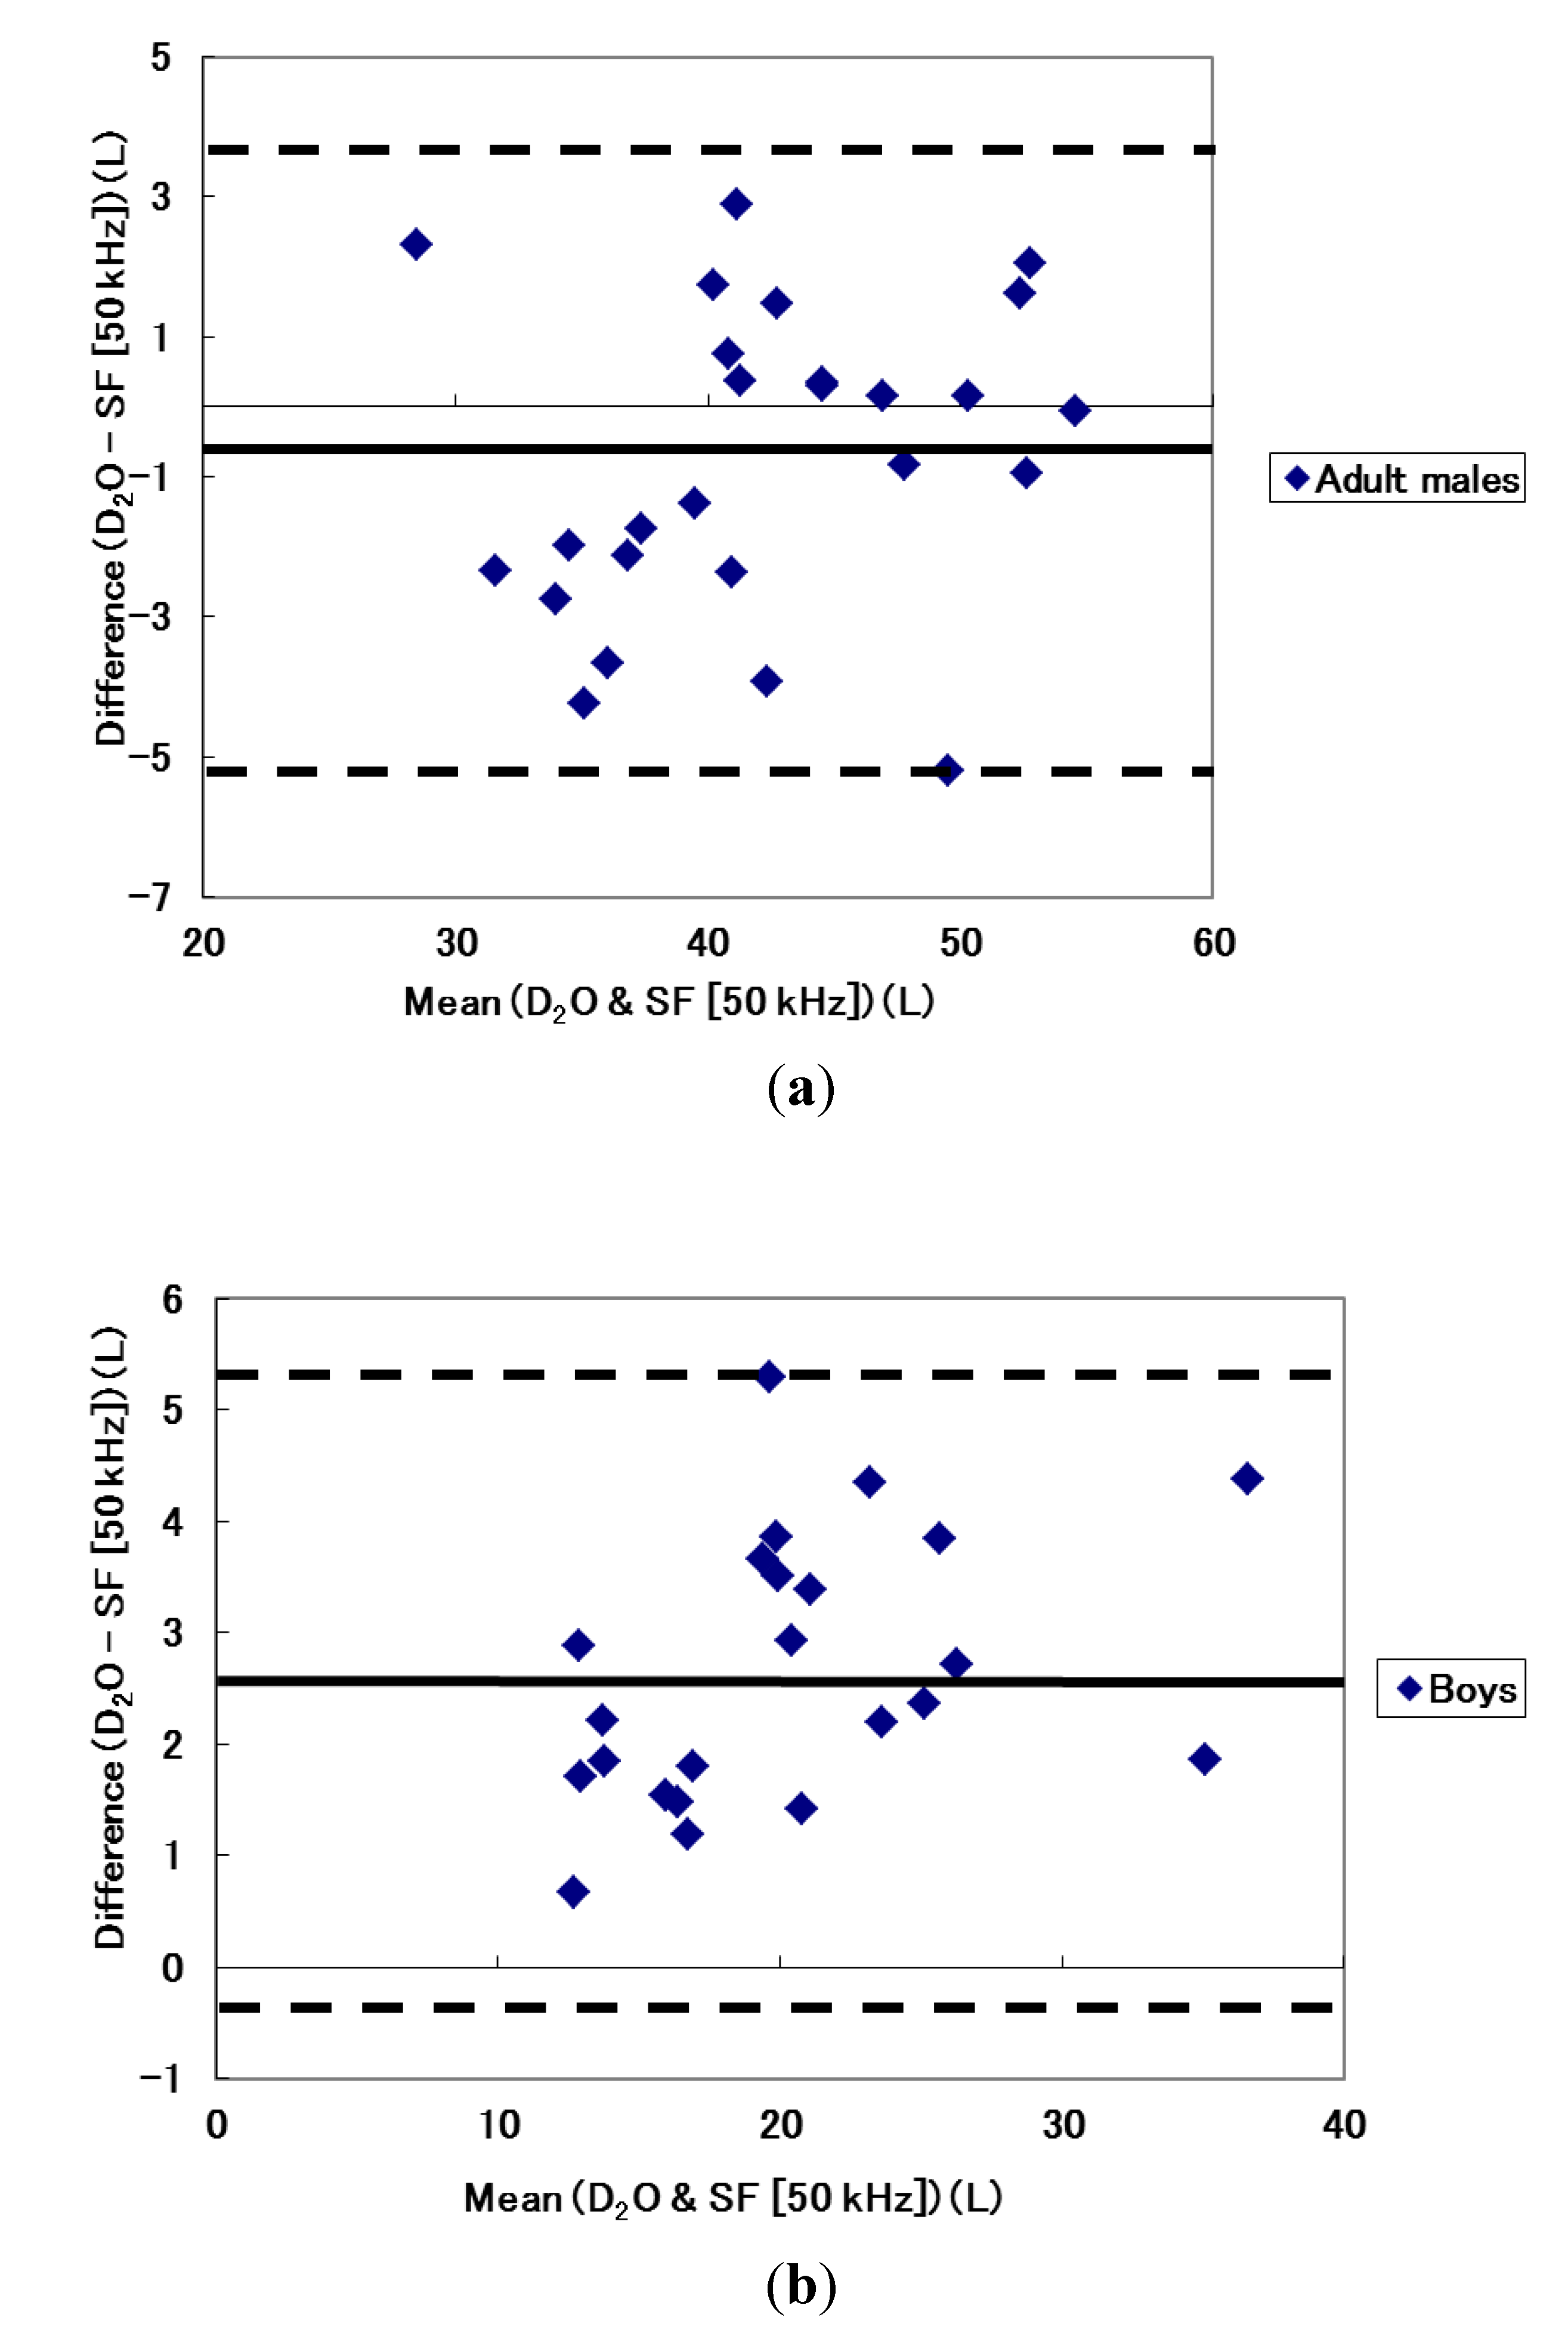
| Boys (n = 23) | Males (n = 26) | ||
|---|---|---|---|
| Multi-Frequency | Correlation coefficient | 0.988 | 0.970 |
| Limits of Agreement | 0.378 ± 2.14 (2.518, −1.762) | −2.361 ± 3.655 (1.29, −6.015) | |
| Single-Frequency Z50 † | Correlation coefficient | 0.985 | 0.956 |
| Limits of Agreement | 2.6524 ± 2.357 (5.009, 0.295) | −0.7465 ± 4.289 (3.543, −5.036) | |

4. Discussion
5. Conclusions
Acknowledgments
Author Contributions
Conflicts of Interest
References
- WHO. Obesity: Preventing and Managing the Global Epidemic; WHO Technical Report Series 894; WHO: Geneva, Switzerland, 2000. [Google Scholar]
- WHO/IASO/IOTF. Asia-Pacific Perspective: Redefining Obesity and Its Treatment; Health Communications Australia Pty Ltd.: Melbourne, Australia, 2000. [Google Scholar]
- Baumgartner, R.N.; Chumlea, W.C.; Roche, A.F. Bioelectric impedance phase angle and body composition. Am. J. Clin. Nutr. 1988, 48, 16–23. [Google Scholar]
- Kyle, U.G.; Bosaeus, I.; de Lorenzo, A.D.; Deurenberg, P.; Elia, M.; Gomez, J.M.; Heitmann, B.L.; Kent-Smith, L.; Melchior, J.C.; Pirlich, M.; et al. ESPEN Guidelines, Bioelectrical impedance analysis-part I: Review of principles and methods. Clin. Nutr. 2004, 23, 1226–1243. [Google Scholar] [CrossRef]
- Jaffrin, M.Y.; Morel, H. Body fluid volumes measurements by impedance: A review of bioimpedance spectroscopy (BIS) and bioimpedance analysis (BIA) methods. Med. Eng. Phys. 2008, 30, 1257–1269. [Google Scholar] [CrossRef]
- Ward, L.C.; Dyer, J.M.; Byrne, N.M.; Sharpe, K.K.; Hills, A.P. Validation of a three-frequency bioimpedance spectroscopic method for body composition analysis. Nutrition 2007, 23, 657–664. [Google Scholar] [CrossRef]
- Sun, G.; French, C.R.; Martin, G.R.; Younghusband, B.; Green, R.C.; Xie, Y.-G.; Mathews, M.; Barron, J.R.; Fitzpatrick, D.G.; Gulliver, W.; et al. Comparison of multifrequency bioelectrical impedance analysis with dual-energy X-ray absorptiometry for assessment of percentage body fat in a large, healthy population. Am. J. Clin. Nutr. 2005, 81, 74–78. [Google Scholar]
- Demura, S.; Sato, S.; Kitabayashi, T. Percentage of total body fat as estimated by three automatic bioelectrical impedance analyzers. J. Physiol. Anthropol. Appl. Hum. Sci. 2004, 23, 93–99. [Google Scholar] [CrossRef]
- Lukaski, H.C. Evolution of bioimpedance: A circuitous journey from estimation of physiological function to assessment of body composition and a return to clinical research. Eur. J. Clin. Nutr. 2013, 67, S2–S9. [Google Scholar] [CrossRef]
- Kyle, U.G.; Bosaeus, I.; de Lorenzo, A.D.; Deurenberg, P.; Elia, M.; Manuel Gómez, J.; Lilienthal Heitmann, B.; Kent-Smith, L.; Melchior, J.C.; Pirlich, M.; et al. ESPEN Guidelines, Bioelectrical impedance analysis-part II: Utilization in clinical practice. Clin. Nutr. 2004, 23, 1430–1453. [Google Scholar] [CrossRef]
- Buchholz, A.C.; Bartok, C.; Schoeller, D.A. The validity of bioelectrical impedance models in clinical populations. Nutr. Clin. Prac. 2004, 19, 433–446. [Google Scholar] [CrossRef]
- Smith, D.J.; Johnson, M.; Nagy, T. Precision and accuracy of bioimpedance spectroscopy for determination of in vivo body composition in rats. Int. J. Body Compos. Res. 2009, 7, 21–26. [Google Scholar]
- Ward, L.C. Segmental bioelectrical impedance analysis: An update. Curr. Opin. Clin. Nutr. Metab. Care 2012, 15, 424–429. [Google Scholar] [CrossRef]
- Bosy-Westphal, A.; Schautz, B.; Later, W.; Kehayias, J.J.; Gallagher, D.; Muller, M.J. What makes a BIA equation unique? Validity of eight-electrode multifrequency BIA to estimate body composition in a healthy adult population. Eur. J. Clin. Nutr. 2013, 67, S14–S21. [Google Scholar] [CrossRef]
- Scharfetter, H.; Monif, M.; László, Z.; Lambauer, T.; Hutten, H.; Hinghofer-Szalkay, H. Effect of postural changes on the reliability of volume estimations from bioimpedance spectroscopy data. Kidney Int. 1997, 51, 1078–1087. [Google Scholar] [CrossRef]
- National Health and Medical Research Council. National Statement on Ethical Conduct in Research Involving Humans, 1st ed.; AusInfo.: Canberra, Australia, 1999. [Google Scholar]
- Marfell-Jones, M.; Olds, T.; Stewart, A.; Carter, J.E.L. International Standards for Anthropometric Assessment (Revised 2006), 2nd ed.; The International Society for the Advancement of Kinanthropometry: Potchefstroom, South Africa, 2006. [Google Scholar]
- Gore, C.; Norton, K.; Olds, T.; Whittingham, N.; Birchall, K.; Clough, M.; Dickerson, B.; Downie, L. Accreditation in anthropometry: An Australian model. In Anthropometrica; Norton, K., Olds, T., Eds.; University of New South Wales Press: Sydney, Australia, 1996; pp. 395–411. [Google Scholar]
- Wang, J.; Thornton, J.C.; Kolesnik, S.; Pierson, R.N., Jr. Anthropometry in body composition: An overview. Ann. N. Y. Acad. Sci. 2000, 904, 317–326. [Google Scholar]
- ImpediMed. Imp SFB7 Instructions for Use; ImpediMed: Eight Mile Plains, Australia, 2007. [Google Scholar]
- Demura, S.; Yamaji, S.; Goshi, F.; Nagasawa, Y. The influence of posture change on measurements of relative body fat in the bioimpedance analysis method. J. Physiol. Anthropol. Appl. Hum. Sci. 2001, 20, 29–35. [Google Scholar]
- Moon, J.R.; Smith, A.E.; Tobkin, S.E.; Lockwood, C.M.; Kendall, K.L.; Graef, J.L.; Roberts, M.D.; Dalbo, V.J.; Kerksick, C.M.; Cramer, J.T.; et al. Total body water changes after an exercise intervention tracked using bioimpedance spectroscopy: A deuterium oxide comparison. Clin. Nutr. 2009, 28, 516–525. [Google Scholar] [CrossRef]
- Davies, P.S.W.; Preece, M.A.; Hicks, C.J.; Halliday, D. The prediction of total body water using bioelectrical impedance in children and adolescents. Ann. Hum. Biol. 1988, 15, 237–240. [Google Scholar] [CrossRef]
- Deurenberg, P.; Tagliabue, A.; Schouten, F.J.M. Multi-frequency impedance for the prediction of extracellular water and total body water. Br. J. Nutr. 1995, 73, 349–358. [Google Scholar] [CrossRef]
- International Atomic Energy Agency. Introduction to Body Composition Assessment Using the Deuterium Dilution Technique with Analysis of Urine Samples by Isotope Ratio Mass Spectrometry; IAEA: Vienna, Austria, 2010. [Google Scholar]
- Bland, J.M.; Altman, D.G. Statistical methods for assessing agreement between two methods of clinical measurement. Lancet 1986, 1, 307–310. [Google Scholar] [CrossRef]
- Zhu, F.; Schneditz, D.; Wang, E.; Levin, N.W. Dynamics of segmental extracellular volumes during changes in body position by bioimpedance analysis. J. Appl. Physiol. 1998, 85, 497–504. [Google Scholar]
- Weyer, S.; Ulbrich, M.; Leonhardt, S. A model-based approach for analysis of intracellular resistance variations due to body posture on bioimpedance measurements. J. Phys. 2013, 434, 1–4. [Google Scholar]
- Lubans, D.R.; Morgan, P.J.; Okely, A.D.; Dewar, D.; Collins, C.E.; Batterham, M.; Callister, R.; Plotnikoff, R.C. Preventing Obesity Among Adolescent Girls: One-Year Outcomes of the Nutrition and Enjoyable Activity for Teen Girls (NEAT Girls) Cluster Randomized Controlled Trial. Arch. Pediatr. Adolesc. Med. 2012, 166, 821–827. [Google Scholar] [CrossRef]
- Rutkove, S.B.; Gregas, M.C.; Darras, B.T. Electrical impedance myography in spinal muscular atrophy: A longitudinal study. Muscle Nerve 2012, 45, 642–647. [Google Scholar] [CrossRef]
© 2014 by the authors; licensee MDPI, Basel, Switzerland. This article is an open access article distributed under the terms and conditions of the Creative Commons Attribution license (http://creativecommons.org/licenses/by/3.0/).
Share and Cite
Kagawa, M.; Wishart, C.; Hills, A.P. Influence of Posture and Frequency Modes in Total Body Water Estimation Using Bioelectrical Impedance Spectroscopy in Boys and Adult Males. Nutrients 2014, 6, 1886-1898. https://doi.org/10.3390/nu6051886
Kagawa M, Wishart C, Hills AP. Influence of Posture and Frequency Modes in Total Body Water Estimation Using Bioelectrical Impedance Spectroscopy in Boys and Adult Males. Nutrients. 2014; 6(5):1886-1898. https://doi.org/10.3390/nu6051886
Chicago/Turabian StyleKagawa, Masaharu, Connie Wishart, and Andrew P. Hills. 2014. "Influence of Posture and Frequency Modes in Total Body Water Estimation Using Bioelectrical Impedance Spectroscopy in Boys and Adult Males" Nutrients 6, no. 5: 1886-1898. https://doi.org/10.3390/nu6051886
APA StyleKagawa, M., Wishart, C., & Hills, A. P. (2014). Influence of Posture and Frequency Modes in Total Body Water Estimation Using Bioelectrical Impedance Spectroscopy in Boys and Adult Males. Nutrients, 6(5), 1886-1898. https://doi.org/10.3390/nu6051886