Effects of Eating Fresh Lean Pork on Cardiometabolic Health Parameters


 ,
,
Abstract
:1. Introduction
2. Experimental Section
2.1. Subjects
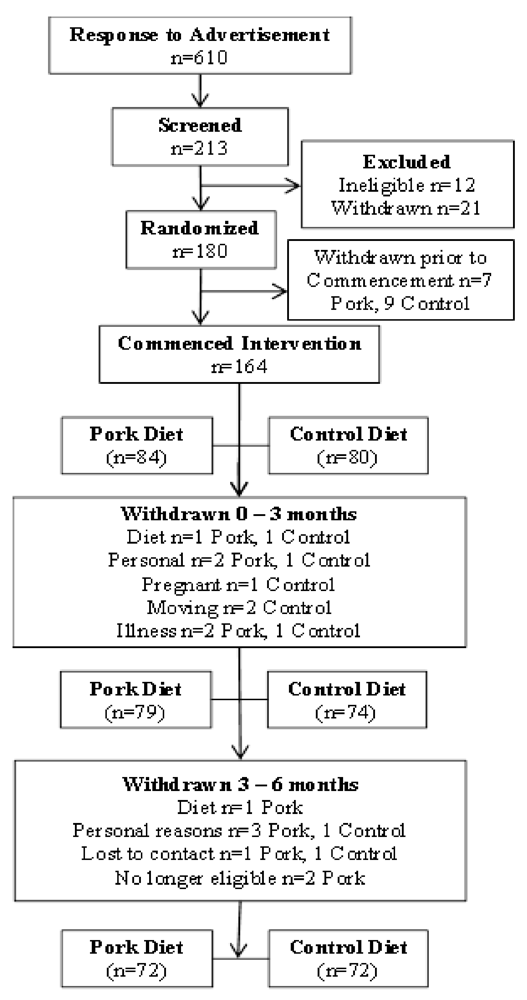
2.1.1. Study Design

2.1.2. Dietary Intervention
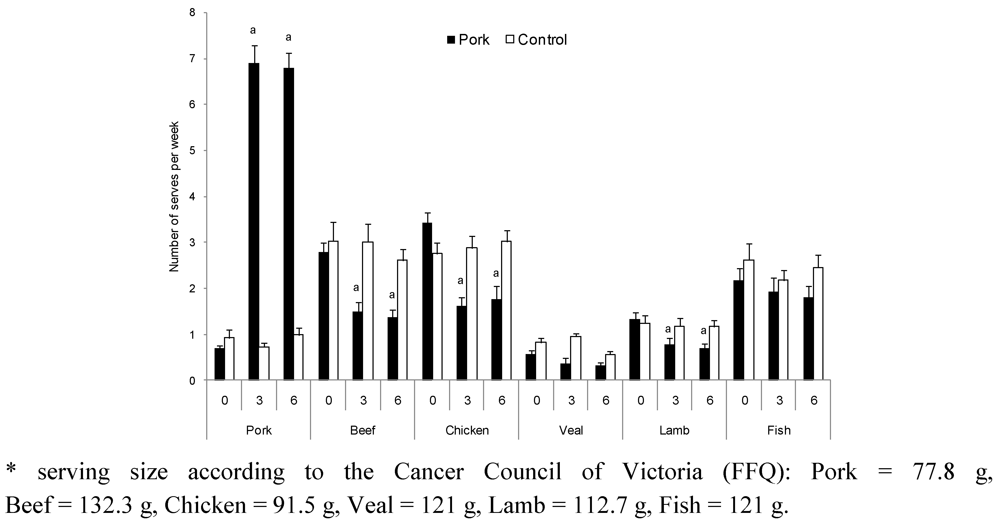
2.1.3. Dietary Intake

| Diced | Stir-fry | Steak | Mince | Sausage | |
|---|---|---|---|---|---|
| Energy (kJ) | 580 | 425 | 770 | 611 | 790 |
| Fat (g) | 6.8 | 1.1 | 10.8 | 7.0 | 13.5 |
| Saturated Fat (g) | 2.8 | 0.4 | 4.6 | 2.7 | 5.2 |
| Protein (g) | 19.3 | 21.4 | 21.8 | 20.7 | 14.3 |
| Total carbohydrate (g) | <1.0 | 1.2 | <1.0 | <1.0 | 2.8 |
| Moisture (g) | 73.3 | 74.8 | 67.2 | 71.9 | 66.6 |
| Sodium (mg) | 333 | 346 | 204 | 182 | 933 |
2.1.4. Physical Activity
2.1.5. Body Composition
2.1.6. Blood Pressure and Arterial Compliance
2.1.7. Laboratory Methods-Sample Collection
2.1.8. Blood Lipids
2.1.9. Plasma Glucose and Insulin
2.1.10. Statistical Analysis
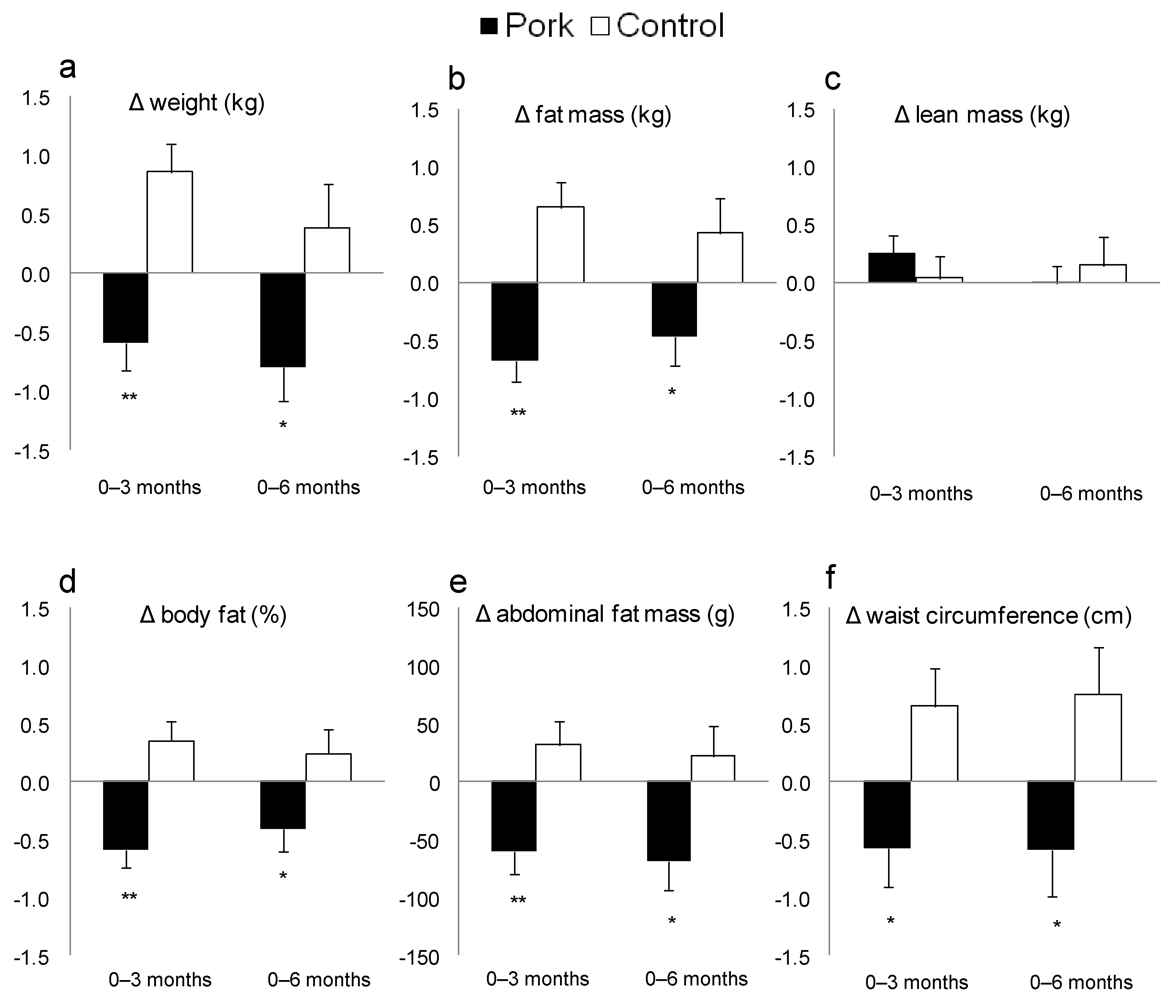
3. Results

| Pork | Control | |||||||||||||
|---|---|---|---|---|---|---|---|---|---|---|---|---|---|---|
| n | 0 month | 3 months | 6 months | n | 0 month | 3 months | 6 months | |||||||
| Mean | SEM | Mean | SEM | Mean | SEM | Mean | SEM | Mean | SEM | Mean | SEM | |||
| Energy (kJ) | 71 | 8690 | 341 | 8151 | 413 | 8188 | 488 | 72 | 8955 | 457 | 8397 | 390 | 8284 | 378 |
| Protein (%en) | 71 | 20 | 0.4 | 20 | 0.4 | 20 | 0.3 | 72 | 20 | 0.5 | 20 | 0.4 | 21 | 0.5 |
| Fat (%en) | 71 | 35 | 0.6 | 33 | 0.6 | 33 | 0.7 | 72 | 35 | 0.7 | 35 | 0.7 | 35 | 0.7 |
| SFA (g) | 71 | 32 | 1.5 | 31 | 2.0 | 31 | 2.2 | 72 | 33 | 2.2 | 32 | 1.9 | 30 | 1.8 |
| MUFA (g) | 71 | 30 | 1.3 | 29 | 1.6 | 29 | 2.1 | 72 | 31 | 2.0 | 29 | 1.6 | 29 | 1.6 |
| PUFA (g) | 71 | 12 | 0.7 | 11 | 0.6 | 11 | 0.8 | 72 | 13 | 0.8 | 12 | 0.7 | 12 | 0.6 |
| CHO (%en) | 71 | 40 | 0.8 | 41 | 0.9 | 41 | 0.8 | 72 | 40 | 0.8 | 39 | 0.8 | 38 | 0.9 |
| Alcohol (%en) | 71 | 5 | 0.8 | 5 | 0.8 | 6 | 0.8 | 72 | 6 | 0.9 | 6 | 0.9 | 6 | 0.9 |
| TEE (kJ/day) | 61 | 16296 | 462 | 16761 | 508 | 16511 | 464 | 56 | 16632 | 111 | 16611 | 431 | 16760 | 477 |
| Pork | Control | |||||||||||||
|---|---|---|---|---|---|---|---|---|---|---|---|---|---|---|
| n | 0 month | 3 months | 6 months | n | 0 month | 3 months | 6 months | |||||||
| Mean | SEM | Mean | SEM | Mean | SEM | Mean | SEM | Mean | SEM | Mean | SEM | |||
| SBP (mmHg) | 72 | 126 | 1.6 | 123 | 1.4 | 124 | 1.4 | 72 | 127 | 1.5 | 125 | 1.4 | 126 | 1.5 |
| DBP (mmHg) | 72 | 73 | 1.1 | 71 | 1.0 | 71 | 1.1 | 72 | 72 | 1.0 | 70 | 1.0 | 70 | 1.1 |
| Heart rate (bpm) | 72 | 62 | 1.1 | 61 | 1.1 | 60 | 1.1 | 72 | 61 | 1.0 | 61 | 1.0 | 60 | 1.1 |
| Large artery EI (mL/mmHg × 10) | 72 | 17.1 | 0.5 | 16.4 | 0.5 | 16.8 | 0.5 | 71 | 16.7 | 0.6 | 16.3 | 0.5 | 16.3 | 0.5 |
| Small artery EI (mL/mmHg × 10) | 72 | 7.9 | 0.4 | 7.9 | 0.4 | 8.1 | 0.4 | 71 | 8.3 | 0.4 | 8.8 | 0.5 | 8.6 | 0.5 |
| TC (mmol/L) | 72 | 5.6 | 0.1 | 5.6 | 0.1 | 5.5 | 0.1 | 71 | 5.8 | 0.1 | 5.7 | 0.1 | 5.6 | 0.1 |
| LDL (mmol/L) | 71 | 3.7 | 0.1 | 3.6 | 0.1 | 3.6 | 0.1 | 69 | 3.7 | 0.1 | 3.7 | 0.1 | 3.6 | 0.1 |
| HDL (mmol/L) | 72 | 1.3 | 0.04 | 1.3 | 0.03 | 1.3 | 0.03 | 71 | 1.4 | 0.03 | 1.4 | 0.03 | 1.3 | 0.03 |
| TAG (mmol/L) | 71 | 1.5 | 0.1 | 1.4 | 0.1 | 1.3 | 0.1 | 69 | 1.4 | 0.1 | 1.4 | 0.1 | 1.3 | 0.1 |
| Gluc (mmol/L) | 71 | 5.9 | 0.1 | 5.8 | 0.1 | 5.8 | 0.1 | 70 | 5.9 | 0.1 | 5.9 | 0.1 | 5.9 | 0.1 |
| Insulin (µU/mL) | 68 | 20.6 | 1.1 | 19.6 | 1.0 | 18.5 | 0.9 | 67 | 19.4 | 0.8 | 18.6 | 0.9 | 18.8 | 0.8 |
| Weight (kg) 2 | 72 | 91.4 | 2.1 | 90.7 3 | 2.1 | 90.6 | 2.1 | 72 | 92.8 | 2.0 | 93.6 4 | 2.0 | 93.2 | 2.0 |
| BMI (kg/m2) 2 | 72 | 31.8 | 0.6 | 31.5 3 | 0.6 | 31.5 | 0.7 | 72 | 31.9 | 0.5 | 32.3 3 | 0.5 | 32.1 | 0.5 |
| WC (cm) 2 | 72 | 101.3 | 1.8 | 100.7 | 1.8 | 100.7 | 1.8 | 72 | 101.3 | 1.6 | 102.0 | 1.6 | 102.1 | 1.6 |
| HC (cm) | 72 | 112.6 | 1.4 | 112.1 | 1.4 | 112.2 | 1.4 | 72 | 111.8 | 1.1 | 111.9 | 1.1 | 111.9 | 1.1 |
| % fat 2 | 72 | 42.5 | 1.1 | 41.9 4 | 1.1 | 42.1 | 1.1 | 71 | 40.9 | 1.0 | 41.3 | 1.0 | 41.1 | 1.0 |
| Fat mass (kg) 2 | 72 | 37.2 | 1.3 | 36.5 4 | 1.4 | 36.7 | 1.4 | 71 | 36.2 | 1.1 | 36.8 3 | 1.2 | 36.6 | 1.1 |
| Abdo fat (g) 2 | 72 | 3025 | 145 | 2960 4 | 144 | 2957 3 | 148 | 71 | 3006 | 128 | 3037 | 131 | 3028 | 131 |
| Lean mass (kg) | 72 | 49.9 | 1.4 | 50.1 | 1.4 | 49.9 | 1.4 | 71 | 52.6 | 1.5 | 52.6 | 1.5 | 52.7 | 1.5 |

4. Discussion
5. Conclusions
Acknowledgments
Conflict of Interest
References
- The Australian Guide to Healthy Eating; The Australian Government, Department of Health and Ageing: Canberra, Australia, 1998.
- Adam-Perrot, A.; Clifton, P.; Brouns, F. Low-carbohydrate diets: Nutritional and physiological aspects. Obes. Rev. 2006, 7, 49–58. [Google Scholar] [CrossRef]
- Brinkworth, G.D.; Noakes, M.; Keogh, J.B.; Luscombe, N.D.; Wittert, G.A.; Clifton, P.M. Long-term effects of a high-protein, low-carbohydrate diet on weight control and cardiovascular risk markers in obese hyperinsulinemic subjects. Int. J. Obes. Relat. Metab. Disord. 2004, 28, 661–670. [Google Scholar] [CrossRef]
- Larsen, R.N.; Mann, N.J.; Maclean, E.; Shaw, J.E. The effect of high-protein, low-carbohydrate diets in the treatment of type 2 diabetes: A 12 month randomised controlled trial. Diabetologia 2011, 54, 731–740. [Google Scholar] [CrossRef]
- Parker, B.; Noakes, M.; Luscombe, N.; Clifton, P. Effect of a high-protein, high-monounsaturated fat weight loss diet on glycemic control and lipid levels in type 2 diabetes. Diabetes Care 2002, 25, 425–430. [Google Scholar] [CrossRef]
- Wycherley, T.P.; Noakes, M.; Clifton, P.M.; Cleanthous, X.; Keogh, J.B.; Brinkworth, G.D. A high-protein diet with resistance exercise training improves weight loss and body composition in overweight and obese patients with type 2 diabetes. Diabetes Care 2010, 33, 969–976. [Google Scholar] [CrossRef]
- Rubio, J.A.; Rubio, M.A.; Cabrerizo, L.; Burdaspal, P.; Carretero, R.; Gomez-Gerique, J.A.; Montoya, M.T.; Maestro, M.L.; Sanz, M.T.; Fernandez, C. Effects of pork vs. veal consumption on serum lipids in healthy subjects. Nutr. Hosp. 2006, 21, 75–83. [Google Scholar]
- Noakes, M.; Clifton, P. Weight loss, diet composition and cardiovascular risk. Curr. Opin. Lipidol. 2004, 15, 31–35. [Google Scholar] [CrossRef]
- Noakes, M.; Keogh, J.B.; Foster, P.R.; Clifton, P.M. Effect of an energy-restricted, high-protein, low-fat diet relative to a conventional high-carbohydrate, low-fat diet on weight loss, body composition, nutritional status, and markers of cardiovascular health in obese women. Am. J. Clin. Nutr. 2005, 81, 1298–1306. [Google Scholar]
- McMillan-Price, J.; Petocz, P.; Atkinson, F.; O’Neill, K.; Samman, S.; Steinbeck, K.; Caterson, I.; Brand-Miller, J. Comparison of 4 diets of varying glycemic load on weight loss and cardiovascular risk reduction in overweight and obese young adults: A randomized controlled trial. Arch. Intern. Med. 2006, 166, 1466–1475. [Google Scholar] [CrossRef]
- Sufian, M.K.; Hira, T.; Miyashita, K.; Nishi, T.; Asano, K.; Hara, H. Pork peptone stimulates cholecystokinin secretion from enteroendocrine cells and suppresses appetite in rats. Biosci. Biotechnol. Biochem. 2006, 70, 1869–1874. [Google Scholar] [CrossRef]
- Altman, D.G.; Bland, J.M. Standard deviations and standard errors. BMJ 2005, 331, 903. [Google Scholar] [CrossRef]
- Xinying, P.X.; Noakes, M.; Keogh, J. Can a food frequency questionnaire be used to capture dietary intake data in a 4 week clinical intervention trial? Asia Pac. J. Clin. Nutr. 2004, 13, 318–323. [Google Scholar]
- Bouchard, C.; Tremblay, A.; Leblanc, C.; Lortie, G.; Savard, R.; Theriault, G. A method to assess energy expenditure in children and adults. Am. J. Clin. Nutr. 1983, 37, 461–467. [Google Scholar]
- Norton, K.; Olds, T. Anthropometrica; UNSW Press: Sydney, Australia, 1996. [Google Scholar]
- Murphy, K.J.; Meyer, B.J.; Mori, T.A.; Burke, V.; Mansour, J.; Patch, C.S.; Tapsell, L.C.; Noakes, M.; Clifton, P.A.; Barden, A.; et al. Impact of foods enriched with n-3 long-chain polyunsaturated fatty acids on erythrocyte n-3 levels and cardiovascular risk factors. Br. J. Nutr. 2007, 97, 749–757. [Google Scholar] [CrossRef]
- Friedewald, W.T.; Levy, R.I.; Fredrickson, D.S. Estimation of the concentration of low-density lipoprotein cholesterol in plasma, without use of the preparative ultracentrifuge. Clin. Chem. 1972, 18, 499–502. [Google Scholar]
- National Heart Foundation of Australia and Cardiac Society of Australia and New Zealand. Position statement on lipid management. Heart Lung Circ. 2005, 14, 275–291. [CrossRef]
- McLennan, W.; Podger, A. National Nutrition Survey 1995; Australian Bureau of Statistics: Canberra, Australia, 1999. [Google Scholar]
- Mikkelsen, P.B.; Toubro, S.; Astrup, A. Effect of fat-reduced diets on 24-h energy expenditure: Comparisons between animal protein, vegetable protein, and carbohydrate. Am. J. Clin. Nutr. 2000, 72, 1135–1141. [Google Scholar]
- Wadden, T.A.; Neiberg, R.H.; Wing, R.R.; Clark, J.M.; Delahanty, L.M.; Hill, J.O.; Krakoff, J.; Otto, A.; Ryan, D.H.; Vitolins, M.Z. Four-year weight losses in the Look AHEAD study: Factors associated with long-term success. Obesity (Silver Spring) 2011, 19, 1987–1998. [Google Scholar]
- Micha, R.; Wallace, S.K.; Mozaffarian, D. Red and processed meat consumption and risk of incident coronary heart disease, stroke, and diabetes mellitus: A systematic review and meta-analysis. Circulation 2010, 121, 2271–2283. [Google Scholar]
- Coates, A.M.; Sioutis, S.; Buckley, J.D.; Howe, P.R. Regular consumption of n-3 fatty acid-enriched pork modifies cardiovascular risk factors. Br. J. Nutr. 2009, 101, 592–597. [Google Scholar]
© 2012 by the authors; licensee MDPI, Basel, Switzerland. This article is an open-access article distributed under the terms and conditions of the Creative Commons Attribution license (http://creativecommons.org/licenses/by/3.0/).
Share and Cite
Murphy, K.J.; Thomson, R.L.; Coates, A.M.; Buckley, J.D.; Howe, P.R.C. Effects of Eating Fresh Lean Pork on Cardiometabolic Health Parameters. Nutrients 2012, 4, 711-723. https://doi.org/10.3390/nu4070711
Murphy KJ, Thomson RL, Coates AM, Buckley JD, Howe PRC. Effects of Eating Fresh Lean Pork on Cardiometabolic Health Parameters. Nutrients. 2012; 4(7):711-723. https://doi.org/10.3390/nu4070711
Chicago/Turabian StyleMurphy, Karen J., Rebecca L. Thomson, Alison M. Coates, Jonathan D. Buckley, and Peter R. C. Howe. 2012. "Effects of Eating Fresh Lean Pork on Cardiometabolic Health Parameters" Nutrients 4, no. 7: 711-723. https://doi.org/10.3390/nu4070711
APA StyleMurphy, K. J., Thomson, R. L., Coates, A. M., Buckley, J. D., & Howe, P. R. C. (2012). Effects of Eating Fresh Lean Pork on Cardiometabolic Health Parameters. Nutrients, 4(7), 711-723. https://doi.org/10.3390/nu4070711