Current Challenges in Detecting Food Allergens by Shotgun and Targeted Proteomic Approaches: A Case Study on Traces of Peanut Allergens in Baked Cookies

Abstract
:Abbreviations
1. Introduction
2. Materials and Methods
2.1. Materials

| Peanut variety, origin | Peanut treatment |
|---|---|
| Runners Argentina | Blanched air-roasted at 140 °C for 20 min |
| Common Natal, South-Africa | Raw, air-roasted at 160 °C for 13 min |
| Virginia, USA | Blanched, oil roasted at 145 °C for 25 min |
| Virginia, China | Blanched, oil roasted at 140 °C for 9 min |
| Jumbo Runners, USA | Blanched only |
2.2. Chemicals
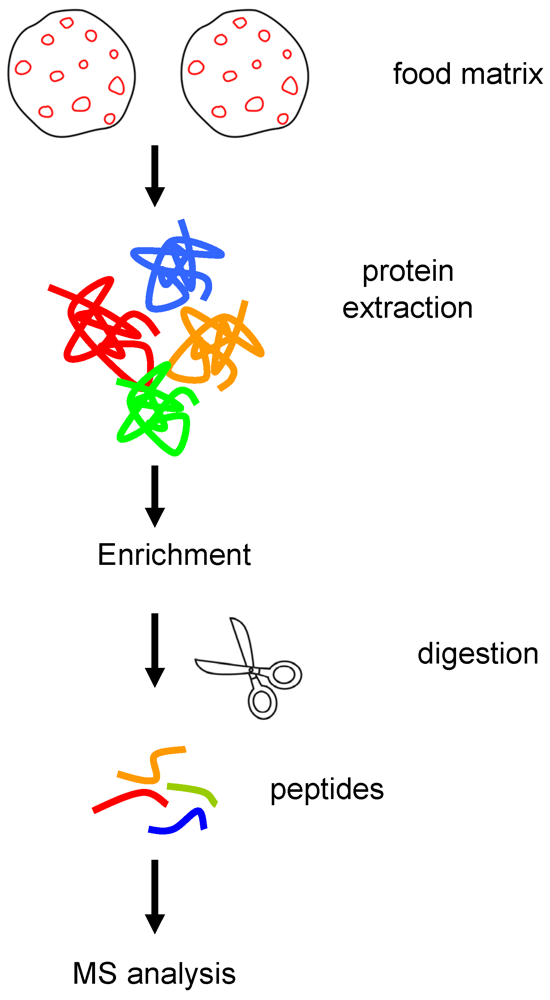
2.3. Protein Extraction and Quantification
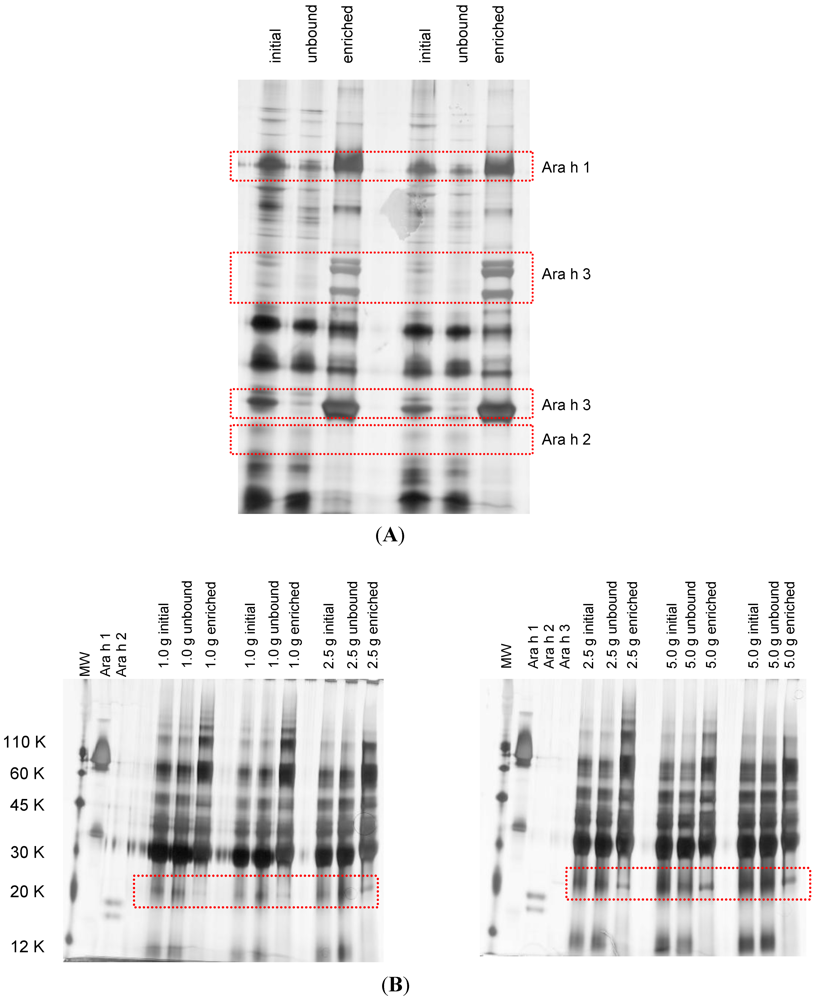
2.4. Protein Enrichment
2.5. SDS-PAGE
2.6. Gel Free and Gel Based Trypsin Digestion
2.7. Nano LC Separation of Peptides
2.8. Nano Electrospray Q-TOF Tandem Mass Spectrometry (Nano-ESI Q-TOF MS/MS)
2.9. Database Searching
2.10. Selective Reaction Monitoring (SRM)
| Peptides | Parention (m/z) (+) | Fragmention(s) (m/z) | CE a |
|---|---|---|---|
| Ara h 1 | |||
| VLLEENAGGEQEER | 786.9 (+2) | 989.5 (y9)/875.4 (y8)/804.4 (y7)/747.3 (y6)/561.3 (y4)/304.2 (y2) | 40 |
| DLAFPGSGEQVEK | 688.8 (+2) | 1077.5 (y10)/930.5 (y9)/833.4 (y8)/447.2 (b4)/300.2 (b3)/229.1 (b2) | 36 |
| Ara h 2 | |||
| CCNELNEFENNQR | 863.8 (+2) | 1050.5 (y8)/807.4 (y6)/660.3 (y5)/531.3 (y4) | 43 |
| NLPQQCGLR | 543.3 (+2) | 858.4 (y7)/761.4 (y6)/633.3 (y5)/200.1 (a2) | 29 |
| CDLEVESGGR | 561.2 (+2) | 846.4 (y8)/604.3 (y6)/505.2 (y5)/376.2 (y4) | 30 |
| CMCELQQIMENQSDR | 1006.9 (+2) | 1721.8 (y14)/1361.7 (y11)/1248.6 (y10)/992.5 (y8)/879.4 (y7)/748.3 (y6)/ 619.3 (y5)/292.1 (b2) | 49 |
| Ara h 3 | |||
| LNAQRPDNR | 361.9 (+3) | 1083.6 (ymax)/970.5 (y8)/856.4 (y7)/657.4 (y5)/228.1 (b2) | 19 |
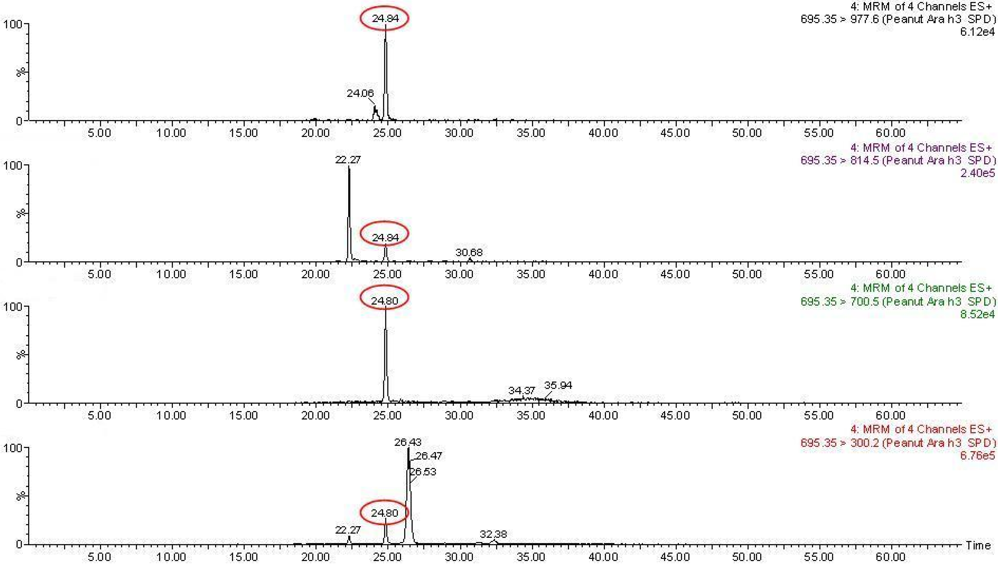
| SPDIYNPQAGSLK | 695.4 (+2) | 1389.7 (ymax)/1302.7 (y12)/977.5 (y9)/814.5 (y8)/700.4 (y7)/475.3 (y5)/300.1 (b3) | 36 |
| AHVQVVDSNGNR | 432.5 (+3) | 749.5 (b7)/663.3 (y6)/535.4 (b5) | 23 |
3. Results and Discussion
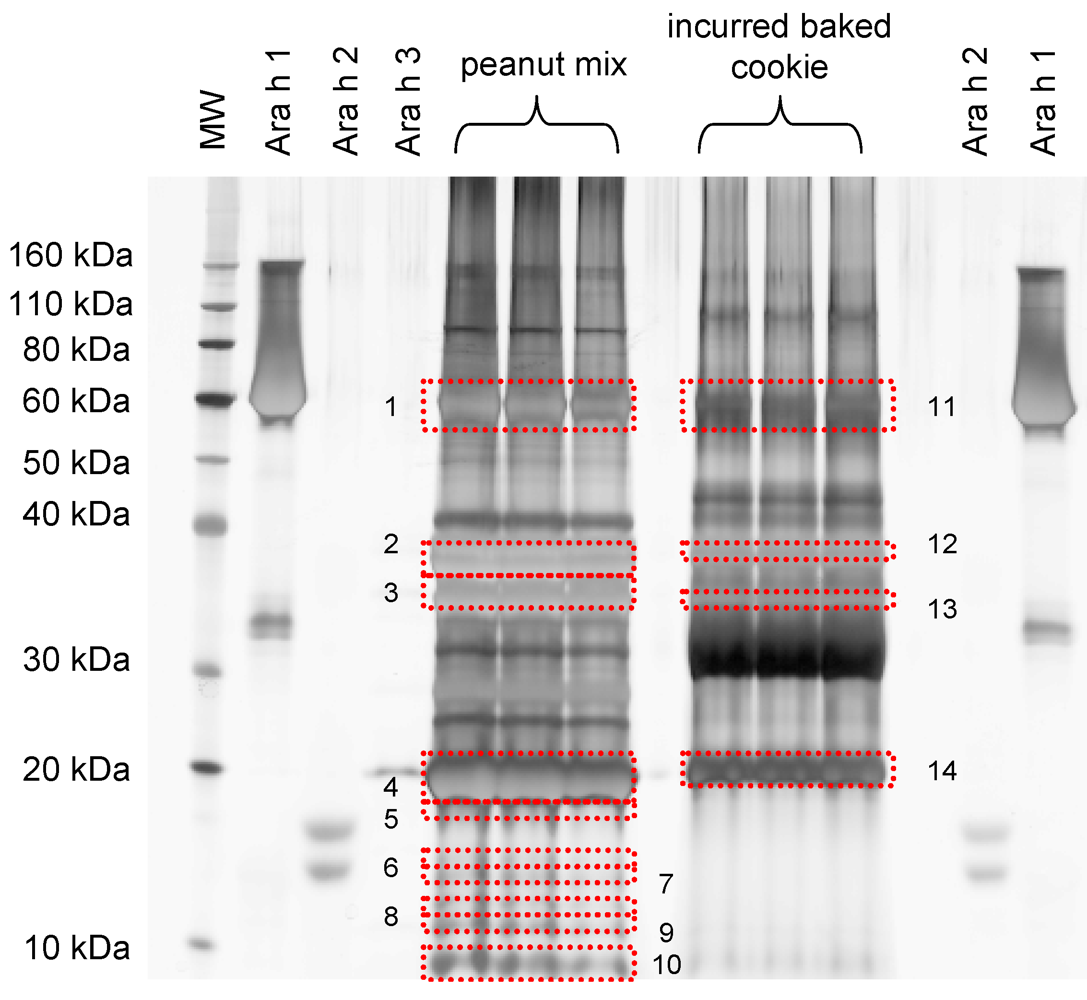
| Protein identification | Band # a | Peptides matched | Mascot Score |
|---|---|---|---|
| IRMM peanut mix | |||
| Ara h 1 clone P41B precursor | 1 | 18, 15, 26 | 756, 744, 1473 |
| Ara h 1 clone P17 precursor | 16, 15, 29 | 704, 726, 1619 | |
| Allergen Ara h 3 Ara h 4 | 1, 3, 9 | 81, 76, 509 | |
| Allergen Ara h 3 Ara h 4 | 2 | 13, 7, 12 | 637, 369, 728 |
| Ara h 3 Glycinin | 3 | 1, -, 1 | 90, -, 70 |
| Allergen Ara h 3 Ara h 4 | 4 | 6, 11, 9 | 365, 771, 576 |
| Allergen Ara h 2 | 5 | 3, 3 | 140, 114 |
| Ara h 3 Glycinin | 6 | 2 | 98 |
| Allergen Ara h 3 Ara h 4 | 7 | 2 | 96 |
| Ara h 1 clone P17 precursor | 2 | 67 | |
| Ara h 1 clone P41B precursor | 2 | 67 | |
| Allergen Ara h 2 isoform | 1 | 51 | |
| Allergen Ara h 6 | 8 | 6 | 209 |
| Allergen Ara h 3 Ara h 4 | 9 | 8 | 431 |
| Allergen Ara h 6 | 10 | 369 | |
| Allergen Ara h 3 Ara h 4 | 10 | 10 | 558 |
| Cookie incurred at 100,000 μg∙g-1 | |||
| Ara h 1 clone P41B precursor | |||
| Ara h 1 clone P17 precursor | 11 | 14, 10, 8 | 766, 582, 481 |
| Allergen Ara h 3 Ara h 4 | 13, 11, 10 | 686, 569, 552 | |
| 4, 4, 2 | 264, 190, 134 | ||
| Allergen Ara h 3 Ara h 4 | |||
| 12 | 3, 1, 1 | 103, 20, 50 | |
| Alpha casein S2 | |||
| 13 | 3, 3 | 102, 117 | |
| Allergen Ara h 3 Ara h 4 | |||
| Alpha casein S2 | 14 | 6, 7 | 340, 524 |
| (−), 2 | (−), 103 |
3.1. Shotgun Proteomics Approach: Nano LC-Q-TOF-MS/MS
| Amount of peanut μg∙g−1 matrix | Protein Identification | Peptides | m/z | charge |
|---|---|---|---|---|
| 1 | Negative | |||
| 10 | Negative | |||
| 100 | Negative | |||
| 1000 | Ara h 3/Ara h 4 | LNAQRPDNR | 362 | 3+ |
| Ara h 4 Glycinin | AHVQVVDSNGNR | 433 | 3+ | |
| Ara h 3 Glycinin | ||||
| 10,000 | Ara h 3/Ara h 4 | LNAQRPDNR | 362 | 3+ |
| Ara h 4 Glycinin | AHVQVVDSNGNR | 433 | 3+ | |
| Ara h 3 Glycinin | SPDIYNPQAGSLK | 695 | 2+ | |
| Ara h 1 clone P17 | VLLEENAGGEQEER | 787 | 2+ | |
| Ara h 1 clone P41B | DLAFPGSGEQVEK | 689 | 2+ | |
| DQSSYLQGFSR | 644 | 2+ | ||
| GTGNLELVAVR | 565 | 2+ | ||
| 100,000 | Ara h 3/Ara h 4 | LNAQRPDNR | 362 | 3+ |
| Ara h 4 Glycinin | AHVQVVDSNGDNR | 433 | 3+ | |
| Ara h 3 Glycinin | SPDIYNPQAGSLK | 695 | 2+ | |
| FNLAGNHEQEFLR | 788 | 2+ | ||
| GENESDEQGAIVTVR | 802 | 2+ | ||
| FFVPPSEQSLR | 654 | 2+ | ||
| TANDLNLLILR | 628 | 2+ | ||
| RPFYSNAPQEIFIQQGR | 684 | 3+ | ||
| Ara h 1 clone P17 | VLLEENAGGEQEER | 787 | 2+ | |
| Ara h 1 clone P41B | DLAFPGSGEQVEK | 689 | 2+ | |
| DQSSYLQGFSR | 644 | 2+ | ||
| GTGNLELVAVR | 565 | 2+ | ||
| WGPAEPR | 407 | 2+ | ||
| QFQNLQNHR | 593 | 2+ | ||
| SSDNEGVIVK | 524 | 2+ | ||
| GSEEEDITNPINLR | 794 | 2+ | ||
| DGEPDLSNNFGR | 661 | 2+ | ||
| IFLAGDKDNVIDQIEK | 607 | 3+ | ||
| EGEQEWGTPGSHVR | 524 | 2+ | ||
| SSENNEGVIVK | 588 | 2+ | ||
| LFEVKPDK | 488 | 2+ | ||
| EGALMLPHFNSK | 672 | 2+ |

| Amount of peanut μg∙g−1 matrix | Protein identification | Peptides (m/z, charge) | MS/MS |
|---|---|---|---|
| 10 | Negative | ||
| 100 | Ara h 3/Ara h 4 | LNAQRPDNR (361.9, 3+) | 1, 1, 1 |
| Ara h 4 Glycinin | |||
| Ara h 3 Glycinin | |||
| 1000 | Ara h 3/Ara h 4 | LNAQRPDNR (361.9, 3+) | 2, 1, 1 |
| Ara h 4 Glycinin | AHVQVVDSNGDNR (432.5, 3+) | 1, 1, 1 | |
| Ara h 3 Glycinin | SPDIYNPQAGSLK (695.4, 2+) | 1, 1, 1 | |
| QIVQNLR (435.8, 2+) | 1, 1, 1 | ||
| GENESDEQGAIVTVR (802.4, 2+) | 1, 1, 0 |
3.2. Targeted Proteomics Approach: SRM
3.3. Perspectives
4. Concluding Remarks
Acknowledgements
References
- Poms, R.E.; Klein, C.L.; Anklam, E. Methods for allergen analysis in food: A review. Food Addit. Contam. 2004, 21, 1–31. [Google Scholar]
- Rona, R.J.; Keil, T.; Summers, C.; Gislason, D.; Zuidmeer, L.; Sodergren, E.; Sigurdardottir, S.T.; Lindner, T.; Goldhahn, K.; Dahlstrom, J.; et al. The prevalence of food allergy: A meta-analysis. J. Allergy Clin. Immunol. 2007, 120, 638–646. [Google Scholar]
- European Commission, Directive 2000/13/ec of the European Parliament and of the Council of 20 March 2000 on the Approximation of the Laws of the Member States Relating to the Labelling, Presentation and Advertising of Foodstuffs. In OJ L 109, 6.5.2000; European Commission: Bruxelles, Belgium, 2009; p. 29.
- Kerbach, S.; Alldrick, A.J.; Crevel, R.W.; Dömötör, L.; DunnGalvin, A.; Clare Mills, E.; Pfaff, S.; Poms, R.E.; Popping, B.; Tömösközi, S. Managing food allergens in the food supply chain-viewed from different stakeholder perspectives. Qual. Assur. Saf. Crops Foods 2009, 1, 50–60. [Google Scholar]
- Chassaigne, H.; Nørgaard, J.V.; van Hengel, A.J. Proteomics-based approach to detect and identify major allergens in processed peanuts by capillary LC-Q-TOF (MS/MS). J. Agric. Food Chem. 2007, 55, 4461–4473. [Google Scholar]
- Johnson, P.E.; Baumgartner, S.; Aldick, T.; Bessant, C.; Giosafatto, V.; Heick, J.; Mamone, G.; O’Connor, G.; Poms, R.E.; Popping, B.; et al. Current perspectives and recommendations for the development of mass spectrometry methods for the determination of allergens in foods. J. AOAC Int. 2011, 94, 1026–1033. [Google Scholar]
- Heick, J.; Fischer, M.; Kerbach, S.; Tamm, U.; Popping, B. Application of a liquid chromatography tandem mass spectrometry method for the simultaneous detection of seven allergenic foods in flour and bread and comparison of the method with commercially available Elisa test kits. J. AOAC Int. 2011, 94, 1060–1068. [Google Scholar]
- Lutter, P.; Parisod, V.; Weymuth, H. Development and validation of a method for the quantification of milk proteins in food products based on liquid chromatography with mass spectrometric detection. J. AOAC Int. 2011, 94, 1043–1059. [Google Scholar]
- Blum, H.; Beier, H.; Gross, H.J. Improved silver staining of plant proteins, RNA and DNA in polyacrylamide gels. Electrophoresis 1987, 8, 93–99. [Google Scholar]
- Uniprot. Blast tool. Available online: http://www.uniprot.org (accessed on 15 July 2011).
- Schmitt, D.A.; Nesbit, J.B.; Hurlburt, B.K.; Cheng, H.; Maleki, S.J. Processing can alter the properties of peanut extract preparations. J. Agric. Food Chem. 2010, 58, 1138–1143. [Google Scholar]
- Kang, I.-H.; Gallo, M.; Tillman, B.L. Distribution of allergen composition in peanut (Arachis hypogaea L.) and wild progenitor (Arachis) species. Crop Sci. 2007, 47, 997–1003. [Google Scholar] [CrossRef]
- Li, J.; Shefcheck, K.; Callahan, J.; Fenselau, C. Primary sequence and site-selective hydroxylation of prolines in isoforms of a major peanut allergen protein Ara h 2. Protein Sci. 2010, 19, 174–182. [Google Scholar]
- Pele, M. Peanut allergens. Rom. Biotechnol. Lett. 2010, 15, 5204–5212. [Google Scholar]
- Beck, M.; Claassen, M.; Aebersold, R. Comprehensive proteomics. Curr. Opin. Biotechnol. 2011, 22, 3–8. [Google Scholar]
- Chassaigne, H.; Trègoat, V.; Nørgaard, J.V.; Maleki, S.J.; van Hengel, A.J. Resolution and identification of major peanut allergens using a combination of fluorescence two-dimensional differential gel electrophoresis, western blotting and q-tof mass spectrometry. J. Proteomics 2009, 72, 511–526. [Google Scholar]
- Gosetti, F.; Mazzucco, E.; Zampieri, D.; Gennaro, M.C. Signal suppression/enhancement in high-performance liquid chromatography tandem mass spectrometry. J. Chromatogr. A 2010, 1217, 3929–3937. [Google Scholar]
- Ly, L.; Wasinger, V.C. Protein and peptide fractionation, enrichment and depletion: Tools for the complex proteome. Proteomics 2011, 11, 513–534. [Google Scholar]
- Careri, M.; Costa, A.; Elviri, L.; Lagos, J.B.; Mangia, A.; Terenghi, M.; Cereti, A.; Garoffo, L. Use of specific peptide biomarkers for quantitative confirmation of hidden allergenic peanut proteins Ara h 2 and Ara h 3/4 for food control by liquid chromatography-tandem mass spectrometry. Anal. Bioanal. Chem. 2007, 389, 1901–1907. [Google Scholar]
- Shefcheck, K.J.; Callahan, J.H.; Musser, S.M. Confirmation of peanut protein using peptide markers in dark chocolate using liquid chromatography-tandem mass spectrometry (LC-MS/MS). J. Agric. Food Chem. 2006, 54, 7953–7959. [Google Scholar]
- Picotti, P.; Aebersold, R.; Domon, B. The implications of proteolytic background for shotgun proteomics. Mol. Cell. Proteomics 2007, 6, 1589–1598. [Google Scholar]
- Sherwood, C.A.; Eastham, A.; Lee, L.W.; Risler, J.; Mirzaei, H.; Falkner, J.A.; Martin, D.B. Rapid optimization of MRM-MS instrument parameters by subtle alteration of precursor and product m/z targets. J. Proteome Res. 2009, 8, 3746–3751. [Google Scholar]
- Picotti, P.; Bodenmiller, B.; Mueller, L.N.; Domon, B.; Aebersold, R. Full dynamic range proteome analysis of S. cerevisiae by targeted proteomics. Cell 2009, 138, 795–806. [Google Scholar] [CrossRef]
- Heick, J.; Fischer, M.; Pöpping, B. First screening method for the simultaneous detection of seven allergens by liquid chromatography mass spectrometry. J. Chromatogr. A 2011, 1218, 938–943. [Google Scholar]
- Li, L.; Sun, C.; Freeby, S.; Yee, D.; Kieffer-Jaquinod, S.; Guerrier, L.; Boschetti, E.; Lomas, L. Protein sample treatment with peptide ligand library: Coverage and consistency. J. Proteomics Bioinform. 2009, 2, 485–494. [Google Scholar]
- Mouton-Barbosa, E.; Roux-Dalvai, F.; Bouyssié, D.; Berger, F.; Schmidt, E.; Righetti, P.; Guerrier, L.; Boschetti, E.; Burlet-Schiltz, O.; Monsarrat, B.; Gonzalez de Peredo, A. In depth exploration of cerebrospinal fluid by combining peptide ligand library treatment and label free protein quantification. Mol. Cell. Proteomics 2010, 9, 1006–1021. [Google Scholar]
- Levin, Y.; Hradetzky, E.; Bahn, S. Quantification of proteins using data-independent analysis (MSE) in simple and complex samples: A systematic evaluation. Proteomics 2011, 11, 3273–3287. [Google Scholar]
- Wei, H.; Gledhill, A.; Maleki, S. The Analysis of Allergens in Raw and Roasted Peanuts Using Nanoacquity UPLC and Xevo Q-TOF MS. In Application Note; Waters: Beverley, MA, USA, 2010; p. 8. [Google Scholar]
- Brownridge, P.; Beynon, R.J. The importance of the digest: Proteolysis and absolute quantification in proteomics. Methods 2011, 54, 351–360. [Google Scholar]
© 2012 by the authors; licensee MDPI, Basel, Switzerland. This article is an open-access article distributed under the terms and conditions of the Creative Commons Attribution license (http://creativecommons.org/licenses/by/3.0/).
Share and Cite
Pedreschi, R.; Nørgaard, J.; Maquet, A. Current Challenges in Detecting Food Allergens by Shotgun and Targeted Proteomic Approaches: A Case Study on Traces of Peanut Allergens in Baked Cookies. Nutrients 2012, 4, 132-150. https://doi.org/10.3390/nu4020132
Pedreschi R, Nørgaard J, Maquet A. Current Challenges in Detecting Food Allergens by Shotgun and Targeted Proteomic Approaches: A Case Study on Traces of Peanut Allergens in Baked Cookies. Nutrients. 2012; 4(2):132-150. https://doi.org/10.3390/nu4020132
Chicago/Turabian StylePedreschi, Romina, Jørgen Nørgaard, and Alain Maquet. 2012. "Current Challenges in Detecting Food Allergens by Shotgun and Targeted Proteomic Approaches: A Case Study on Traces of Peanut Allergens in Baked Cookies" Nutrients 4, no. 2: 132-150. https://doi.org/10.3390/nu4020132
APA StylePedreschi, R., Nørgaard, J., & Maquet, A. (2012). Current Challenges in Detecting Food Allergens by Shotgun and Targeted Proteomic Approaches: A Case Study on Traces of Peanut Allergens in Baked Cookies. Nutrients, 4(2), 132-150. https://doi.org/10.3390/nu4020132