
Changes in BMI and Fat Mass and Nutritional Behaviors in Children Between 10 and 14 Years of Age

 ,
, 
 and
and 
Abstract
1. Introduction
2. Materials and Methods
2.1. Participants
2.2. Procedure
2.3. BMI Calculation
2.4. Fat Mass Estimation
2.5. Questionnaire
2.6. Statistical Analysis
3. Results
3.1. Group Characteristics
3.2. Anthropometric Indicators
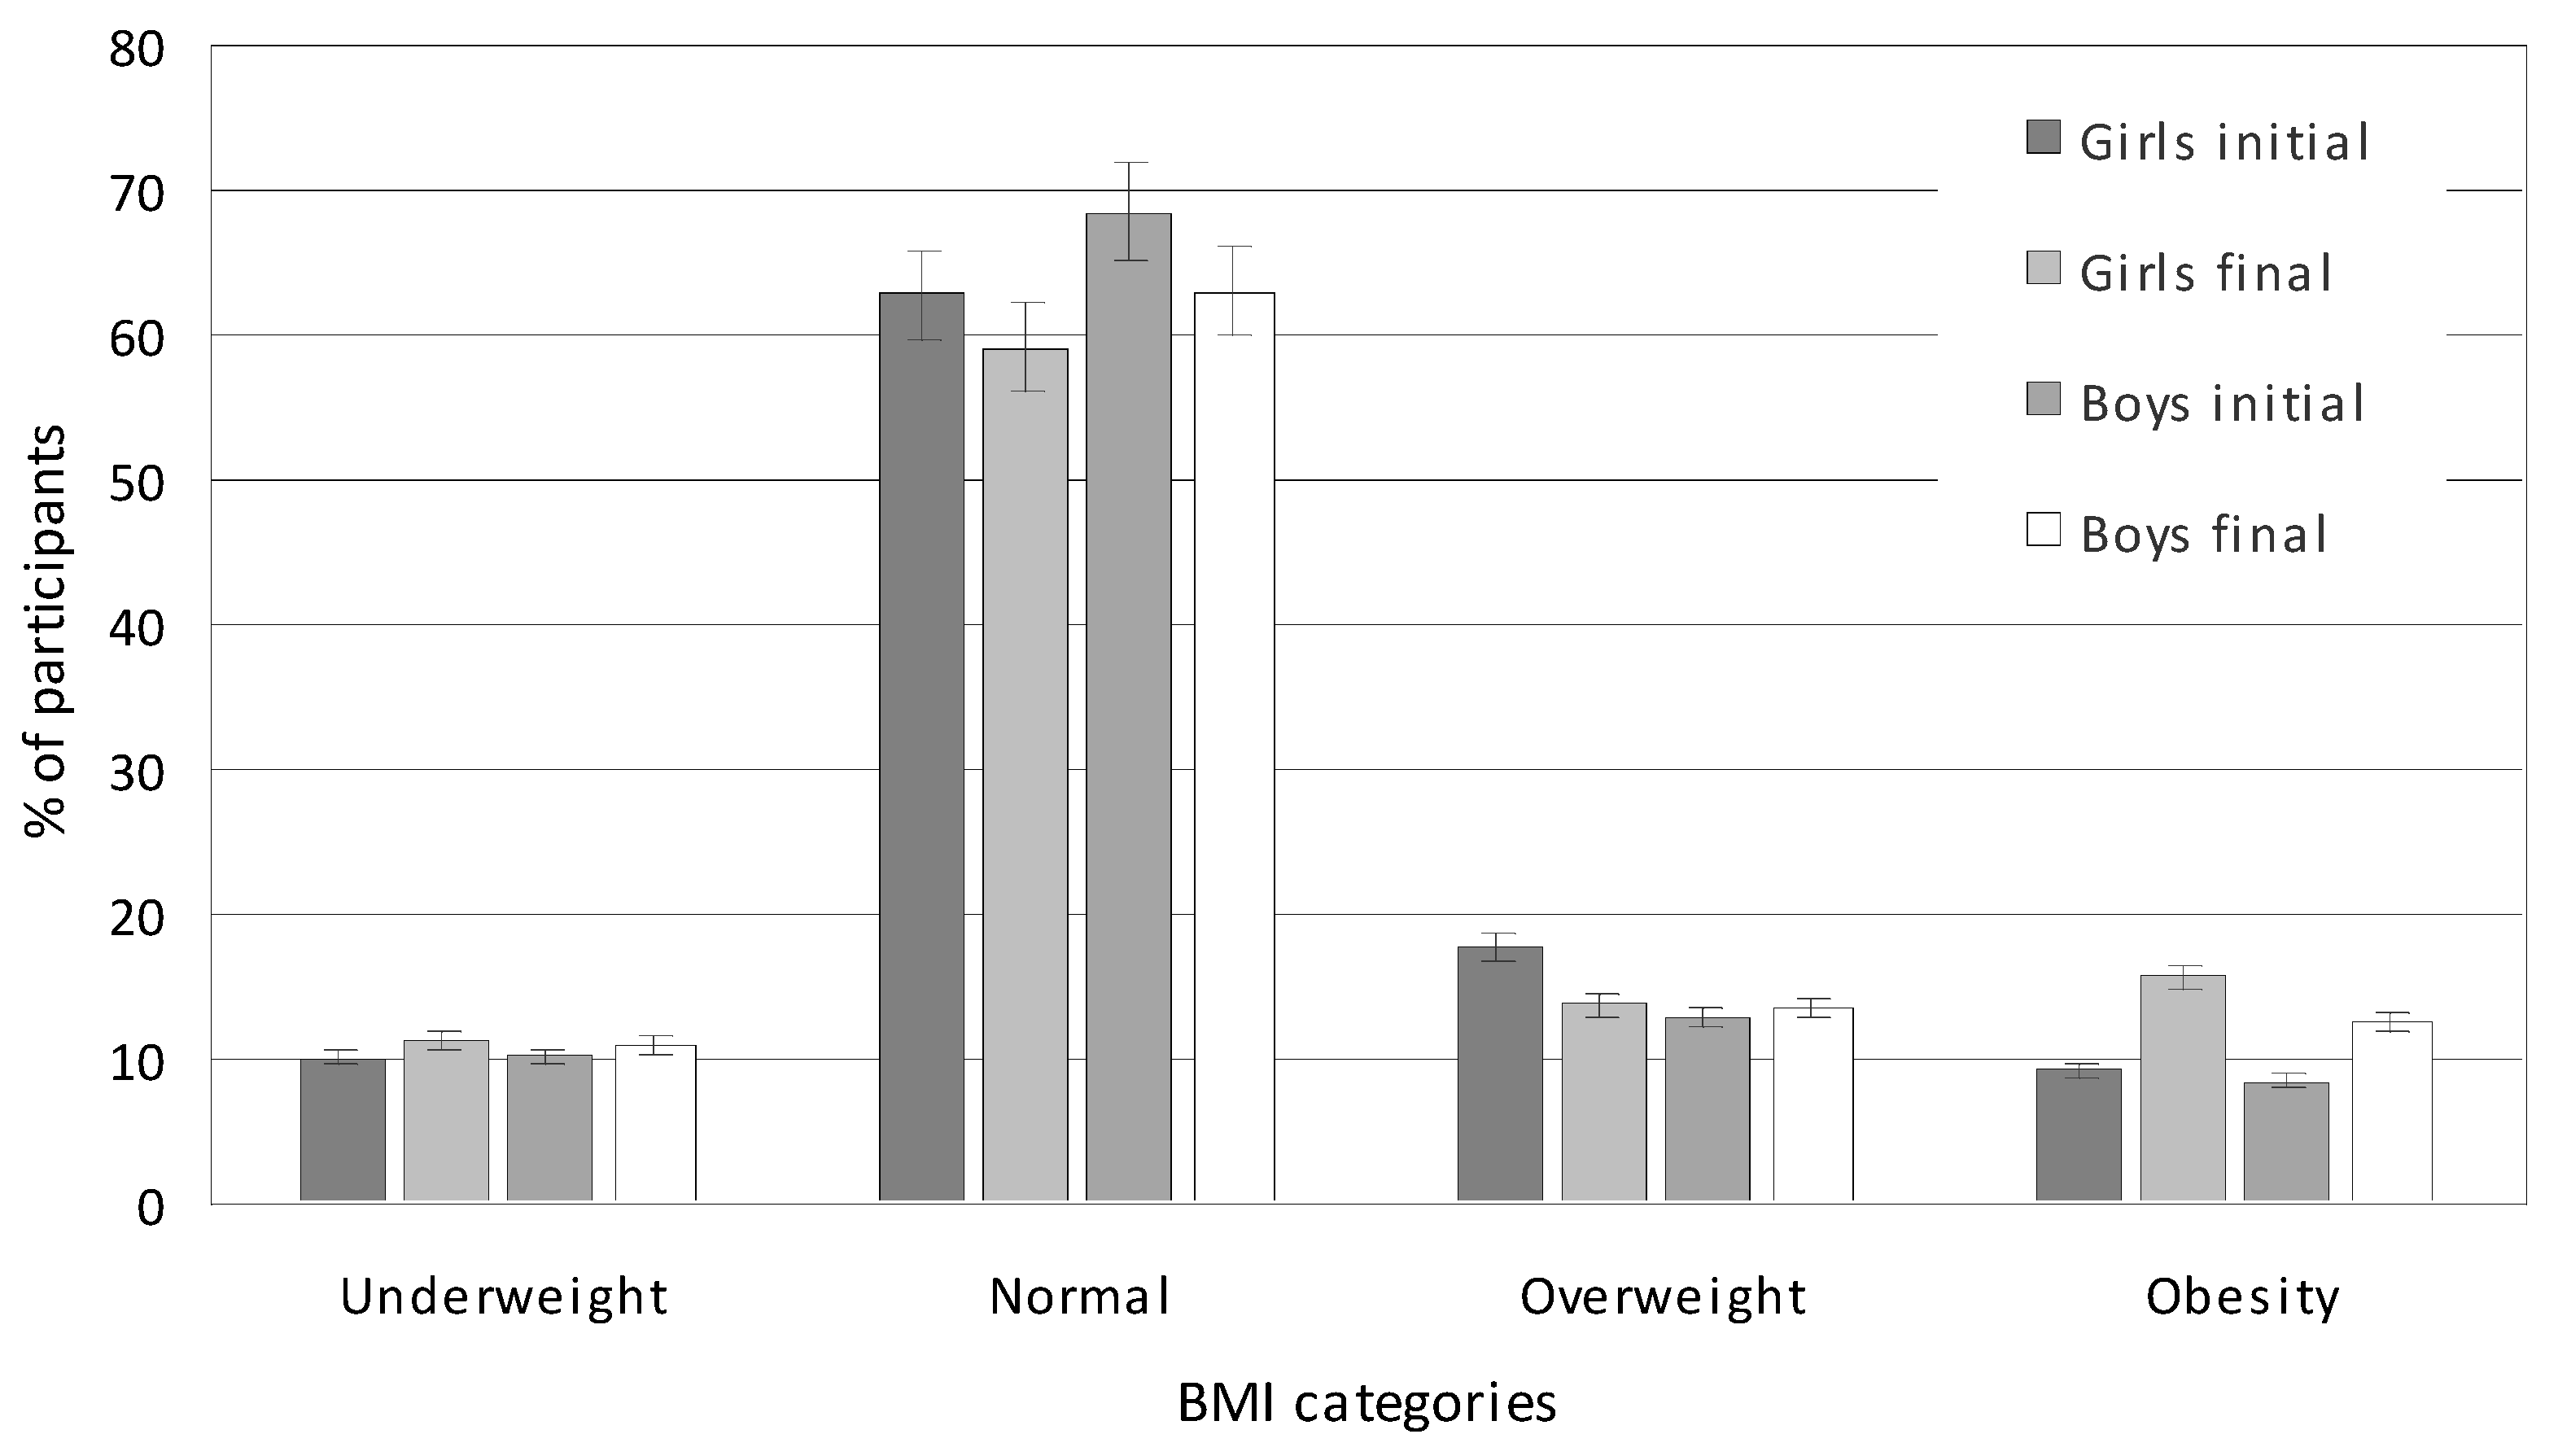
3.3. BMI
3.4. Fat Mass
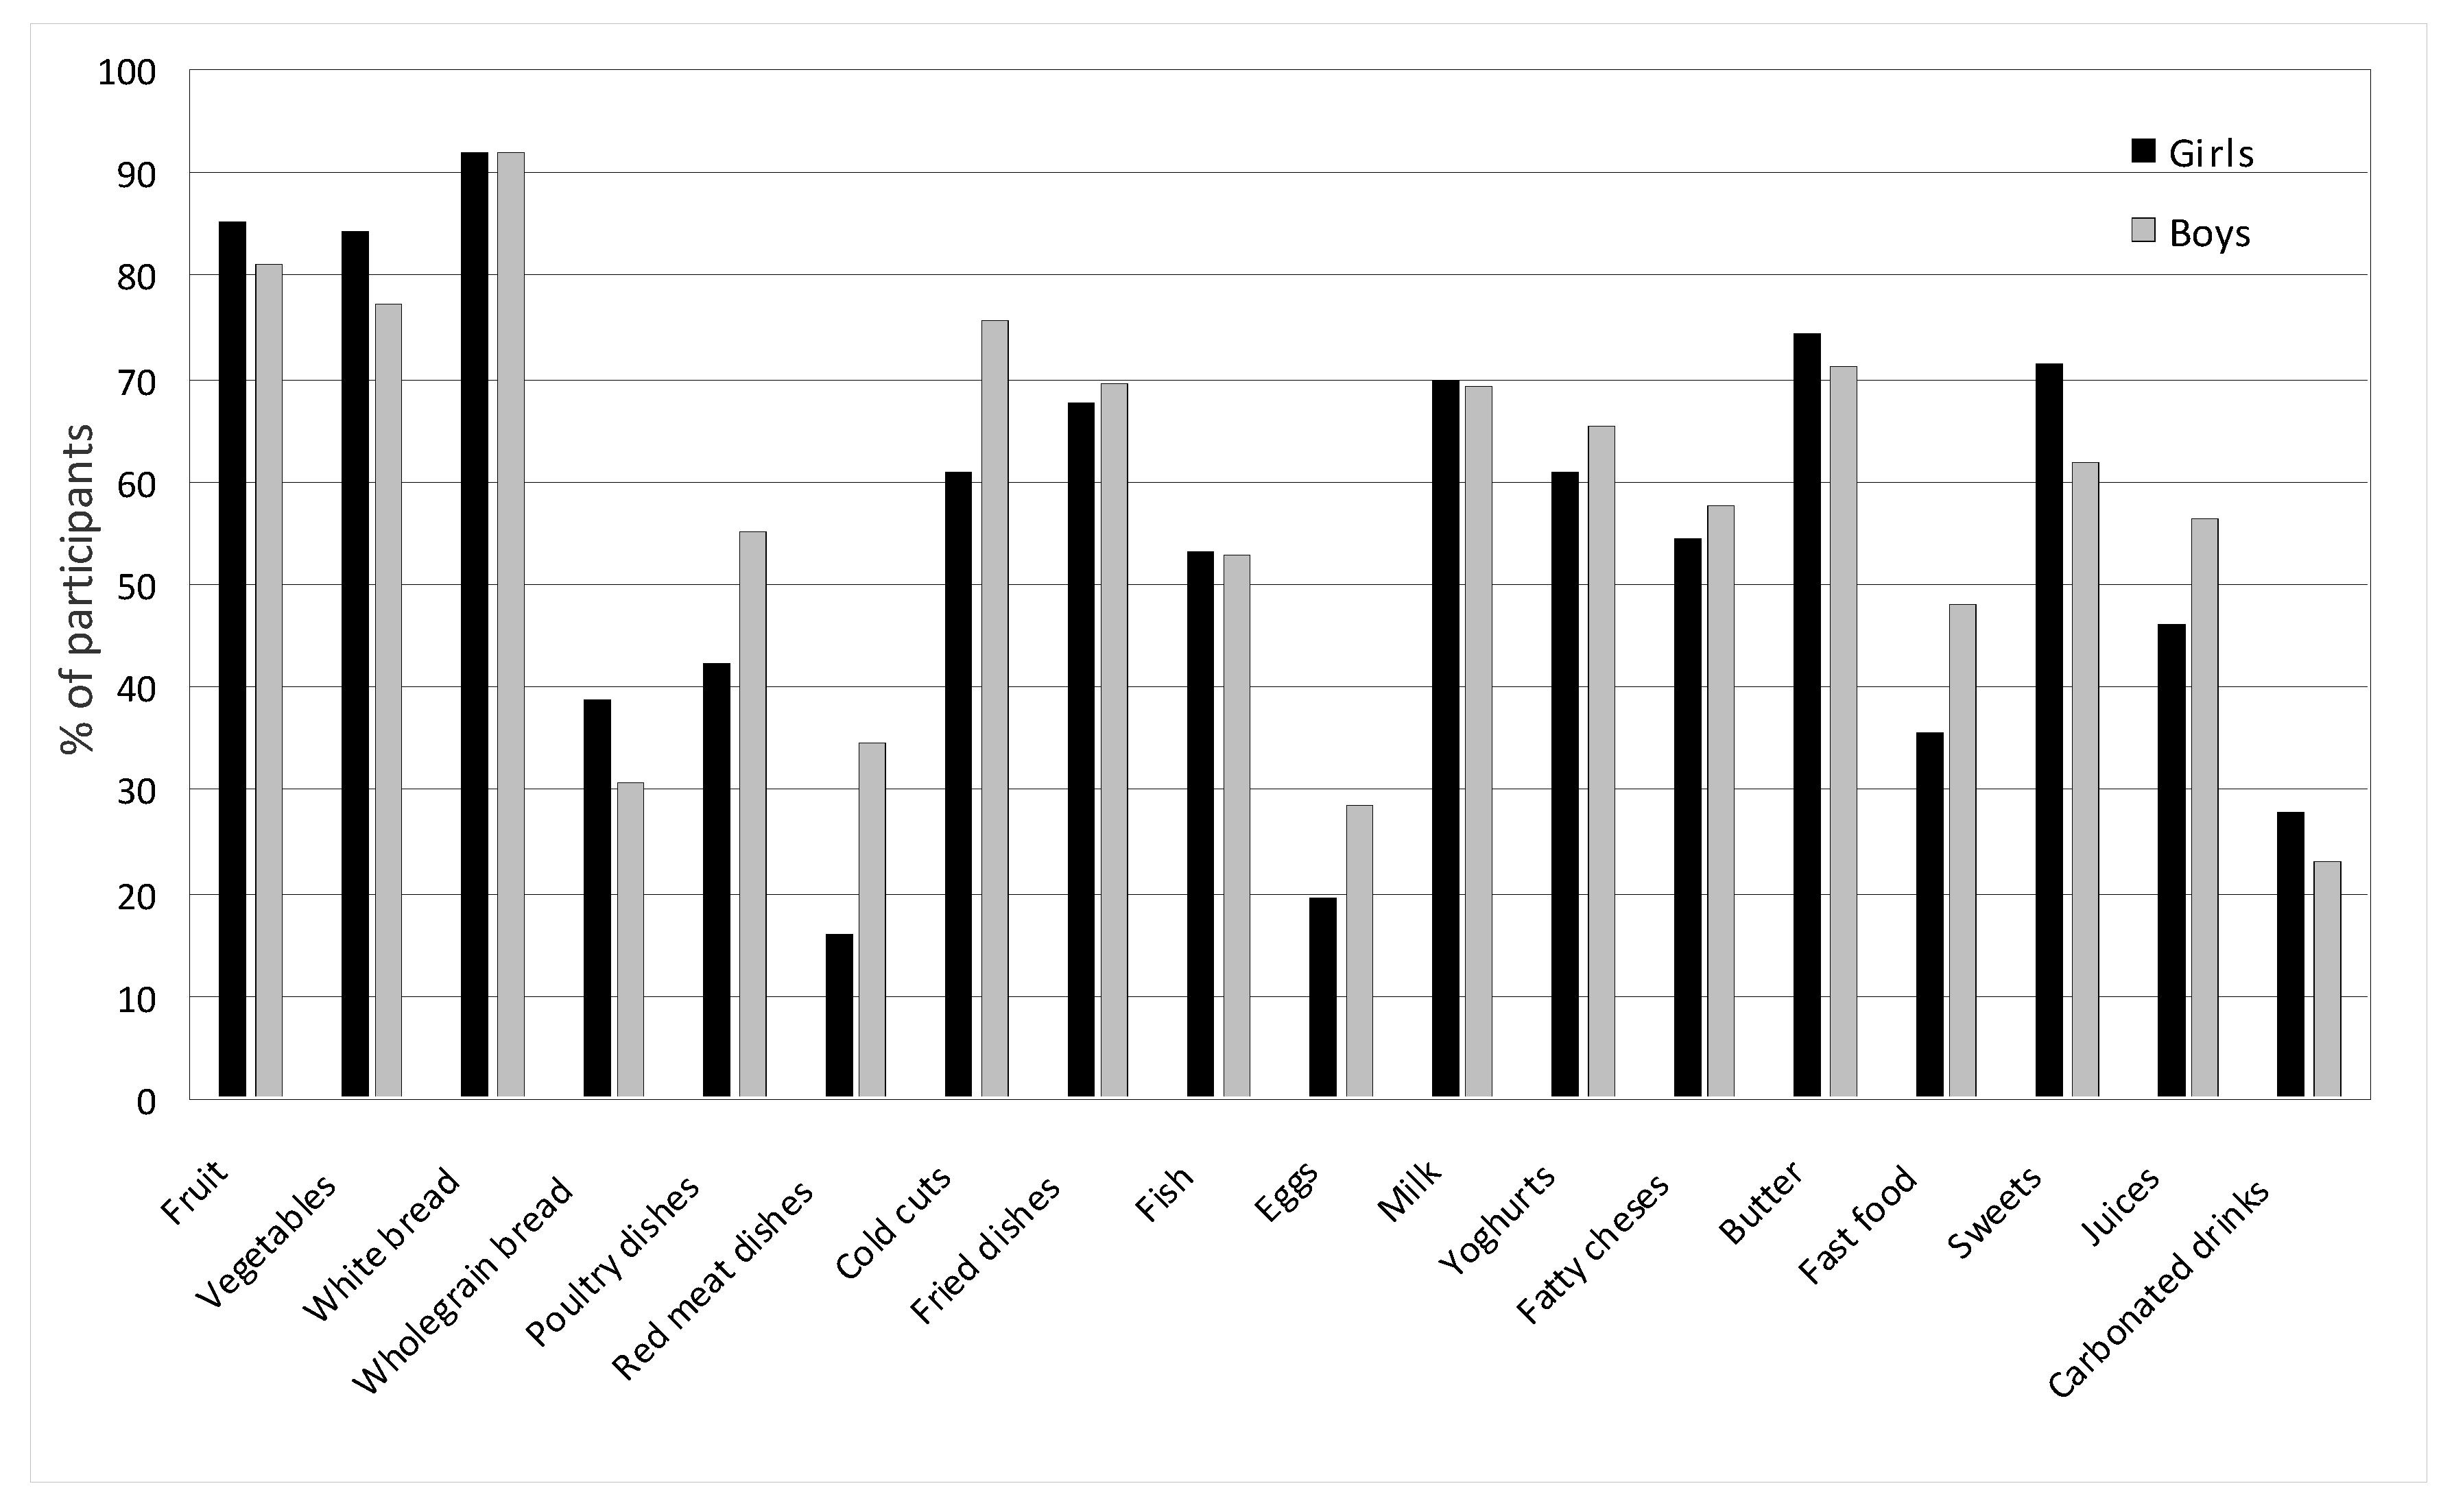
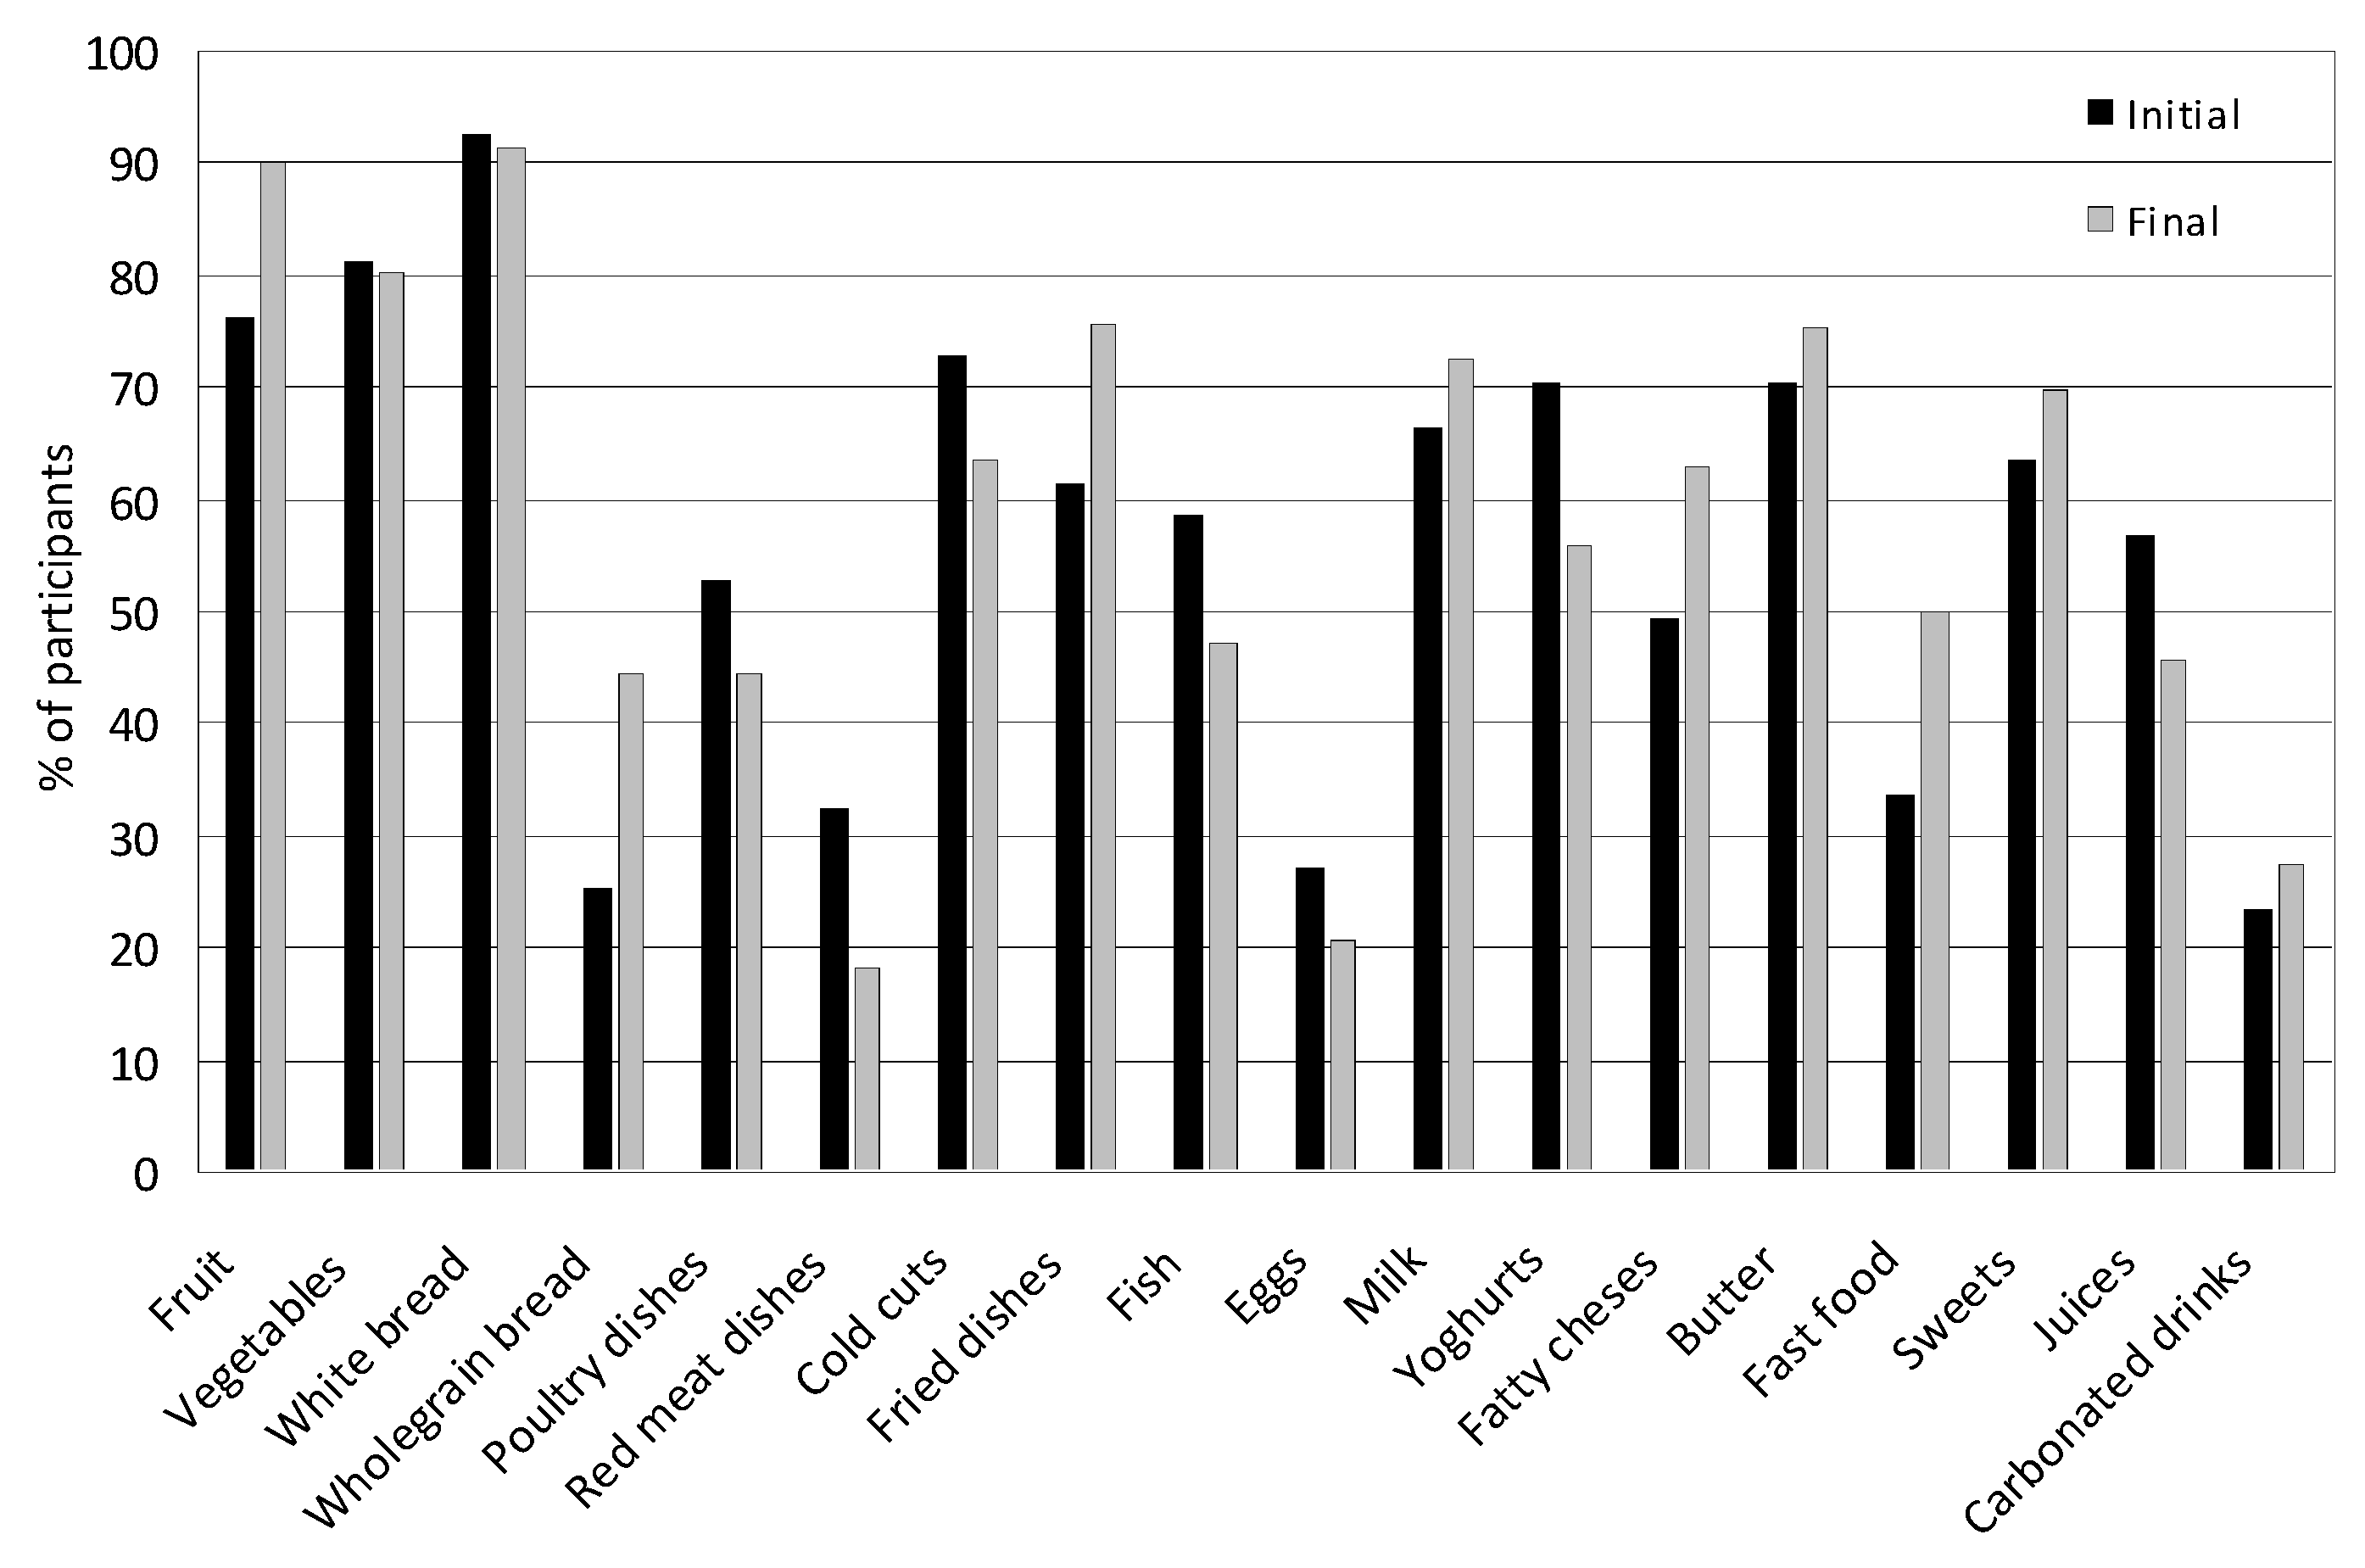
3.5. Nutritional Behaviors
3.6. Analysis of the Variability of Nutritional Behaviors
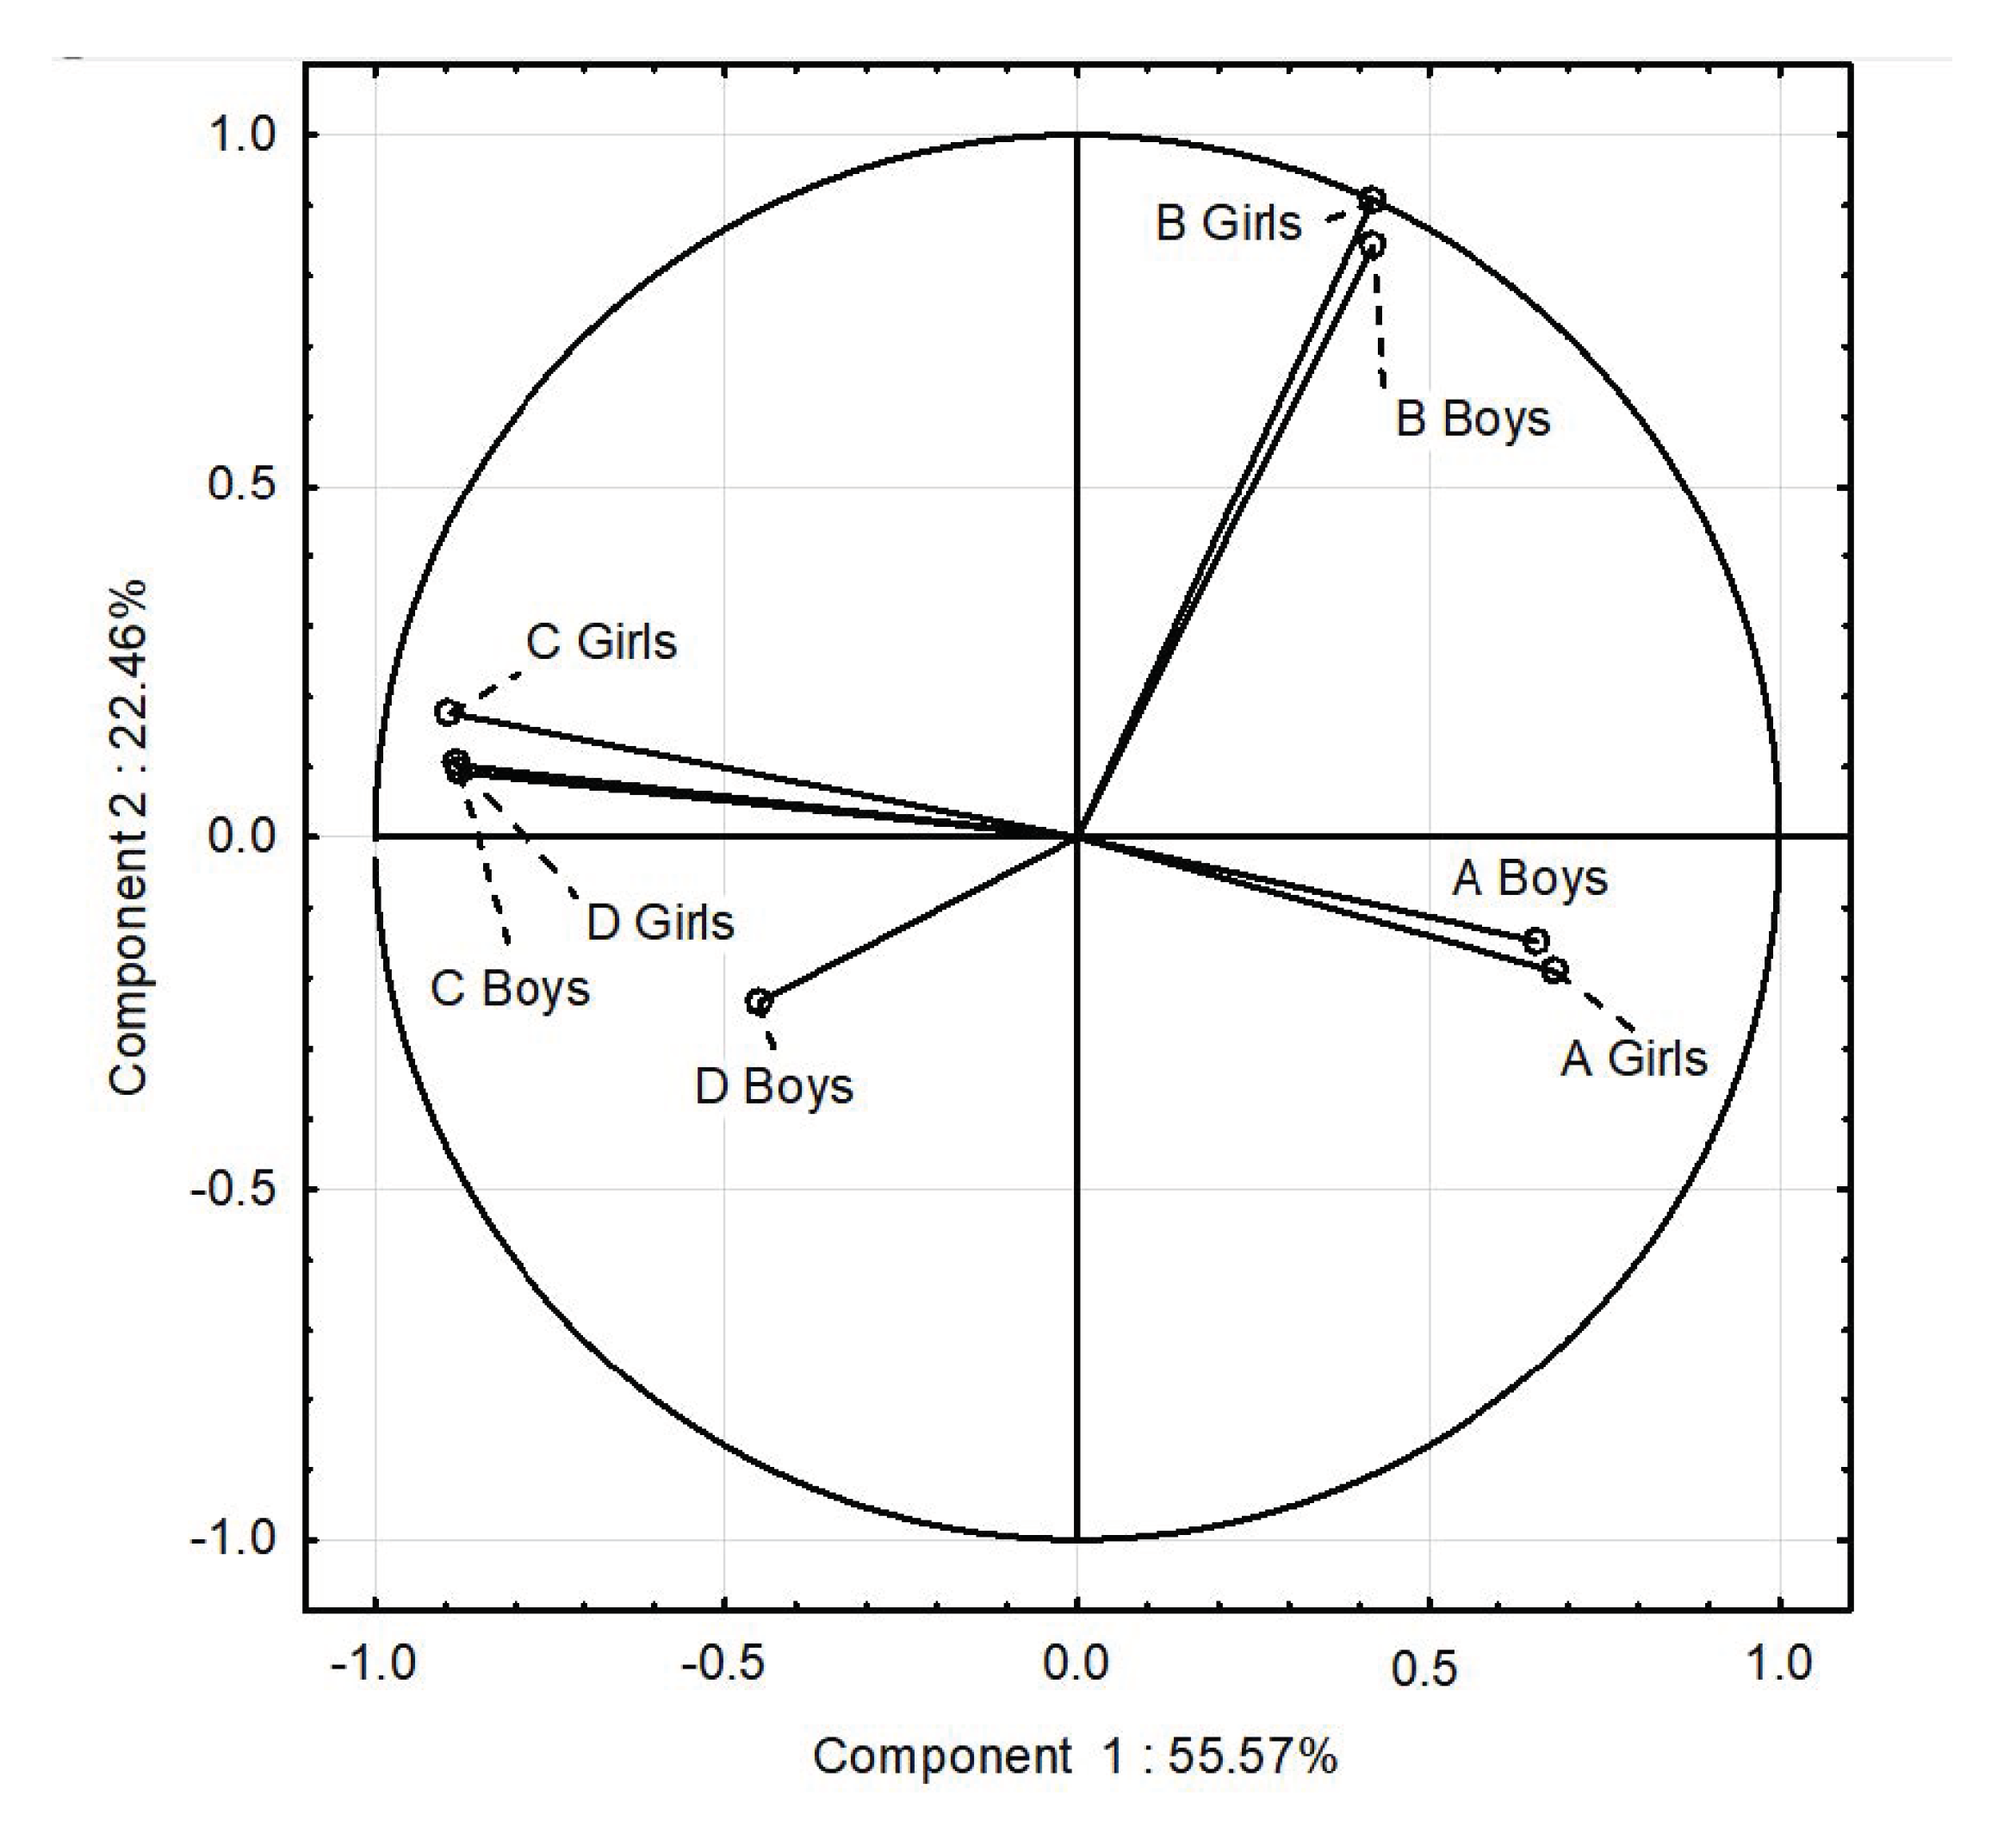
3.7. PCA
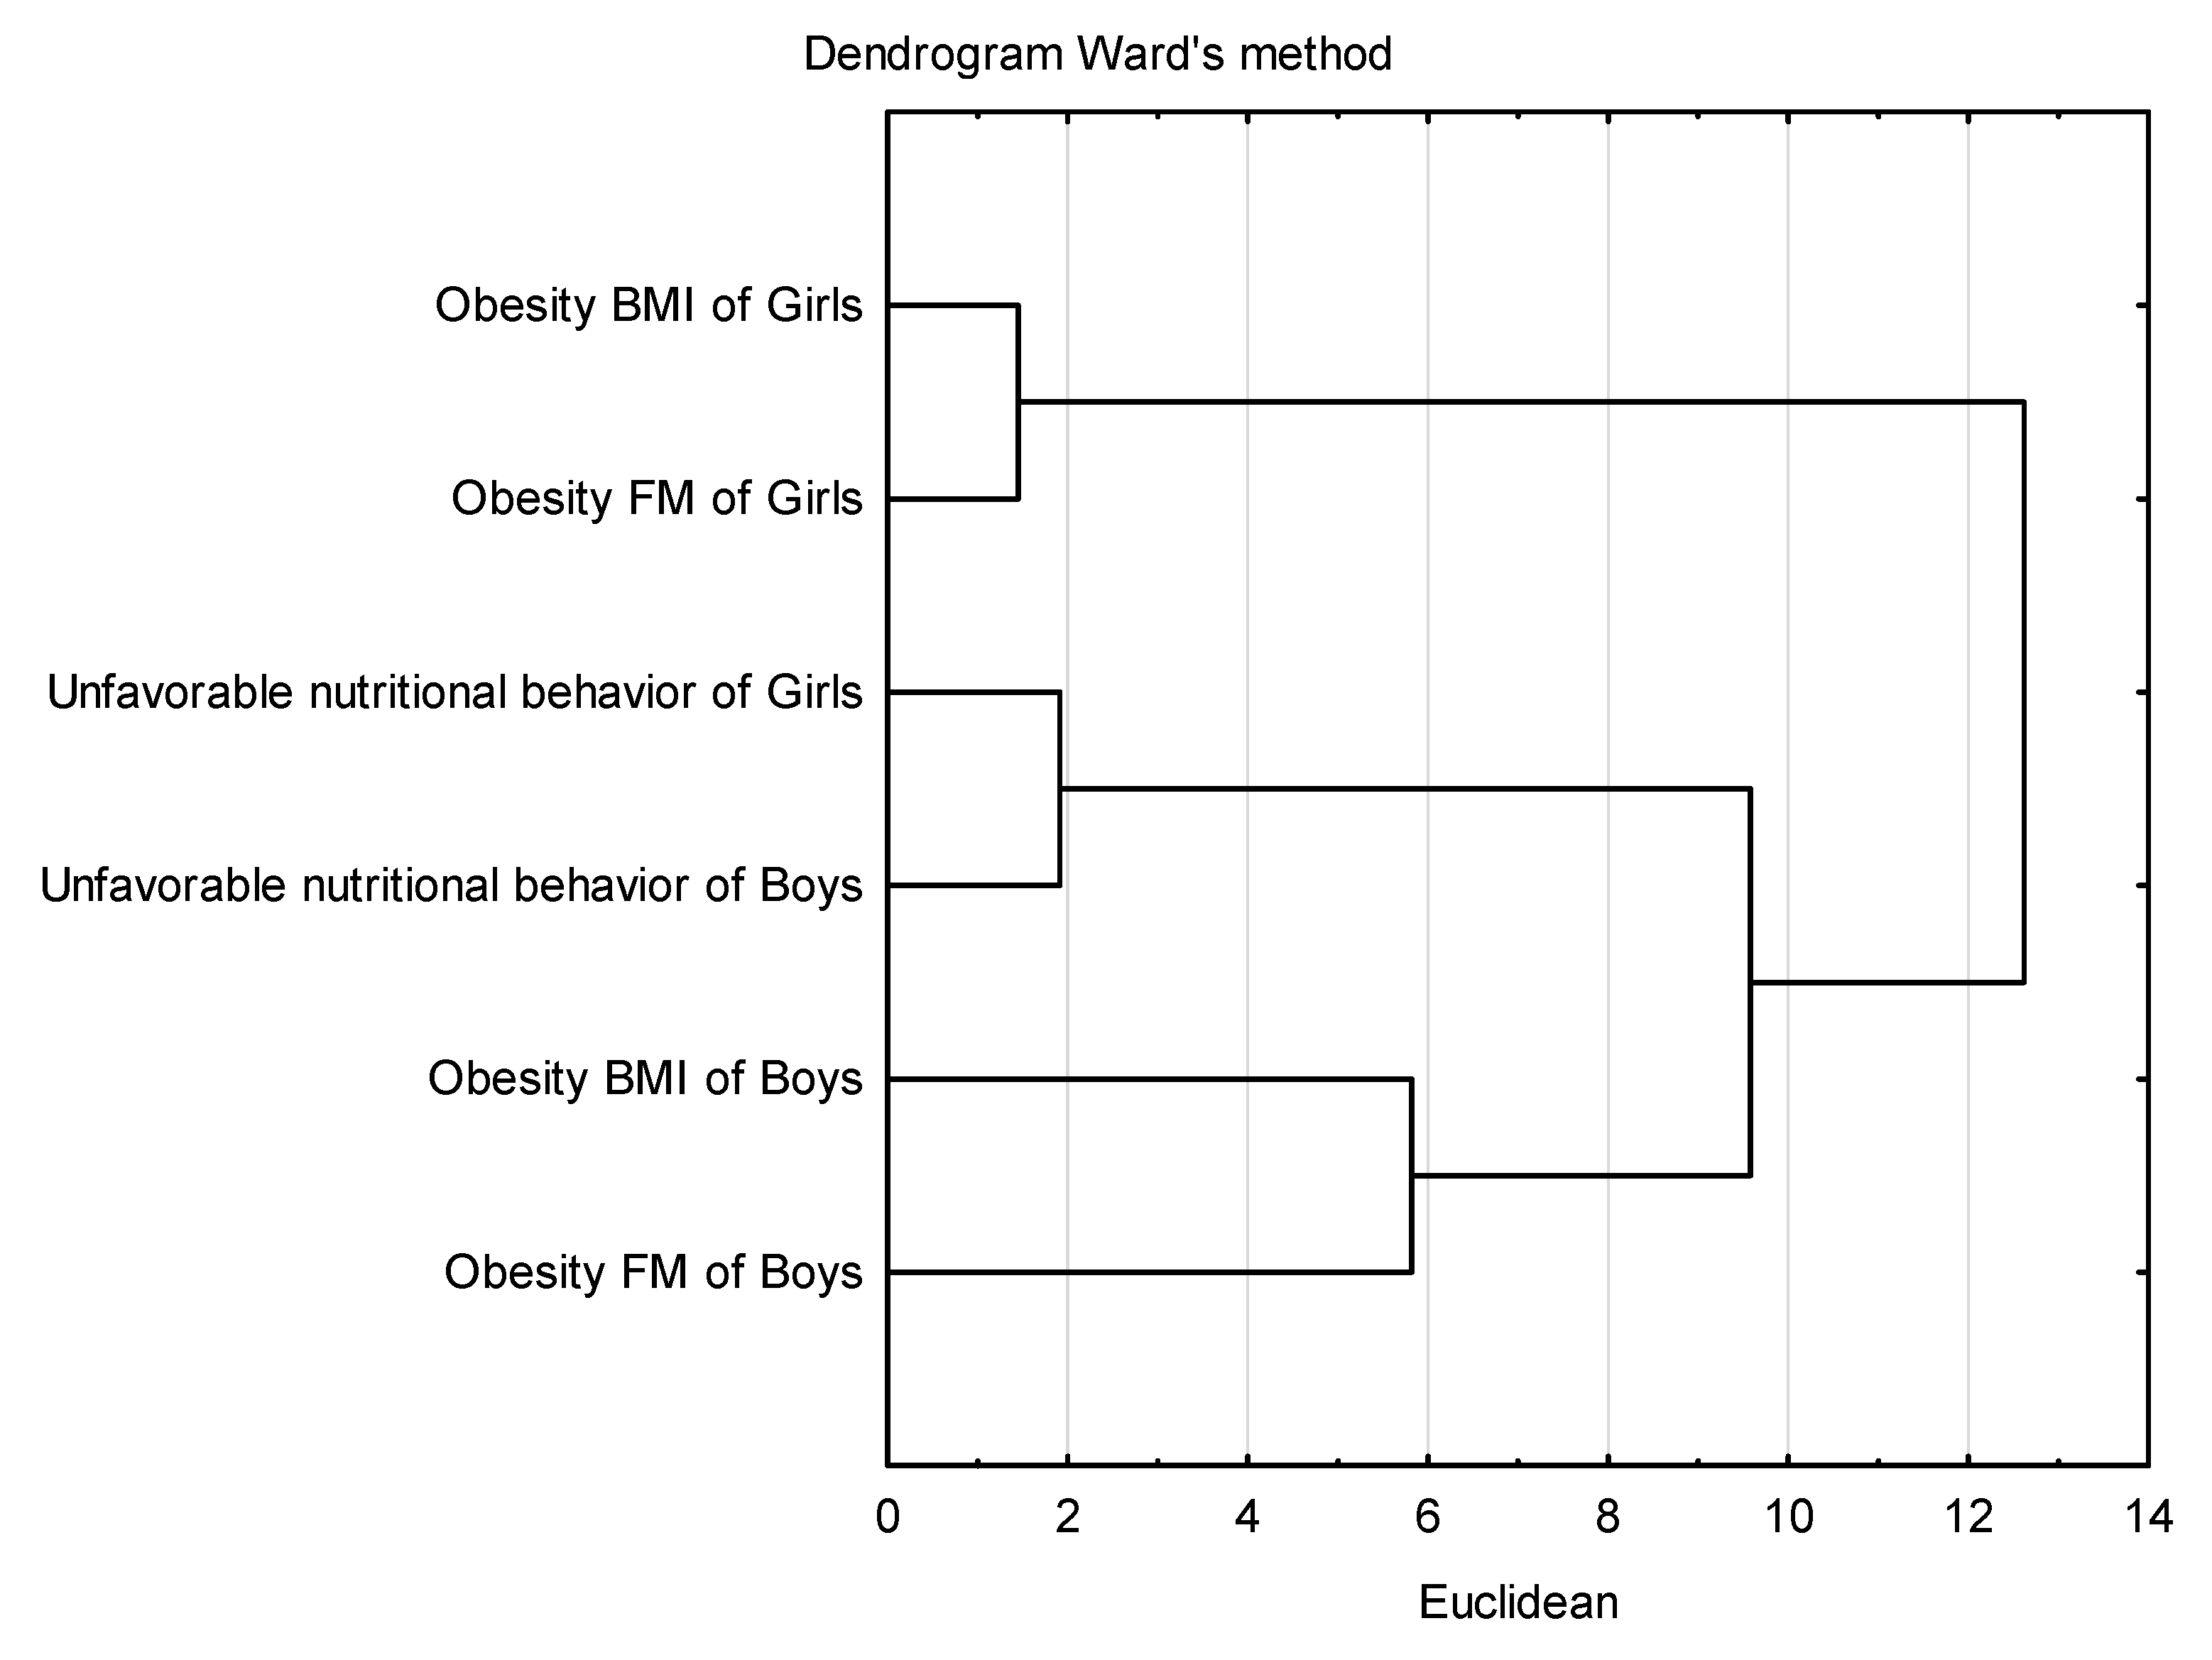
3.8. Cluster Analysis
4. Discussion
5. Conclusions
Author Contributions
Funding
Institutional Review Board Statement
Informed Consent Statement
Data Availability Statement
Acknowledgments
Conflicts of Interest
Abbreviations
| BIA | Bioelectrical Impedance Analysis |
| BMI | Body Mass Index |
| FM | Fat Mass |
| PCA | Principal Component Analysis |
References
- World Obesity Federation. World Obesity Atlas 2024. Available online: https://data.worldobesity.org/publications/WOF-Obesity-Atlas-v7.pdf (accessed on 20 January 2025).
- World Health Organization. Obesity and Overweight. Available online: https://www.who.int/news-room/fact-sheets/detail/obesity-and-overweight (accessed on 14 February 2025).
- Iacopetta, D.; Catalano, A.; Ceramella, J.; Pellegrino, M.; Marra, M.; Scali, E.; Sinicropi, M.S.; Aquaro, S. The Ongoing Impact of COVID-19 on Pediatric Obesity. Pediatr. Rep. 2024, 16, 135–150. [Google Scholar] [CrossRef] [PubMed]
- World Obesity Federation. World Obesity Atlas 2023. Available online: https://data.worldobesity.org/publications/?cat=19 (accessed on 12 January 2025).
- Mazur, J.; Małkowska-Szkutnik, A. (Eds.) Zdrowie Uczniów w 2018 Roku na tle Nowego Modelu Badań HBSC; Mother and Child Institute: Warsaw, Poland, 2018; Available online: https://imid.med.pl/files/imid/Aktualnosci/Aktualnosci/raport%20HBSC%202018.pdf (accessed on 22 February 2025).
- Fijałkowska, A.; Oblacińska, A.; Stalmach, M. Nadwaga i Otyłość u Polskich 8-Latków w Świetle Uwarunkowań Biologicznych, Behawioralnych i Społecznyboys; Raport z Międzynarodowych Badań WHO; European Childhood Obesity Surveillance Initiative (COSI): Warszawa, Poland, 2017; Available online: https://imid.med.pl/files/imid/Do%20pobrania/Raport%20COSI_kwiecie%C5%84.pdf (accessed on 11 February 2025).
- World Health Organization. WHO European Regional Obesity Report 2022; World Health Organization: Geneva, Switzerland, 2022; Available online: https://apps.who.int/iris/bitstream/handle/10665/353747/9789289057738-eng.pdf (accessed on 20 January 2025).
- Dettlaff-Dunowska, M.; Brzeziński, M.; Zagierska, A.; Borkowska, A.; Zagierski, M.; Szlagatys-Sidorkiewicz, A. Changes in Body Composition and Physical Performance in Children with Excessive Body Weight Participating in an Integrated Weight-Loss Programme. Nutrients 2022, 14, 3647. [Google Scholar] [CrossRef] [PubMed]
- Ługowska, K.; Kolanowski, W.; Trafialek, J. The Impact of Physical Activity at School on Children’s Body Mass during 2 Years of Observation. Int. J. Environ. Res. Public Health 2022, 19, 3287. [Google Scholar] [CrossRef] [PubMed]
- Kolanowski, W.; Ługowska, K. The Effectiveness of Physical Activity Intervention at School on BMI and Body Composition in Overweight Children: A Pilot Study. Appl. Sci. 2024, 14, 7705. [Google Scholar] [CrossRef]
- Ng, A.K.; Hairi, N.N.; Jalaludin, M.Y.; Majid, H.A. Dietary intake, physical activity and muscle strength among adolescents: The Malaysian Health and Adolescents Longitudinal Research Team (MyHeART) study. BMJ Open. 2019, 9, 026275. [Google Scholar] [CrossRef]
- Dortch, K.S.; Gay, J.; Springer, A.; Kohl, H.W.; Sharma, S.; Saxton, D.; Wilson, K.; Hoelscher, D. The Association between Sport Participation and Dietary Behaviors among Fourth Graders in the School Physical Activity and Nutrition Survey, 2009–2010. Am. J. Health Promot. 2014, 29, 99–106. [Google Scholar] [CrossRef]
- Borga, M.; West, J.; Bell, J.D.; Harvey, N.C.; Romu, T.; Heymsfield, S.B. Advanced body composition assessment: From body mass index to body composition profiling. J. Investig. Med. 2018, 66, 1–9. [Google Scholar] [CrossRef]
- Kułaga, Z.; Różdżyńska, A.; Palczewska, I. Percentile charts of height, body mass and body mass index in children and adolescents in Poland—Results of the OLAF study. Stand. Med. Pediatr. 2010, 7, 690–700. [Google Scholar]
- Laskey, M.A. Dual-energy X-ray absorptiometry and body composition. Nutrition 1996, 12, 45–51. [Google Scholar] [CrossRef]
- Verney, J.; Metz, L.; Chaplais, E.; Cardenoux, C.; Pereira, B.; Thivel, D. Bioelectrical impedance is an accurate method to assess body composition in obese but not severely obese adolescents. Nutr. Res. 2016, 36, 663–670. [Google Scholar] [CrossRef]
- Seo, Y.G.; Kim, J.H.; Kim, Y.; Lim, H.; Ju, Y.S.; Kang, M.J.; Lee, K.; Lee, H.J.; Jang, H.B.; Park, S.I.; et al. Validation of body composition using bioelectrical impedance analysis in children according to the degree of obesity. Scand. J. Med. Sci. Sports 2018, 28, 2207–2215. [Google Scholar] [CrossRef] [PubMed]
- McCarthy, H.D.; Cole, T.J.; Fry, T.; Jebb, S.A.; Prentice, A.M. Body fat reference curves for children. Int. J. Obes. 2006, 30, 598–602. [Google Scholar] [CrossRef] [PubMed]
- National Center of Nutrition Education. Healthy Eating Plate. Available online: https://ncez.pzh.gov.pl/abc-zywienia/talerz-zdrowego-zywienia/ (accessed on 2 November 2024).
- McCarthy, H.D.; Samani–Radia, D.; Jebb, S.A.; Prentice, A.M. Skeletal muscle mass reference curves for children and adolescents. Pediatr. Obes. 2014, 9, 249–259. [Google Scholar] [CrossRef] [PubMed]
- Ługowska, K.; Kolanowski, W. The Impact of Physical Activity at School on Body Fat Content in School-Aged Children. Int. J. Environ. Res. Public Health 2022, 19, 12514. [Google Scholar] [CrossRef]
- Food and Agriculture Organization of the United Nations. Influencing Food Environments for Healthy Diets; FAO: Rome, Italy, 2016; Available online: https://openknowledge.fao.org/server/api/core/bitstreams/1c4161e0-8858-4183-b39f-4c76cba27304/content (accessed on 10 December 2024).
- Lytle, L.; Seifert, S.; Greenstein, J.; Mcgovern, P. How do children’s eating patterns and food choices change over time? results from a Ccohort study. Am. J. Health Promot. 2000, 14, 222–228. [Google Scholar] [CrossRef]
- Lillico, H.G.; Hammond, D.; Manske, S.; Murnaghan, D. The prevalence of eating behaviors among Canadian youth using cross-sectional school-based surveys. BMC Public Health 2014, 14, 323. [Google Scholar] [CrossRef]
- Kolanowski, W.; Ługowska, K.; Trafialek, J. The Impact of Physical Activity at School on Eating Behaviour and Leisure Time of Early Adolescents. Int. J. Environ. Res. Public Health 2022, 19, 16490. [Google Scholar] [CrossRef]
- Lombardo, M.; Amoah, I.; Feraco, A.; Guseva, E.; Gorini, S.; Camajani, E.; Armani, A.; Padua, E.; Caprio, M. Gender Differences in Taste and Food Habits: Implications for Personalized Nutrition. Biol. Life Sci. Forum 2023, 29, 1. [Google Scholar] [CrossRef]
- Deslippe, A.L.; Tugault-Lafleur, C.N.; McGaughey, T.; Naylor, P.P.J.; Le Mare, L.; Masse, L.C. Gender plays a role in adolescents’ dietary behaviors as they transition to secondary school. Appetite 2021, 167, 105642. [Google Scholar] [CrossRef]
- Kozioł-Kozakowska, A. Adequate Nutrition in Early Childhood. Children 2023, 10, 1155. [Google Scholar] [CrossRef]
- Kontroli, N.I. Wdrażanie zasad zdrowego żywienia w szkołach publicznych 2015–2016. Available online: https://www.nik.gov.pl/plik/id,14601,vp,17066.pdf (accessed on 15 December 2024).
- Lopez-Gil, J.F.; Garcia-Hermoso, A.; Sotos-Prieto, M.; Cavero-Redondo, I.; Martinez-Vizcaino, V.; Kales, S.N. Mediterranean Diet-Based Interventions to Improve Anthropometric and Obesity Indicators in Children and Adolescents: A Systematic Review with Meta-Analysis of Randomized Controlled Trials. Adv. Nutr. 2023, 14, 858–869. [Google Scholar] [CrossRef] [PubMed]
- Martínez-Lacoba, R.; Pardo-Garcia, I.; Amo-Saus, E.; Escribano-Sotos, F. Mediterranean diet and health outcomes: A systematic meta-review. Eur. J. Public Health 2018, 28, 955–961. [Google Scholar] [CrossRef] [PubMed]
- Cabrera, S.G.; Herrera Fernández, N.; Rodríguez Hernández, C.; Nissensohn, M.; Román-Viñas, B.; Serra-Majem, L. KIDMED test; prevalence of low adherence to the Mediterranean diet in children and young; a systematic review. Nutr. Hosp. 2015, 32, 2390–2399. [Google Scholar]
- Faul, F.; Erdfelder, E.; Lang, A.G.; Buchner, A. G*Power 3: A flexible statistical power analysis program for the social, behavioral, and biomedical sciences. Behav. Res. Methods 2007, 39, 175–191. [Google Scholar] [CrossRef]
- Lisinskiene, A.; Lochbaum, M. The Coach-Athlete-Parent Relationship: The Importance of the Sex, Sport Type, and Family Composition. Int. J. Environ. Res. Public Health 2022, 19, 4821. [Google Scholar] [CrossRef]
- Kułaga, Z.; Grajda, A.; Gurzkowska, B.; Góźdź, M.; Wojtyło, M.; Świąder, A.; Różdżyńska-Świątkowska, A.; Litwin, M. Polish 2012 growth references for preschool children. Eur. J. Pediatr. 2013, 172, 753–761. [Google Scholar] [CrossRef]
- Ługowska, K.; Krzęcio-Nieczyporuk, E.; Trafiałek, J.; Kolanowski, W. The Impact of Increased Physical Activity at School on the Nutritional Behavior and BMI of 13-Year-Olds. Nutrients 2024, 16, 4329. [Google Scholar] [CrossRef]
- Jeżewska-Zychowicz, M.; Gawęcki, J.; Wądołowska, L.; Czarnocińska, J.; Galiński, G.; Kołłajtis-Dołowy, A.; Roszkowski, W.; Wawrzyniak, A.; Przybyłowicz, K.; Stasiewicz, B. Kwestionariusz do Badania Poglądów i Zwyczajów Żywieniowych dla Osób w Wieku od 16 do 65 lat; Polish Academy of Nciences: Warsaw, Poland, 2020; pp. 22–34. [Google Scholar]
- World Medical Association. World Medical Association Declaration of Helsinki. Bull World Health Organ. 2013, 79, 373–374. [Google Scholar]
- Farbo, D.J.; Rhea, D.J. A Pilot Study Examining Body Composition Classification Differences between Body Mass Index and Bioelectrical Impedance Analysis in Children with High Levels of Physical Activity. Front. Pediatr. 2021, 9, 724053. [Google Scholar] [CrossRef]
- Marfell-Jones, M.; Old, T.; Steward, A.; Carter, J.E.L. International Standards for Anthropometric Assessment; ISAK: Palmerston North, New Zeland, 2012. [Google Scholar]
- Orsso, C.E.; Gonzalez, M.C.; Maisch, M.J.; Haqq, A.M.; Prado, C.M. Using bioelectrical impedance analysis in children and adolescents: Pressing issues. Eur. J. Clin. Nutr. 2022, 76, 659–665. [Google Scholar] [CrossRef]
- Tanita SC-240MA Instruction Manual. Tanita User Manual SC 240 MA. Available online: https://www.manualslib.com/manual/1065295/Tanita-Sc-240ma.html (accessed on 12 October 2020).
- Sullivan, G.M.; Feinn, R. Using Effect Size—Or Why the P Value Is Not Enough. J. Grad. Med. Educ. 2012, 4, 279–282. [Google Scholar] [CrossRef] [PubMed]
- Zhang, X.; Liu, J.; Ni, Y.; Yi, C.; Fang, Y.; Ning, Q.; Shen, B.; Zhang, K.; Liu, Y.; Yang, L.; et al. Global Prevalence of Overweight and Obesity in Children and Adolescents: A Systematic Review and Meta-Analysis. JAMA Pediatr. 2024, 178, 800–813. [Google Scholar] [CrossRef] [PubMed]
- Stierman, B.; Ogden, C.L.; Yanowski, J.A.; Martin, C.B.; Sarafrazi, N.; Hales, C.M. Changes in adiposity among children and adolescents in the United States, 1999–2006 to 2011–2018. Am. J. Clin. Nutr. 2021, 114, 1495–1504. [Google Scholar] [CrossRef] [PubMed]
- Deren, K.; Wyszynska, J.; Nyankovsky, S.; Nyankovska, O.; Yatsula, M.; Łuszczki, E.; Sobolewski, M.; Mazur, A. Assessment of body mass index in a pediatric population aged 7–17 from Ukraine according to various international criteria-A cross-sectional study. PLoS ONE 2020, 15, e0244300. [Google Scholar] [CrossRef]
- Vehrs, P.R.; Fellingham, G.W.; McAferty, A.; Kelsey, L. Trends in BMI Percentile and Body Fat Percentage in Children 12 to 17 Years of Age. Children 2022, 9, 744. [Google Scholar] [CrossRef]
- Kułaga, Z.; Grajda, A.; Gurzkowska, B.; Wojtyło, M.A.; Góźdź, M.; Litwin, M.S. The Prevalence of Overweight and Obesity among Polish School-Aged Children and Adolescents. Przegl. Epidemiol. 2016, 70, 641–651. [Google Scholar]
- Browne, N.T.; Snethen, J.A.; Greenberg, C.S.; Frenn, M.; Kilanowski, J.F.; Gance-Cleveland, B.; Burke, P.J.; Lewandowski, L. When Pandemics Collide: The Impact of COVID-19 on Childhood Obesity. J. Pediatr. Nurs. 2020, 56, 90. [Google Scholar] [CrossRef]
- Lartey, S.T.; Jayawardene, W.P.; Dickinson, S.L.; Chen, X.; Gletsu-Miller, N.; Lohrmann, D.K. Evaluation of Unintended Consequences of COVID-19 Pandemic Restrictions and Obesity Prevalence Among Youths. JAMA Netw. Open. 2023, 6, e2323596. [Google Scholar] [CrossRef]
- Woolford, S.J.; Sidell, M.; Li, X.; Else, V.; Young, D.R.; Resnicow, K.; Koebnick, C. Changes in Body Mass Index Among Children and Adolescents During the COVID-19 Pandemic. JAMA 2021, 326, 1434–1436. [Google Scholar] [CrossRef]
- Santos, L.P.; Santos, I.S.; Matijasevich, A.; Barros, A.J.D. Changes in overall and regional body fatness from childhood to early adolescence. Sci. Rep. 2019, 9, 1888. [Google Scholar] [CrossRef]
- Shypailo, R.J.; Wong, W.W. Fat and fat-free mass index references in children and young adults: Assessments along racial and ethnic lines. Am. J. Clin. Nutr. 2020, 112, 566–575. [Google Scholar] [CrossRef] [PubMed]
- Zhao, Y.; Gong, J.X.; Ji, Y.T.; Zhao, X.Y.; He, L.; Cai, S.Z.; Yan, X.M. Cross-sectional study of characteristics of body composition of 24,845 children and adolescents aged 3–17 years in Suzhou. BMC Pediatr. 2023, 23, 358. [Google Scholar] [CrossRef] [PubMed]
- Nevill, A.M.; Reuter, C.P.; Brand, C.; Gaya, A.R.; Mota, J.; Renner, J.D.P.; Duncan, M.J. BMI fails to reflect the developmental changes in body fatness between boys and girls during adolescence. Int. J. Environ. Res. Public Health 2021, 18, 7833. [Google Scholar] [CrossRef] [PubMed]
- Freedman, D.S.; Wang, J.; Maynard, L.M.; Thorton, J.C.; Mei, Z.; Pierson, R.N.; Dietz, W.H.; Horlick, M. Relation of BMI to fat and fat-free mass amoung children and adolescents. Int. J. Obes. 2005, 29, 1–8. [Google Scholar] [CrossRef]
- Hamulka, J.; Wadolowska, L.; Hoffmann, M.; Kowalkowska, J.; Gutkowska, K. Effect of an Education Program on Nutrition Knowledge, Attitudes toward Nutrition, Diet Quality, Lifestyle, and Body Composition in Polish Teenagers. The ABC of Healthy Eating Project: Design, Protocol, and Methodology. Nutrients 2018, 10, 1439. [Google Scholar] [CrossRef]
- Lima, N.M.D.S.; Leal, V.S.; Oliveira, J.S.; Andrade, M.I.S.; Santos, N.F.D.; Pessoa, J.T.; Aquino, N.B.; Lira, P.I.C. Excess weight in adolescents and associated factors: Data from the ERICA study. J. Pediatr. 2021, 97, 676–684. [Google Scholar] [CrossRef]
- Scaglioni, S.; De Cosmi, V.; Ciappolino, V.; Parazzini, F.; Brambilla, P.; Agostoni, C. Factors Influencing Children’s Eating Behaviours. Nutrients 2018, 10, 706. [Google Scholar] [CrossRef]
- Jakobsen, D.D.; Brader, L.; Bruun, J.M. Association between Food, Beverages and Overweight/Obesity in Children and Adolescents-A Systematic Review and Meta-Analysis of Observational Studies. Nutrients 2023, 15, 764. [Google Scholar] [CrossRef]
- Hur, I.Y.; Reicks, M. Relationship between whole-grain intake, chronic disease risk indicators, and weight status among adolescents in the National Health and Nutrition Examination Survey, 1999–2004. J. Acad. Nutr. Diet. 2012, 112, 46–55. [Google Scholar] [CrossRef]
- Banfield, E.C.; Liu, Y.; Davis, J.S.; Chang, S.; Frazier-Wood, A.C. Poor adherence to US dietary guidelines for children and adolescents in the National Health and Nutrition Examination Survey population. J. Acad. Nutr. Diet. 2016, 116, 21–27. [Google Scholar] [CrossRef]
- Winpenny, E.M.; van Sluijs, E.M.F.; White, M.; Klepp, K.I.; Wold, B.; Lien, N. Changes in diet through adolescence and early adulthood: Longitudinal trajectories and association with key life transitions. Int. J. Behav. Nutr. Phys. Act. 2018, 15, 86. [Google Scholar] [CrossRef]


| Indicator | Initial | Final | Total p | ||||||
|---|---|---|---|---|---|---|---|---|---|
| Total | Boys | Girls | p | Total | Boys | Girls | p | ||
| Height (cm) | 142.96 | 143.28 | 142.68 | 0.041 | 167.23 | 169.76 | 164.67 | 0.021 | 0.001 |
| Weight (kg) | 37.80 | 38.15 | 37.46 | 0.070 | 59.90 | 62.58 | 57.19 | 0.041 | 0.000 |
| BMI (kg/m2) | 18.34 | 18.38 | 18.28 | 0.120 | 21.29 | 21.53 | 21.06 | 0.060 | 0.025 |
| BMI (percentile) | 50th | 50th | 50th | 0.830 | 75th | 75th | 75th | 0.937 | 0.120 |
| Indicator | Initial | Final | Total p | ||||||
|---|---|---|---|---|---|---|---|---|---|
| Total Sample | Boys | Girls | p | Total Sample | Boys | Girls | p | ||
| Underweight | 10.17 | 10.22 | 10.13 | 0.100 | 11.17 | 11.00 | 11.35 | 0.240 | 0.091 |
| Normal | 65.65 | 68.52 | 62.78 | 0.001 | 61.07 | 63.00 | 59.15 | 0.001 | 0.001 |
| Overweight | 15.27 | 12.75 | 17.78 | 0.031 | 13.62 | 13.50 | 13.75 | 0.170 | 0.047 |
| Obesity | 8.91 | 8.51 | 9.31 | 0.640 | 14.12 | 12.50 | 15.75 | 0.001 | 0.000 |
| Fat Mass, % (kg) | |||||||||
|---|---|---|---|---|---|---|---|---|---|
| Measurement Session | Average Age (Years) | Total Sample | Median | Min. | Max. | SD | 95% CI | p | ESs |
| Average | |||||||||
| Initial | 10.27 | 19.77 (8.09) | 18.15 (6.70) | 6.50 (1.70) | 47.40 (40.60) | 7.62 | 7.00–8.36 | 0.620 | 0.460 |
| Final | 13.90 | 19.59 (12.38) | 18.65 (10.70) | 3.00 (1.30) | 46.20 (46.00) | 8.73 | 7.97–9.65 | ||
| Mean from both sessions | 19.68 (10.23) | ||||||||
| Girls | |||||||||
| Initial | 10.27 | 21.77 (8.73) | 21.15 (7.75) | 6.50 (1.70) | 37.30 (21.10) | 7.56 | 7.50–6.65 | 0.040 | 0.510 |
| Final | 13.90 | 24.57 (14.88) | 23.65 (12.85) | 6.40 (2.80) | 46.20 (46.00) | 7.82 | 6.89–9.04 | ||
| Mean from both sessions | 23.17 (11.80) | ||||||||
| Boys | |||||||||
| Initial | 10.27 | 17.80 (7.49) | 15.60 (5.70) | 8.40 (2.20) | 47.40 (40.60) | 7.23 | 6.44–8.25 | 0.032 | 0.468 |
| Final | 13.90 | 14.60 (9.87) | 14.65 (8.90) | 3.00 (1.30) | 34.30 (35.70) | 6.46 | 5.69–7.47 | ||
| Mean from both sessions | 16.20 (8.68) | ||||||||
| Indicator | Initial | Final | ||||||
|---|---|---|---|---|---|---|---|---|
| Total | Boys | Girls | p | Total | Boys | Girls | p | |
| Underweight | 10.75 | 10.99 | 10.52 | 0.079 | 5.73 | 6.03 | 5.45 | 0.087 |
| Normal | 60.73 | 62.13 | 59.33 | 0.065 | 58.37 | 60.95 | 55.80 | 0.025 |
| Overweight | 17.59 | 16.22 | 18.95 | 0.018 | 22.76 | 20.77 | 24.75 | 0.057 |
| Obesity | 10.93 | 10.66 | 11.20 | 0.095 | 13.12 | 12.25 | 14.00 | 0.061 |
| No | Foods | Sex | Frequency of Consumption [%] | Statistical Measures * | ||||
|---|---|---|---|---|---|---|---|---|
| Never | 1–3 Times a Month | Once a Week | Several Times a Week | Every Day | ||||
| 1. | Milk | Girls | 4.50 | 5.76 | 20.03 | 30.41 | 39.30 | χ2 = 6.812, df-4, p = 0.146, VC = 0.178 |
| Boys | 1.83 | 6.92 | 21.89 | 41.41 | 27.95 | |||
| 2. | Yogurts (natural and flavored) | Girls | 5.00 | 11.75 | 22.25 | 40.25 | 20.75 | χ2 = 10.469, df-4, p = 0.033, VC = 0.221 |
| Boys | 7.75 | 11.25 | 15.75 | 49.75 | 15.50 | |||
| 3. | Cottage chesses | Girls | 18.25 | 20.50 | 29.25 | 20.00 | 12.00 | χ2 = 11.693, df-4, p = 0.019, VC = 0.233 |
| Boys | 11.75 | 22.00 | 22.00 | 33.50 | 10.75 | |||
| 4. | High-fat cheeses (including processed and blue cheeses) | Girls | 4.13 | 13.75 | 27.75 | 37.25 | 17.13 | χ2 = 1.241, df-4, p = 0.871, VC = 0.076 |
| Boys | 4.50 | 16.00 | 21.75 | 40.75 | 17.00 | |||
| 5. | Wheat bread and rolls | Girls | 0.61 | 1.75 | 5.71 | 22.62 | 69.31 | χ2 = 3.389, df-4, p = 0.044, VC = 0.125 |
| Boys | 0.50 | 1.25 | 6.25 | 12.46 | 79.50 | |||
| 6. | Whole-grain bread and rolls | Girls | 13.20 | 14.21 | 33.76 | 20.16 | 18.68 | χ2 = 13.284, df-4, p = 0.010, VC = 0.249 |
| Boys | 13.46 | 22.06 | 33.62 | 18.75 | 12.10 | |||
| 7. | White rice, white pasta, fine-grained groats | Girls | 2.75 | 9.41 | 54.04 | 25.10 | 8.71 | χ2 = 4.956, df-4, p = 0.291, VC = 0.152 |
| Boys | 2.77 | 8.65 | 54.22 | 24.27 | 10.08 | |||
| 8. | Coarse-grained groats, buckwheat groats, oatmeal | Girls | 4.53 | 13.54 | 52.71 | 22.52 | 6.70 | χ2 = 8.087, df-4, p = 0.008, VC = 0.194 |
| Boys | 5.15 | 11.92 | 55.74 | 21.35 | 5.83 | |||
| 9. | Poultry meat | Girls | 2.79 | 14.41 | 40.50 | 19.92 | 22.38 | χ2 = 8.734, df-4, p = 0.048, VC = 0.202 |
| Boys | 1.00 | 8.98 | 34.99 | 28.23 | 26.80 | |||
| 10. | Red meat | Girls | 6.76 | 27.71 | 49.52 | 9.08 | 6.93 | χ2 = 19.835, df-4, p = 0.000, VC = 0.304 |
| Boys | 6.21 | 14.25 | 44.97 | 17.96 | 16.60 | |||
| 11. | Cold cuts, sausages, frankfurters | Girls | 9.27 | 9.43 | 20.53 | 33.44 | 27.33 | χ2 = 1.141, df-4, p = 0.887, VC = 0.703 |
| Boys | 4.50 | 5.10 | 14.79 | 34.24 | 41.37 | |||
| 12 | Canned meats | Girls | 65.00 | 25.75 | 9.25 | 0.00 | 0.00 | χ2 = 12.467, df-4, p = 0.614, VC = 0.241 |
| Boys | 64.25 | 22.25 | 8.25 | 5.25 | 0.00 | |||
| 13. | Fried flour or mest meals | Girls | 0.00 | 7.00 | 26.25 | 43.75 | 23.00 | χ2 = 2.295, df-4, p = 0.681, VC = 0.103 |
| Boys | 0.00 | 3.75 | 27.00 | 48.25 | 21.00 | |||
| 14. | Eggs | Girls | 5.72 | 15.98 | 58.65 | 19.04 | 0.61 | χ2 = 10.796, df-4, p = 0.028, VC = 0.224 |
| Boys | 3.50 | 9.15 | 58.97 | 24.99 | 3.38 | |||
| 15. | Fish | Girls | 20.09 | 23.45 | 53.36 | 2.61 | 0.50 | χ2 = 7.496, df-4, p = 0.111, VC = 0.187 |
| Boys | 14.07 | 29.21 | 52.74 | 3.10 | 0.88 | |||
| 16. | Legumes | Girls | 35.25 | 43.75 | 12.00 | 8.50 | 0.50 | χ2 = 12.628, df-4, p = 0.621, VC = 0.110 |
| Boys | 35.00 | 46.50 | 12.50 | 5.25 | 0.75 | |||
| 17. | Fruit | Girls | 0.00 | 2.48 | 12.42 | 30.56 | 54.00 | χ2 = 1.357, df-4, p = 0.035, VC = 0.079 |
| Boys | 1.25 | 5.73 | 11.85 | 34.91 | 46.26 | |||
| 18. | Vegetables | Girls | 2.24 | 0.00 | 13.45 | 26.83 | 57.48 | χ2 = 6.933, df-4, p = 0.021, VC = 0.180 |
| Boys | 2.25 | 2.25 | 18.12 | 30.58 | 46.53 | |||
| 19. | Butter as an addition to bread, dishes, for frying, baking, etc. | Girls | 6.25 | 9.75 | 9.75 | 27.75 | 46.50 | χ2 = 9.075, df-4, p = 0.049, VC = 0.205 |
| Boys | 3.75 | 4.50 | 20.50 | 23.00 | 48.25 | |||
| 20. | Lard as an addition to bread, dishes, for frying, baking, etc. | Girls | 93.75 | 6.25 | 0.00 | 0.00 | 0.00 | χ2 = 7.824, df-4, p = 0.098, VC = 0.191 |
| Boys | 90.25 | 6.00 | 2.75 | 1.00 | 0.00 | |||
| 21. | Fast food, different types | Girls | 5.23 | 52.43 | 35.62 | 5.74 | 0.99 | χ2 = 6.322, df-4, p = 0.016, VC = 0.171 |
| Boys | 2.77 | 44.36 | 48.05 | 4.38 | 0.44 | |||
| 22. | Sweets, candies, chocolate, bars | Girls | 0.75 | 6.50 | 20.75 | 29.75 | 42.25 | χ2 = 6.256, df-4, p = 0.040, VC = 0.172 |
| Boys | 1.75 | 9.50 | 27.00 | 25.50 | 36.25 | |||
| 23. | Juices | Girls | 12.00 | 19.50 | 46.00 | 14.00 | 8.50 | χ2 = 7.614, df-4, p = 0.106, VC = 0.188 |
| Boys | 6.25 | 16.25 | 56.50 | 13.50 | 7.50 | |||
| 24. | Sweetened carbonated or non-carbonated drinks | Girls | 21.25 | 39.75 | 28.00 | 7.25 | 3.75 | χ2 = 5.997, df-4, p = 0.147, VC = 0.167 |
| Boys | 16.50 | 37.25 | 23.00 | 14.50 | 8.75 | |||
| 25. | Energy drinks | Girls | 81.75 | 15.50 | 1.75 | 1.00 | 0.00 | χ2 = 4.409, df-4, p = 0.353, VC = 0.143 |
| Boys | 73.75 | 17.00 | 6.75 | 2.50 | 0.00 | |||
Disclaimer/Publisher’s Note: The statements, opinions and data contained in all publications are solely those of the individual author(s) and contributor(s) and not of MDPI and/or the editor(s). MDPI and/or the editor(s) disclaim responsibility for any injury to people or property resulting from any ideas, methods, instructions or products referred to in the content. |
© 2025 by the authors. Licensee MDPI, Basel, Switzerland. This article is an open access article distributed under the terms and conditions of the Creative Commons Attribution (CC BY) license (https://creativecommons.org/licenses/by/4.0/).
Share and Cite
Ługowska, K.; Krzęcio-Nieczyporuk, E.; Trafiałek, J.; Kolanowski, W. Changes in BMI and Fat Mass and Nutritional Behaviors in Children Between 10 and 14 Years of Age. Nutrients 2025, 17, 1264. https://doi.org/10.3390/nu17071264
Ługowska K, Krzęcio-Nieczyporuk E, Trafiałek J, Kolanowski W. Changes in BMI and Fat Mass and Nutritional Behaviors in Children Between 10 and 14 Years of Age. Nutrients. 2025; 17(7):1264. https://doi.org/10.3390/nu17071264
Chicago/Turabian StyleŁugowska, Katarzyna, Elżbieta Krzęcio-Nieczyporuk, Joanna Trafiałek, and Wojciech Kolanowski. 2025. "Changes in BMI and Fat Mass and Nutritional Behaviors in Children Between 10 and 14 Years of Age" Nutrients 17, no. 7: 1264. https://doi.org/10.3390/nu17071264
APA StyleŁugowska, K., Krzęcio-Nieczyporuk, E., Trafiałek, J., & Kolanowski, W. (2025). Changes in BMI and Fat Mass and Nutritional Behaviors in Children Between 10 and 14 Years of Age. Nutrients, 17(7), 1264. https://doi.org/10.3390/nu17071264