
Sex Differences Outweigh Dietary Factors in Food-Related Quality of Life in Patients with Inflammatory Bowel Disease


Abstract
1. Introduction
2. Materials and Methods
2.1. Participants and Setting
2.2. Variables and Definition
2.2.1. Data Sources/Measurements
2.2.2. Food Frequency Questionnaire Variables and Macronutrients
2.2.3. Mediterranean Diet Score
2.2.4. Diet Quality
2.2.5. Diet Diversity
2.2.6. Food-Related Quality of Life
2.2.7. Laboratory Values
2.3. Statistical Analysis
2.3.1. Confounding Factors and Bias Risks
2.3.2. Sample Size and Missing Data
3. Results
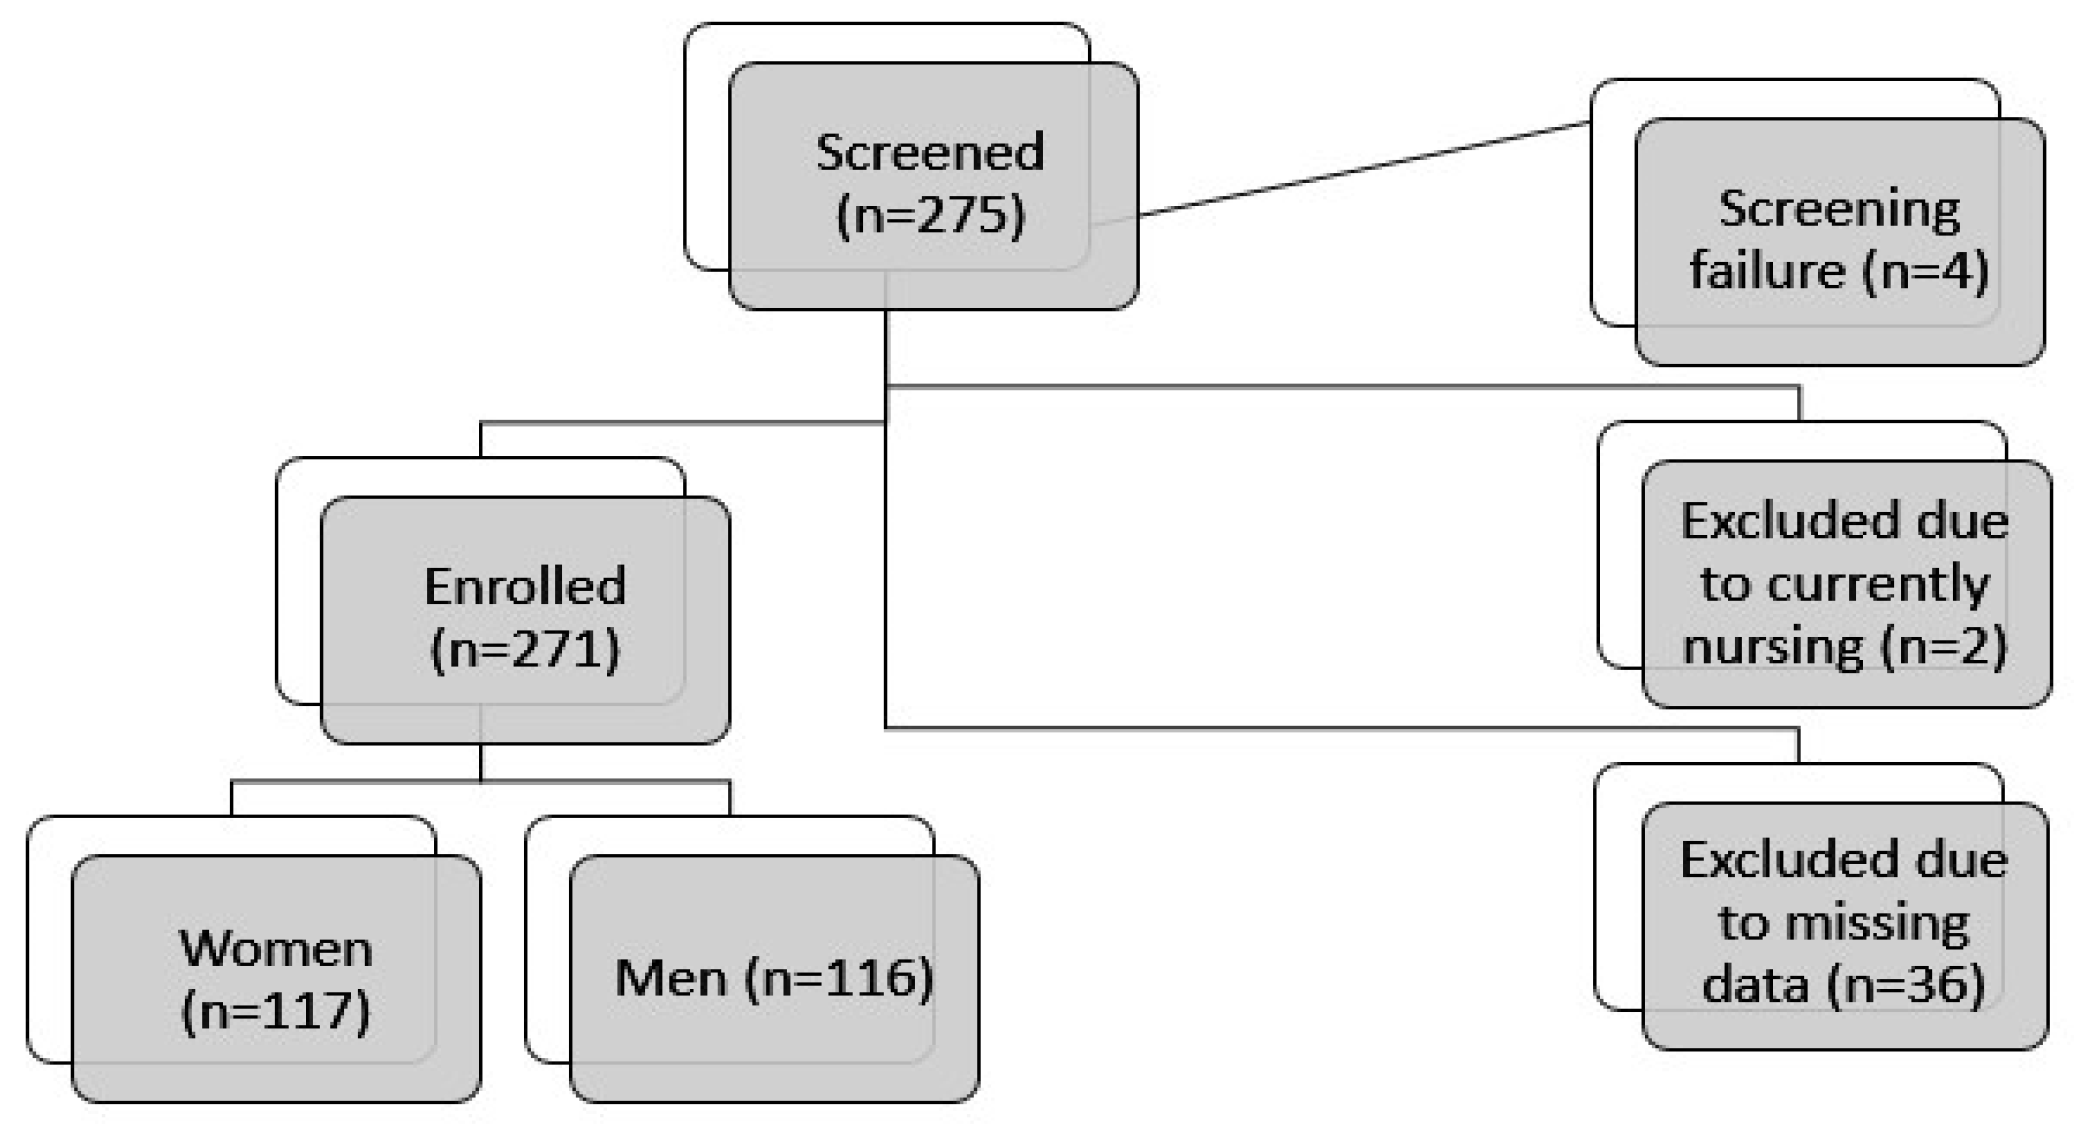
3.1. Study Population
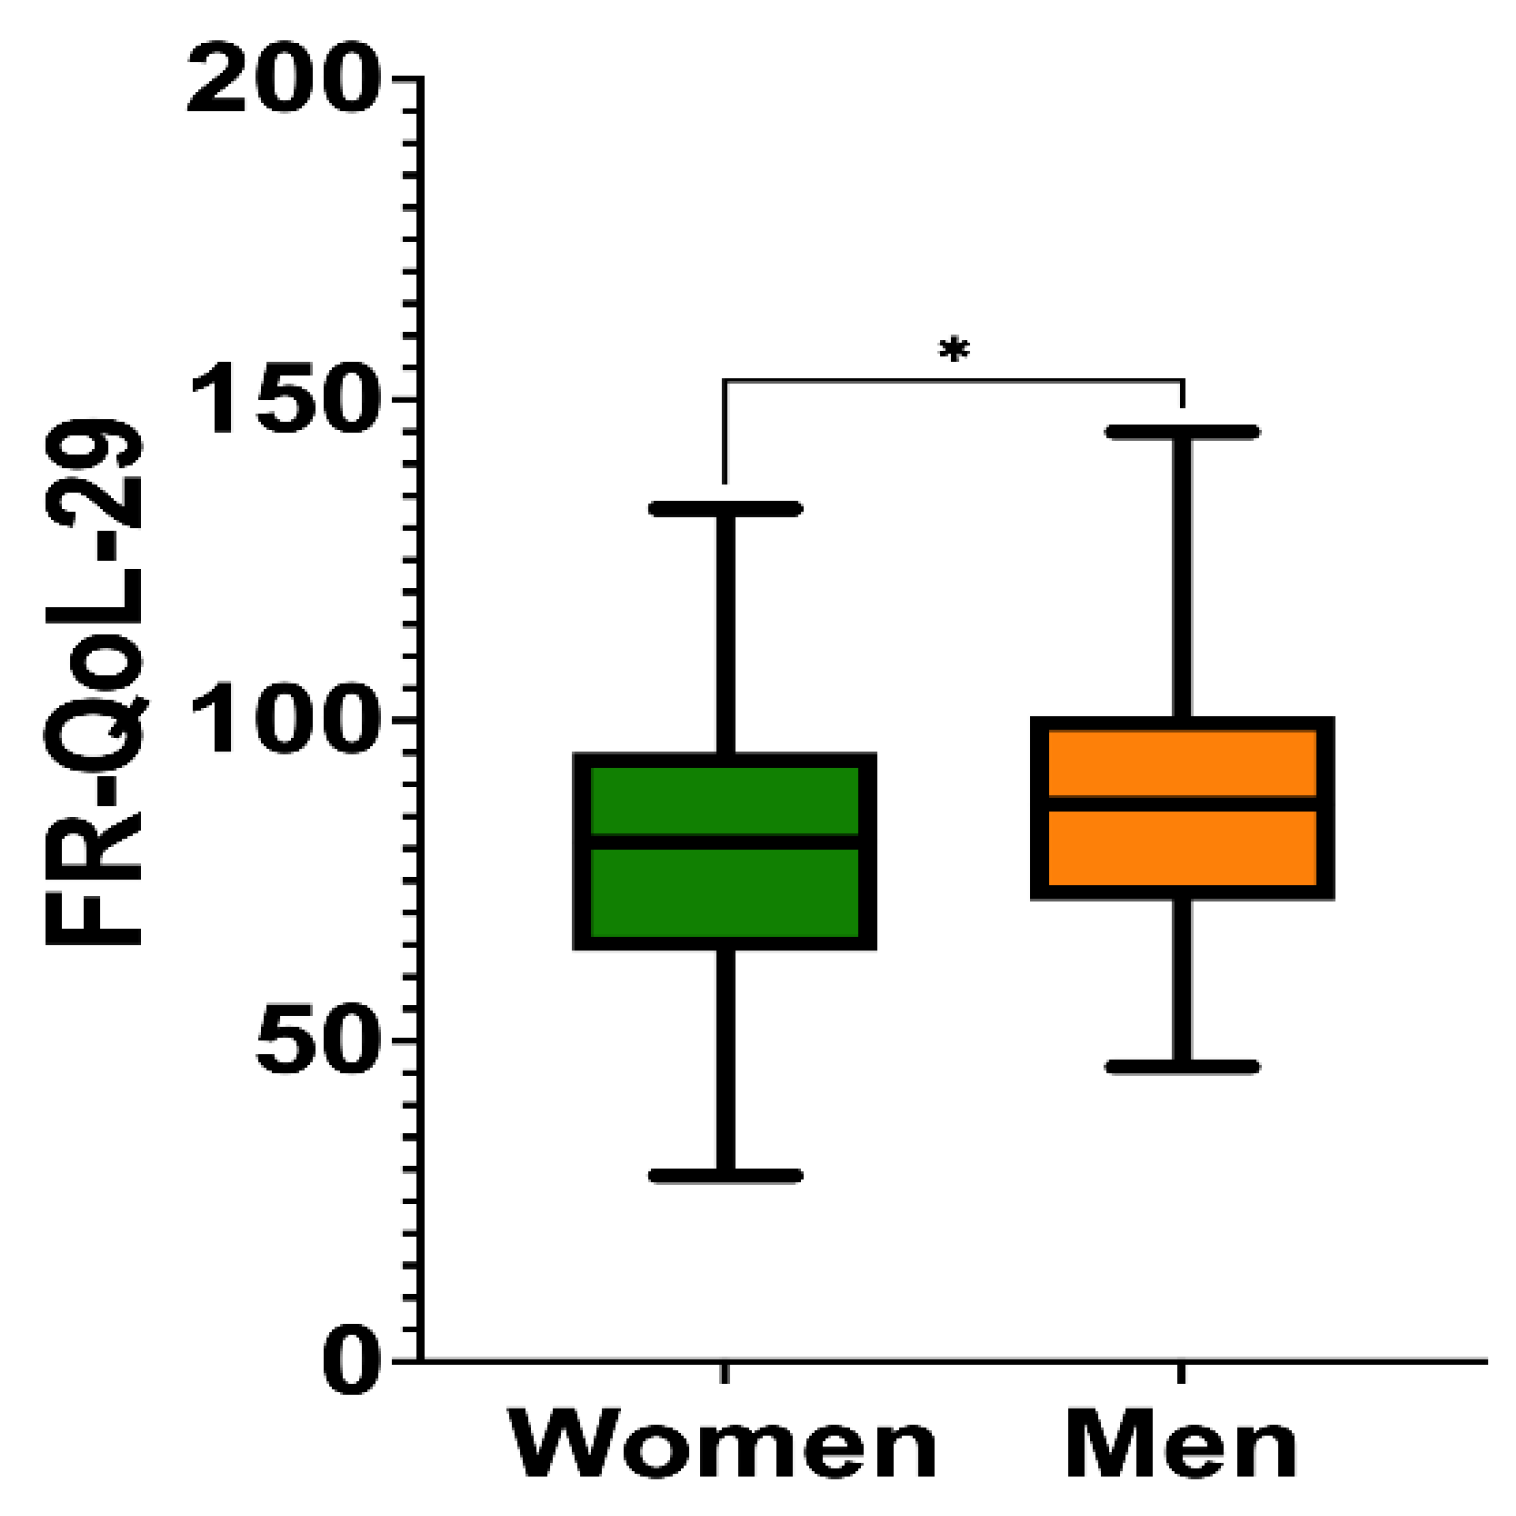
3.2. Food-Related Quality of Life Score
3.3. Food-Related Quality of Life and Diet Quality
3.4. Food-Related Quality of Life and Food Groups
3.5. Food-Related Quality of Life and Macronutrients
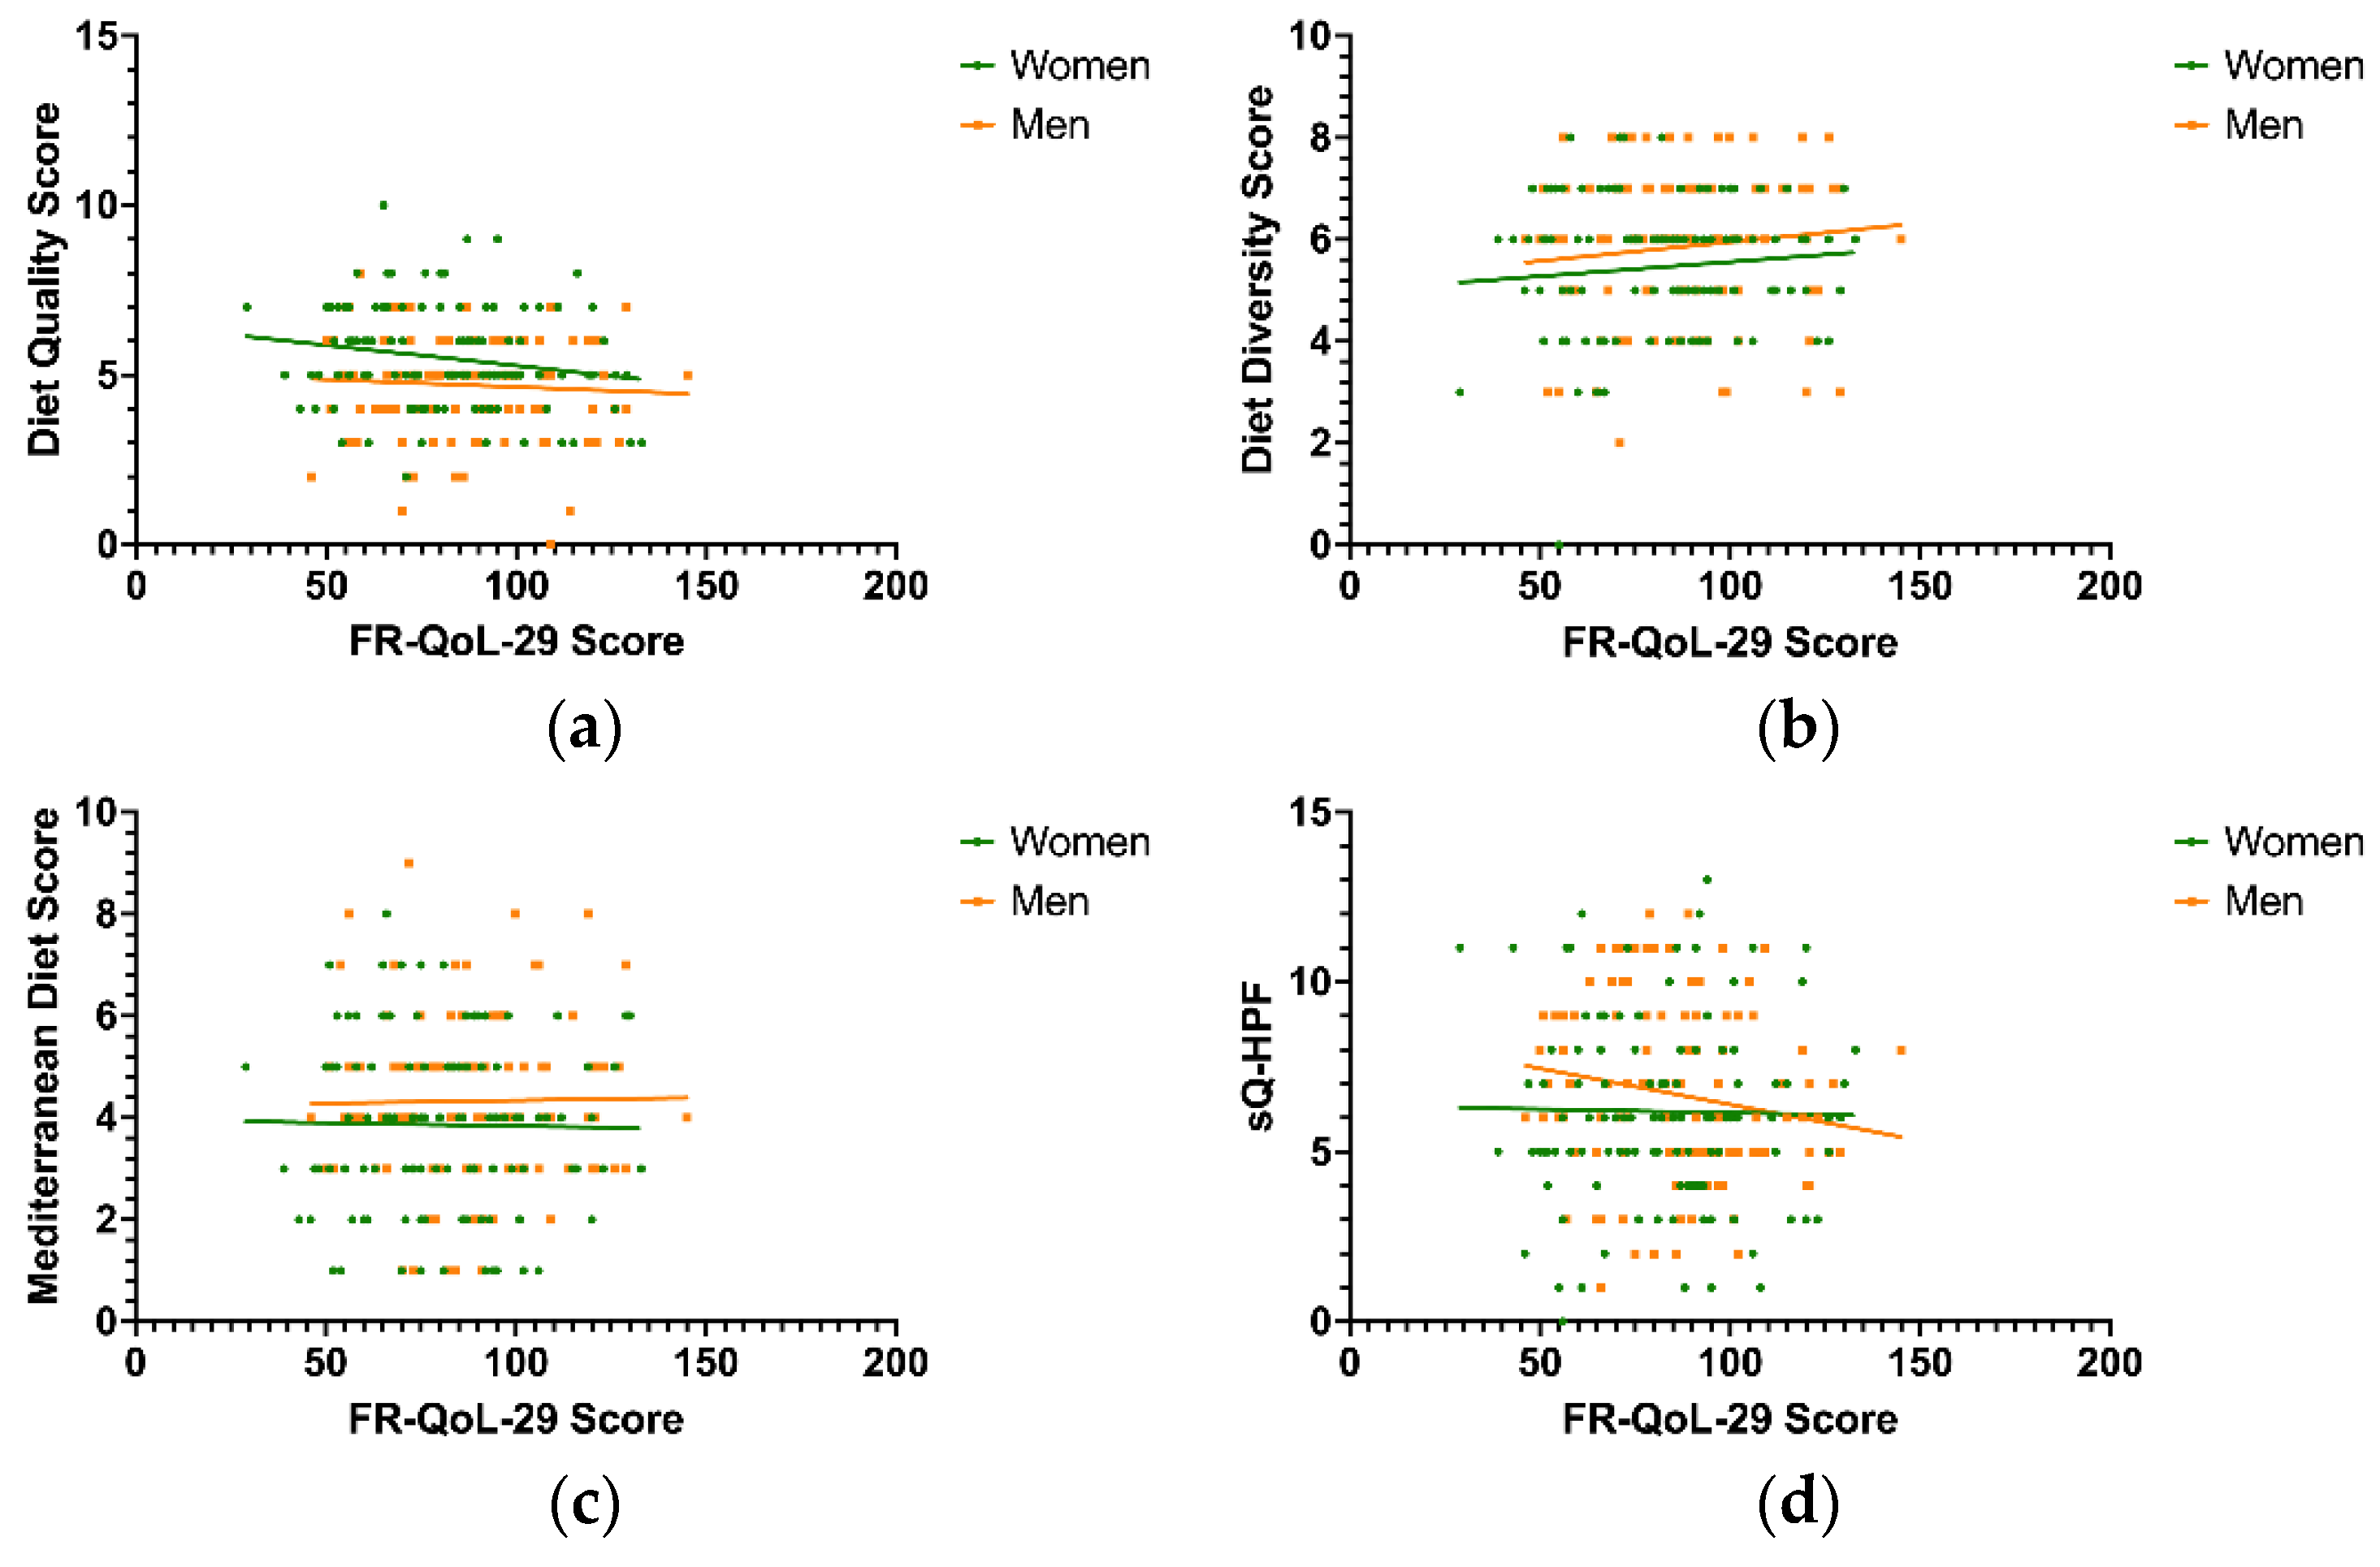
3.6. Correlation of Food-Related Quality of Life and Dietary Pattern Scores
3.7. Influence of Diet and Disease-Specific Factors on a High Food-Related Quality of Life in Men and Women with IBD
4. Discussion
5. Conclusions
Author Contributions
Funding
Institutional Review Board Statement
Informed Consent Statement
Data Availability Statement
Acknowledgments
Conflicts of Interest
References
- de Castro, M.M.; Pascoal, L.B.; Steigleder, K.M.; Siqueira, B.P.; Corona, L.P.; Ayrizono, M.L.S.; Milanski, M.; Leal, R.F. Role of diet and nutrition in inflammatory bowel disease. World J. Exp. Med. 2021, 11, 1–16. [Google Scholar] [CrossRef]
- Adolph, T.E.; Zhang, J. Diet fuelling inflammatory bowel diseases: Preclinical and clinical concepts. Gut 2022, 71, 2574–2586. [Google Scholar] [CrossRef]
- Levine, A.; Sigall Boneh, R.; Wine, E. Evolving role of diet in the pathogenesis and treatment of inflammatory bowel diseases. Gut 2018, 67, 1726–1738. [Google Scholar] [CrossRef] [PubMed]
- Yan, J.; Wang, L.; Gu, Y.; Hou, H.; Liu, T.; Ding, Y.; Cao, H. Dietary Patterns and Gut Microbiota Changes in Inflammatory Bowel Disease: Current Insights and Future Challenges. Nutrients 2022, 14, 4003. [Google Scholar] [CrossRef] [PubMed]
- Olendzki, B.; Bucci, V.; Cawley, C.; Maserati, R.; McManus, M.; Olednzki, E.; Madziar, C.; Chiang, D.; Ward, D.V.; Pellish, R.; et al. Dietary manipulation of the gut microbiome in inflammatory bowel disease patients: Pilot study. Gut Microbes 2022, 14, 2046244. [Google Scholar] [CrossRef] [PubMed]
- Andersen, V.; Chan, S.; Luben, R.; Khaw, K.T.; Olsen, A.; Tjonneland, A.; Kaaks, R.; Grip, O.; Bergmann, M.M.; Boeing, H.; et al. Fibre intake and the development of inflammatory bowel disease: A European prospective multi-centre cohort study (EPIC-IBD). J. Crohns Crohn’s 2018, 12, 129–136. [Google Scholar] [CrossRef]
- Racine, A.; Carbonnel, F.; Chan, S.S.; Hart, A.R.; Bueno-de-Mesquita, H.B.; Oldenburg, B.; van Schaik, F.D.; Tjønneland, A.; Olsen, A.; Dahm, C.C.; et al. Dietary Patterns and Risk of Inflammatory Bowel Disease in Europe: Results from the EPIC Study. Inflamm. Bowel Dis. 2016, 22, 345–354. [Google Scholar] [CrossRef]
- Pueschel, L.; Kockelmann, F.; Kueck, M.; Tegtbur, U.; Attaran-Bandarabadi, M.; Bachmann, O.; Wedemeyer, H.; Lenzen, H.; Wiestler, M. Patients with Inflammatory Bowel Disease Show Fewer Sex-Related Differences in Their Dietary Behavior Than the General Population: A Qualitative Analysis. Nutrients 2024, 16, 2954. [Google Scholar] [CrossRef]
- Godala, M.; Gaszyńska, E.; Durko, Ł.; Małecka-Wojciesko, E. Dietary Behaviors and Beliefs in Patients with Inflammatory Bowel Disease. J. Clin. Med. 2023, 12, 3455. [Google Scholar] [CrossRef]
- Cohen, A.B.; Lee, D.; Long, M.D.; Kappelman, M.D.; Martin, C.F.; Sandler, R.S.; Lewis, J.D. Dietary patterns and self-reported associations of diet with symptoms of inflammatory bowel disease. Dig. Dis. Sci. 2013, 58, 1322–1328. [Google Scholar] [CrossRef]
- Ludvigsson, J.F.; Olén, O.; Larsson, H.; Halfvarson, J.; Almqvist, C.; Lichtenstein, P.; Butwicka, A. Association Between Inflammatory Bowel Disease and Psychiatric Morbidity and Suicide: A Swedish Nationwide Population-Based Cohort Study with Sibling Comparisons. J. Crohns Crohn’s 2021, 15, 1824–1836. [Google Scholar] [CrossRef]
- Ilzarbe, L.; Fàbrega, M.; Quintero, R.; Bastidas, A.; Pintor, L.; García-Campayo, J.; Gomollón, F.; Ilzarbe, D. Inflammatory Bowel Disease and Eating Disorders: A systematized review of comorbidity. J. Psychosom. Res. 2017, 102, 47–53. [Google Scholar] [CrossRef] [PubMed]
- Day, A.S.; Yao, C.K.; Costello, S.P.; Andrews, J.M.; Bryant, R.V. Food-related quality of life in adults with inflammatory bowel disease is associated with restrictive eating behaviour, disease activity and surgery: A prospective multicentre observational study. J. Hum. Nutr. Diet. 2022, 35, 234–244. [Google Scholar] [CrossRef] [PubMed]
- Limdi, J.K.; Aggarwal, D.; McLaughlin, J.T. Dietary Practices and Beliefs in Patients with Inflammatory Bowel Disease. Inflamm. Bowel Dis. 2016, 22, 164–170. [Google Scholar] [CrossRef] [PubMed]
- Whelan, K.; Murrells, T.; Morgan, M.; Cummings, F.; Stansfield, C.; Todd, A.; Sebastian, S.; Lobo, A.; Lomer, M.C.E.; Lindsay, J.O.; et al. Food-related quality of life is impaired in inflammatory bowel disease and associated with reduced intake of key nutrients. Am. J. Clin. Nutr. 2021, 113, 832–844. [Google Scholar] [CrossRef]
- Maconi, G.; Ardizzone, S.; Cucino, C.; Bezzio, C.; Russo, A.G.; Bianchi Porro, G. Pre-illness changes in dietary habits and diet as a risk factor for inflammatory bowel disease: A case-control study. World J. Gastroenterol. 2010, 16, 4297–4304. [Google Scholar] [CrossRef]
- Palamenghi, L.; Figliuc, P.; Leone, S.; Graffigna, G. Food and Inflammatory Bowel Diseases: A scoping review on the impact of food on patients’ psychosocial quality of life. Health Soc. Care Community 2022, 30, 1695–1712. [Google Scholar] [CrossRef]
- Ross, E.J.; Shanahan, M.L.; Joseph, E.; Reynolds, J.M.; Jimenez, D.E.; Abreu, M.T.; Carrico, A.W. The Relationship Between Loneliness, Social Isolation, and Inflammatory Bowel Disease: A Narrative Review. Ann. Behav. Med. 2024, 58, 779–788. [Google Scholar] [CrossRef]
- Chen, J.; Geng, J.; Wang, J.; Wu, Z.; Fu, T.; Sun, Y.; Chen, X.; Wang, X.; Hesketh, T. Associations between inflammatory bowel disease, social isolation, and mortality: Evidence from a longitudinal cohort study. Therap Adv. Gastroenterol. 2022, 15, 17562848221127474. [Google Scholar] [CrossRef]
- Regan, C.; Walltott, H.; Kjellenberg, K.; Nyberg, G.; Helgadóttir, B. Investigation of the Associations between Diet Quality and Health-Related Quality of Life in a Sample of Swedish Adolescents. Nutrients 2022, 14, 2489. [Google Scholar] [CrossRef]
- Oliveira, L.; Poínhos, R.; Vaz de Almeida, M.D. Food-related quality of life among older adults living in community: A multi-factorial approach. Clin. Nutr. ESPEN 2021, 44, 224–229. [Google Scholar] [CrossRef] [PubMed]
- Hughes, L.D.; King, L.; Morgan, M.; Ayis, S.; Direkze, N.; Lomer, M.C.; Lindsay, J.O.; Whelan, K. Food-related Quality of Life in Inflammatory Bowel Disease: Development and Validation of a Questionnaire. J. Crohns Crohn’s 2016, 10, 194–201. [Google Scholar] [CrossRef]
- Kondrup, J.; Rasmussen, H.H.; Hamberg, O.; Stanga, Z. Nutritional risk screening (NRS 2002): A new method based on an analysis of controlled clinical trials. Clin. Nutr. 2003, 22, 321–336. [Google Scholar] [CrossRef]
- Schütz, T.; Valentini, L.; Plauth, M. Screening auf Mangelernährung nach den ESPEN-Leitlinien 2002. Aktuelle Ernährungsmed. 2005, 30, 99–103. [Google Scholar] [CrossRef]
- Martinez-Perez, C.; Daimiel, L.; Climent-Mainar, C.; Martínez-González, M.; Salas-Salvadó, J.; Corella, D.; Schröder, H.; Martinez, J.A.; Alonso-Gómez, Á.M.; Wärnberg, J.; et al. Integrative development of a short screening questionnaire of highly processed food consumption (sQ-HPF). Int. J. Behav. Nutr. Phys. Act. 2022, 19, 6. [Google Scholar] [CrossRef]
- Satsangi, J.; Silverberg, M.S.; Vermeire, S.; Colombel, J.F. The Montreal classification of inflammatory bowel disease: Controversies, consensus, and implications. Gut 2006, 55, 749–753. [Google Scholar] [CrossRef] [PubMed]
- Harvey, R.F.; Bradshaw, J.M. A simple index of Crohn’s-disease activity. Lancet 1980, 1, 514. [Google Scholar] [CrossRef]
- Lewis, J.D.; Chuai, S.; Nessel, L.; Lichtenstein, G.R.; Aberra, F.N.; Ellenberg, J.H. Use of the noninvasive components of the Mayo score to assess clinical response in ulcerative colitis. Inflamm. Bowel Dis. 2008, 14, 1660–1666. [Google Scholar] [CrossRef] [PubMed]
- Haftenberger, M.; Heuer, T.; Heidemann, C.; Kube, F.; Krems, C.; Mensink, G.B. Relative validation of a food frequency questionnaire for national health and nutrition monitoring. Nutr. J. 2010, 9, 36. [Google Scholar] [CrossRef]
- Thieleking, R.; Schneidewind, L.; Kanyamibwa, A.; Hartmann, H.; Horstmann, A.; Witte, A.V.; Medawar, E. Nutrient scoring for the DEGS1-FFQ—From food intake to nutrient intake. BMC Nutr. 2023, 9, 12. [Google Scholar] [CrossRef]
- Trichopoulou, A.; Costacou, T.; Bamia, C.; Trichopoulos, D. Adherence to a Mediterranean diet and survival in a Greek population. N. Engl. J. Med. 2003, 348, 2599–2608. [Google Scholar] [CrossRef] [PubMed]
- DGE. Referenzwerte für die Nährstoffzufuhr, 2nd ed.; 8th updated ed.; Deutsche Gesellschaft für Ernährung, Österreichische Gesellschaft für Ernährung: Bonn, Germany, 2024. [Google Scholar]
- Pueschel, L.; Hupa-Breier, K.; Wedemeyer, H.; Lenzen, H.; Wiestler, M. Food-related Quality of Life in patients with Inflammatory Bowel Disease: Translation and Validation of the German version of FR-QoL-29. Z. Gastroenterol. 2025. [Google Scholar] [CrossRef]
- Black, A.E.; Goldberg, G.R.; Jebb, S.A.; Livingstone, M.B.; Cole, T.J.; Prentice, A.M. Critical evaluation of energy intake data using fundamental principles of energy physiology: 2. Evaluating the results of published surveys. Eur. J. Clin. Nutr. 1991, 45, 583–599. [Google Scholar]
- Pueschel, L.; Nothacker, S.; Kuhn, L.; Wedemeyer, H.; Lenzen, H.; Wiestler, M. Exploring Dietary- and Disease-Related Influences on Flatulence and Fecal Odor Perception in Inflammatory Bowel Disease. J. Clin. Med. 2025, 14, 137. [Google Scholar] [CrossRef] [PubMed]
- Louzado, J.A.; Lopes Cortes, M.; Galvão Oliveira, M.; Moraes Bezerra, V.; Mistro, S.; Souto de Medeiros, D.; Arruda Soares, D.; Oliveira Silva, K.; Nicolaevna Kochergin, C.; Honorato dos Santos de Carvalho, V.C.; et al. Gender Differences in the Quality of Life of Formal Workers. Int. J. Environ. Res. Public Health 2021, 18, 5951. [Google Scholar] [CrossRef]
- Hettich-Damm, N.; Petersen, J.; Zahn, D.; Baumkoetter, R.; Wild, P.S.; Muenzel, T.; Schuster, A.K.; Koenig, J.; Lackner, K.; Pfeiffer, N.; et al. Gender Differences and the Impact of Partnership and Children on Quality of Life During the COVID-19 Pandemic. Int. J. Public Health 2023, 68. [Google Scholar] [CrossRef]
- Cherepanov, D.; Palta, M.; Fryback, D.G.; Robert, S.A. Gender differences in health-related quality-of-life are partly explained by sociodemographic and socioeconomic variation between adult men and women in the US: Evidence from four US nationally representative data sets. Qual. Life Res. 2010, 19, 1115–1124. [Google Scholar] [CrossRef]
- Blumenstein, I.; Sonnenberg, E. Sex- and gender-related differences in inflammatory bowel diseases. Front. Gastroenterol. 2023, 2. [Google Scholar] [CrossRef]
- Ng, L.H.; Hart, M.; Dingle, S.E.; Milte, C.M.; Livingstone, K.M.; Shaw, J.E.; Magliano, D.J.; McNaughton, S.A.; Torres, S.J. Prospective associations between diet quality and health-related quality of life in the Australian Diabetes, Obesity and Lifestyle (AusDiab) study. Br. J. Nutr. 2023, 130, 83–92. [Google Scholar] [CrossRef]
- Milte, C.M.; Thorpe, M.G.; Crawford, D.; Ball, K.; McNaughton, S.A. Associations of diet quality with health-related quality of life in older Australian men and women. Exp. Gerontol. 2015, 64, 8–16. [Google Scholar] [CrossRef]
- Vajdi, M.; Farhangi, M.A. A systematic review of the association between dietary patterns and health-related quality of life. Health Qual. Life Outcomes 2020, 18, 337. [Google Scholar] [CrossRef] [PubMed]
- Palamenghi, L.; Usta, D.; Leone, S.; Graffigna, G. Food-Related Behavioral Patterns in Patients with Inflammatory Bowel Diseases: The Role of Food Involvement and Health Engagement. Nutrients 2024, 16, 1185. [Google Scholar] [CrossRef] [PubMed]
- Egele, V.S.; Stark, R. Specific health beliefs mediate sex differences in food choice. Front. Nutr. 2023, 10. [Google Scholar] [CrossRef]
- VanKim, N.A.; Corliss, H.L.; Jun, H.J.; Calzo, J.P.; AlAwadhi, M.; Austin, S.B. Gender Expression and Sexual Orientation Differences in Diet Quality and Eating Habits from Adolescence to Young Adulthood. J. Acad. Nutr. Diet. 2019, 119, 2028–2040. [Google Scholar] [CrossRef] [PubMed]
- Wardle, J.; Haase, A.M.; Steptoe, A.; Nillapun, M.; Jonwutiwes, K.; Bellisle, F. Gender differences in food choice: The contribution of health beliefs and dieting. Ann. Behav. Med. 2004, 27, 107–116. [Google Scholar] [CrossRef]
- Feraco, A.; Armani, A.; Gorini, S.; Camajani, E.; Quattrini, C.; Filardi, T.; Karav, S.; Strollo, R.; Caprio, M.; Lombardo, M. Gender Differences in Dietary Patterns and Eating Behaviours in Individuals with Obesity. Nutrients 2024, 16, 4226. [Google Scholar] [CrossRef]
- McNeill, L.S. What Motivates Men to Improve Their Health? Understanding the Roles of Self-Esteem and Influential Others in Behaviour Change. Nutrients 2024, 16, 1916. [Google Scholar] [CrossRef]
- Jimenez-Morcillo, J.; Clemente-Suárez, V.J. Gender Differences in Body Satisfaction Perception: The Role of Nutritional Habits, Psychological Traits, and Physical Activity in a Strength-Training Population. Nutrients 2023, 16, 104. [Google Scholar] [CrossRef] [PubMed]
- Gargallo-Puyuelo, C.J.; Ricart, E.; Iglesias, E.; de Francisco, R.; Gisbert, J.P.; Taxonera, C.; Mañosa, M.; Aguas Peris, M.; Navarrete-Muñoz, E.M.; Sanahuja, A.; et al. Sex-Related Differences in the Phenotype and Course of Inflammatory Bowel Disease: SEXEII Study of ENEIDA. Clin. Gastroenterol. Hepatol. 2024, 22, 2280–2290. [Google Scholar] [CrossRef]
- Hofmeier, S.M.; Runfola, C.D.; Sala, M.; Gagne, D.A.; Brownley, K.A.; Bulik, C.M. Body image, aging, and identity in women over 50: The Gender and Body Image (GABI) study. J. Women Aging 2017, 29, 3–14. [Google Scholar] [CrossRef]
- Stephenson, J.; Smith, C.M.; Kearns, B.; Haywood, A.; Bissell, P. The association between obesity and quality of life: A retrospective analysis of a large-scale population-based cohort study. BMC Public Health 2021, 21, 1990. [Google Scholar] [CrossRef]
- Luah, X.W.; Holst-Hansen, T.; Lübker, C. The association between body mass index and health-related quality of life in the 2017 and 2018 health survey of England data: A cross-sectional observational analysis. Diabetes Obes. Metab. 2024, 26, 2318–2328. [Google Scholar] [CrossRef]
- Søltoft, F.; Hammer, M.; Kragh, N. The association of body mass index and health-related quality of life in the general population: Data from the 2003 Health Survey of England. Qual. Life Res. 2009, 18, 1293–1299. [Google Scholar] [CrossRef] [PubMed]
- Choo, J.; Jeon, S.; Lee, J. Gender differences in health-related quality of life associated with abdominal obesity in a Korean population. BMJ Open 2014, 4, e003954. [Google Scholar]
- Beese, S.E.; Harris, I.M.; Moore, D.; Dretzke, J. Body image dissatisfaction in patients with inflammatory bowel disease: A systematic review protocol. Syst. Rev. 2018, 7, 184. [Google Scholar] [CrossRef]
- Moafi, F.; Kazemi, F.; Samiei Siboni, F.; Alimoradi, Z. The relationship between food security and quality of life among pregnant women. BMC Pregnancy Childbirth 2018, 18, 319. [Google Scholar] [CrossRef]
- Selvamani, Y.; Arokiasamy, P.; Chaudhary, M. Association between food insecurity and quality of life among older adults (60+) in six low and middle-income countries. Arch. Gerontol. Geriatr. 2023, 114, 105079. [Google Scholar] [CrossRef]
- Hanmer, J.; DeWalt, D.A.; Berkowitz, S.A. Association between Food Insecurity and Health-Related Quality of Life: A Nationally Representative Survey. J. Gen. Intern. Med. 2021, 36, 1638–1647. [Google Scholar] [CrossRef] [PubMed]
- Xu, F.; Cohen, S.A.; Lofgren, I.E.; Greene, G.W.; Delmonico, M.J.; Greaney, M.L. Relationship between Diet Quality, Physical Activity and Health-Related Quality of Life in Older Adults: Findings from 2007-2014 National Health and Nutrition Examination Survey. J. Nutr. Health Aging 2018, 22, 1072–1079. [Google Scholar] [CrossRef]
- Liu, R.; Banovic, M.; Grunert, K.G. Beliefs about food quality attributes, food-related goals and satisfaction with food-related life among the elderly in China: A means-end approach. Food Qual. Prefer. 2022, 95, 104367. [Google Scholar] [CrossRef]
- Ghahfarokhi, A.H.S.; Ghosn, B.; Surkan, P.J.; Akhondzadeh, S.; Azadbakht, L. The association between the dietary behavior, diet quality, and lifestyle scores with anthropometric indices and happiness levels among university students. BMC Nutr. 2024, 10, 114. [Google Scholar] [CrossRef] [PubMed]

| Women | Men | |||
|---|---|---|---|---|
| (n = 117) | (n = 116) | p | ||
| Crohn’s disease [n(%)] | 75 (64.1%) | 66 (56.9%) | 0.285 | |
| Current advanced drug therapy [n (%)] | 65 (57%) | 65 (57%) | 0.999 | |
| Disease Activity [n (%)] | Remission | 58 (52.7%) | 59 (53.2%) | 0.999 |
| Location of Crohn’s [n (%)] | L1: ileal | 17 (22.7%) | 18 (27.3%) | 0.999 |
| L2: colonic | 18 (24%) | 7 (10.6%) | 0.302 | |
| L3: ileocolonic | 32 (42.7%) | 35 (53%) | 0.999 | |
| L4: isolated upper disease | 8 (10.7%) | 6 (9.1%) | 0.999 | |
| Crohn’s behavior [n (%)] | B1: nonstricturing, nonpenetrating | 31 (41.3%) | 20 (30.3%) | 0.999 |
| B2: stricturing | 34 (45.3%) | 32 (48.5%) | 0.999 | |
| B3: penetrating | 10 (13.3%) | 14 (21.2%) | 0.999 | |
| Ulcerative colitis: Montreal classification [n (%)] | Proctitis | 3 (7.1%) | 3 (6%) | 0.999 |
| left-sided colitis | 14 (33.3%) | 18 (36%) | 0.999 | |
| pancolitis | 25 (59.5%) | 29 (58%) | 0.999 | |
| Disease duration [median (IQR)] (years) | 12 [7–20] | 13 [7–19] | 0.679 | |
| Surgery [n (%)] | 39 (33.3%) | 46 (39.7%) | 0.343 | |
| Calprotectin [median (IQR)] (mg/kg) | 82.3 [24.7–334] | 129 [30.8–795] | 0.438 | |
| C-reactive protein [median (IQR)] (mg/L) | 2.1 [0.9–5.5] | 1.4 [0.6–3.7] | 0.514 | |
| Hemoglobin [median (IQR)] (g/dL) | 12.8 [12.1–13.7] | 14.5 [13.5–15.3] | <0.001 | |
| Ferritin [median (IQR)] (µg/L) | 36 [23–62] | 70 [32–119] | <0.001 | |
| Age [median (IQR)] (yrs) | 38 [30–50] | 40 [29–53] | 0.843 | |
| Malnutrition Universal Screening Tool (MUST) [n (%)] | low risk | 57 (48.7%) | 71 (61.2%) | 0.332 |
| medium risk | 27 (23.1%) | 22 (19%) | 0.999 | |
| high risk | 33 (28.2%) | 23 (19.8%) | 0.808 | |
| Handgrip strength [median (IQR)] | 28.9 [23.3–33.4] | 46.8 [38.6–54.4] | <0.001 | |
| Diet quality Score [median (IQR)] (min = 0, max = 12) | 6 [5–7] | 6 [4–6] | <0.001 | |
| Diet diversity score [median (IQR)] (min = 0, max = 12) | 5 [5,6] | 5 [5–7] | 0.027 | |
| Mediterranean diet score [median (IQR)] (min = 0, max = 9) | 4 [3–5] | 4 [3–5] | 0.030 | |
| Screening Questionnaire of Highly Processed Food Consumption (sQ-HPF) [median (IQR)] | 6 [5–8] | 6 [5–9] | 0.177 | |
| Estimated energy intake [median (IQR)] (kJ/d) | 6433 [4770–8952] | 7951 [5797–11,100] | 0.004 | |
| Body mass index (BMI) [median (IQR)] (kg/m2) | 23.8 [21.5–28] | 24.4 [21.2–27.8] | 0.895 | |
| FR-QoL-29 | ||||||||||||||||||||
|---|---|---|---|---|---|---|---|---|---|---|---|---|---|---|---|---|---|---|---|---|
| Low [<=73] | Medium [74–93] | High [94+] | ||||||||||||||||||
| Sex | n | Mean | SD | SEM | p | g | n | Mean | SD | SEM | p | g | n | Mean | SD | SEM | p | g | ||
| Diet Diversity Score [DGE] | women | 45 | 5.3 | 1.8 | 0.3 | 0.548 | −0.1 | 39 | 5.6 | 0.9 | 0.1 | 0.044 | −0.5 | 33 | 5.6 | 1 | 0.2 | 0.204 | −0.3 | |
| men | 34 | 5.5 | 1.6 | 0.3 | 39 | 6.1 | 1.2 | 0.2 | 43 | 6 | 1.4 | 0.2 | ||||||||
| Diet Quality Score [DGE] | women | 45 | 5.8 | 1.5 | 0.2 | 0.019 | 0.5 | 39 | 5.4 | 1.5 | 0.2 | 0.003 | 0.7 | 33 | 5.2 | 1.5 | 0.3 | 0.226 | 0.3 | |
| men | 34 | 4.9 | 1.8 | 0.3 | 39 | 4.5 | 1.3 | 0.2 | 43 | 4.8 | 1.5 | 0.2 | ||||||||
| Mediterranean Diet Score [FFQ] | women | 45 | 4 | 1.7 | 0.3 | 0.320 | −0.2 | 39 | 3.9 | 1.7 | 0.3 | 0.839 | 0 | 33 | 3.6 | 1.5 | 0.3 | 0.007 | −0.6 | |
| men | 34 | 4.4 | 1.6 | 0.3 | 39 | 4 | 1.6 | 0.3 | 43 | 4.6 | 1.5 | 0.2 | ||||||||
| sQ-HPF (%) | women | 45 | 36.1 | 7.2 | 1.1 | 0.216 | −0.3 | 39 | 35.9 | 6.7 | 1.1 | 0.107 | −0.4 | 33 | 35.9 | 7.3 | 1.3 | 0.669 | 0.1 | |
| men | 34 | 38.1 | 6.5 | 1.1 | 39 | 38.4 | 7.2 | 1.2 | 43 | 35.3 | 5.1 | 0.8 | ||||||||
| FR-QoL-29 | ||||||||||||||||||||
|---|---|---|---|---|---|---|---|---|---|---|---|---|---|---|---|---|---|---|---|---|
| Low [<=73] | Medium [74–93] | High [94+] | ||||||||||||||||||
| Sex | n | Mean | SD | SEM | p | g | n | Mean | SD | SEM | p | g | n | Mean | SD | SEM | p | g | ||
| Fruits and vegetables (g/d)—FFQ * | women | 45 | 346.8 | 337.4 | 50.3 | 0.169 | 0.3 | 39 | 287.7 | 235.6 | 37.7 | 0.043 | 0.5 | 33 | 335.8 | 301.1 | 52.4 | 0.400 | 0.2 | |
| men | 34 | 257.8 | 231 | 39.6 | 39 | 191.3 | 174.2 | 27.9 | 43 | 279.9 | 272.4 | 41.5 | ||||||||
| Fruits and vegetables (EN%)—FFQ * | women | 45 | 9.5 | 7.7 | 1.1 | 0.036 | 0.5 | 39 | 8.7 | 7.5 | 1.2 | 0.054 | 0.4 | 33 | 10.1 | 8.9 | 1.5 | 0.140 | 0.3 | |
| men | 34 | 6.2 | 5.3 | 0.9 | 39 | 5.9 | 5.3 | 0.8 | 43 | 7.6 | 5.4 | 0.8 | ||||||||
| Nuts and seeds (g/d)—FFQ * | women | 45 | 8.5 | 14 | 2.1 | 0.640 | 0.1 | 38 | 9 | 16.5 | 2.7 | 0.043 | 0.5 | 33 | 5.1 | 8.8 | 1.5 | 0.522 | 0.1 | |
| men | 34 | 7.2 | 10.7 | 1.8 | 39 | 3.2 | 5.2 | 0.8 | 43 | 3.9 | 6.9 | 1 | ||||||||
| Nuts and seeds (EN%)—FFQ * | women | 45 | 2.7 | 4.1 | 0.6 | 0.521 | 0.1 | 38 | 3 | 5.2 | 0.8 | 0.033 | 0.5 | 33 | 2 | 3.6 | 0.6 | 0.258 | 0.3 | |
| men | 34 | 2.1 | 3.7 | 0.6 | 39 | 1 | 1.5 | 0.2 | 43 | 1.2 | 1.8 | 0.3 | ||||||||
| Cereal products (g/d)—FFQ * | women | 45 | 158.6 | 117 | 17.4 | 0.012 | −0.6 | 39 | 152.8 | 88.8 | 14.2 | 0.719 | −0.1 | 33 | 159.7 | 101.4 | 17.6 | 0.106 | −0.4 | |
| men | 34 | 257.3 | 195.8 | 33.6 | 39 | 160.5 | 99.3 | 15.9 | 43 | 197.5 | 98.8 | 15.1 | ||||||||
| Cereal products (EN%)—FFQ * | women | 45 | 18.1 | 9.3 | 1.4 | 0.089 | −0.4 | 39 | 17.4 | 7.2 | 1.1 | 0.949 | 0 | 33 | 17.9 | 6.8 | 1.2 | 0.045 | −0.5 | |
| men | 34 | 22.4 | 12.6 | 2.2 | 39 | 17.5 | 9.8 | 1.6 | 43 | 21.8 | 9.3 | 1.4 | ||||||||
| Meat (g/d)—FFQ * | women | 45 | 66.9 | 92 | 13.7 | 0.079 | −0.4 | 39 | 72.3 | 100.6 | 16.1 | 0.069 | −0.4 | 33 | 65.8 | 45 | 7.8 | 0.037 | −0.5 | |
| men | 34 | 115.1 | 147.5 | 25.3 | 39 | 107.3 | 62.6 | 10 | 43 | 91.5 | 56.9 | 8.7 | ||||||||
| Meat (EN%)—FFQ * | women | 45 | 9.6 | 10.9 | 1.6 | 0.795 | −0.1 | 39 | 9.4 | 8.9 | 1.4 | 0.037 | −0.5 | 33 | 8.8 | 6.3 | 1.1 | 0.033 | −0.5 | |
| men | 34 | 10.3 | 11 | 1.9 | 39 | 13.5 | 8.2 | 1.3 | 43 | 12.2 | 7.3 | 1.1 | ||||||||
| Fish (g/d)—FFQ * | women | 45 | 14.8 | 23.5 | 3.5 | 0.981 | 0 | 39 | 13.8 | 13.1 | 2.1 | 0.649 | −0.1 | 33 | 10 | 8.2 | 1.4 | 0.019 | −0.5 | |
| men | 34 | 14.9 | 17.8 | 3 | 39 | 15.6 | 21.9 | 3.5 | 43 | 17.6 | 18.3 | 2.8 | ||||||||
| Fish (EN%)—FFQ * | women | 45 | 1.7 | 2.3 | 0.3 | 0.475 | 0.2 | 39 | 1.6 | 1.5 | 0.2 | 0.707 | 0.1 | 33 | 1.2 | 1.2 | 0.2 | 0.120 | −0.4 | |
| men | 34 | 1.3 | 2 | 0.3 | 39 | 1.5 | 1.5 | 0.2 | 43 | 1.8 | 1.8 | 0.3 | ||||||||
| Spreadable fats (g/d)—FFQ * | women | 44 | 3.7 | 4.5 | 0.7 | 0.075 | −0.5 | 38 | 5.2 | 6.8 | 1.1 | 0.039 | −0.5 | 33 | 5.5 | 9.8 | 1.7 | 0.515 | −0.1 | |
| men | 33 | 9 | 16.1 | 2.8 | 39 | 9.7 | 11.5 | 1.8 | 43 | 6.7 | 6.5 | 1 | ||||||||
| Spreadable fats (EN%)—FFQ * | women | 44 | 1.7 | 1.9 | 0.3 | 0.116 | −0.4 | 38 | 2.2 | 3.3 | 0.5 | 0.162 | −0.3 | 33 | 1.6 | 1.9 | 0.3 | 0.068 | −0.4 | |
| men | 33 | 3 | 5.2 | 0.9 | 39 | 3.4 | 4.2 | 0.7 | 43 | 2.6 | 2.5 | 0.4 | ||||||||
| Eggs (g/d)—FFQ * | women | 44 | 15.2 | 13.8 | 2.1 | 0.010 | −0.7 | 39 | 24.4 | 28.6 | 4.6 | 0.560 | −0.1 | 33 | 18.1 | 16.6 | 2.9 | 0.632 | −0.1 | |
| men | 34 | 39.9 | 51.3 | 8.8 | 39 | 27.9 | 23.4 | 3.7 | 42 | 20 | 18.4 | 2.8 | ||||||||
| Eggs (EN%)—FFQ * | women | 44 | 1.4 | 1.4 | 0.2 | 0.055 | −0.5 | 39 | 2.1 | 2.6 | 0.4 | 0.959 | 0 | 33 | 1.6 | 2 | 0.4 | 0.873 | 0 | |
| men | 34 | 3 | 4.5 | 0.8 | 39 | 2.2 | 1.8 | 0.3 | 42 | 1.6 | 1.6 | 0.2 | ||||||||
| Dairy (g/d)—FFQ * | women | 45 | 242.5 | 247.2 | 36.8 | 0.857 | 0 | 39 | 255.2 | 176.9 | 28.3 | 0.388 | −0.2 | 33 | 252.5 | 217.6 | 37.9 | 0.752 | −0.1 | |
| men | 34 | 253.2 | 274.4 | 47.1 | 39 | 313.3 | 377.6 | 60.5 | 43 | 274.8 | 354.8 | 54.1 | ||||||||
| Dairy (EN%)—FFQ * | women | 45 | 12 | 9.2 | 1.4 | 0.410 | 0.2 | 39 | 13.6 | 9.1 | 1.5 | 0.447 | 0.2 | 33 | 13 | 9 | 1.6 | 0.659 | 0.1 | |
| men | 34 | 10.5 | 7.1 | 1.2 | 39 | 12.1 | 8.3 | 1.3 | 43 | 12.1 | 7.8 | 1.2 | ||||||||
| Sweet snacks (g/d)—FFQ | women | 45 | 94.4 | 97.5 | 14.5 | 0.559 | −0.1 | 39 | 101.2 | 138.3 | 22.1 | 0.500 | 0.2 | 33 | 127.4 | 102.6 | 17.9 | 0.120 | 0.4 | |
| men | 34 | 108.5 | 115.1 | 19.7 | 39 | 83.3 | 90.2 | 14.4 | 43 | 93.1 | 87.3 | 13.3 | ||||||||
| Sweet snacks (EN%)—FFQ | women | 45 | 20.2 | 14.8 | 2.2 | 0.128 | 0.3 | 39 | 19.8 | 15.8 | 2.5 | 0.057 | 0.4 | 33 | 23.5 | 14.5 | 2.5 | 0.011 | 0.6 | |
| men | 34 | 15.4 | 12.7 | 2.2 | 39 | 13.8 | 10.6 | 1.7 | 43 | 15.9 | 10.8 | 1.6 | ||||||||
| Savory snacks (g/d)—FFQ | women | 45 | 11.6 | 19.8 | 2.9 | 0.948 | 0 | 38 | 7.6 | 11.5 | 1.9 | 0.340 | −0.2 | 33 | 9.5 | 18 | 3.1 | 0.814 | −0.1 | |
| men | 34 | 11.9 | 16.8 | 2.9 | 39 | 10.8 | 17.1 | 2.7 | 43 | 10.4 | 14.2 | 2.2 | ||||||||
| Savory snacks (EN%)—FFQ | women | 45 | 2.6 | 3.9 | 0.6 | 0.747 | 0.1 | 38 | 2 | 2.4 | 0.4 | 0.654 | −0.1 | 33 | 2 | 3 | 0.5 | 0.413 | −0.2 | |
| men | 34 | 2.4 | 3.1 | 0.5 | 39 | 2.2 | 2.8 | 0.5 | 43 | 2.6 | 3.3 | 0.5 | ||||||||
| FR-QoL-29 | ||||||||||||||||||||
|---|---|---|---|---|---|---|---|---|---|---|---|---|---|---|---|---|---|---|---|---|
| Low [<=73] | Medium [74–93] | High [94+] | ||||||||||||||||||
| Sex | n | Mean | SD | SEM | p | g | n | Mean | SD | SEM | p | g | n | Mean | SD | SEM | p | g | ||
| Estimated energy intake (kJ/d)—FFQ | women | 45 | 7289 | 3963 | 590 | 0.009 | −0.6 | 39 | 7285 | 3569 | 571 | 0.158 | −0.3 | 33 | 7437 | 3683 | 641 | 0.491 | −0.2 | |
| men | 34 | 10,531 | 6083 | 1043 | 39 | 8391 | 3270 | 523 | 43 | 7991 | 3272 | 499 | ||||||||
| Carbohydrates (g/d)—FFQ | women | 45 | 231 | 139.1 | 20.7 | 0.018 | −0.6 | 39 | 208.3 | 105.4 | 16.9 | 0.116 | −0.4 | 33 | 227.5 | 124.1 | 21.6 | 0.707 | −0.1 | |
| men | 34 | 329.8 | 204.2 | 35 | 39 | 248.3 | 116.8 | 18.7 | 43 | 237.8 | 113.7 | 17.3 | ||||||||
| Carbohydrates (EN%)—FFQ | women | 45 | 52.9 | 10 | 1.5 | 0.915 | 0 | 39 | 49.2 | 9.4 | 1.5 | 0.772 | −0.1 | 33 | 51.9 | 8.1 | 1.4 | 0.358 | 0.2 | |
| men | 34 | 52.7 | 9.4 | 1.6 | 39 | 49.8 | 8.8 | 1.4 | 43 | 50.2 | 7.7 | 1.2 | ||||||||
| Fat (g/d)—FFQ | women | 45 | 58.9 | 40.9 | 6.1 | 0.012 | −0.6 | 39 | 66.5 | 42.7 | 6.8 | 0.547 | −0.1 | 33 | 64.6 | 39.4 | 6.9 | 0.656 | −0.1 | |
| men | 34 | 88.2 | 60.5 | 10.4 | 39 | 71.6 | 32.2 | 5.2 | 43 | 68.2 | 31.3 | 4.8 | ||||||||
| Fat (EN%)—FFQ | women | 45 | 30 | 8 | 1.2 | 0.593 | −0.1 | 39 | 32.8 | 7.2 | 1.2 | 0.425 | 0.2 | 33 | 31.1 | 7.1 | 1.2 | 0.665 | −0.1 | |
| men | 34 | 30.9 | 7.6 | 1.3 | 39 | 31.4 | 7.4 | 1.2 | 43 | 31.7 | 6 | 0.9 | ||||||||
| Protein (g/d)—FFQ | women | 45 | 62.2 | 30.4 | 4.5 | 0.007 | −0.7 | 39 | 67.6 | 35.7 | 5.7 | 0.297 | −0.2 | 33 | 62.7 | 24.3 | 4.2 | 0.107 | −0.4 | |
| men | 34 | 90.3 | 51.6 | 8.8 | 39 | 75.3 | 27.8 | 4.5 | 43 | 73 | 29 | 4.4 | ||||||||
| Protein (EN%)—FFQ | women | 45 | 15.4 | 4.2 | 0.6 | 0.854 | 0 | 39 | 16.1 | 3.9 | 0.6 | 0.770 | 0.1 | 33 | 15.3 | 3.9 | 0.7 | 0.523 | −0.2 | |
| men | 34 | 15.2 | 3.9 | 0.7 | 39 | 15.8 | 3.2 | 0.5 | 43 | 15.8 | 2.4 | 0.4 | ||||||||
| Animal protein (g/d)—FFQ | women | 45 | 34.3 | 20.8 | 3.1 | 0.011 | −0.6 | 39 | 40 | 30.3 | 4.8 | 0.167 | −0.3 | 33 | 35.6 | 15.7 | 2.7 | 0.083 | −0.4 | |
| men | 34 | 53.5 | 38.1 | 6.5 | 39 | 48.6 | 23.5 | 3.8 | 43 | 43.5 | 21.9 | 3.3 | ||||||||
| Animal protein (EN%)—FFQ | women | 45 | 8.8 | 4.8 | 0.7 | 0.956 | 0 | 39 | 9.5 | 4.6 | 0.7 | 0.453 | −0.2 | 33 | 9 | 4.1 | 0.7 | 0.532 | −0.1 | |
| men | 34 | 8.9 | 4.3 | 0.7 | 39 | 10.2 | 3.4 | 0.5 | 43 | 9.5 | 3 | 0.5 | ||||||||
| Fiber (g/d)—FFQ | women | 45 | 18.6 | 12.5 | 1.9 | 0.272 | −0.2 | 39 | 17.2 | 9.5 | 1.5 | 0.471 | 0.2 | 33 | 18.2 | 10.3 | 1.8 | 0.599 | −0.1 | |
| men | 34 | 21.8 | 12.5 | 2.1 | 39 | 15.9 | 6.3 | 1 | 43 | 19.5 | 10.1 | 1.5 | ||||||||
| Fiber (EN%)—FFQ | women | 45 | 2 | 0.8 | 0.1 | 0.249 | 0.3 | 39 | 2 | 1 | 0.2 | 0.025 | 0.5 | 33 | 2.1 | 0.9 | 0.1 | 0.625 | 0.1 | |
| men | 34 | 1.8 | 0.8 | 0.1 | 39 | 1.6 | 0.6 | 0.1 | 43 | 2 | 0.7 | 0.1 | ||||||||
| Estimated ethanol intake (g/d)—FFQ | women | 45 | 11.9 | 26.7 | 4 | 0.630 | −0.1 | 39 | 12.9 | 20.3 | 3.3 | 0.342 | −0.2 | 33 | 6.5 | 10.7 | 1.9 | 0.004 | −0.6 | |
| men | 34 | 15 | 29.8 | 5.1 | 39 | 18 | 26.5 | 4.2 | 43 | 60.9 | 117.6 | 17.9 | ||||||||
| Estimated ethanol intake (EN%)—FFQ | women | 45 | 6.2 | 18.7 | 2.8 | 0.998 | 0 | 39 | 5.2 | 7.5 | 1.2 | 0.385 | −0.2 | 33 | 2.7 | 4.6 | 0.005 | 0.8 | −0.6 | |
| men | 34 | 6.2 | 15.7 | 2.7 | 39 | 7 | 10.9 | 1.7 | 43 | 23.1 | 45.1 | 6.9 | ||||||||
| IBD Men—Outcome: High Food-Related Quality of Life | ||||
|---|---|---|---|---|
| n | Odds Ratio [95% CI] | p | ||
| Entity | Crohn’s Disease | 62 | 0.2 [0.08–0.74] | 0.013 |
| Ulcerative Colitis (1) | 47 | |||
| Disease Status | Remission (1) | 59 | 0.1 [0.03–0.28] | <0.001 |
| Active Disease | 50 | |||
| IBD Women—Outcome: High Food-Related Quality of Life | ||||
|---|---|---|---|---|
| n | Odds Ratio [5% CI] | p | ||
| Disease Status | Remission (1) | 57 | 0.1 [0.02–0.23] | <0.001 |
| Active Disease | 51 | |||
| Weight (kg) | 108 | 0.9 [0.91–0.99] | 0.025 | |
| Age (years) | 108 | 1.1 [1.01–1.10] | 0.010 | |
Disclaimer/Publisher’s Note: The statements, opinions and data contained in all publications are solely those of the individual author(s) and contributor(s) and not of MDPI and/or the editor(s). MDPI and/or the editor(s) disclaim responsibility for any injury to people or property resulting from any ideas, methods, instructions or products referred to in the content. |
© 2025 by the authors. Licensee MDPI, Basel, Switzerland. This article is an open access article distributed under the terms and conditions of the Creative Commons Attribution (CC BY) license (https://creativecommons.org/licenses/by/4.0/).
Share and Cite
Pueschel, L.; Wedemeyer, H.; Lenzen, H.; Wiestler, M. Sex Differences Outweigh Dietary Factors in Food-Related Quality of Life in Patients with Inflammatory Bowel Disease. Nutrients 2025, 17, 1114. https://doi.org/10.3390/nu17071114
Pueschel L, Wedemeyer H, Lenzen H, Wiestler M. Sex Differences Outweigh Dietary Factors in Food-Related Quality of Life in Patients with Inflammatory Bowel Disease. Nutrients. 2025; 17(7):1114. https://doi.org/10.3390/nu17071114
Chicago/Turabian StylePueschel, Lea, Heiner Wedemeyer, Henrike Lenzen, and Miriam Wiestler. 2025. "Sex Differences Outweigh Dietary Factors in Food-Related Quality of Life in Patients with Inflammatory Bowel Disease" Nutrients 17, no. 7: 1114. https://doi.org/10.3390/nu17071114
APA StylePueschel, L., Wedemeyer, H., Lenzen, H., & Wiestler, M. (2025). Sex Differences Outweigh Dietary Factors in Food-Related Quality of Life in Patients with Inflammatory Bowel Disease. Nutrients, 17(7), 1114. https://doi.org/10.3390/nu17071114