
The Impact of Artificially Sweetened Drinks on Metformin Efficacy


Abstract
1. Introduction
2. Materials and Methods
3. Statistical Analysis
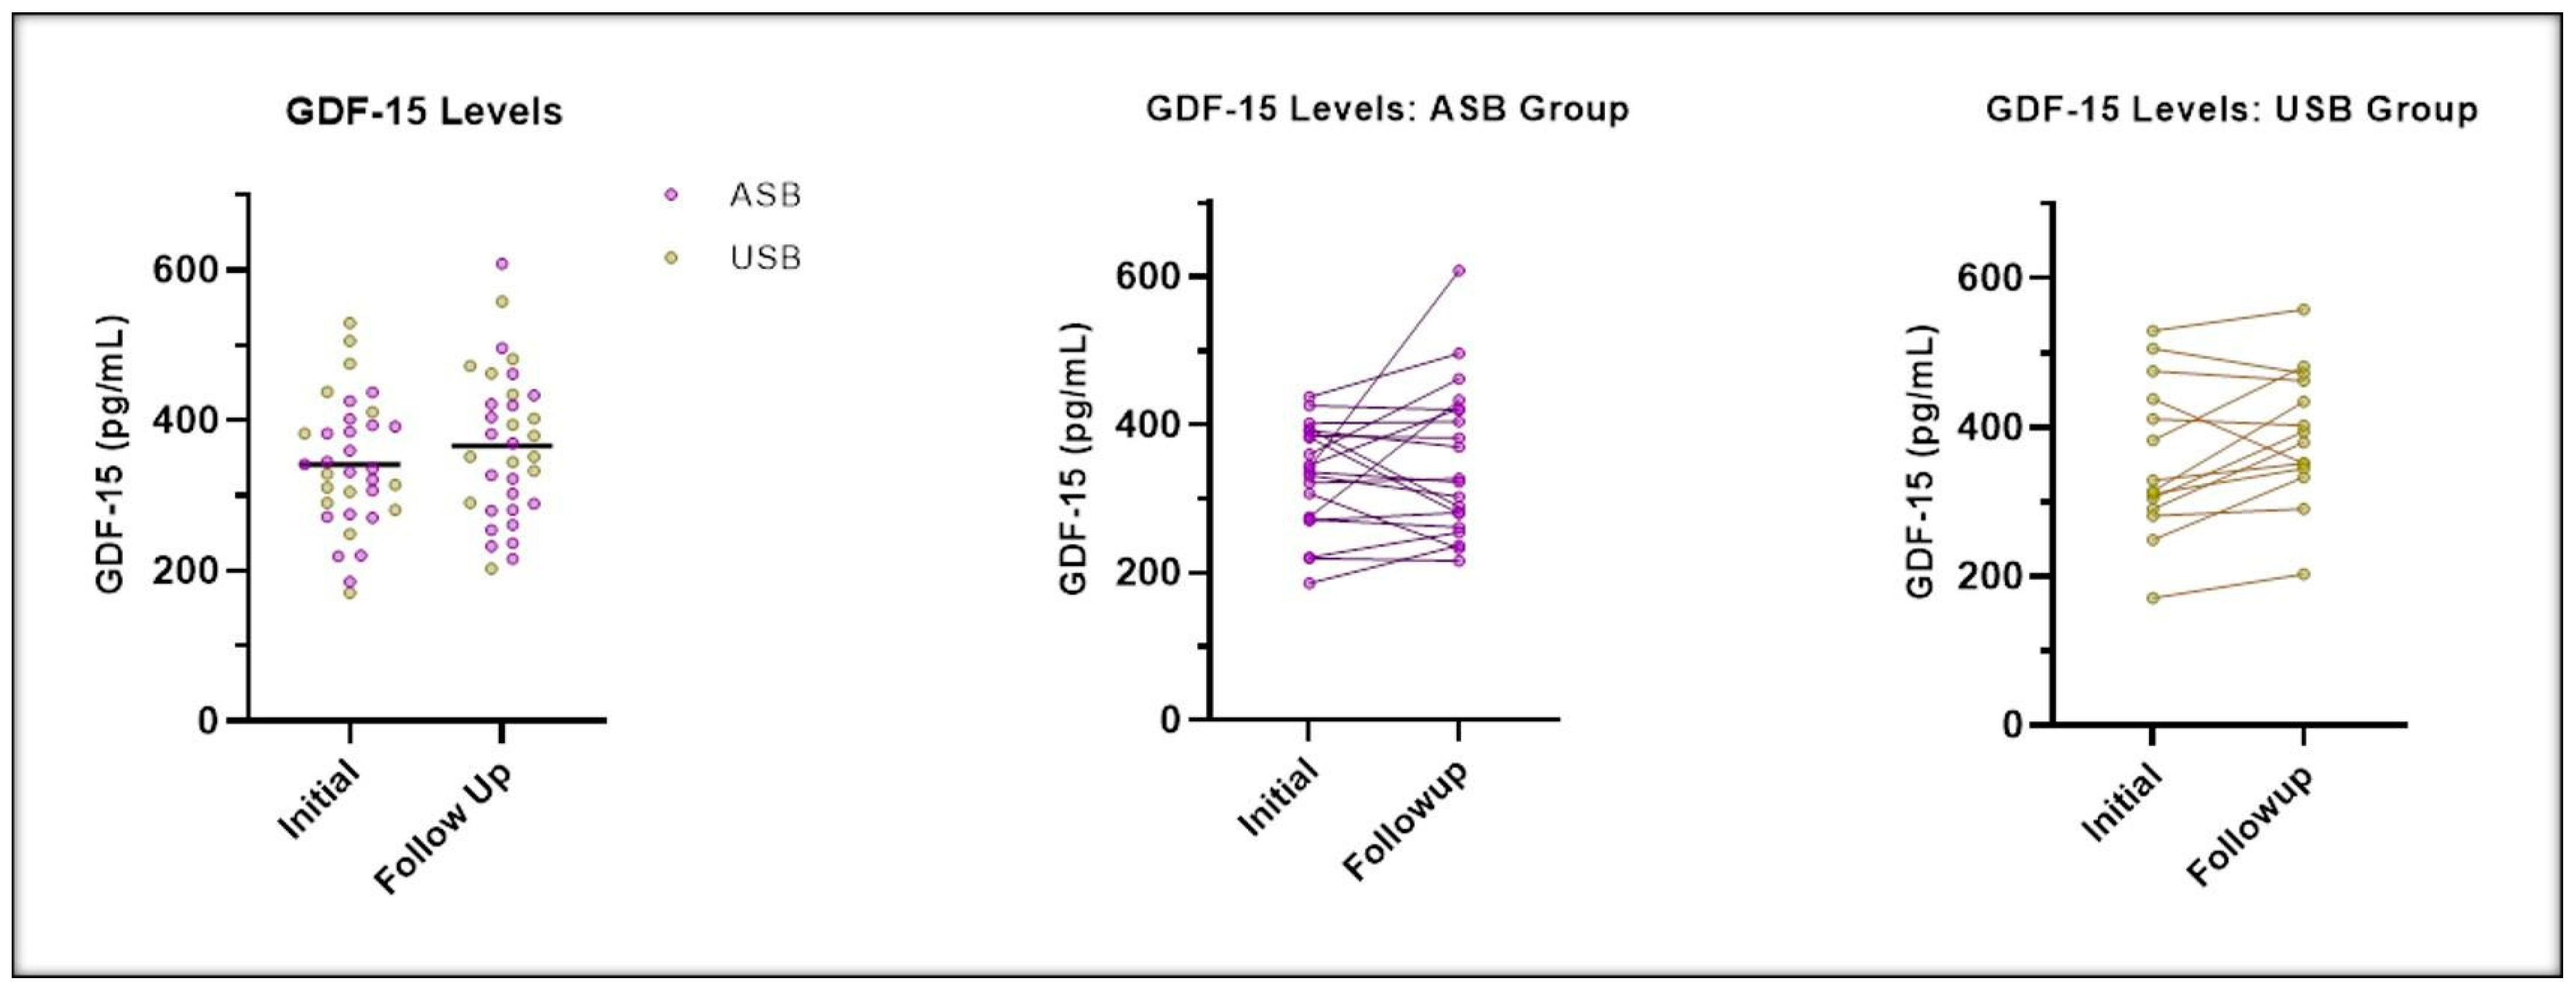
4. Results
5. Discussion
6. Conclusions
Supplementary Materials
Author Contributions
Funding
Institutional Review Board Statement
Informed Consent Statement
Data Availability Statement
Acknowledgments
Conflicts of Interest
References
- Sanyaolu, A.; Okorie, C.; Qi, X.; Locke, J.; Rehman, S. Childhood and adolescent obesity in the United States: A public health concern. Glob. Pediatr Health. 2019, 6, 2333794X19891305. [Google Scholar] [CrossRef] [PubMed]
- Andes, L.J.; Cheng, Y.J.; Rolka, D.B.; Gregg, E.W.; Imperatore, G. Prevalence of prediabetes among adolescents and young adults in the United States, 2005–2016. JAMA Pediatr. 2020, 174, e194498. [Google Scholar] [CrossRef]
- Ferraro, A.A.; Bechere Fernandes, M.T. Relationship between childhood growth and later outcomes. Nestle Nutr. Inst. Workshop Ser. 2013, 71, 191–197. [Google Scholar] [CrossRef] [PubMed]
- Deckelbaum, R.J.; Williams, C.L. Childhood obesity: The health issue. Obes. Res. 2001, 9 (Suppl. 4), 239S–243S. [Google Scholar] [CrossRef] [PubMed]
- Hu, F.B.; Malik, V.S. Sugar-sweetened beverages and risk of obesity and type 2 diabetes: Epidemiologic evidence. Physiol. Behav. 2010, 100, 47–54. [Google Scholar] [CrossRef] [PubMed] [PubMed Central]
- Malik, V.S.; Pan, A.; Willett, W.C.; Hu, F.B. Sugar-sweetened beverages and weight gain in children and adults: A systematic review and meta-analysis. Am. J. Clin. Nutr. 2013, 98, 1084–1102. [Google Scholar] [CrossRef]
- Malik, V.S.; Popkin, B.M.; Bray, G.A.; Despres, J.P.; Hu, F.B. Sugar-sweetened beverages, obesity, type 2 diabetes, and cardiovascular disease risk. Circulation 2010, 121, 1356–1364. [Google Scholar] [CrossRef]
- Calcaterra, V.; Cena, H.; Magenes, V.C.; Vincenti, A.; Comola, G.; Beretta, A.; Di Napoli, I.; Zuccotti, G. Sugar-sweetened beverages and metabolic risk in children and adolescents with obesity: A narrative review. Nutrients 2023, 15, 702. [Google Scholar] [CrossRef] [PubMed]
- Sylvetsky, A.C.; Jin, Y.; Clark, E.J.; Welsh, J.A.; Rother, K.I.; Talegawkar, S.A. Consumption of low-calorie sweeteners among children and adults in the United States. J. Acad. Nutr. Diet. 2017, 117, 441–448.e2. [Google Scholar] [CrossRef] [PubMed] [PubMed Central]
- Debras, C.; Chazelas, E.; Sellem, L.; Porcher, R.; Druesne-Pecollo, N.; Esseddik, Y.; de Edelenyi, F.S.; Agaësse, C.; De Sa, A.; Lutchia, R.; et al. Artificial sweeteners and risk of cardiovascular diseases: Results from the prospective NutriNet-Santé cohort. BMJ 2022, 378, e071204. [Google Scholar] [CrossRef] [PubMed] [PubMed Central]
- Nettleton, J.A.; Lutsey, P.L.; Wang, Y.; Lima, J.A.; Michos, E.D.; Jacobs, D.R., Jr. Diet soda intake and risk of incident metabolic syndrome and type 2 diabetes in the Multi-Ethnic Study of Atherosclerosis (MESA). Diabetes Care 2009, 32, 688–694. [Google Scholar] [CrossRef] [PubMed] [PubMed Central]
- Christofides, E.A. POINT: Artificial sweeteners and obesity—Not the solution and potentially a problem. Endocr. Pract. 2021, 27, 1052–1055. [Google Scholar] [CrossRef] [PubMed]
- Soliman, A.; De Sanctis, V.; Alaaraj, N.; Hamed, N. The clinical application of metformin in children and adolescents: A short update. Acta Biomed. 2020, 91, e2020086. [Google Scholar] [CrossRef]
- Lv, Z.; Guo, Y. Metformin and its benefits for various diseases. Front. Endocrinol. 2020, 11, 191. [Google Scholar] [CrossRef]
- Gerstein, H.C.; Pare, G.; Hess, S.; Ford, R.J.; Sjaarda, J.; Raman, K.; McQueen, M.; Lee, S.; Haenel, H.; Steinberg, G.R. Growth differentiation factor 15 as a novel biomarker for metformin. Diabetes Care 2017, 40, 280–283. [Google Scholar] [CrossRef] [PubMed]
- Hsu, J.-Y.; Crawley, S.; Chen, M.; Ayupova, D.A.; Lindhout, D.A.; Higbee, J.; Kutach, A.; Joo, W.; Gao, Z.; Fu, D.; et al. Non-homeostatic body weight regulation through a brainstem-restricted receptor for GDF15. Nature 2017, 550, 255–259. [Google Scholar] [CrossRef]
- Coll, A.P.; Chen, M.; Taskar, P.; Rimmington, D.; Patel, S.; Tadross, J.A.; Cimino, I.; Yang, M.; Welsh, P.; Virtue, S.; et al. GDF15 mediates the effects of metformin on body weight and energy balance. Nature 2020, 578, 444–448. [Google Scholar] [CrossRef]
- Ouyang, J.; Isnard, S.; Lin, J.; Fombuena, B.; Peng, X.; Chen, Y.; Routy, J.-P. GDF-15 as a weight watcher for diabetic and non-diabetic people treated with metformin. Front. Endocrinol. 2020, 11, 581839. [Google Scholar] [CrossRef] [PubMed]
- Day, E.A.; Ford, R.J.; Smith, B.K.; Mohammadi-Shemirani, P.; Morrow, M.R.; Gutgesell, R.M.; Lu, R.; Raphenya, A.R.; Kabiri, M.; McArthur, A.G.; et al. Metformin-induced increases in GDF15 are important for suppressing appetite and promoting weight loss. Nat. Metab. 2019, 1, 1202–1208. [Google Scholar] [CrossRef] [PubMed]
- Niederberger, E.; Parnham, M.J. The impact of diet and exercise on drug responses. Int. J. Mol. Sci. 2021, 22, 7692. [Google Scholar] [CrossRef]
- Gardner, C.; Wylie-Rosett, J.; Gidding, S.S.; Steffen, L.M.; Johnson, R.K.; Reader, D.; Lichtenstein, A.H. Nonnutritive sweeteners: Current use and health perspectives: A scientific statement from the American heart association and the American diabetes association. Diabetes Care 2012, 35, 1798–1808. [Google Scholar] [CrossRef] [PubMed]
- Ezzamouri, B.; Rosario, D.; Bidkhori, G.; Lee, S.; Uhlen, M.; Shoaie, S. Metabolic modelling of the human gut microbiome in type 2 diabetes patients in response to metformin treatment. NPJ Syst. Biol. Appl. 2023, 9, 2. [Google Scholar] [CrossRef] [PubMed]
- Singh, A.; Rourk, K.; Bernier, A.; de Lartigue, G. Non-nutritive sweetened beverages impair therapeutic benefits of metformin in prediabetic diet-induced obese mice. Nutrients 2023, 15, 2472. [Google Scholar] [CrossRef] [PubMed]
- Shum, B.; Georgia, S. The effects of non-nutritive sweetener consumption in the pediatric populations: What we know, what we don’t, and what we need to learn. Front. Endocrinol. 2021, 12, 625415. [Google Scholar] [CrossRef] [PubMed] [PubMed Central]
- Kincaid, J.W.R.; Rimmington, D.; Tadross, J.A.; Cimino, I.; Zvetkova, I.; Kaser, A.; Richards, P.; Patel, S.; O’rahilly, S.; Coll, A.P. The gastrointestinal tract is a major source of the acute metformin-stimulated rise in GDF15. Sci. Rep. 2024, 14, 1899. [Google Scholar] [CrossRef] [PubMed]

| All Participants | Completers with Follow-Up Data at 12 Weeks | |||||||
|---|---|---|---|---|---|---|---|---|
| Overall (N = 46) | USB (N = 23) | ASB (N = 23) | p-Value | Overall (N = 36) | USB (N = 16) | ASB (N = 20) | p-Value | |
| Sex at birth (N,%) | 1.0000 | 0.7486 | ||||||
| Male | 21 (45.7%) | 11 (47.8%) | 10 (43.5%) | 19 (52.8%) | 9 (56.3%) | 10 (50.0%) | ||
| Female | 25 (54.3%) | 12 (52.2%) | 13 (56.5%) | 17 (47.2%) | 7 (43.8%) | 10 (50.0%) | ||
| Race (N,%) | 0.2942 | 0.2155 | ||||||
| White/Caucasian | 16 (34.8%) | 8 (34.8%) | 8 (34.8%) | 11 (30.6%) | 5 (31.3%) | 6 (30.0%) | ||
| Black/African American | 25 (54.3%) | 11 (47.8%) | 14 (60.9%) | 22 (61.1%) | 8 (50.0%) | 14 (70.0%) | ||
| Native Hawaiian or Pacific Islander | 1 (2.2%) | 0 (0%) | 1 (4.3%) | 0 (0%) | 0 (0%) | 0 (0%) | ||
| More than one race | 2 (4.3%) | 2 (8.7%) | 0 (0%) | 1 (2.8%) | 1 (6.3%) | 0 (0%) | ||
| Unknown | 2 (4.3%) | 2 (8.7%) | 0 (0%) | 2 (5.6%) | 2 (12.5%) | 0 (0%) | ||
| Ethnicity (N,%) | 1.0000 | 0.6371 | ||||||
| Hispanic or Latino | 5 (10.9%) | 3 (13%) | 2 (8.7%) | 5 (13.9%) | 3 (18.8%) | 2 (10.0%) | ||
| Non-Hispanic or Non-Latino | 41 (89.1%) | 20 (87%) | 21 (91.3%) | 31 (86.1%) | 13 (81.3%) | 18 (90.0%) | ||
| How often do you feel hungry? (N,%) | 0.5218 | 0.4045 | ||||||
| Never | 2 (4.3%) | 0 (0%) | 2 (8.7%) | 1 (2.8%) | 0 (0%) | 1 (5.0%) | ||
| Rarely | 5 (10.9%) | 3 (13%) | 2 (8.7%) | 3 (8.3%) | 2 (12.5%) | 1 (5.0%) | ||
| Sometimes | 14 (30.4%) | 6 (26.1%) | 8 (34.8%) | 10 (27.8%) | 3 (18.8%) | 7 (35.0%) | ||
| Most of the time | 18 (39.1%) | 9 (39.1%) | 9 (39.1%) | 15 (41.7%) | 6 (37.5%) | 9 (45.0%) | ||
| All the time | 7 (15.2%) | 5 (21.7%) | 2 (8.7%) | 7 (19.4%) | 5 (31.3%) | 2 (10.0%) | ||
| Do you ask for ‘seconds’ after meals? (N,%) | 0.3514 | 0.1325 | ||||||
| Never | 4 (8.7%) | 3 (13%) | 1 (4.3%) | 2 (5.6%) | 2 (12.5%) | 0 (0%) | ||
| Rarely | 7 (15.2%) | 5 (21.7%) | 2 (8.7%) | 4 (11.1%) | 3 (18.8%) | 1 (5.0%) | ||
| Sometimes | 21 (45.7%) | 10 (43.5%) | 11 (47.8%) | 17 (47.2%) | 7 (43.8%) | 10 (50.0%) | ||
| Most of the time | 11 (23.9%) | 3 (13%) | 8 (34.8%) | 10 (27.8%) | 2 (12.5%) | 8 (40.0%) | ||
| All the time | 3 (6.5%) | 2 (8.7%) | 1 (4.3%) | 3 (8.3%) | 2 (12.5%) | 1 (5.0%) | ||
| Do you get snacks in between meals or in the evening? (N,%) | 0.6652 | 0.6722 | ||||||
| No | 6 (13%) | 2 (8.7%) | 4 (17.4%) | 6 (16.7%) | 2 (12.5%) | 4 (20.0%) | ||
| Yes | 40 (87%) | 21 (91.3%) | 19 (82.6%) | 30 (83.3%) | 14 (87.5%) | 16 (80.0%) | ||
| Age (years) (mean ± SD) | 13.5 ± 2.2 | 13.5 ± 2.4 | 13.6 ± 2.1 | 0.8969 | 13.2 ± 2.0 | 13.0 ± 1.9 | 13.4 ± 2.1 | 0.5645 |
| BMI (mean ± SD) | 40.5 ± 8.5 | 39.8 ± 6.7 | 41.1 ± 10.1 | 0.6146 | 39.7 ± 7.8 | 39.4 ± 6.9 | 39.9 ± 8.6 | 0.8527 |
| % of 95th BMI percentile (mean ± SD) | 152.5 ± 29.0 | 151.4 ± 24.5 | 153.7 ± 33.5 | 0.7910 | 151.6 ± 27.1 | 152.4 ± 24.1 | 150.9 ± 29.9 | 0.8686 |
| BMI z score (mean ± SD) | 3.2 ± 1.0 | 3.2 ± 0.9 | 3.3 ± 1.2 | 0.7699 | 3.2 ± 1.0 | 3.2 ± 0.9 | 3.2 ± 1.0 | 0.8841 |
| Fasting glucose (mg/dL) | 98.5 ± 14.7 | 94.6 ± 12.9 | 102.4 ± 15.7 | 0.0726 | 97.9 ± 15.6 | 94.3 ± 14.9 | 100.9 ± 15.8 | 0.1708 |
| HbA1c % value (mean ± SD) | 6.0 ± 0.3 | 5.8 ± 0.2 | 6.1 ± 0.2 | 0.0018 | 5.9 ± 0.3 | 5.8 ± 0.2 | 6.0 ± 0.2 | 0.0062 |
| GDF-15 (pg/mL) (mean ± SD) | 360.6 ± 117.9 | 377.3 ± 143.2 | 344.6 ± 87.7 | 0.3583 | 359.4 ± 118.9 | 396.1 ± 154.8 | 330.0 ± 71.3 | 0.0978 |
| HOMA-IR | 9.8 ± 7.2 | 9.5 ± 7.0 | 10.0 ± 7.6 | 0.8463 | 9.3 ± 7.4 | 9.9 ± 8.2 | 8.9 ± 7.0 | 0.7097 |
| Total estimated carbs (g) (mean ± SD) | 158.2 ± 68.4 | 153.4 ± 58.9 | 163 ± 77.7 | 0.6401 | 151.6 ± 58.6 | 144.3 ± 46.6 | 157.4 ± 67.2 | 0.5149 |
| Total estimated added sugars (g) (mean ± SD) | 48.2 ± 48.1 | 48.2 ± 32.7 | 48.2 ± 60.5 | 0.9983 | 41.9 ± 30.9 | 46.5 ± 31.4 | 38.3 ± 30.9 | 0.4384 |
| Overall (N = 36) | USB (N = 16) | ASB (N = 20) | p-Value (1) | |
|---|---|---|---|---|
| Have you noticed any changes in hunger? (N,%) | 0.6665 | |||
| Less hungry | 23 (63.9%) | 9 (56.3%) | 14 (70.0%) | |
| No change | 10 (27.8%) | 5 (31.3%) | 5 (25.0%) | |
| More hungry | 3 (8.3%) | 2 (12.5%) | 1 (5.0%) | |
| Have you noticed any changes in your portion sizes? (N,%) | 0.3204 | |||
| Smaller | 15 (41.7%) | 5 (31.3%) | 10 (50.0%) | |
| Same | 21 (58.3%) | 11 (68.8%) | 10 (50.0%) | |
| Have you noticed any changes in snack intake? (N,%) | 0.7343 | |||
| Less snacks | 22 (61.1%) | 9 (56.3%) | 13 (65.0%) | |
| No change | 14 (38.9%) | 7 (43.8%) | 7 (35.0%) | |
| Change in BMI (mean ± SD) | −0.37 ± 1.54 | −0.55 ± 1.49 | −0.23 ± 1.60 | 0.5390 |
| Change in BMI 95% percentile (mean ± SD) | −3.02 ± 5.83 | −3.94 ± 5.78 | −2.28 ± 5.91 | 0.4037 |
| Change in BMI z scores (mean ± SD) | −0.10 ± 0.19 | −0.12 ± 0.19 | −0.09 ± 0.21 | 0.6273 |
| Change in fasting glucose (mg/dL) (mean ± SD) | 1.14 ± 21.40 | −4.06 ± 18.83 | 5.30 ± 22.85 | 0.1962 |
| Change in HbA1c (mean ± SD) | −0.12 ± 0.26 | −0.12 ± 0.25 | −0.13 ± 0.28 | 0.9445 |
| Change in GDF-15 (mean ± SD) (2) | 25.38 ± 75.05 | 33.40 ± 58.34 | 19.77 ± 85.87 | 0.6099 |
| Change in HOMA-IR (mean ± SD) (3) | −0.22 ± 10.16 | −4.13 ± 9.68 | 1.84 ± 10.04 | 0.1354 |
| Change in total estimated carbs (g) (mean ± SD) | −23.60 ± 70.97 | −22.10 ± 68.10 | −24.80 ± 74.92 | 0.9092 |
| Change in total estimated added sugars (mean ± SD) | −19.50 ± 33.94 | −22.20 ± 39.98 | −17.40 ± 29.16 | 0.6800 |
| Percentage of metformin intake (mean ± SD) | 70.00 ± 31.05 | 70.00 ± 36.97 | 70.00 ± 26.12 | 1.0000 |
| Overall | USB | ASB | p-Value | ||||
|---|---|---|---|---|---|---|---|
| N | % | N | % | N | % | ||
| Decrease in BMI | 19 | 52.8 | 9 | 56.3 | 10 | 50.0 | 0.7486 |
| Yes | |||||||
| No | 17 | 47.2 | 7 | 43.8 | 10 | 50.0 | |
| Decrease in BMI 95% percentile | 23 | 63.9 | 10 | 62.5 | 13 | 65.0 | 1.0000 |
| Yes | |||||||
| No | 13 | 36.1 | 6 | 37.5 | 7 | 35.0 | |
| Decrease in BMI z-score | 24 | 66.7 | 10 | 62.5 | 14 | 70.0 | 0.7295 |
| Yes | |||||||
| No | 12 | 33.3 | 6 | 37.5 | 6 | 30.0 | |
| Decrease in HbA1c | 24 | 66.7 | 10 | 62.5 | 14 | 70.0 | 0.7295 |
| Yes | |||||||
| No | 12 | 33.3 | 6 | 37.5 | 6 | 30.0 | |
| Increase in GDF-15 | 2 | 5.6 | 2 | 12.5 | 0 | 0 | 0.1625 |
| Missing | |||||||
| Yes | 16 | 44.4 | 9 | 56.3 | 7 | 35.0 | |
| No | 18 | 50.0 | 5 | 31.3 | 13 | 65.0 | |
| Decrease in HOMA-IR | 7 | 19.4 | 6 | 37.5 | 1 | 5.0 | 0.0084 |
| Missing | |||||||
| Yes | 16 | 44.4 | 9 | 56.3 | 7 | 35.0 | |
| No | 13 | 36.1 | 1 | 6.3 | 12 | 60.0 | |
Disclaimer/Publisher’s Note: The statements, opinions and data contained in all publications are solely those of the individual author(s) and contributor(s) and not of MDPI and/or the editor(s). MDPI and/or the editor(s) disclaim responsibility for any injury to people or property resulting from any ideas, methods, instructions or products referred to in the content. |
© 2025 by the authors. Licensee MDPI, Basel, Switzerland. This article is an open access article distributed under the terms and conditions of the Creative Commons Attribution (CC BY) license (https://creativecommons.org/licenses/by/4.0/).
Share and Cite
Ismail, E.; Chi, X.; Bhatta, M.; Hosford, J.; Bernier, A. The Impact of Artificially Sweetened Drinks on Metformin Efficacy. Nutrients 2025, 17, 797. https://doi.org/10.3390/nu17050797
Ismail E, Chi X, Bhatta M, Hosford J, Bernier A. The Impact of Artificially Sweetened Drinks on Metformin Efficacy. Nutrients. 2025; 17(5):797. https://doi.org/10.3390/nu17050797
Chicago/Turabian StyleIsmail, Esraa, Xiaofei Chi, Mallika Bhatta, Jennifer Hosford, and Angelina Bernier. 2025. "The Impact of Artificially Sweetened Drinks on Metformin Efficacy" Nutrients 17, no. 5: 797. https://doi.org/10.3390/nu17050797
APA StyleIsmail, E., Chi, X., Bhatta, M., Hosford, J., & Bernier, A. (2025). The Impact of Artificially Sweetened Drinks on Metformin Efficacy. Nutrients, 17(5), 797. https://doi.org/10.3390/nu17050797