
Validation of a Smartphone Application for Monitoring Circadian Appetite: A Randomized Crossover Trial in Free-Living and Controlled Settings


Abstract
1. Introduction
2. Materials and Methods
2.1. Translation
2.2. Participants
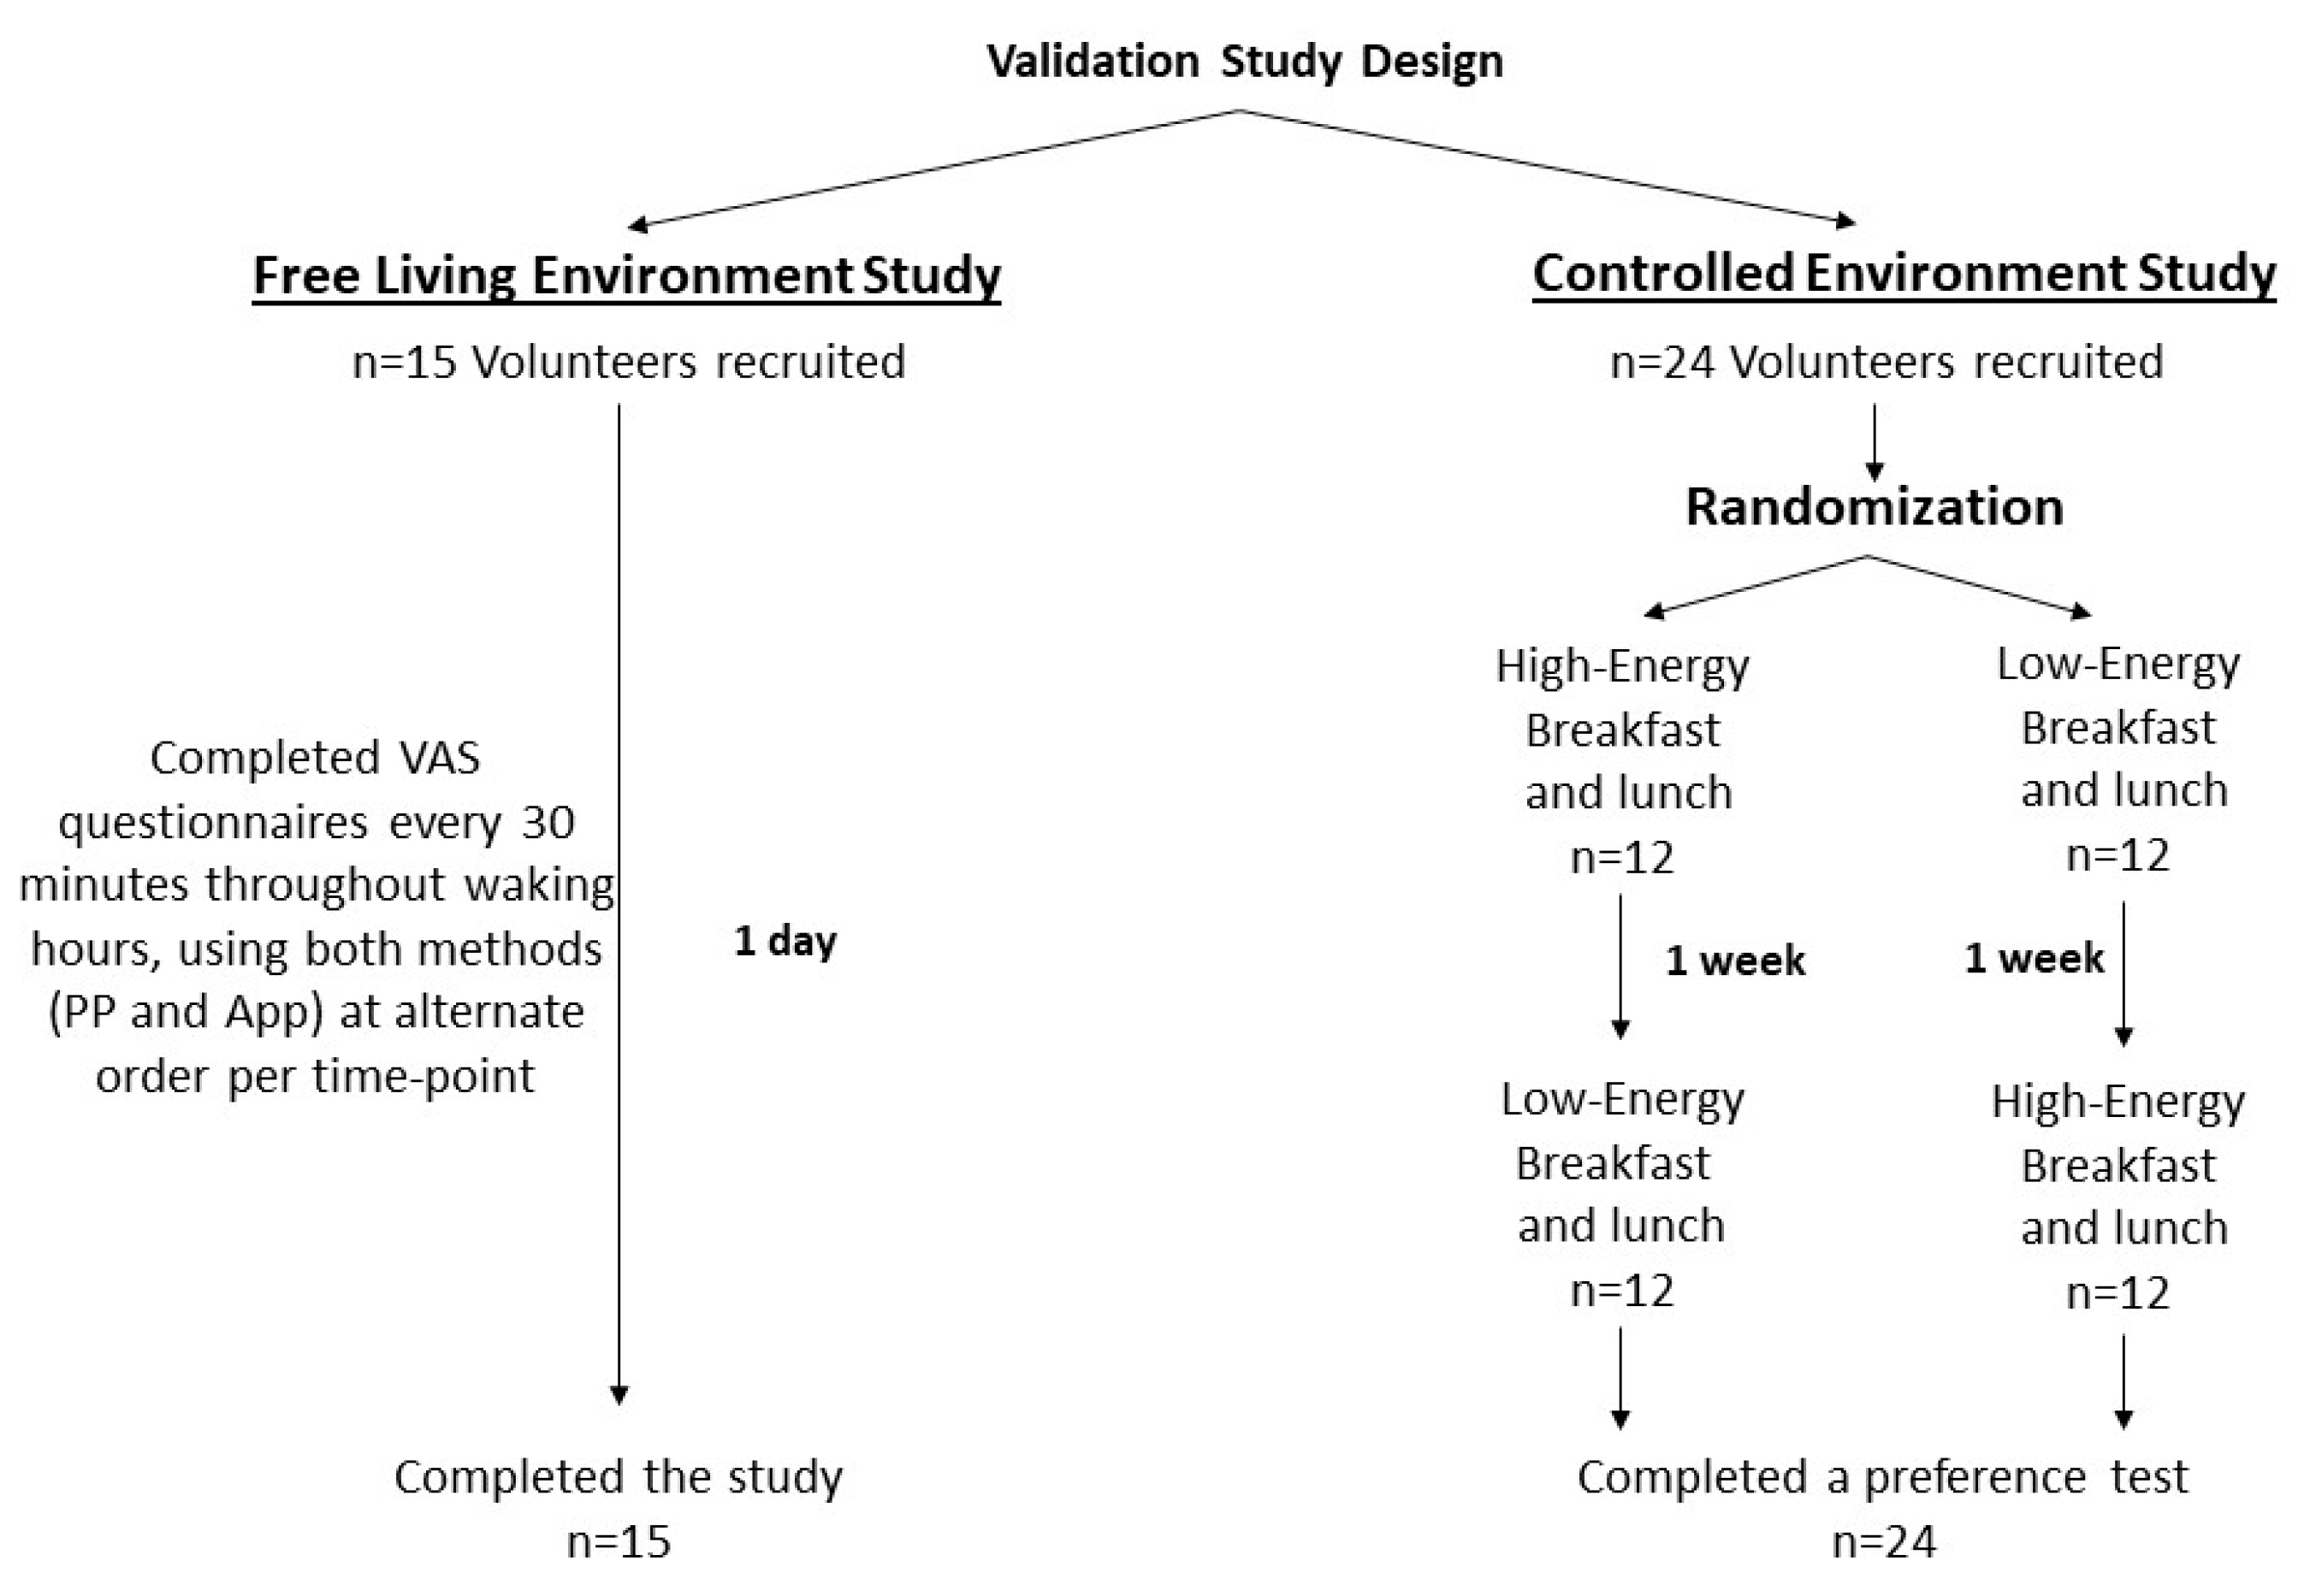
2.3. Study Design
2.4. Diets
2.5. Subjective Appetite Scores
2.6. Statistical Analysis
3. Results
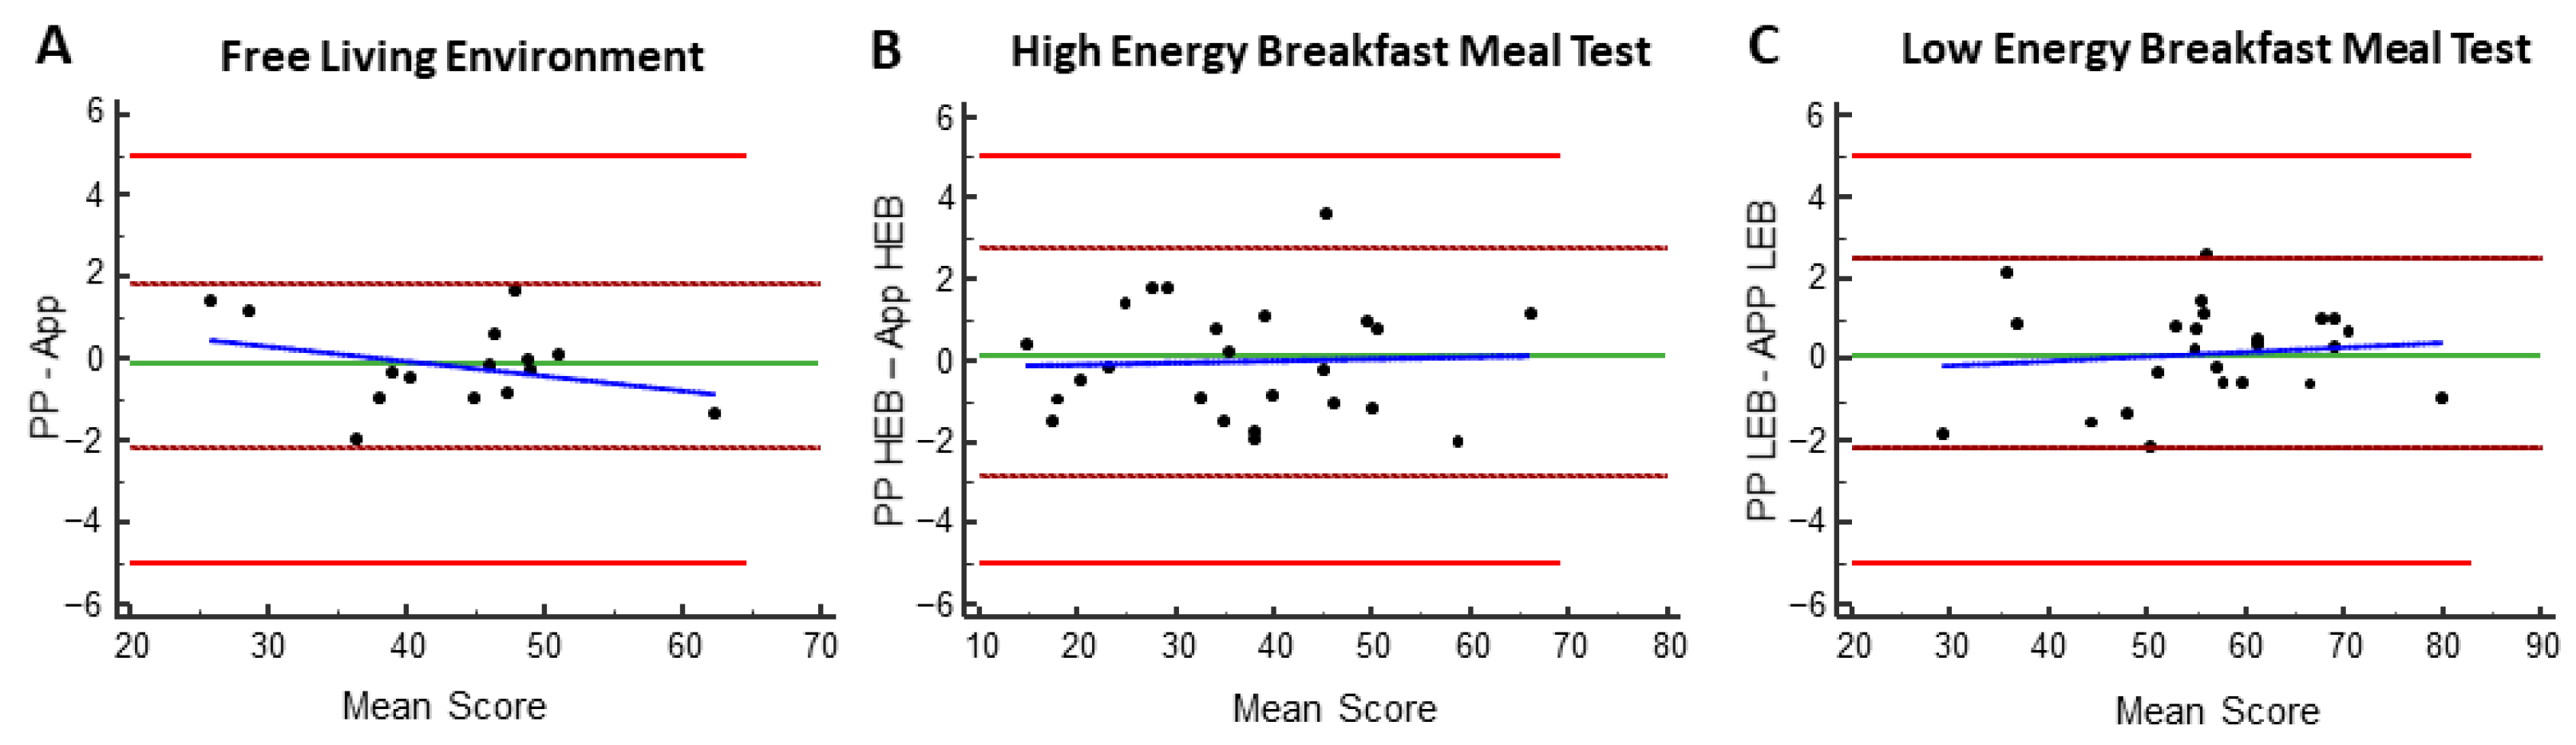
3.1. Validation of the Smartphone Application vs. Pen and Paper in a Free-Living Environment
3.2. Preference for a Smartphone Application over Pen and Paper
3.3. Oscillation of Appetite Sensations in a Free-Living Environment
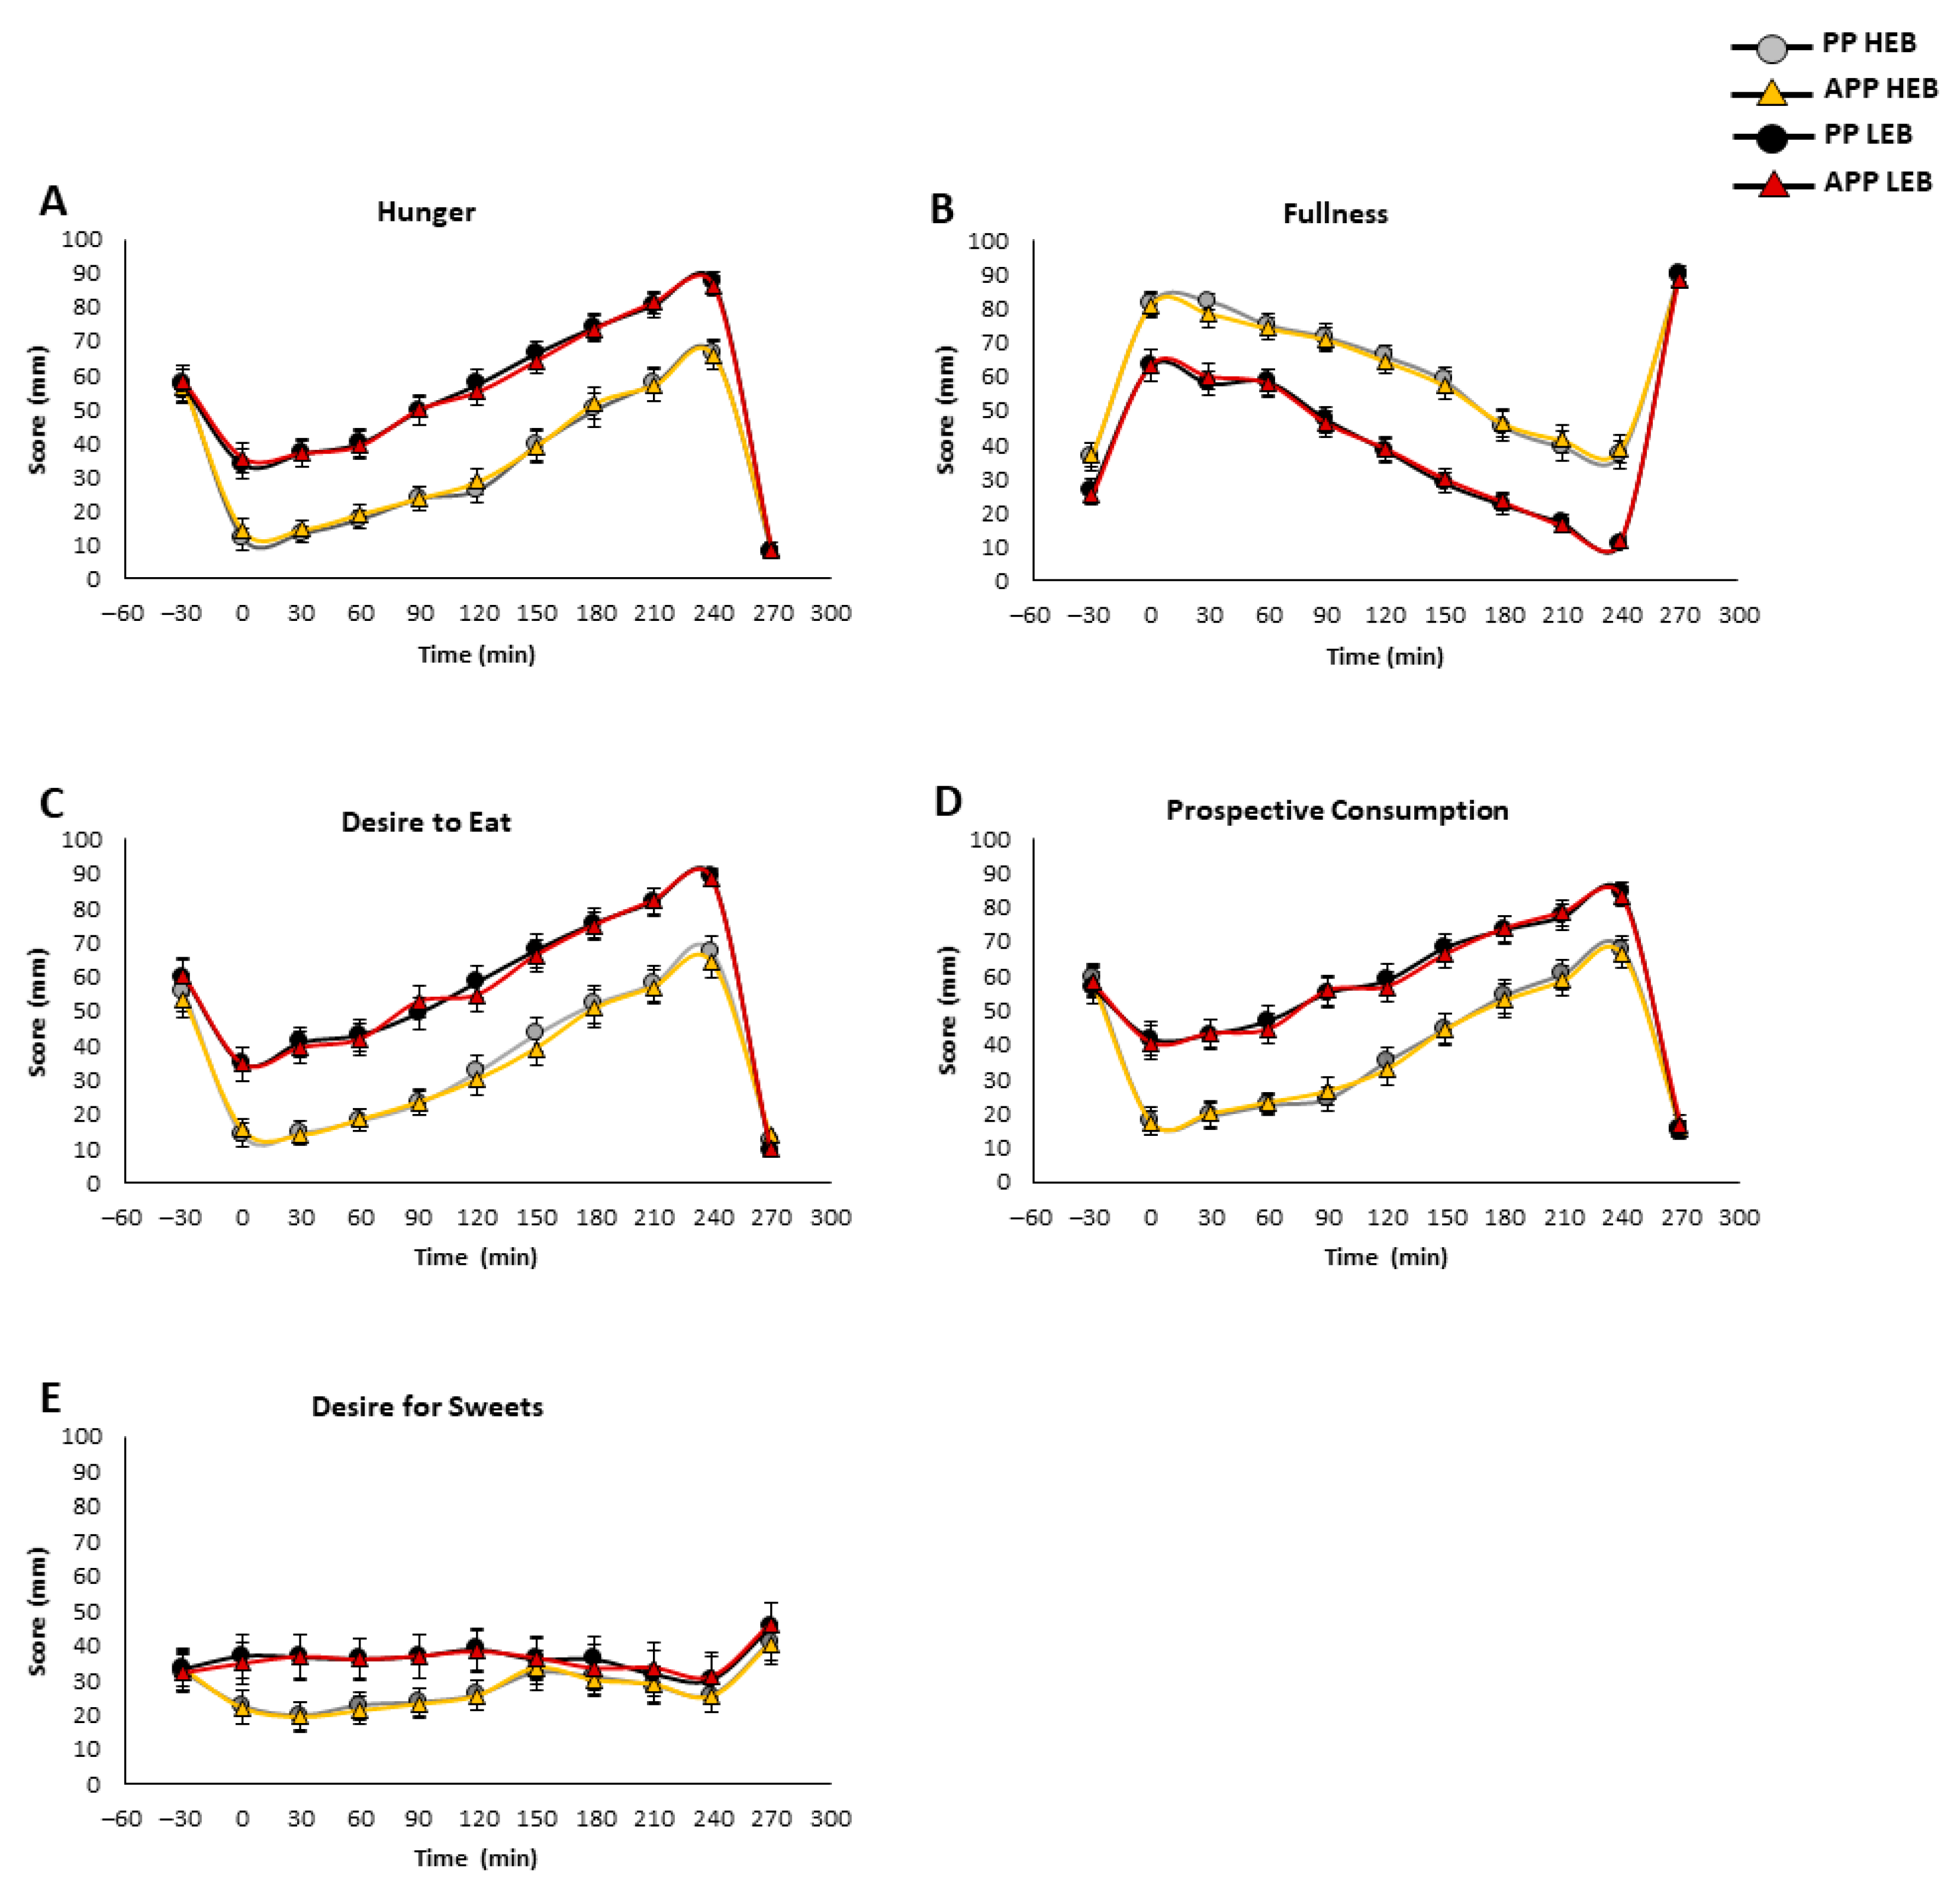
3.4. Effect of a Meal Test on Circadian Appetite Sensations
4. Discussion
5. Conclusions
Supplementary Materials
Author Contributions
Funding
Institutional Review Board Statement
Informed Consent Statement
Data Availability Statement
Acknowledgments
Conflicts of Interest
References
- Gibson, A.A.; Sainsbury, A. Strategies to Improve Adherence to Dietary Weight Loss Interventions in Research and Real-World Settings. Behav. Sci. 2017, 7, 44. [Google Scholar] [CrossRef]
- Gill, S.; Panda, S. A Smartphone App Reveals Erratic Diurnal Eating Patterns in Humans that Can Be Modulated for Health Benefits. Cell Metab. 2015, 22, 789–798. [Google Scholar] [CrossRef] [PubMed]
- Parr, E.B.; Devlin, B.L.; Radford, B.E.; Hawley, J.A. A Delayed Morning and Earlier Evening Time-Restricted Feeding Protocol for Improving Glycemic Control and Dietary Adherence in Men with Overweight/Obesity: A Randomized Controlled Trial. Nutrients 2020, 12, 505. [Google Scholar] [CrossRef] [PubMed]
- Thomas, E.A.; Zaman, A.; Cornier, M.A.; Catenacci, V.A.; Tussey, E.J.; Grau, L.; Arbet, J.; Broussard, J.L.; Rynders, C.A. Later Meal and Sleep Timing Predicts Higher Percent Body Fat. Nutrients 2020, 13, 73. [Google Scholar] [CrossRef] [PubMed]
- Sutton, E.F.; Beyl, R.; Early, K.S.; Cefalu, W.T.; Ravussin, E.; Peterson, C.M. Early Time-Restricted Feeding Improves Insulin Sensitivity, Blood Pressure, and Oxidative Stress Even without Weight Loss in Men with Prediabetes. Cell Metab. 2018, 27, 1212–1221. [Google Scholar] [CrossRef] [PubMed]
- Jakubowicz, D.; Landau, Z.; Tsameret, S.; Wainstein, J.; Raz, I.; Ahren, B.; Chapnik, N.; Barnea, M.; Ganz, T.; Menaged, M.; et al. Reduction in Glycated Hemoglobin and Daily Insulin Dose Alongside Circadian Clock Upregulation in Patients With Type 2 Diabetes Consuming a Three-Meal Diet: A Randomized Clinical Trial. Diabetes Care 2019, 42, 2171–2180. [Google Scholar] [CrossRef] [PubMed]
- Page, A.J.; Christie, S.; Symonds, E.; Li, H. Circadian regulation of appetite and time restricted feeding. Physiol. Behav. 2020, 220, 112873. [Google Scholar] [CrossRef] [PubMed]
- Hernandez Morante, J.J.; Diaz Soler, I.; Munoz, J.S.G.; Sanchez, H.P.; Barbera Ortega, M.D.C.; Martinez, C.M.; Morillas Ruiz, J.M. Moderate Weight Loss Modifies Leptin and Ghrelin Synthesis Rhythms but Not the Subjective Sensations of Appetite in Obesity Patients. Nutrients 2020, 12, 916. [Google Scholar] [CrossRef]
- Templeman, I.; Smith, H.A.; Walhin, J.P.; Middleton, B.; Gonzalez, J.T.; Karagounis, L.G.; Johnston, J.D.; Betts, J.A. Unacylated ghrelin, leptin, and appetite display diurnal rhythmicity in lean adults. J. Appl. Physiol. 2021, 130, 1534–1543. [Google Scholar] [CrossRef] [PubMed]
- Stubbs, R.J.; Hughes, D.A.; Johnstone, A.M.; Rowley, E.; Reid, C.; Elia, M.; Stratton, R.; Delargy, H.; King, N.; Blundell, J.E. The use of visual analogue scales to assess motivation to eat in human subjects: A review of their reliability and validity with an evaluation of new hand-held computerized systems for temporal tracking of appetite ratings. Br. J. Nutr. 2000, 84, 405–415. [Google Scholar] [CrossRef]
- Flint, A.; Raben, A.; Blundell, J.E.; Astrup, A. Reproducibility, power and validity of visual analogue scales in assessment of appetite sensations in single test meal studies. Int. J. Obes. Relat. Metab. Disord. 2000, 24, 38–48. [Google Scholar] [CrossRef] [PubMed]
- Lee, S.M.; Lee, D. Opportunities and challenges for contactless healthcare services in the post-COVID-19 Era. Technol. Forecast. Soc. Change 2021, 167, 120712. [Google Scholar] [CrossRef] [PubMed]
- Whybrow, S.; Stephen, J.R.; Stubbs, R.J. The evaluation of an electronic visual analogue scale system for appetite and mood. Eur. J. Clin. Nutr. 2006, 60, 558–560. [Google Scholar] [CrossRef] [PubMed]
- Gibbons, C.; Caudwell, P.; Finlayson, G.; King, N.; Blundell, J. Validation of a new hand-held electronic data capture method for continuous monitoring of subjective appetite sensations. Int. J. Behav. Nutr. Phys. Act. 2011, 8, 57. [Google Scholar] [CrossRef]
- Brunger, L.; Smith, A.; Re, R.; Wickham, M.; Philippides, A.; Watten, P.; Yeomans, M.R. Validation of an iPad visual analogue rating system for assessing appetite and satiety. Appetite 2015, 84, 259–263. [Google Scholar] [CrossRef] [PubMed]
- Holliday, A.; Johnson, K.O.; Kaiseler, M.; Crabtree, D.R. APPetite: Validation of a smartphone app-based tool for the remote measure of free-living subjective appetite. Br. J. Nutr. 2023, 129, 1615–1625. [Google Scholar] [CrossRef] [PubMed]
- Hernandez-Morante, J.J.; Galindo-Munoz, J.S.; Barbera-Ortega Mdel, C. Development and validation of a smartphone application to analyze subjective appetite variables. Nutr. Hosp. 2016, 33, 126. [Google Scholar] [CrossRef] [PubMed]
- Stratton, R.J.; Stubbs, R.J.; Hughes, D.; King, N.; Blundell, J.E.; Elia, M. Comparison of the traditional paper visual analogue scale questionnaire with an Apple Newton electronic appetite rating system (EARS) in free living subjects feeding ad libitum. Eur. J. Clin. Nutr. 1998, 52, 737–741. [Google Scholar] [CrossRef]
- Almiron-Roig, E.; Green, H.; Virgili, R.; Aeschlimann, J.M.; Moser, M.; Erkner, A. Validation of a new hand-held electronic appetite rating system against the pen and paper method. Appetite 2009, 53, 465–468. [Google Scholar] [CrossRef] [PubMed]
- Zhu, Y.; Blundell, J.E.; Holschuh, N.M.; McLean, R.; Menon, R.S. Validation of a Mobile App-Based Visual Analog Scale for Appetite Measurement in the Real World: A Randomized Digital Clinical Trial. Nutrients 2023, 15, 304. [Google Scholar] [CrossRef]
- Niccoli, T.; Partridge, L. Ageing as a risk factor for disease. Curr. Biol. 2012, 22, R741–R752. [Google Scholar] [CrossRef] [PubMed]
- Jakubowicz, D.; Barnea, M.; Wainstein, J.; Froy, O. High caloric intake at breakfast vs. dinner differentially influences weight loss of overweight and obese women. Obesity 2013, 21, 2504–2512. [Google Scholar] [CrossRef]
- Bland, J.M.; Altman, D.G. Statistical methods for assessing agreement between two methods of clinical measurement. Lancet 1986, 327, 307–310. [Google Scholar] [CrossRef]
- Doucet, E.; St-Pierre, S.; Almeras, N.; Tremblay, A. Relation between appetite ratings before and after a standard meal and estimates of daily energy intake in obese and reduced obese individuals. Appetite 2003, 40, 137–143. [Google Scholar] [CrossRef] [PubMed]
- Reichenberger, J.; Richard, A.; Smyth, J.M.; Fischer, D.; Pollatos, O.; Blechert, J. It’s craving time: Time of day effects on momentary hunger and food craving in daily life. Nutrition 2018, 55–56, 15–20. [Google Scholar] [CrossRef]
- Jakubowicz, D.; Froy, O.; Wainstein, J.; Boaz, M. Meal timing and composition influence ghrelin levels, appetite scores and weight loss maintenance in overweight and obese adults. Steroids 2012, 77, 323–331. [Google Scholar] [CrossRef] [PubMed]
- Ruddick-Collins, L.C.; Morgan, P.J.; Fyfe, C.L.; Filipe, J.A.N.; Horgan, G.W.; Westerterp, K.R.; Johnston, J.D.; Johnstone, A.M. Timing of daily calorie loading affects appetite and hunger responses without changes in energy metabolism in healthy subjects with obesity. Cell Metab. 2022, 34, 1472–1485.E6. [Google Scholar] [CrossRef] [PubMed]
- Longo, V.D.; Panda, S. Fasting, Circadian Rhythms, and Time-Restricted Feeding in Healthy Lifespan. Cell Metab. 2016, 23, 1048–1059. [Google Scholar] [CrossRef] [PubMed]
- Rumbold, P.L.; Dodd-Reynolds, C.J.; Stevenson, E. Agreement between paper and pen visual analogue scales and a wristwatch-based electronic appetite rating system (PRO-Diary(c)), for continuous monitoring of free-living subjective appetite sensations in 7–10 year old children. Appetite 2013, 69, 180–185. [Google Scholar] [CrossRef] [PubMed]
- Gregersen, N.T.; Moller, B.K.; Raben, A.; Kristensen, S.T.; Holm, L.; Flint, A.; Astrup, A. Determinants of appetite ratings: The role of age, gender, BMI, physical activity, smoking habits, and diet/weight concern. Food Nutr. Res. 2011, 55, 7028. [Google Scholar] [CrossRef] [PubMed]
- Aukan, M.I.; Nymo, S.; Haagensli Ollestad, K.; Akersveen Boyesen, G.; DeBenedictis, J.N.; Rehfeld, J.F.; Coutinho, S.; Martins, C. Differences in gastrointestinal hormones and appetite ratings among obesity classes. Appetite 2022, 171, 105940. [Google Scholar] [CrossRef] [PubMed]
- Palmisano, A.; Angileri, S.; Soekeland, F.; Gazineo, D.; Godino, L.; Savini, S.; Andreoli, D.; Mancin, S. Chronic kidney disease and mobile health: Quality of renal nutritional APPs in Italy. Acta Biomed. 2023, 94, e2023169. [Google Scholar] [CrossRef]


| Free-Living Environment Study (n = 15) | Controlled Environment Study (n = 24) | Group 1 (n = 4 Female) | Group 2 (n = 5 Female) | p Value | |
|---|---|---|---|---|---|
| Age (years) | 30.3 ± 9.4 (24–63) | 38.34 ± 15.72 (24–65) | 37.25 ± 16.05 (25–64) | 40.42 ± 15.94 (24–65) | NS |
| Weight (kg) | 78.67 ± 17.11 (48–113) | 75.65 ± 15.64 (48–113) | 74.71 ± 15.22 (48–95) | 76.58 ± 16.66 (56–113) | NS |
| Height (m) | 1.74 ± 0.12 (1.58–1.93) | 1.73 ± 0.11 (1.58–1.93) | 1.72 ± 0.11 1.58–1.93) | 1.75 ± 0.12 (1.58–1.9) | NS |
| BMI(kg/m2) | 25.67 ± 3.9 (19.23–33.51) | 25.05 ± 3.37 (19.23–33.51) | 25.12 ± 2.66 (19.23–29.39) | 24.99 ± 4.09 (20.82–33.51) | NS |
| Low-Energy Breakfast (LEB) | High-Energy Breakfast (HEB) | Lunch | |
|---|---|---|---|
| Energy (kcal) | 250 | 850 | 750 |
| Carbohydrates (g) | 30 | 90 | 75 |
| Protein (g) | 19 | 60 | 46 |
| Fat (g) | 6 | 28 | 28 |
| Question | Age | ||
|---|---|---|---|
| Young Adults n = 16 | Older Adults n = 8 | All n = 24 | |
| Preferred method (%) | |||
| Pen and paper (PP) | 6.25 | 0 | 4.17 |
| Smartphone application (App) | 93.75 | 87.50 | 91.67 |
| No preference | 0 | 12.50 | 4.17 |
| Reliability of the method (%) | |||
| Pen and paper (PP) | 6.25 | 0 | 4.17 |
| Smartphone application (App) | 62.50 | 87.50 | 70.83 |
| No preference | 31.25 | 12.50 | 25.00 |
| Modernization of the method (%) | |||
| Pen and paper (PP) | 0 | 0 | 0 |
| Smartphone application (app) | 93.75 | 100.00 | 95.83 |
| No preference | 6.25 | 0 | 4.17 |
| Ease of use | |||
| Pen and paper (PP) | 6.25 | 12.50 | 8.33 |
| Smartphone application (App) | 87.50 | 87.50 | 87.50 |
| No preference | 6.25 | 0 | 4.17 |
| Percentage of Questions with Answer of “App” | |||
| Mean | 84.38 | 90.63 | 86.46 |
| Std | 25.62 | 18.60 | 23.29 |
| Min | 0.00 | 50.00 | 0.00 |
| Q1 | 75.00 | 87.50 | 75.00 |
| Median | 100.00 | 100.00 | 100.00 |
| Q3 | 100.00 | 100.00 | 100.00 |
| Max | 100.00 | 100.00 | 100.00 |
Disclaimer/Publisher’s Note: The statements, opinions and data contained in all publications are solely those of the individual author(s) and contributor(s) and not of MDPI and/or the editor(s). MDPI and/or the editor(s) disclaim responsibility for any injury to people or property resulting from any ideas, methods, instructions or products referred to in the content. |
© 2025 by the authors. Licensee MDPI, Basel, Switzerland. This article is an open access article distributed under the terms and conditions of the Creative Commons Attribution (CC BY) license (https://creativecommons.org/licenses/by/4.0/).
Share and Cite
Tsameret, S.; Froy, O. Validation of a Smartphone Application for Monitoring Circadian Appetite: A Randomized Crossover Trial in Free-Living and Controlled Settings. Nutrients 2025, 17, 384. https://doi.org/10.3390/nu17030384
Tsameret S, Froy O. Validation of a Smartphone Application for Monitoring Circadian Appetite: A Randomized Crossover Trial in Free-Living and Controlled Settings. Nutrients. 2025; 17(3):384. https://doi.org/10.3390/nu17030384
Chicago/Turabian StyleTsameret, Shani, and Oren Froy. 2025. "Validation of a Smartphone Application for Monitoring Circadian Appetite: A Randomized Crossover Trial in Free-Living and Controlled Settings" Nutrients 17, no. 3: 384. https://doi.org/10.3390/nu17030384
APA StyleTsameret, S., & Froy, O. (2025). Validation of a Smartphone Application for Monitoring Circadian Appetite: A Randomized Crossover Trial in Free-Living and Controlled Settings. Nutrients, 17(3), 384. https://doi.org/10.3390/nu17030384