
The Impact of Two Different Insulin Dose Calculation Methods on Postprandial Glycemia After a Mixed Meal in Children with Type 1 Diabetes: A Randomized Study


Abstract
1. Introduction
2. Materials and Methods
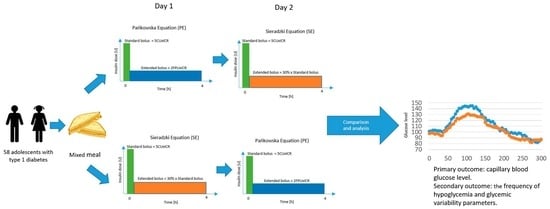
- A standard bolus covering carbohydrates, calculated as Carbohydrate Units × ICR
- An extended bolus covering fat and protein, calculated as Fat-Protein Units × ICR, delivered for four hours.
- A standard bolus covering carbohydrates, calculated as Carbohydrate Units × ICR;
- An extended bolus covering fat and protein, calculated as (30% × CU × ICR), delivered for 4 h.
Statistical Analysis
3. Results
4. Discussion
Strengths and Limitations
5. Conclusions
Author Contributions
Funding
Institutional Review Board Statement
Informed Consent Statement
Data Availability Statement
Acknowledgments
Conflicts of Interest
Abbreviations
References
- Maguolo, A.; Mazzuca, G.; Smart, C.E.; Maffeis, C. Postprandial glucose metabolism in children and adolescents with type 1 diabetes mellitus: Potential targets for improvement. Eur. J. Clin. Nutr. 2024, 78, 79–86. [Google Scholar] [CrossRef]
- Emilia, K.K.; Agnieszka, S. Czynniki wpływające na wydłużenie czasu glikemicznego w zakresie u dzieci z cukrzycą typu 1 stosujących systemy ciągłego monitorowania glikemii: Badanie przypadku i kontroli. Int. J. Diabetes Dev. Ctries. 2024, 44, 694–702. [Google Scholar] [CrossRef]
- De Bock, M.; Agwu, J.C.; Deabreu, M.; Dovc, K.; Maahs, D.M.; Marcovecchio, M.L.; Mahmud, F.H.; Nóvoa-Medina, Y.; Priyambada, L.; Smart, C.E.; et al. International Society for Pediatric and Adolescent Diabetes Clinical Practice Consensus Guidelines 2024: Glycemic Targets. Horm Res. Paediatr. 2024, 97, 546–554. [Google Scholar] [CrossRef] [PubMed] [PubMed Central]
- De Meulemeester, J.; Sara Charleer, S.; Visser, M.M.; De Block, C.; Mathieu, C.; Gillard, P. The association of chronic complications with time in tight range and time in range in people with type 1 diabetes: A retrospective cross-sectional real-world study. Diabetologia 2024, 67, 1527–1535. [Google Scholar] [CrossRef]
- Paterson, M.A.; Smart, C.E.M.; Lopez, P.E.; McElduff, P.; Attia, J.; Morbey, C.; King, B.R. Influence of dietary protein on postprandial blood glucose levels in individuals with Type 1 diabetes mellitus using intensive insulin therapy. Diabet. Med. A J. Br. Diabet. Assoc. 2016, 33, 592–598. [Google Scholar] [CrossRef] [PubMed]
- Paterson, M.A.; King, B.R.; Smart, C.E.M.; Smith, T.; Rafferty, J.; Lopez, P.E. Impact of dietary protein on postprandial glycaemic control and insulin requirements in Type 1 diabetes: A systematic review. Diabet. Med. A J. Br. Diabet. Assoc. 2019, 36, 1585–1599. [Google Scholar] [CrossRef] [PubMed]
- Furthner, D.; Lukas, A.; Schneider, A.M.; Mörwald, K.; Maruszczak, K.; Gombos, P.; Gomahr, J.; Steigleder-Schweiger, C.; Weghuber, D.; Pixner, T. The Role of Protein and Fat Intake on Insulin Therapy in Glycaemic Control of Paediatric Type 1 Diabetes: A Systematic Review and Research Gaps. Nutrients 2021, 13, 3558. [Google Scholar] [CrossRef]
- Bell, K.J.; Smart, C.E.; Steil, G.M.; Brand-Miller, J.C.; King, B.; Wolpert, H.A. Impact of fat, protein, and glycemic index on postprandial glucose control in type 1 diabetes: Implications for intensive diabetes management in the continuous glucose monitoring era. Diabetes Care 2015, 38, 1008–1015. [Google Scholar] [CrossRef]
- Abdou, M.; Hafez, M.H.; Anwar, G.M.; Fahmy, W.A.; Abd Alfattah, N.M.; Salem, R.I.; Arafa, N. Effect of high protein and fat diet on postprandial blood glucose levels in children and adolescents with type 1 diabetes in Cairo, Egypt. Diabetes Metab. Syndr. 2021, 15, 7–12. [Google Scholar] [CrossRef] [PubMed]
- Wolpert, H.A.; Atakov-Castillo, A.; Smith, S.A.; Steil, G.M. Dietary fat acutely increases glucose concentrations and insulin requirements in patients with type 1 diabetes: Implications for carbohydrate-based bolus dose calculation and intensive diabetes management. Diabetes Care 2013, 36, 810–816. [Google Scholar] [CrossRef] [PubMed] [PubMed Central]
- Piechowiak, K.; Dżygało, K.; Szypowska, A. The additional dose of insulin for high-protein mixed meal provides better glycemic control in children with type 1 diabetes on insulin pumps: Randomized cross-over study. Pediatr. Diabetes 2017, 18, 861–868. [Google Scholar] [CrossRef] [PubMed]
- Dżygało, K.; Indulska, K.; Szypowska, A. Pure-protein load for children with type 1 diabetes: Is any additional insulin needed? A randomized controlled study. Acta Diabetol. 2023, 60, 337–343. [Google Scholar] [CrossRef] [PubMed]
- Al Balwi, R.; Al Madani, W.; Al Ghamdi, A. Efficacy of insulin dosing algorithms for high-fat high-protein mixed meals to control postprandial glycemic excursions in people living with type 1 diabetes: A systematic review and meta-analysis. Pediatr. Diabetes 2022, 23, 1635–1646. [Google Scholar] [CrossRef]
- Lopez, P.E.; Smart, C.E.; PMcElduff, P.; Foskett, D.C.; DAPrice, D.A.; Paterson, M.A.; King, B.R. Optimizing the combination insulin bolus split for a high-fat, high-protein meal in children and adolescents using insulin pump therapy Randomized Controlled Trial. Diabet. Med. 2017, 34, 1380–1384. [Google Scholar] [CrossRef]
- Annan, S.F.; Higgins, L.A.; Jelleryd, E.; Hannon, T.; Rose, S.; Salis, S.; Baptista, J.; Chinchilla, P.; Marcovecchio, M.L. ISPAD Clinical Practice Consensus Guidelines 2022: Nutritional management in children and adolescents with diabetes. Pediatr. Diabetes 2022, 23, 1297–1321. [Google Scholar] [CrossRef] [PubMed]
- Pańkowska, E.; Szypowska, A.; Lipka, M.; Szpotańska, M.; Błazik, M.; Groele, L. Application of novel dual wave meal bolus and its impact on glycated hemoglobin A1c level in children with type 1 diabetes. Pediatr. Diabetes 2009, 10, 298–303. [Google Scholar] [CrossRef]
- Kordonouri, O.; Hartmann, R.; Remus, K.; Bläsig, S.; Sadeghian, E.; Danne, T. Benefit of supplementary fat plus protein counting as compared with conventional carbohydrate counting for insulin bolus calculation in children with pump therapy. Pediatr. Diabetes 2012, 13, 540–544. [Google Scholar] [CrossRef] [PubMed]
- Lopez, P.E.; Evans, M.; King, B.R.; Jones, T.W.; Bell, K.; McElduff, P.; Davis, E.A.; Smart, C.E. A randomized comparison of three prandial insulin dosing algorithms for children and adolescents with Type 1 diabetes. Diabet. Med. 2018, 35, 1440–1447. [Google Scholar] [CrossRef] [PubMed]
- Cai, Y.; Li, M.; Zhang, L.; Zhang, J.; Su, H. The effect of the modified fat-protein unit algorithm compared with that of carbohydrate counting on postprandial glucose in adults with type-1 diabetes when consuming meals with differing macronutrient compositions: A randomized crossover trial. Nutr. Metab. 2023, 20, 43. [Google Scholar] [CrossRef] [PubMed] [PubMed Central]
- Pańkowska, E.; Błazik, M.; Groele, L. Does the Fat-Protein Meal Increase Postprandial Glucose Level in Type 1 Diabetes Patients on Insulin Pump: The Conclusion of a Randomized Study. Diabetes Technol. Ther. 2012, 14, 16–22. [Google Scholar] [CrossRef]
- Błazik, M.; Pa´nkowska, E. The Effect of Bolus and Food Calculator Diabetics on Glucose Variability in Children with Type 1 Diabetes Treated with Insulin Pump: The Results of RCT. Pediatr. Diabetes 2012, 13, 534–539. [Google Scholar] [CrossRef]
- Sieradzki, J.; Wierusz-Wysocka, B. Cukrzyca Typu 1 u Dorosłych; Termedia Wydawnictwa Medyczne: Poznań, Poland, 2012; pp. 99–138. [Google Scholar]
- Abraham, M.B.; Karges, B.; Dovc, K.; Naranjo, D.; Arbelaez, A.M.; Mbogo, J.; Javelikar, G.; Jones, T.W.; Mahmud, F.H. ISPAD Clinical Practice Consensus Guidelines 2022: Assessment and management of hypoglycemia in children and adolescents with diabetes. Pediatr. Diabetes 2022, 23, 1322–1340. [Google Scholar] [CrossRef] [PubMed] [PubMed Central]
- Battelino, T.; Danne, T.; Bergenstal, R.M.; Amiel, S.A.; Beck, R.; Biester, T.; Bosi, E.; Buckingham, B.A.; Cefalu, W.T.; Close, K.L.; et al. Clinical targets for continuous glucose monitoring data interpretation: Recommendations from the international consensus on time in range. Diabetes Care 2019, 42, 1593–1603. [Google Scholar] [CrossRef]
- Danne, T.; Nimri, R.; Battelino, T.; Bergenstal, R.M.; Close, K.L.; DeVries, J.H.; Garg, S.; Heinemann, L.; Hirsch, I.; Amiel, S.A.; et al. International consensus on use of continuous glucose monitoring. Diabetes Care 2017, 40, 1631–1640. [Google Scholar] [CrossRef]
- Zalecenia kliniczne dotyczące postępowania u osób z cukrzycą—2025. Stanowisko Polskiego Towarzystwa Diabetologicznego. Curr. Top. Diabetes 2025, 5, 1–165. [Google Scholar]
- Paterson, M.A.; Smart, C.E.M.; Howley, P.; Price, D.A.; Foskett, D.C.; King, B.R. High-protein meals require 30% additional insulin to prevent delayed postprandial hyperglycaemia. Diabet. Med. 2020, 37, 1185–1191. [Google Scholar] [CrossRef] [PubMed]
- Smith, T.A.; Smart, C.E.; Fuery, M.E.J.; Howley, P.P.; Knight, B.A.; Harris, M.; King, B.R. In children and young people with type 1 diabetes using Pump therapy, an additional 40% of the insulin dose for a high-fat, high-protein breakfast improves postprandial glycaemic excursions: A cross-over trial. Diabet. Med. 2021, 38, e14511. [Google Scholar] [CrossRef] [PubMed]
- Beck, R.W.; Bergenstal, R.M.; Riddlesworth, T.D.; Kollman, C.; Li, Z.; Brown, A.S.; Close, K.L. Validation of Time in Range as an Outcome Measure for Diabetes Clinical Trials. Diabetes Care. 2019, 42, 400–405. [Google Scholar] [CrossRef] [PubMed] [PubMed Central]
- Passanisi, S.; Bombaci, B.; Papa, M.; Rollato, S.; Cuccurullo, I.; Citriniti, F.; Coccioli, S.; De Marco, R.; Fedi, L.; Gualtieri, S.; et al. Evaluation of an Automated Insulin Delivery System in the Management of Postprandial Glucose Levels During a Pediatric School Camp: The Control-IQ Potato Challenge. Diabetes Technol. Ther. 2025, 27, 704–710. [Google Scholar] [CrossRef] [PubMed]
- Biester, T.; Berget, C.; Boughton, C.; Cudizio, L.; Ekhlaspour, L.; Hilliard, M.E.; Reddy, L.; Sap Ngo Um, S.; Schoelwer, M.; Sherr, J.L.; et al. International Society for Pediatric and Adolescent Diabetes Clinical Practice Consensus Guidelines 2024: Diabetes Technologies—Insulin Delivery. Horm Res. Paediatr. 2024, 97, 636–662. [Google Scholar] [CrossRef] [PubMed] [PubMed Central]
- Scidà, G.; Corrado, A.; Abuqwider, J.; Lupoli, R.; Rainone, C.; Della Pepa, G.; Masulli, M.; Annuzzi, G.; Bozzetto, L. Postprandial Glucose Control With Different Hybrid Closed-Loop Systems According to Type of Meal in Adults With Type 1 Diabetes. J. Diabetes Sci. Technol. 2025, 19, 1331–1340. [Google Scholar] [CrossRef] [PubMed] [PubMed Central]


| Characteristic | N | N(%)/Mean ± SD/Median (Q1;Q3) |
|---|---|---|
| Sex, n (%) | 58 | |
| Female | 33 (56.9) | |
| Male | 25 (43.1) | |
| Age (years) 1 | 58 | 15.51 (13.21; 16.91) |
| Duration of disease (years) 2 | 58 | 8.9 ± 3.76 |
| BMI (kg/m2) 1 | 58 | 20.89 (19.1; 24.23) |
| BMI Z-score 2 | 58 | 0.34 ± 0.82 |
| TDD/kg (u/kg) 2 | 58 | 0.8 ± 0.23 |
| Base/kg (u/kg) 2 | 58 | 0.32 ± 0.12 |
| Base/TDD (%) 2 | 58 | 40.36 ± 9.12 |
| HbA1c (%) 1 | 58 | 8.2 (7.4; 9.3) |
| Breakfast’s ICR (u) 2 | 58 | 1.58 ± 0.52 |
| Insuin type, n (%) | 58 | |
| NovoRapid, Novo Nordisc | 23 (39.66) | |
| Liprolog, Eli Lilly | 17 (29.31) | |
| Humalog, Eli Lilly | 10 (17.24) | |
| Apidra, Sanofi | 8 (13.79) |
| PE | SE | p-Value | Statistically Significant | |
|---|---|---|---|---|
| AUC [mg/dL × min] | 5292 | 5004 | 0.2117 | N |
| TTP [min] | 105 (88.75; 151.3) | 115 (90.0; 157.5) | 0.6161 | |
| TNG [min] | 235 (151.3; 281.3) | 227.5 (108.8; 281.3) | 0.8795 | |
| MAGE [mg/dL] | 112.6 (101.4; 132.1) | 107.0 (95.9; 118.5) | 0.1727 |
Disclaimer/Publisher’s Note: The statements, opinions and data contained in all publications are solely those of the individual author(s) and contributor(s) and not of MDPI and/or the editor(s). MDPI and/or the editor(s) disclaim responsibility for any injury to people or property resulting from any ideas, methods, instructions or products referred to in the content. |
© 2025 by the authors. Licensee MDPI, Basel, Switzerland. This article is an open access article distributed under the terms and conditions of the Creative Commons Attribution (CC BY) license (https://creativecommons.org/licenses/by/4.0/).
Share and Cite
Dymińska, M.; Kowalczyk-Korcz, E.; Piechowiak, K.; Szypowska, A. The Impact of Two Different Insulin Dose Calculation Methods on Postprandial Glycemia After a Mixed Meal in Children with Type 1 Diabetes: A Randomized Study. Nutrients 2025, 17, 3287. https://doi.org/10.3390/nu17203287
Dymińska M, Kowalczyk-Korcz E, Piechowiak K, Szypowska A. The Impact of Two Different Insulin Dose Calculation Methods on Postprandial Glycemia After a Mixed Meal in Children with Type 1 Diabetes: A Randomized Study. Nutrients. 2025; 17(20):3287. https://doi.org/10.3390/nu17203287
Chicago/Turabian StyleDymińska, Magdalena, Emilia Kowalczyk-Korcz, Katarzyna Piechowiak, and Agnieszka Szypowska. 2025. "The Impact of Two Different Insulin Dose Calculation Methods on Postprandial Glycemia After a Mixed Meal in Children with Type 1 Diabetes: A Randomized Study" Nutrients 17, no. 20: 3287. https://doi.org/10.3390/nu17203287
APA StyleDymińska, M., Kowalczyk-Korcz, E., Piechowiak, K., & Szypowska, A. (2025). The Impact of Two Different Insulin Dose Calculation Methods on Postprandial Glycemia After a Mixed Meal in Children with Type 1 Diabetes: A Randomized Study. Nutrients, 17(20), 3287. https://doi.org/10.3390/nu17203287