

Overweight and Obese Children Aged 6–17 Years in China Had Lower Level of Hydration Status: A Cross-Sectional Study
 ,
,
Abstract
1. Background
2. Methods
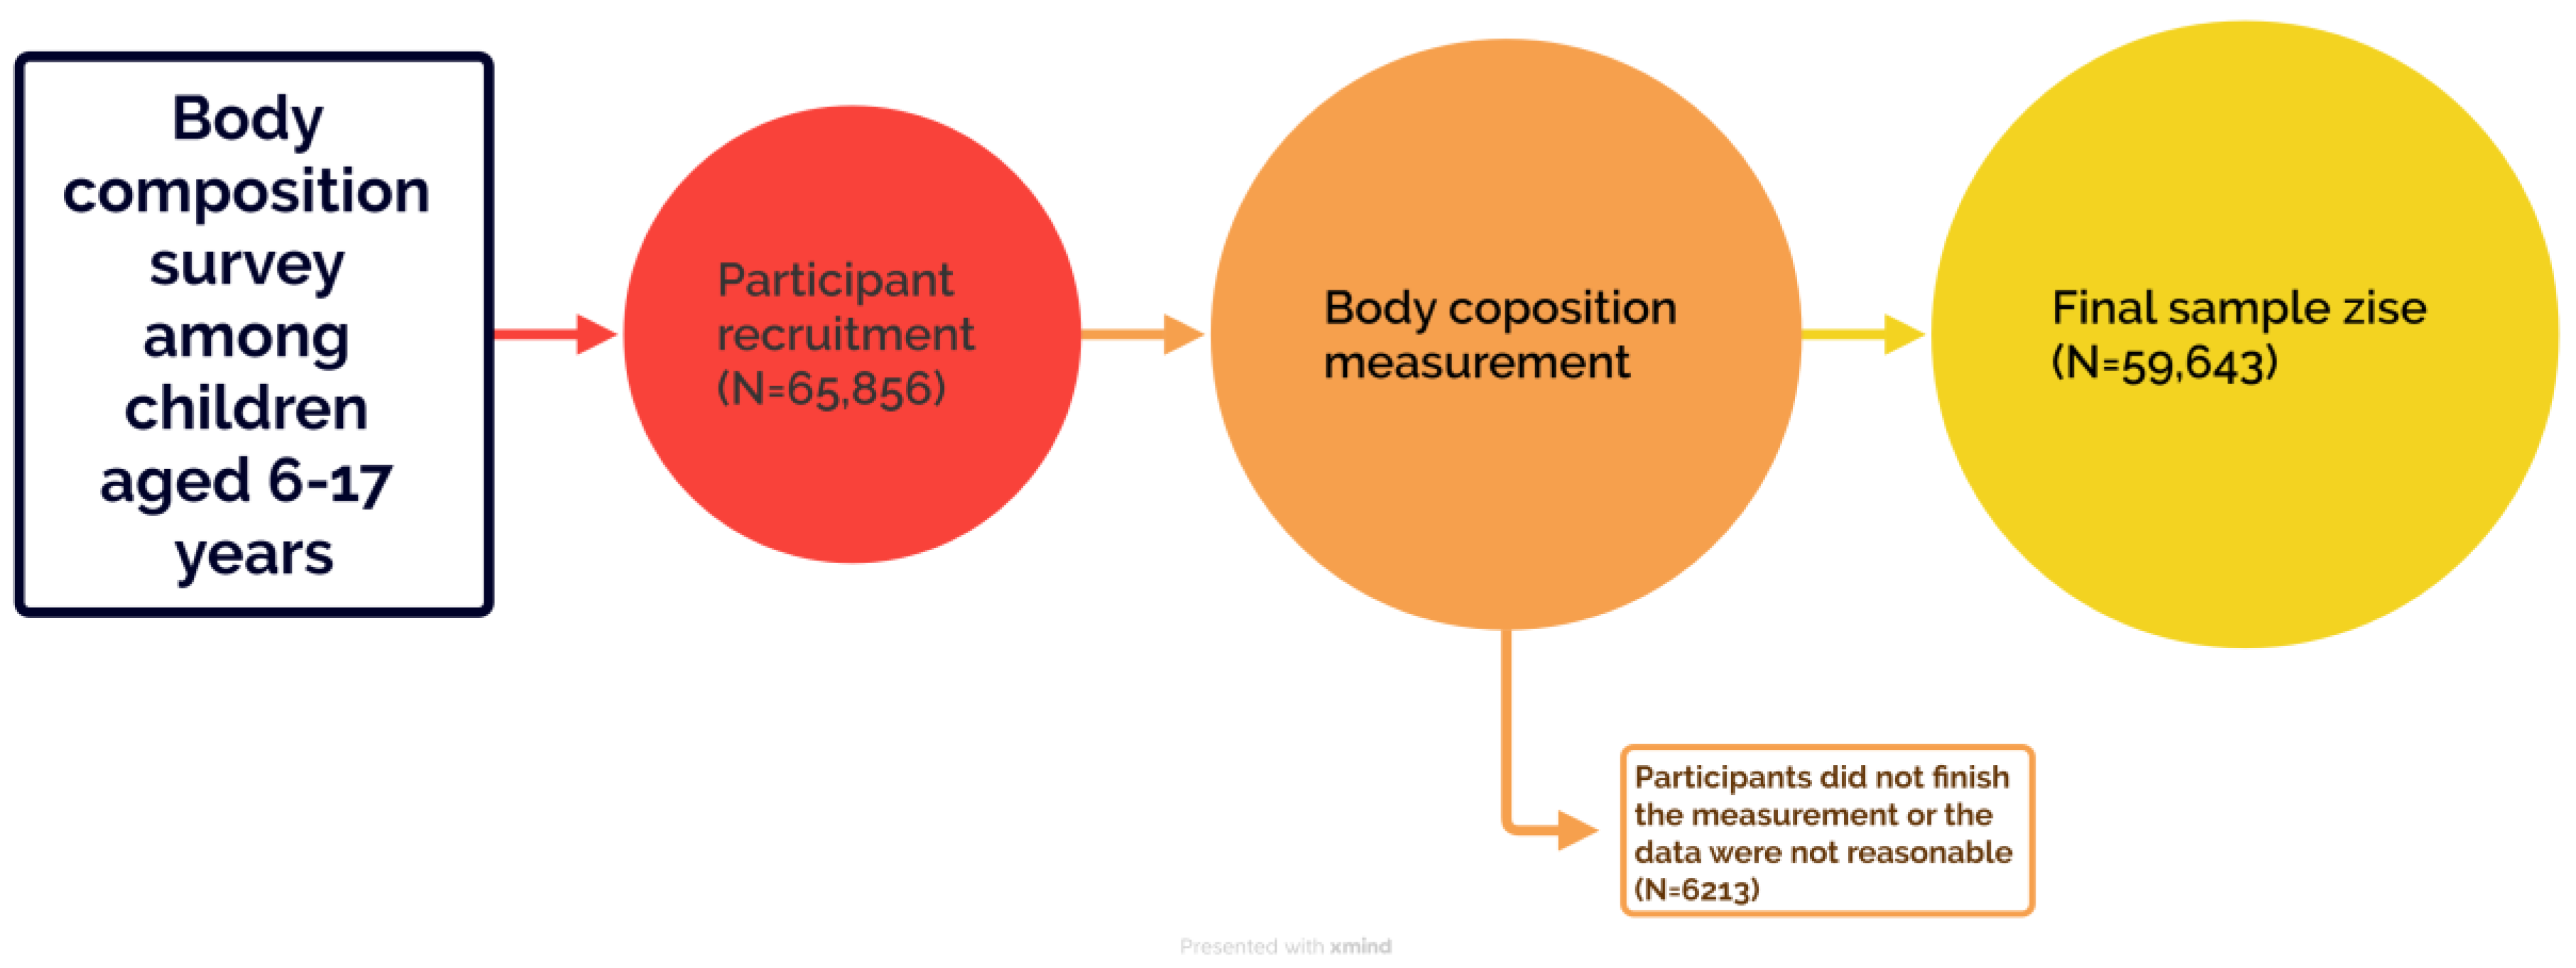
2.1. Subjects
2.2. Anthropometric Measurements
2.3. Statistics
3. Results
4. Discussion
5. Conclusions
Author Contributions
Funding
Institutional Review Board Statement
Informed Consent Statement
Data Availability Statement
Acknowledgments
Conflicts of Interest
Abbreviations
| TBW | Total body water |
| ICW | Intracellular water |
| ECW | Extracellular water |
| FFM | Fat free mass |
References
- Popkin, B.M.; D’Anci, K.E.; Rosenberg, I.H. Water, hydration, and health. Nutr. Rev. 2010, 68, 439–458. [Google Scholar] [CrossRef] [PubMed]
- Kleiner, S.M. Water: An essential but overlooked nutrient. J. Am. Diet. Assoc. 1999, 99, 200–206. [Google Scholar] [CrossRef] [PubMed]
- Jequier, E.; Constant, F. Water as an essential nutrient: The physiological basis of hydration. Eur. J. Clin. Nutr. 2010, 64, 115–123. [Google Scholar] [CrossRef] [PubMed]
- Suh, H.; Kavouras, S.A. Water intake and hydration state in children. Eur. J. Nutr. 2018, 58, 475–496. [Google Scholar] [CrossRef] [PubMed]
- Kavouras, S.A.; Bougatsas, D.; Johnson, E.C.; Arnaoutis, G.; Tsipouridi, S.; Panagiotakos, D.B. Water intake and urinary hydration biomarkers in children. Eur. J. Clin. Nutr. 2017, 71, 530–535. [Google Scholar] [CrossRef]
- Armstrong, L.; Johnson, E. Water Intake, Water Balance, and the Elusive Daily Water Requirement. Nutrients 2018, 10, 1928. [Google Scholar] [CrossRef]
- Baron, S.; Courbebaisse, M.; Lepicard, E.M.; Friedlander, G. Assessment of hydration status in a large population. Brit J. Nutr. 2015, 113, 147–158. [Google Scholar] [CrossRef] [PubMed]
- Cheuvront, S.N.; Kenefick, R.W. Dehydration: Physiology, assessment, and performance effects. Compr. Physiol. 2014, 4, 257–285. [Google Scholar] [PubMed]
- Westfall, D.R.; Logan, N.E.; Khan, N.A.; Hillman, C.H. Cognitive Assessments in Hydration Research Involving Children: Methods and Considerations. Ann. Nutr. Metab. 2019, 74, 19–24. [Google Scholar] [CrossRef]
- Papies, E.K. The Psychology of Desire and Implications for Healthy Hydration. Ann. Nutr. Metab. 2021, 76, 31–36. [Google Scholar] [CrossRef] [PubMed]
- Santillanes, G.; Rose, E. Evaluation and Management of Dehydration in Children. Emerg. Med. Clin. N. Am. 2018, 36, 259–273. [Google Scholar] [CrossRef] [PubMed]
- Chouraqui, J.P. Children’s water intake and hydration: A public health issue. Nutr. Rev. 2022, 5, 610–624. [Google Scholar] [CrossRef] [PubMed]
- Nishikawa, H.; Yoh, K.; Enomoto, H.; Ishii, N.; Iwata, Y.; Nakano, C.; Takata, R.; Nishimura, T.; Aizawa, N.; Sakai, Y.; et al. Extracellular Water to Total Body Water Ratio in Viral Liver Diseases: A Study Using Bioimpedance Analysis. Nutrients 2018, 10, 1072. [Google Scholar] [CrossRef] [PubMed]
- Horino, T.; Tokunaga, R.; Miyamoto, Y.; Akiyama, T.; Daitoku, N.; Sakamoto, Y.; Ohuchi, M.; Ogawa, K.; Yoshida, N.; Baba, H. Extracellular water to total body water ratio, a novel predictor of recurrence in patients with colorectal cancer. Ann. Gastroent. Surg. 2024, 8, 98–106. [Google Scholar] [CrossRef] [PubMed]
- Nakajima, H.; Hashimoto, Y.; Kaji, A.; Sakai, R.; Takahashi, F.; Yoshimura, Y.; Bamba, R.; Okamura, T.; Kitagawa, N.; Majima, S.; et al. Impact of extracellular-to-intracellular fluid volume ratio on albuminuria in patients with type 2 diabetes: A cross-sectional and longitudinal cohort study. J. Diabetes Investig. 2021, 12, 1202–1211. [Google Scholar] [CrossRef] [PubMed]
- Noda, Y.; Suzuki, H.; Kanai, T.; Samejima, Y.; Nasu, S.; Tanaka, A.; Morishita, N.; Okamoto, N.; Hirashima, T. The Association Between Extracellular Water-to-Total Body Water Ratio and Therapeutic Durability for Advanced Lung Cancer. Anticancer Res. 2020, 40, 3931–3937. [Google Scholar] [CrossRef] [PubMed]
- Hetherington-Rauth, M.; Baptista, F.; Sardinha, L.B. BIA-assessed cellular hydration and muscle performance in youth, adults, and older adults. Clin. Nutr. 2020, 39, 2624–2630. [Google Scholar] [CrossRef] [PubMed]
- Low, S.; Ng, T.P.; Lim, C.L.; Ang, S.F.; Moh, A.; Wang, J.; Yap, P.; Cheong, C.Y.; Goh, K.S.; Ang, K.; et al. Higher ratio of extracellular water to total body water was associated with reduced cognitive function in type 2 diabetes. J. Diabetes 2021, 13, 222–231. [Google Scholar] [CrossRef]
- Popiolek-Kalisz, J.; Szczygiel, K. Bioelectrical Impedance Analysis and Body Composition in Cardiovascular Diseases. Curr. Prob. Cardiol. 2023, 48, 101911. [Google Scholar] [CrossRef] [PubMed]
- Prior, E.; Uthaya, S.N.; Gale, C. Measuring body composition in children: Research and practice. Arch. Dis. Child. E 2023, 108, 285–289. [Google Scholar] [CrossRef]
- Campa, F.; Gobbo, L.A.; Stagi, S.; Cyrino, L.T.; Toselli, S.; Marini, E.; Coratella, G. Bioelectrical impedance analysis versus reference methods in the assessment of body composition in athletes. Eur. J. Appl. Physiol. 2022, 122, 561–589. [Google Scholar] [CrossRef] [PubMed]
- Ekingen, T.; Sob, C.; Hartmann, C.; Ruhli, F.J.; Matthes, K.L.; Staub, K.; Bender, N. Associations between hydration status, body composition, sociodemographic and lifestyle factors in the general population: A cross-sectional study. BMC Public Health 2022, 22, 900. [Google Scholar] [CrossRef] [PubMed]
- Laja García, A.; Moráis-Moreno, C.; Samaniego-Vaesken, M.; Puga, A.; Varela-Moreiras, G.; Partearroyo, T. Association between Hydration Status and Body Composition in Healthy Adolescents from Spain. Nutrients 2019, 11, 2692. [Google Scholar] [CrossRef] [PubMed]
- Zhang, N.; Zhang, J.; Du, S.; He, H.; Yan, X.; Ma, G. Association between the content of intracellular and extracellular fluid and the amount of water intake among Chinese college students. Nutr. Metab. 2019, 16, 67. [Google Scholar] [CrossRef] [PubMed]
- Ræder, H.; Kværner, A.S.; Henriksen, C.; Florholmen, G.; Henriksen, H.B.; Bøhn, S.K.; Paur, I.; Smeland, S.; Blomhoff, R. Validity of bioelectrical impedance analysis in estimation of fat-free mass in colorectal cancer patients. Clin. Nutr. 2018, 37, 292–300. [Google Scholar] [CrossRef] [PubMed]
- Reale, R.; Burke, L.M.; Cox, G.R.; Slater, G. Body composition of elite Olympic combat sport athletes. Eur. J. Sport. Sci. 2020, 20, 147–156. [Google Scholar] [CrossRef] [PubMed]
- Andreoli, A.; Garaci, F.; Cafarelli, F.P.; Guglielmi, G. Body composition in clinical practice. Eur. J. Radiol. 2016, 85, 1461–1468. [Google Scholar] [CrossRef]
- Schierbauer, J.; Gunther, S.; Haupt, S.; Zimmer, R.T.; Herz, D.; Voit, T.; Zimmermann, P.; Wachsmuth, N.B.; Aberer, F.; Moser, O. Acute Fluid Intake Impacts Assessment of Body Composition via Bioelectrical Impedance Analysis. A Randomized, Controlled Crossover Pilot Trial. Metabolites 2023, 13, 473. [Google Scholar] [CrossRef] [PubMed]
- Zhang, J.; Zhang, N.; Du, S.; Liu, S.; Ma, G. Effects of Water Restriction and Water Replenishment on the Content of Body Water with Bioelectrical Impedance among Young Adults in Baoding, China: A Randomized Controlled Trial (RCT). Nutrients 2021, 13, 553. [Google Scholar] [CrossRef]
- Yang, Z.; Zhang, Q.; Zhai, Y.; Xu, T.; Wang, Y.; Chen, B.; Tang, X.; Yuan, X.; Fang, H.; Zhu, Y.; et al. National Nutrition and Health Systematic Survey for Children 0–17 Years of Age in China. Biomed. Environ. Sci. 2021, 34, 891–899. [Google Scholar] [PubMed]
- Blue, M.; Tinsley, G.M.; Ryan, E.D.; Smith-Ryan, A.E. Validity of Body-Composition Methods across Racial and Ethnic Populations. Adv. Nutr. 2021, 12, 1854–1862. [Google Scholar] [CrossRef] [PubMed]
- WS/T 456-2014; Screening Standard for Malnutrition in School-age Children and Adolescents. National Health and Family Planning Commission of the People’s Republic of China: Beijing, China, 2014.
- WST 586-2018; Screening for Overweight and Obesity Among School-Age Children and Adolescents. National Health and Family Planning Commission of the People’s Republic of China: Beijing, China, 2018.
- Ritz, P.; Vol, S.; Berrut, G.; Tack, I.; Arnaud, M.J.; Tichet, J. Influence of gender and body composition on hydration and body water spaces. Clin. Nutr. 2008, 27, 740–746. [Google Scholar] [CrossRef] [PubMed]
- Anisko, B.; Siatkowski, I.; Wojcik, M. Body mass composition analysis as a predictor of overweight and obesity in children and adolescents. Front. Public Health 2024, 12, 1371420. [Google Scholar] [CrossRef] [PubMed]
- Gutiérrez-Marín, D.; Luque, V.; Ferré, N.; Fewtrell, M.S.; Williams, J.E.; Wells, J.C.K. Associations of age and body mass index with hydration and density of fat-free mass from 4 to 22 years. Eur. J. Clin. Nutr. 2019, 73, 1422–1430. [Google Scholar] [CrossRef] [PubMed]
- Lu, H.; Ayers, E.; Patel, P.; Mattoo, T.K. Body water percentage from childhood to old age. Kindey Res. Clin. Prac. 2023, 42, 340–348. [Google Scholar] [CrossRef]
- Chumlea, W.C.; Guo, S.S.; Zeller, C.M.; Reo, N.V.; Baumgartner, R.N.; Garry, P.J.; Wang, J.; Pierson, R.J.; Heymsfield, S.B.; Siervogel, R.M. Total body water reference values and prediction equations for adults. Kidney Int. 2001, 59, 2250–2258. [Google Scholar] [CrossRef] [PubMed]
- Kim, M.J.; Lee, S.W.; Song, J.H. Normal values of total body water in healthy Korean adults: Comparison with data from western populations. Yonsei Med. J. 2002, 43, 363–369. [Google Scholar] [CrossRef] [PubMed]
- Roman, J.S.; William, W.W. Fat and fat-free mass index references in children and young adults: Assessments along racial and ethnic lines. Am. J. Clin. Nutr. 2020, 112, 566–575. [Google Scholar]
- Jonathan, C.K.W.; Nigel, J.F.; Odile, D.; Marry, S.F.; Marinos, E.; Tim, J.C. Four-component model of body composition in children: Density and hydration of fat-free mass and comparison with simpler models1,2. Am. J. Clin. Nutr. 1999, 69, 904–912. [Google Scholar]
- Novak, L.P. Changes in total body water during adolescent growth. Hum. Biol. 1989, 3, 407–414. [Google Scholar]
- Zhao, Y.; Gong, J.; Ji, Y.; Zhao, X.; He, L.; Cai, S.; Yan, X. Cross-sectional study of characteristics of body composition of 24,845 children and adolescents aged 3–17 years in Suzhou. BMC Pediatr. 2023, 23, 358. [Google Scholar] [CrossRef]
- Waki, M.A.; Kral, J.G.; Mazariegos, M.A.; Wang, J.A.; Pierson, R.N., Jr.; Heymsfield, S.B. Relative expansion of extracellular fluid in obese vs. nonobese women. Am. J. Physiol. 1991, 2, E199–E203. [Google Scholar] [CrossRef]
- Ohashi, Y.; Joki, N.; Yamazaki, K.; Kawamura, T.; Tai, R.; Oguchi, H.; Yuasa, R.; Sakai, K. Changes in the fluid volume balance between intra- and extracellular water in a sample of Japanese adults aged 15–88 yr old: A cross-sectional study. Am. J. Physiol. Renal 2018, 314, F614–F622. [Google Scholar] [CrossRef]
- Hewitt, M.J.; Going, S.B.; Williams, D.P.; Lohman, T.G. Hydration of the fat-free body mass in children and adults: Implications for body composition assessment. Am. J. Physiol. 1993, 265, E88–E95. [Google Scholar] [CrossRef] [PubMed]
- Bandyopadhyay, S.; Puttaswamy, D.; Gabriel, M.P.; Jayakumar, J.; Finkelstein, J.L.; Selvam, S.; Kurpad, A.V.; Kuriyan, R. Estimation of Hydration and Density of Fat-Free Mass in Indian Children Using a 4-Compartment Model: Implications for the Estimation of Body Composition Using 2-Compartment Models. J. Nutr. 2023, 153, 435–442. [Google Scholar] [CrossRef] [PubMed]
- Roemmich, J.N.; Clark, P.A.; Weltman, A.; Rogol, A.D. Alterations in growth and body composition during puberty. I. Comparing multicompartment body composition models. J. Appl. Physiol. 1997, 83, 927–935. [Google Scholar] [CrossRef] [PubMed]
- Garrett, D.C.; Rae, N.; Fletcher, J.R.; Zarnke, S.; Thorson, S.; Hogan, D.B.; Fear, E.C. Engineering Approaches to Assessing Hydration Status. IEEE Rev. Biomed. Eng. 2018, 11, 233–248. [Google Scholar] [CrossRef]
- Fogelholm, M.; van Marken, L.W. Comparison of body composition methods: A literature analysis. Eur. J. Clin. Nutr. 1997, 51, 495–503. [Google Scholar] [CrossRef]
- Celik, A.; Cebeci, A.N. Evaluation of hydration status of children with obesity—A pilot study. J. Pediatr. Endocr. Met. 2021, 34, 295–300. [Google Scholar] [CrossRef]
- Maffeis, C.; Tommasi, M.; Tomasselli, F.; Spinelli, J.; Fornari, E.; Scattolo, N.; Marigliano, M.; Morandi, A. Fluid intake and hydration status in obese vs. normal weight children. Eur. J. Clin. Nutr. 2016, 70, 560–565. [Google Scholar] [CrossRef] [PubMed]
- Harbo, T.; Brincks, J.; Andersen, H. Maximal isokinetic and isometric muscle strength of major muscle groups related to age, body mass, height, and sex in 178 healthy subjects. Eur. J. Appl. Physiol. 2012, 112, 267–275. [Google Scholar] [CrossRef] [PubMed]
- Sagayama, H.; Yamada, Y.; Ichikawa, M.; Kondo, E.; Yasukata, J.; Tanabe, Y.; Higaki, Y.; Takahashi, H. Evaluation of fat-free mass hydration in athletes and non-athletes. Eur. J. Appl. Physiol. 2020, 120, 1179–1188. [Google Scholar] [CrossRef] [PubMed]
- Clayton, P.; Trak-Fellermeier, M.A.; Macchi, A.; Galvan, R.; Bursac, Z.; Huffman-Ercanli, F.; Liuzzi, J.; Palacios, C. The association between hydration status and body composition in healthy children and adolescents. J. Pediatr. Endocr. Met. 2023, 36, 470–477. [Google Scholar] [CrossRef]
- Stookey, J.D.; Kavouras, S.A.; Suh, H.; Lang, F. Underhydration Is Associated with Obesity, Chronic Diseases, and Death Within 3 to 6 Years in the U.S. Population Aged 51–70 Years. Nutrients 2020, 12, 905. [Google Scholar] [CrossRef] [PubMed]
- Jaremków, A.; Markiewicz-Górka, I.; Hajdusianek, W.; Gać, P. Relationships between Body Composition Parameters and Phase Angle as Related to Lifestyle among Young People. J. Clin. Med. 2022, 11, 80. [Google Scholar] [CrossRef]
- Haroun, D.; Wells, J.C.; Williams, J.E.; Fuller, N.J.; Fewtrell, M.S.; Lawson, M.S. Composition of the fat-free mass in obese and nonobese children: Matched case–control analyses. Int. J. Obesity 2005, 19, 29–36. [Google Scholar] [CrossRef] [PubMed]


| Total (n = 59,643) | Boys (n = 30,103) | Girls (n = 29,540) | |
|---|---|---|---|
| Age (y) | 11.6 ± 3.4 | 11.6 ± 3.4 | 11.6 ± 3.4 |
| Height (cm) | 149.1 ± 17.5 | 151.2 ± 19.1 | 146.9 ± 15.4 |
| Weight (kg) | 44.4 ± 17.4 | 46.7 ± 19.1 | 42.4 ± 14.9 |
| BMI (Kg/m2) | 19.3 ± 4.7 | 19.5 ± 4.8 | 19.0 ± 4.4 |
| Total | Age 6–8 Years | Age 9–11 Years | Age 12–14 Years | Age 15–17 Years | p | |
|---|---|---|---|---|---|---|
| Boys (n) | 30,103 | 7271 | 7580 | 7449 | 7803 | |
| TBW (kg) | 24.9 (17.5, 34.7) | 15.4 (13.9, 17.3) *†abc | 20.3 (17.9, 23.4) †de | 30.8 (26.2, 35.3) †f | 37.2 (33.6, 41.1) † | <0.001 |
| ICW (kg) | 15.3 (10.7, 21.5) | 9.5 (8.5, 10.7) *†abc | 12.5 (11.0, 14.4) †de | 19.0 (16.1, 21.8) †f | 23.3 (20.9, 25.6) † | <0.001 |
| ECW (kg) | 9.6 (6.7, 13.2) | 5.9 (5.3, 6.6) *†abc | 7.8 (6.9, 9.0) †de | 11.8 (10.1, 13.5) †f | 14.0 (12.7, 15.5) † | <0.001 |
| FFM (kg) | 33.9 (23.9, 47.3) | 21.1 (18.9, 23.6) *†abc | 27.8 (24.5, 31.9) †de | 41.9 (35.7, 48.1) †f | 50.8 (45.9, 56.2) † | <0.001 |
| TBW/BW (%) | 57.9 ± 6.7 | 58.4 ± 6.3 *†abc | 55.4 ± 7.0 †de | 58.7 ± 6.7 †f | 59.1 ± 5.9 † | <0.001 |
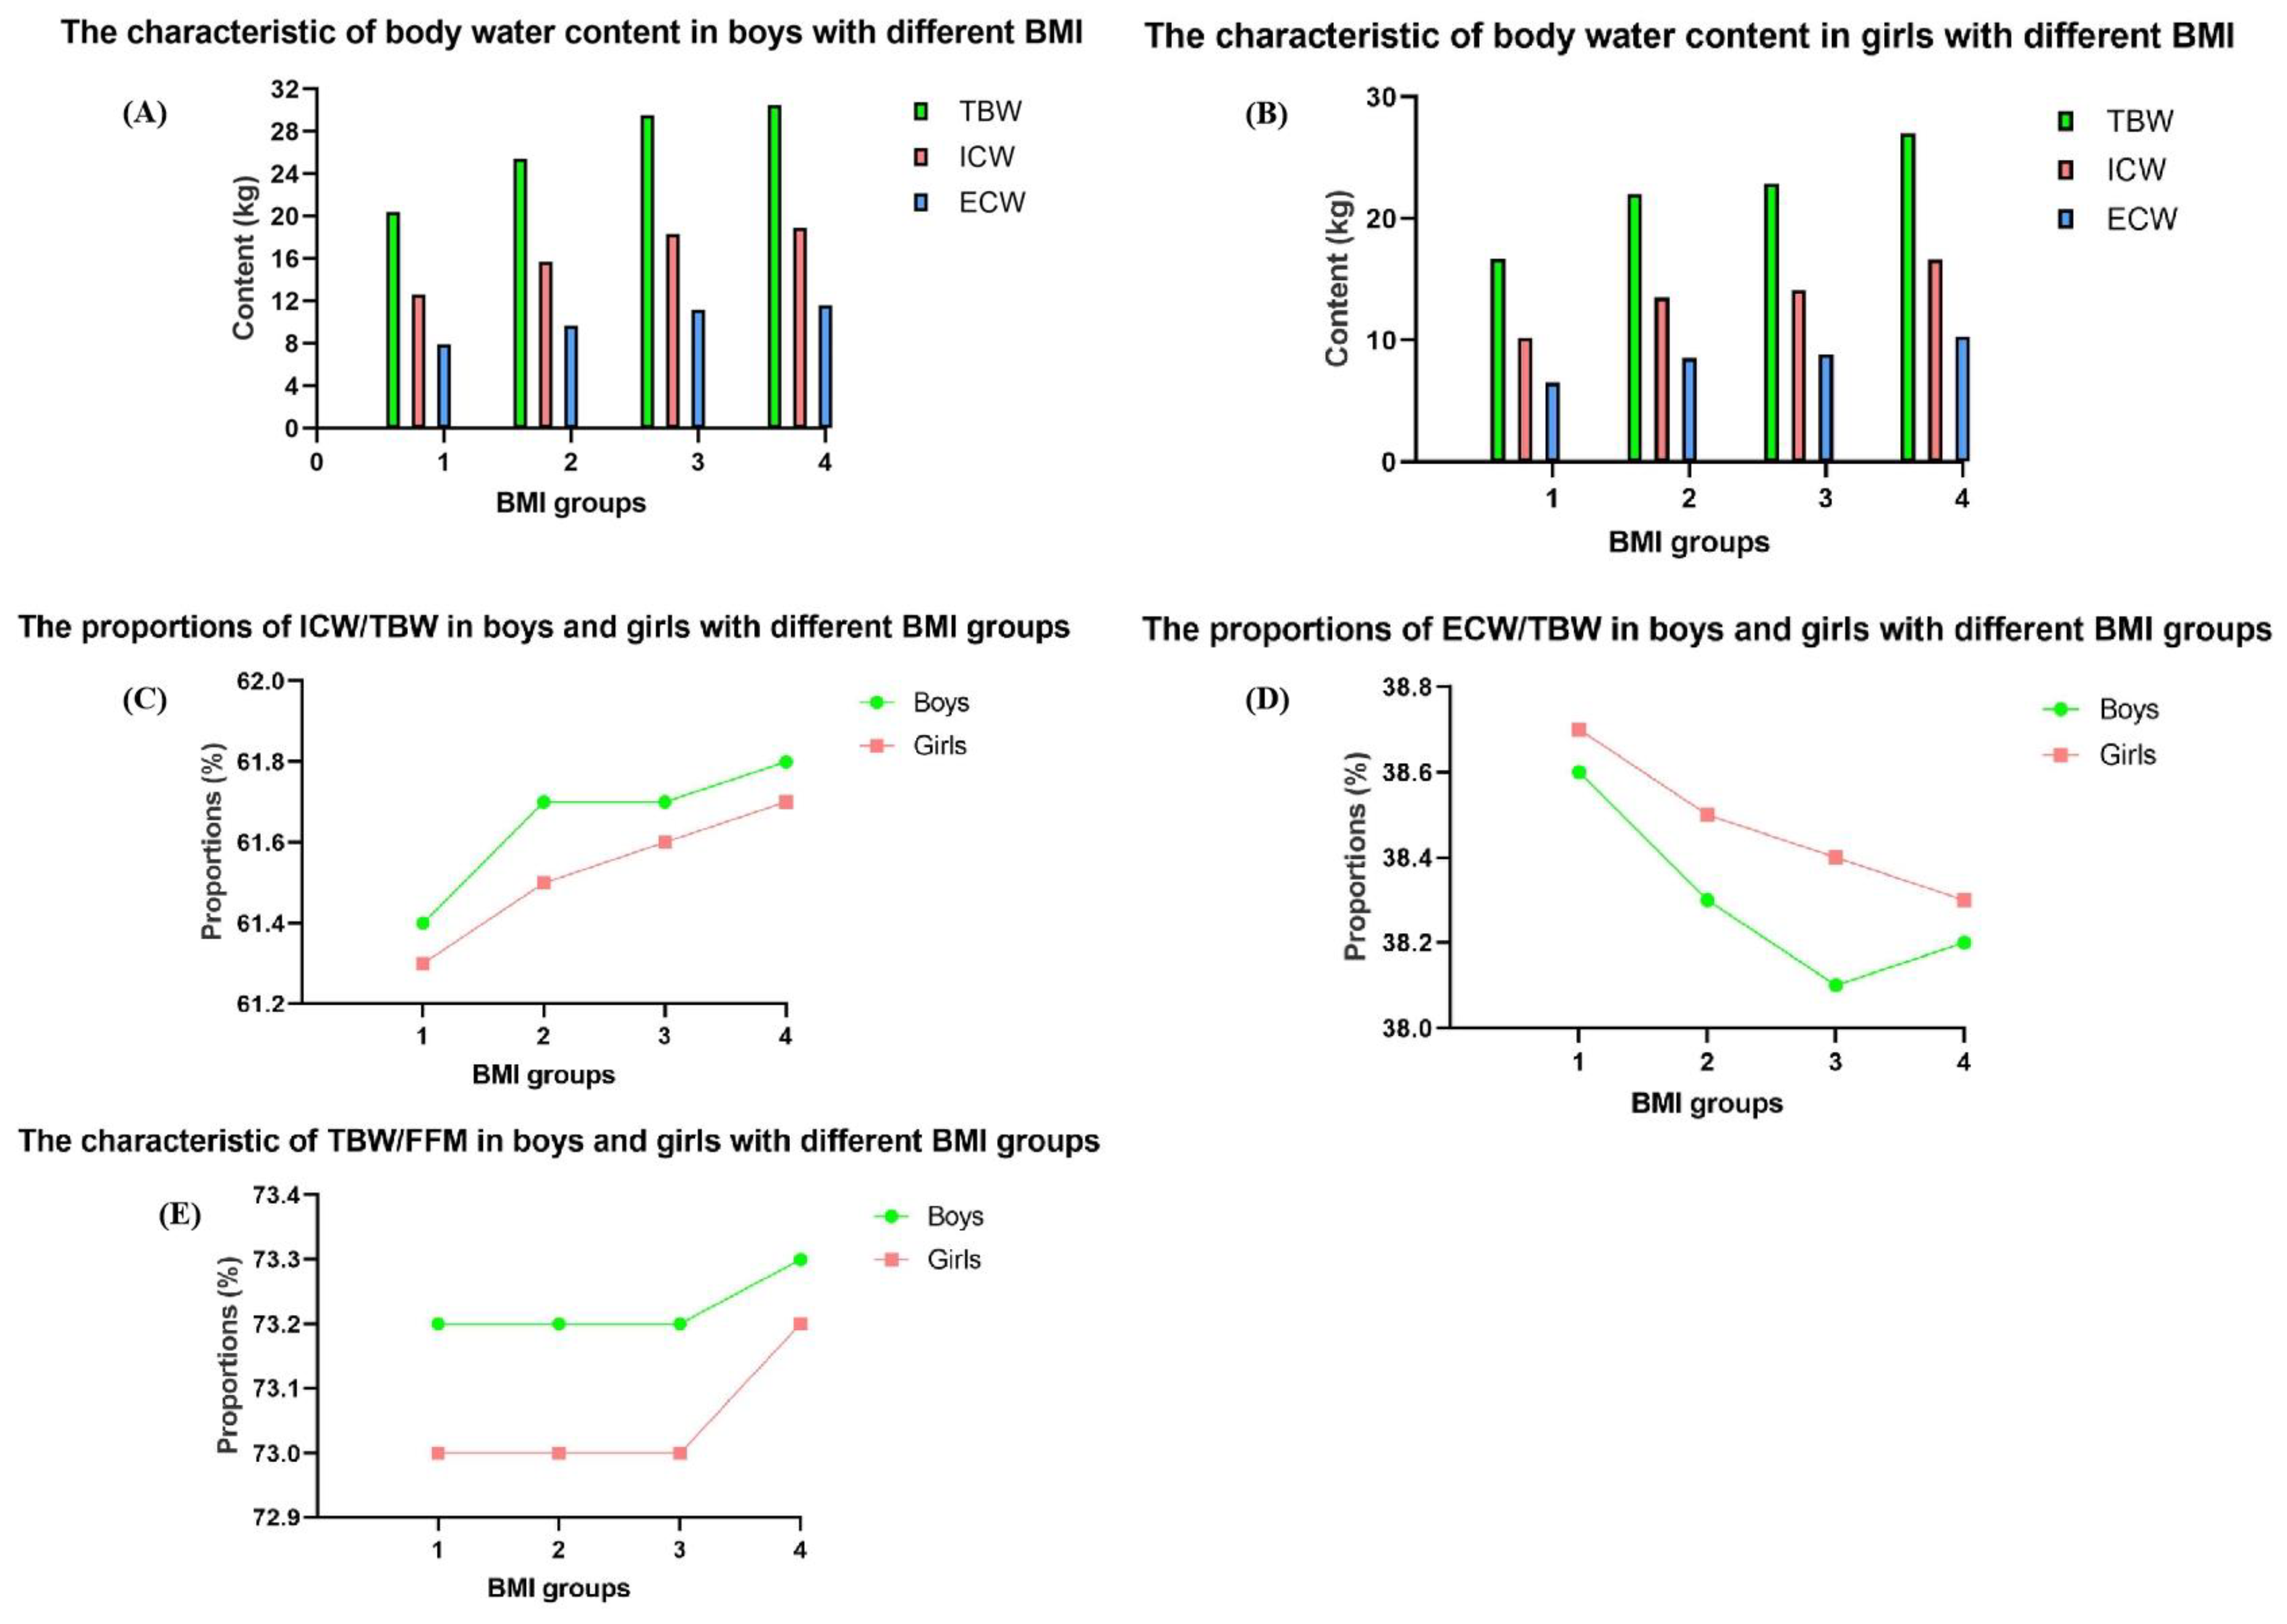
| ICW/TBW (%) | 61.7 ± 6.5 | 61.5 ± 6.5 *†abc | 61.5 ± 4.9 †de | 61.6 ± 6.0 †f | 62.2 ± 6.0 † | <0.001 |
| ECW/TBW (%) | 38.3 ± 6.3 | 38.4 ± 5.8 *†abc | 38.5 ± 4.9 †de | 38.4 ± 6.0 †f | 37.8 ± 6.0 † | <0.001 |
| ECW/ICW (%) | 62.0 ± 1.6 | 62.5 ± 1.3 *†abc | 62.6 ± 1.3 †de | 62.3 ± 1.6 †f | 60.8 ± 1.6 † | <0.001 |
| TBW/FFM (%) | 73.2 ± 5.3 | 73.2 ± 6.3 *†abc | 73.2 ± 7.6 †de | 73.3 ± 2.9 †f | 73.2 ± 2.9 † | <0.001 |
| Girls (n) | 29,540 | 4731 | 9948 | 7306 | 7555 | |
| TBW (kg) | 23.1 (16.5, 27.0) | 13.7 (12.5, 15.1) #abc | 18.8 (16.1, 22.3) de | 25.6 (23.4, 28.1) f | 27.3 (25.2, 29.8) | <0.001 |
| ICW (kg) | 14.2 (10.2, 16.7) | 8.4 (7.7, 9.3) #abc | 11.5 (9.9, 13.6) de | 15.7 (14.4, 17.3) f | 16.9 (15.6, 18.4) | <0.001 |
| ECW (kg) | 8.9 (6.4, 10.4) | 5.3 (4.8, 5.8) #abc | 7.3 (6.2, 8.6) de | 9.8 (9.0, 10.8) f | 10.5 (9.7, 11.4) | <0.001 |
| FFM (kg) | 31.6 (22.6, 37.0) | 18.8 (17.2, 20.6) #abc | 25.7 (22.1, 30.5) de | 35.0 (32.1, 38.4) f | 37.4 (34.6, 40.7) | <0.001 |
| TBW/BW (%) | 54.3 ± 6.0 | 58.5 ± 5.5 #abc | 56.0 ± 5.8 de | 52.9 ± 5.3 f | 50.8 ± 4.8 | <0.001 |
| ICW/TBW (%) | 61.5 ± 6.3 | 61.5 ± 8.8 #ac | 61.3 ± 5.4 de | 61.5 ± 5.4 f | 61.7 ± 5.4 | <0.001 |
| ECW/TBW (%) | 38.5 ± 5.7 | 38.5 ± 6.6 #abc | 38.7 ± 5.2 de | 38.5 ± 5.4 f | 38.3 ± 5.4 | <0.001 |
| ECW/ICW (%) | 62.6 ± 1.4 | 62.6 ± 1.3 #ac | 63.0 ± 1.3 de | 62.5 ± 1.4 f | 62.0 ± 1.4 | <0.001 |
| TBW/FFM (%) | 70.0 ± 4.8 | 73.0 ± 8.4 #abc | 73.0 ± 5.1 de | 73.0 ± 2.6 f | 73.1 ± 2.6 | <0.001 |
| Underweight | Normal Weight | Overweight and Obese | |||||||||||||
|---|---|---|---|---|---|---|---|---|---|---|---|---|---|---|---|
| Total | Age 6–8 Years | Age 9–11 Years | Age 12–14 Years | Age 15–17 Years | Total | Age 6–8 Years | Age 9–11 Years | Age 12–14 Years | Age 15–17 Years | Total | Age 6–8 Years | Age 9–11 Years | Age 12–14 Years | Age 15–17 Years | |
| Boys (n) | 2417 | 482 | 556 | 610 | 769 | 15,163 | 4513 | 4371 | 4633 | 1646 | 7442 | 2276 | 2653 | 2206 | 307 |
| TBW (kg) | 18.1 (14.2, 27.3) | 13.5 (12.5, 14.6) *gh | 16.9 (15.3, 18.3) gh | 22.1 (19.1, 26.4) gh | 29.5 (13.8, 32.8) gh | 20.5 (16.1, 30.1) | 14.8 (13.5, 16.2) *l | 19.2 (17.4, 21.5) l | 29.8 (25.8, 33.5) l | 35.2 (32.8, 38.0) l | 24.4 (19.4, 33.6) | 17.6 (15.8, 20.1) * | 23.4 (21.0, 26.7) | 35.8 (31.0, 40.2) | 39.8 (37.4, 42.5) |
| ICW (kg) | 11.1 (8.7, 16.8) | 8.3 (7.7, 9.0) *gh | 10.3 (9.4, 11.3) gh | 13.6 (11.7, 16.2) gh | 18.3 (8.5, 20.3) gh | 12.6 (9.9, 18.6) | 9.1 (8.3, 10.0) *l | 11.8 (10.7, 13.2) l | 18.4 (15.9, 20.7) l | 21.8 (20.3, 23.7) l | 15.0 (11.9, 20.7) | 10.9 (9.7, 12.4) * | 14.4 (12.9, 16.4) | 22.1 (19.1, 24.8) | 24.9 (23.3, 26.4) |
| ECW (kg) | 7.0 (5.5, 10.5) | 5.2 (4.8, 5.6) *gh | 6.5 (5.9, 7.1) gh | 8.6 (7.4, 10.3) gh | 11.3 (5.3, 12.5) gh | 7.9 (6.2, 11.5) | 5.7 (5.2, 6.2) *l | 7.4 (6.7, 8.3) l | 11.5 (10.0, 12.8) l | 13.3 (12.4, 14.4) l | 9.4 (7.4, 12.9) | 6.7 (6.1, 7.7) * | 9.0 (8.0, 10.3) | 13.6 (11.9, 15.2) | 15.0 (14.0, 16.0) |
| FFM (kg) | 24.7 (19.5, 37.2) | 18.5 (17.2, 20.1) *gh | 23.1 (21.0, 25.2) gh | 30.2 (26.1, 35.9) gh | 40.2 (18.8, 44.6) gh | 28.1 (22.0, 41.1) | 20.3 (18.5, 22.2) *l | 26.3 (23.8, 29.3) l | 40.6 (35.3, 45.7) l | 48.0 (44.8, 51.8) l | 33.3 (26.4, 45.9) | 24.0 (21.5, 27.4) * | 32.0 (28.6, 36.4) | 48.8 (42.4, 54.9) | 54.5 (51.2, 58.0) |
| TBW/BW (%) | 64.0 ± 3.2 | 65.2 ± 2.7 *gh | 63.5 ± 2.9 gh | 64.0 ± 3.4 gh | 63.6 ± 3.4 gh | 60.7 ± 4.0 | 61.1 ± 3.4 *l | 58.9 ± 4.1 l | 61.6 ± 4.2 l | 61.9 ± 3.5 l | 50.3 ± 5.5 | 51.4 ± 5.5 * | 48.0 ± 4.8 | 51.1 ± 5.5 | 56.2 ± 3.6 |
| ICW/TBW (%) | 61.4 ± 0.6 | 61.4 ± 0.6 *gh | 61.3 ± 0.5 gh | 61.3 ± 0.6 gh | 61.7 ± 0.6 gh | 61.6 ± 6.1 | 61.5 ± 0.7 *l | 61.5 ± 0.5 l | 61.6 ± 0.6 l | 62.1 ± 0.6 l | 61.7 ± 0.6 | 61.6 ± 0.5 * | 61.6 ± 0.5 | 61.8 ± 0.6 | 62.3 ± 0.6 |
| ECW/TBW (%) | 38.6 ± 0.6 | 38.6 ± 0.5 *gh | 38.7 ± 0.5 gh | 38.7 ± 0.6 gh | 38.3 ± 0.6 gh | 38.4 ± 5.8 | 38.5 ± 0.6 *l | 38.6 ± 0.5 | 38.4 ± 0.6 l | 37.9 ± 0.6 l | 38.3 ± 0.6 | 38.4 ± 0.5 * | 38.4 ± 0.5 | 38.2 ± 0.6 | 37.7 ± 0.6 |
| ECW/ICW (%) | 62.8 ± 1.5 | 62.9 ± 1.4 *gh | 63.2 ± 1.3 gh | 63.2 ± 1.5 gh | 62.2 ± 1.5 gh | 62.4 ± 1.5 | 62.6 ± 1.3 *l | 62.7 ± 1.3 l | 62.4 ± 1.5 l | 61.1 ± 1.5 l | 62.1 ± 1.4 | 62.2 ± 1.3 * | 62.3 ± 1.3 | 61.9 ± 1.6 | 60.5 ± 1.5 |
| TBW/FFM (%) | 73.2 ± 0.5 | 72.9 ± 0.5 *gh | 72.9 ± 0.3 gh | 73.3 ± 0.4 gh | 73.5 ± 0.5 gh | 73.2 ± 4.6 | 73.2 ± 0.7 *l | 73.1 ± 0.3 l | 73.3 ± 0.3 l | 73.3 ± 0.2 l | 73.3 ± 0.8 | 73.4 ± 0.4 * | 73.3 ± 1.1 | 73.2 ± 0.3 | 73.1 ± 0.2 |
| Girls (n) | 1650 | 285 | 614 | 288 | 463 | 20,375 | 3952 | 5482 | 5505 | 5436 | 4229 | 494 | 1113 | 966 | 1656 |
| TBW (kg) | 15.3 (12.9, 20.5) | 12.3 (11.5, 13.1) #gh | 14.9 (13.6, 16.7) gh | 19.9 (17.2, 22.0) gh | 21.8 (11.7, 24.5) gh | 23.1 (16.9, 26.4) | 13.6 (12.5, 14.7) #l | 19.3 (17.1, 22.0) l | 25.1 (23.1, 27.0) l | 26.8 (25.1, 28.7) l | 28.9 (24.7, 31.9) | 17.0 (15.4, 20.0) # | 24.4 (20.6, 28.2) | 30.4 (28.1, 32.9) | 30.8 (28.5, 33.1) |
| ICW (kg) | 9.4 (7.9, 12.5) | 7.5 (7.1, 8.1) #gh | 9.1 (8.4, 10.2) gh | 12.2 (10.5, 13.5) gh | 13.4 (7.3, 15.1) gh | 14.2 (10.4, 16.2) | 8.3 (7.7, 9.1) #l | 11.9 (10.5, 13.5) l | 15.4 (14.2, 16.6) l | 16.6 (15.5, 17.7) l | 17.8 (15.2, 19.7) | 10.5 (9.5, 12.3) # | 15.0 (12.7, 17.3) | 18.8 (17.4, 20.3) | 19.0 (17.6, 20.5) |
| ECW (kg) | 5.9 (5.0, 7.9) | 4.8 (4.4, 5.1) #gh | 5.8 (5.3, 6.5) gh | 7.7 (6.7, 8.6) gh | 8.5 (4.5, 9.4) gh | 8.9 (6.5, 10.1) | 5.2 (4.8, 5.7) #l | 7.5 (6.6, 8.5) l | 9.6 (8.9, 10.4) l | 10.3 (9.6, 11.0) l | 11.0 (9.4, 12.2) | 6.5 (5.9, 7.7) # | 9.4 (7.9, 10.9) | 11.6 (10.8, 12.6) | 11.7 (10.9, 12.6) |
| FFM (kg) | 21.0 (17.7, 27.9) | 16.9 (15.8, 18.0) #gh | 20.5 (18.8,22.9) gh | 27.2 (23.5, 30.1) gh | 29.9 (16.0, 33.5) gh | 31.7 (23.2, 36.1) | 18.6 (17.2, 20.2) #l | 26.5 (23.5, 30.1) l | 34.3 (31.7, 36.9) l | 36.7 (34.3, 39.3) l | 39.5 (33.7, 43.7) | 23.3 (21.0, 27.2) # | 33.4 (28.2, 38.5) | 41.6 (38.5, 45.0) | 42.1 (39.0, 45.2) |
| TBW/BW (%) | 61.8 ± 4.0 | 65.0 ± 2.9 #gh | 62.8 ± 3.2 gh | 61.2 ± 3.3 gh | 58.7 ± 3.8 gh | 55.5 ± 4.7 | 59.2 ± 4.1 #l | 57.5 ± 4.0 l | 54.3 ± 4.0 l | 51.9 ± 3.4 l | 45.9 ± 4.0 | 48.6 ± 5.0 # | 46.4 ± 4.3 | 45.1 ± 3.3 | 45.2 ± 3.5 |
| ICW/TBW (%) | 61.3 ± 0.6 | 61.3 ± 1.0 #gh | 61.2 ± 0.5 gh | 61.1 ± 0.5 gh | 61.4 ± 0.6 gh | 61.5 ± 0.6 | 61.5 ± 0.9 #l | 61.3 ± 0.5 l | 61.5 ± 0.5 l | 61.7 ± 0.5 l | 61.7 ± 0.6 | 61.7 ± 0.5 # | 61.5 ± 0.6 | 61.8 ± 0.5 | 61.9 ± 0.5 |
| ECW/TBW (%) | 38.7 ± 0.6 | 38.6 ± 0.7 #gh | 38.8 ± 0.5 gh | 38.9 ± 0.5 gh | 38.6 ± 0.6 gh | 38.5 ± 0.6 | 38.5 ± 0.7 #l | 38.7 ± 0.5 l | 38.5 ± 0.5 l | 38.3 ± 0.5 l | 38.3 ± 0.6 | 38.4 ± 0.5 # | 38.5 ± 0.6 | 38.2 ± 0.5 | 38.1 ± 0.5 |
| ECW/ICW (%) | 63.2 ± 1.4 | 62.9 ± 1.4 #gh | 63.5 ± 1.4 gh | 63.6 ± 1.3 gh | 62.9 ± 1.5 gh | 62.6 ± 1.4 | 62.6 ± 1.3 #l | 63.2 ± 1.3 l | 62.6 ± 1.4 l | 62.0 ± 1.4 l | 62.0 ± 1.4 | 62.2 ± 1.2 # | 62.3 ± 1.3 | 61.9 ± 1.4 | 61.6 ± 1.4 |
| TBW/FFM (%) | 73.0 ± 0.7 | 72.9 ± 1.1 #gh | 72.8 ± 0.4 gh | 73.0 ± 0.3 gh | 73.3 ± 0.5 gh | 73.0 ± 0.5 | 73.0 ± 0.8 #l | 73.0 ± 0.5 l | 73.0 ± 0.3 l | 73.0 ± 0.2 l | 73.2 ± 0.3 | 73.4 ± 0.4 # | 73.3 ± 0.3 | 73.1 ± 0.2 | 73.1 ± 0.2 |
Disclaimer/Publisher’s Note: The statements, opinions and data contained in all publications are solely those of the individual author(s) and contributor(s) and not of MDPI and/or the editor(s). MDPI and/or the editor(s) disclaim responsibility for any injury to people or property resulting from any ideas, methods, instructions or products referred to in the content. |
© 2025 by the authors. Licensee MDPI, Basel, Switzerland. This article is an open access article distributed under the terms and conditions of the Creative Commons Attribution (CC BY) license (https://creativecommons.org/licenses/by/4.0/).
Share and Cite
Zhang, J.; Cao, W.; Xu, J.; Wang, H.; Luo, R.; Gan, Q.; Yang, T.; Pan, H.; Yang, Z.; Zhao, W.; et al. Overweight and Obese Children Aged 6–17 Years in China Had Lower Level of Hydration Status: A Cross-Sectional Study. Nutrients 2025, 17, 364. https://doi.org/10.3390/nu17020364
Zhang J, Cao W, Xu J, Wang H, Luo R, Gan Q, Yang T, Pan H, Yang Z, Zhao W, et al. Overweight and Obese Children Aged 6–17 Years in China Had Lower Level of Hydration Status: A Cross-Sectional Study. Nutrients. 2025; 17(2):364. https://doi.org/10.3390/nu17020364
Chicago/Turabian StyleZhang, Jianfen, Wei Cao, Juan Xu, Hongliang Wang, Ruihe Luo, Qian Gan, Titi Yang, Hui Pan, Zhenyu Yang, Wenhua Zhao, and et al. 2025. "Overweight and Obese Children Aged 6–17 Years in China Had Lower Level of Hydration Status: A Cross-Sectional Study" Nutrients 17, no. 2: 364. https://doi.org/10.3390/nu17020364
APA StyleZhang, J., Cao, W., Xu, J., Wang, H., Luo, R., Gan, Q., Yang, T., Pan, H., Yang, Z., Zhao, W., & Zhang, Q. (2025). Overweight and Obese Children Aged 6–17 Years in China Had Lower Level of Hydration Status: A Cross-Sectional Study. Nutrients, 17(2), 364. https://doi.org/10.3390/nu17020364