
Impact of the Healthy Lifestyle Community Program (HLCP-3) on Trimethylamine N-Oxide (TMAO) and Risk Profile Parameters Related to Lifestyle Diseases During the Six Months Following an Intervention Study

 , ,
, ,
Abstract
1. Introduction
2. Materials and Methods
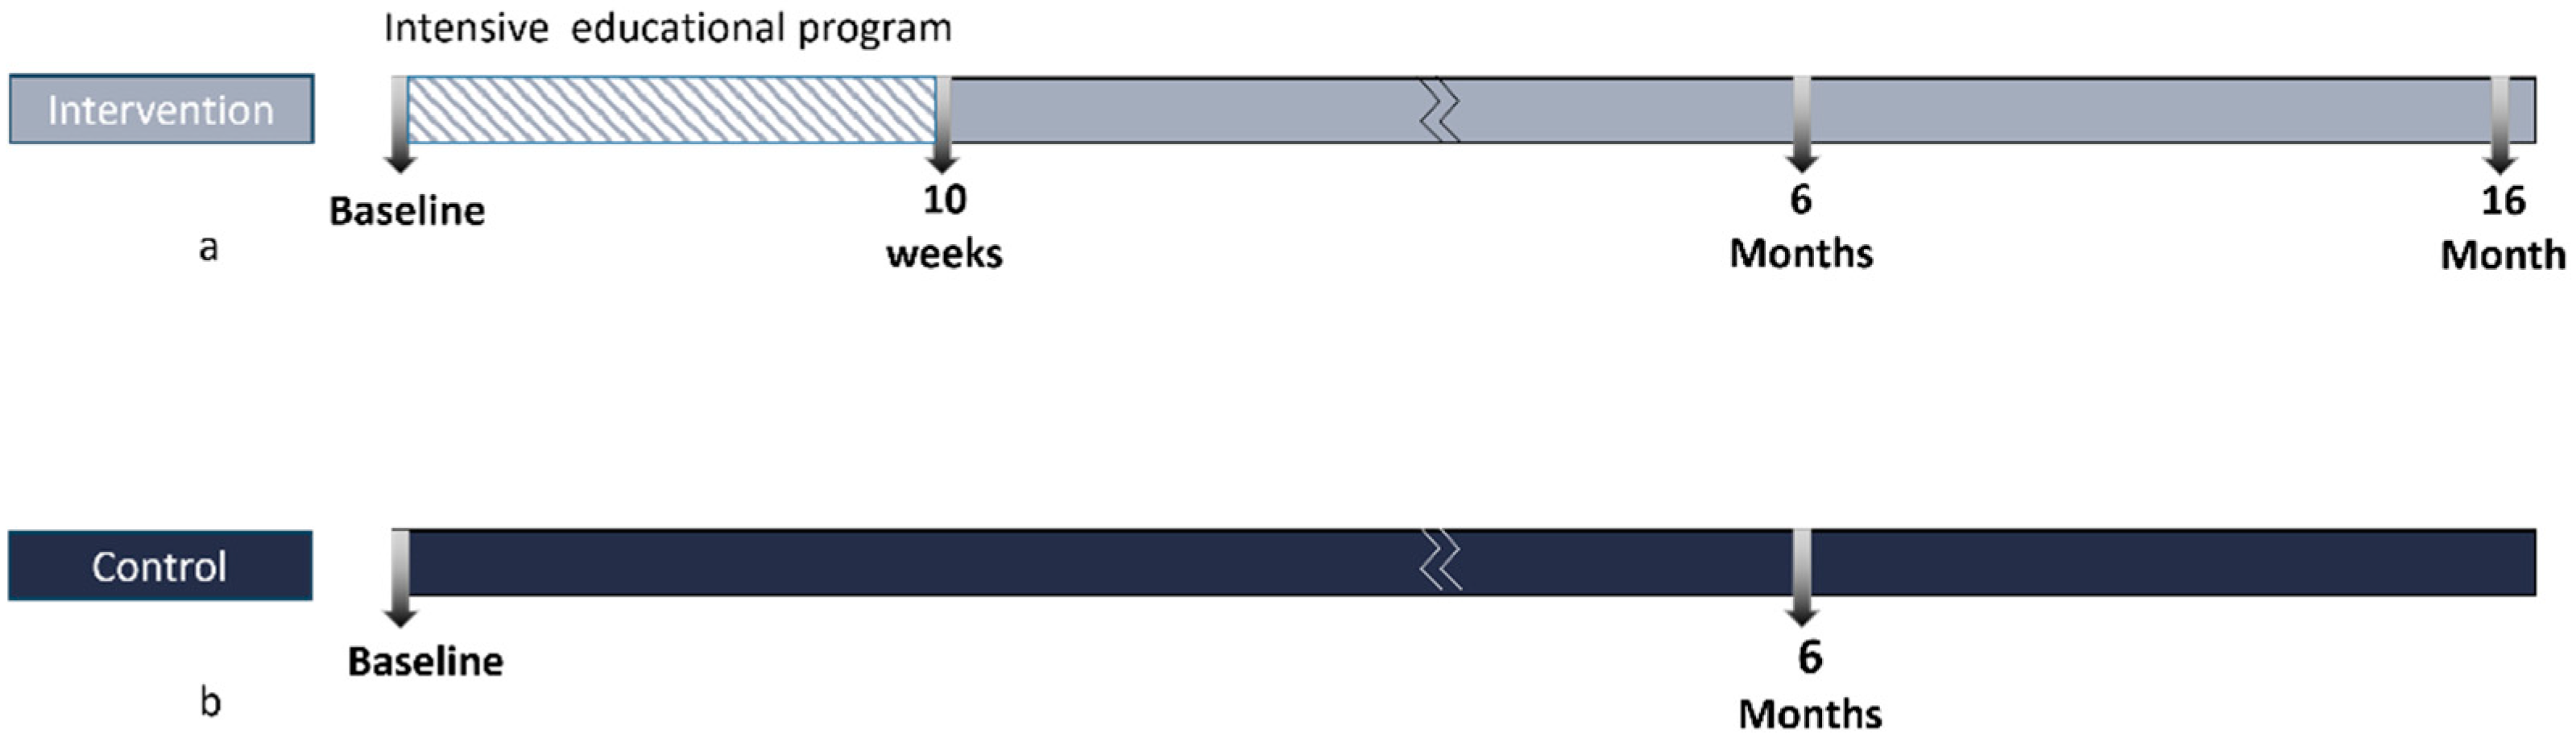
2.1. Study Design
2.2. Participants
2.3. Intervention
2.4. Assessment of Parameters
Methods for Assessing Adherence to Plant-Based Dietary Patterns
2.5. Statistical Analysis
3. Results
3.1. Baseline Characteristics
3.2. Six-Month Follow-Up from Baseline: Comparison Between the Control Group and the Intervention Group
Comparison of Dietary Scores Between the Intervention and Control Groups After Six Months

| Parameters | Group | n | Baseline | Six Months | n | Changes t0 to t2 | p WG § Group Effect | p BG # Time Effect | p BG # Interaction Effect (Multivariable-Adjusted) |
|---|---|---|---|---|---|---|---|---|---|
| Body weight, kg | IN | 99 | 80.7 ± 15.1 | 77.9 ± 15.1 | 99 | −2.8 (−3.49, −2.11) | 0.000 a | 0.112 c | 0.000 d |
| Con | 48 | 84.1 ± 17.3 | 83.9 ± 16.8 | 47 | −0.18 (−1.09, 0.73) | 0.698 b | |||
| BMI, kg/m | IN | 99 | 27 ± 4.5 | 26 ± 4.5 | 97 | −0.98(−0.97, −0.99) | 0.000 a | 0.057 c | 0.000 d |
| Con | 48 | 28.2 ± 5.6 | 28.1 ± 5.7 | 47 | −0.5 (−1.51–0.51) | 0.320 a | |||
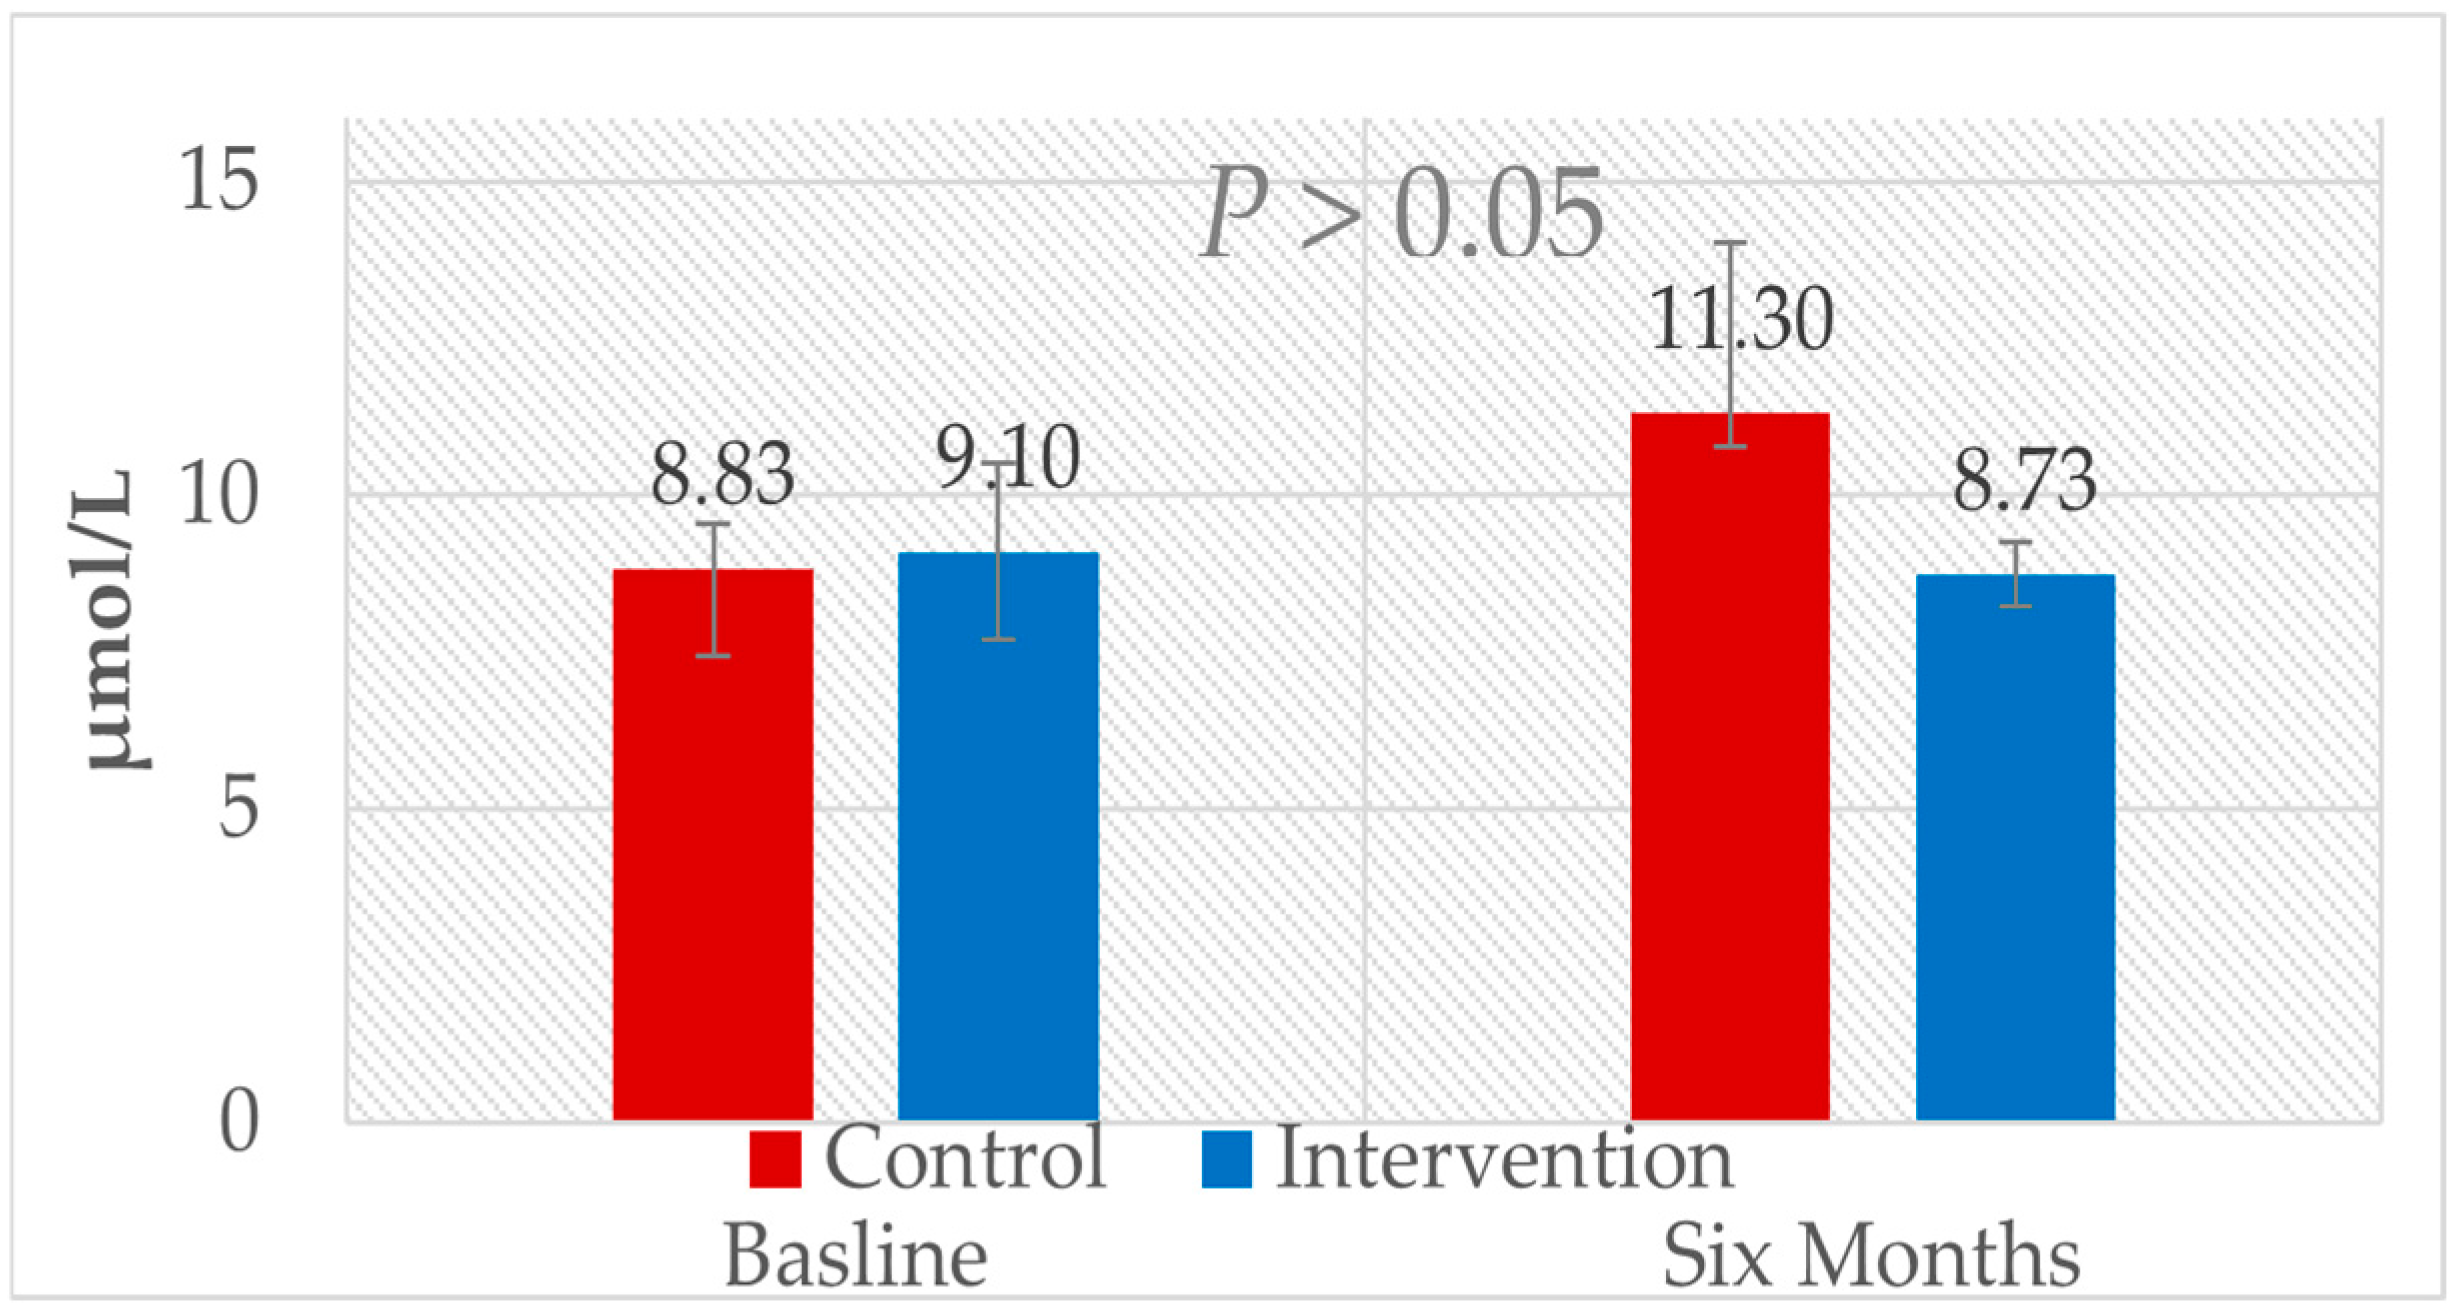
| TMAO, µmol/L | IN | 90 | 9.1 ± 1.4 | 8.73 ± 0.52 | 90 | −0.37 (0.59, −1.33) | 0.466 a | 0.263 c | 0.410 d |
| Con | 48 | 8.83 ± 0.7 | 11.3 ± 2.72 | 46 | 2.47 (4.18, 0.76) | 0.346 b | |||
| PDI, points | IN | 99 | 27.5 ± 16.4 | 39.6 ± 18.2 | 98 | 12.01 (8.05, 15.98) | 0.000 a | 0.024 c | 0.002 d |
| Con | 48 | 28.3 ± 13.3 | 26 ± 16.3 | 49 | −2.29 (−6.01, 1.43) | 0.222 a | |||
| hPDI, points | IN | 99 | −7.6 ± 19.9 | 15.7 ± 20.6 | 98 | 22.77 (18.04, 27.5) | 0.000 a | 0.000 c | 0.000 d |
| Con | 34 | −8.6 ± 16.3 | −14.8 ± 20.5 | 34 | −5 (−9.7, −0.31) | 0.037 a | |||
| uPDI, points | IN | 99 | −38.5 ± 18.6 | −45.7 ± 18.9 | 92 | −6.59 (−10.79, −2.39) | 0.002 a | 0.000 c | 0.005 d |
| Con | 48 | −29.2 ± 15 | −31.2 ± 14.9 | 49 | −1.98 (−6.1, −2.14) | 0.339 b | |||
| TC, mg/dL | IN | 95 | 207 ± 40.2 | 196.7 ± 35.7 | 95 | −9.40 (−14.37, −4.43) | 0.000 b | 0.532 c | 0.029 d |
| Con | 47 | 201.3 ± 44.8 | 199.4 ± 45.9 | 47 | −1.96 (−15.24, 11.32) | 0.768 b | |||
| Measured LDL-C, mg/dL | IN | 95 | 140.5 ± 36.6 | 125.1 ± 30.4 | 95 | −14.54 (−18.89, −10.19) | 0.000 b | 0.461 c | 0.000 d |
| Con | 47 | 132.1 ± 38.4 | 130.1 ± 41.7 | 47 | −2 (−12.83, 8.83) | 0.712 b | |||
| Calculated LDL-C, mg/dL | IN | 95 | 123.3 ± 34.4 | 115.2 ± 29.9 | 95 | −7.42 (−11.53, −3.31) | 0.001 b | 0.656 c | 0.024 d |
| Con | 47 | 120.4 ± 36.8 | 118.1 ± 40.2 | 47 | −2.3 (−13.46, 8.86) | 0.680 a | |||
| HDL-C, mg/dL | IN | 95 | 62.2 ± 18.3 | 59.9 ± 16.3 | 95 | −2.07 (−3.7, 0.45) | 0.013 b | 0.514 c | 0.418 d |
| Con | 47 | 57.6 ± 14.9 | 58.7 ± 16 | 47 | 1.06 (−1.77, 3.9) | 0.454 b | |||
| TAG, mg/dL | IN | 95 | 107.9 ± 58.8 | 107.6 ± 53.7 | 95 | 0.08 (−7.34, 7.51) | 0.982 a | 0.905 c | 0.474 d |
| Con | 47 | 116.5 ± 64.1 | 111.3 ± 53 | 47 | −5.19 (−18.96, 8.58) | 0.452 a | |||
| Glucose, mg/dL | IN | 95 | 104.9 ± 26.9 | 98.8 ± 14.4 | 95 | −6.01 (−9.6, −2.42) | 0.001 b | 0.370 c | 0.011 d |
| Con | 47 | 100 ± 10.2 | 98.8 ± 13 | 47 | −1.23 (−3.73, 1.26) | 0.324 a | |||
| HbA1c, % | IN | 95 | 5.5 ± 0.7 | 5.3 ± 0.5 | 95 | −1.97 (−2.87, −1.07) | 0.000 a | 0.056 c | 0.056 d |
| Con | 47 | 5.6 ± 0.4 | 5.6 ± 0.4 | 47 | −0.75 (−1.53, 0.03) | 0.060 a | |||
| Insulin, µU/mL | IN | 95 | 11 ± 7.9 | 10.2 ± 6.6 | 95 | −0.68 (−1.8, 0.43) | 0.225 a | 0.450 c | 0.025 d |
| Con | 47 | 12.5 ± 9.4 | 10.8 ± 8.3 | 47 | −1.73 (−3.79, 0.33) | 0.097 a |

3.3. Bivariant Correlations
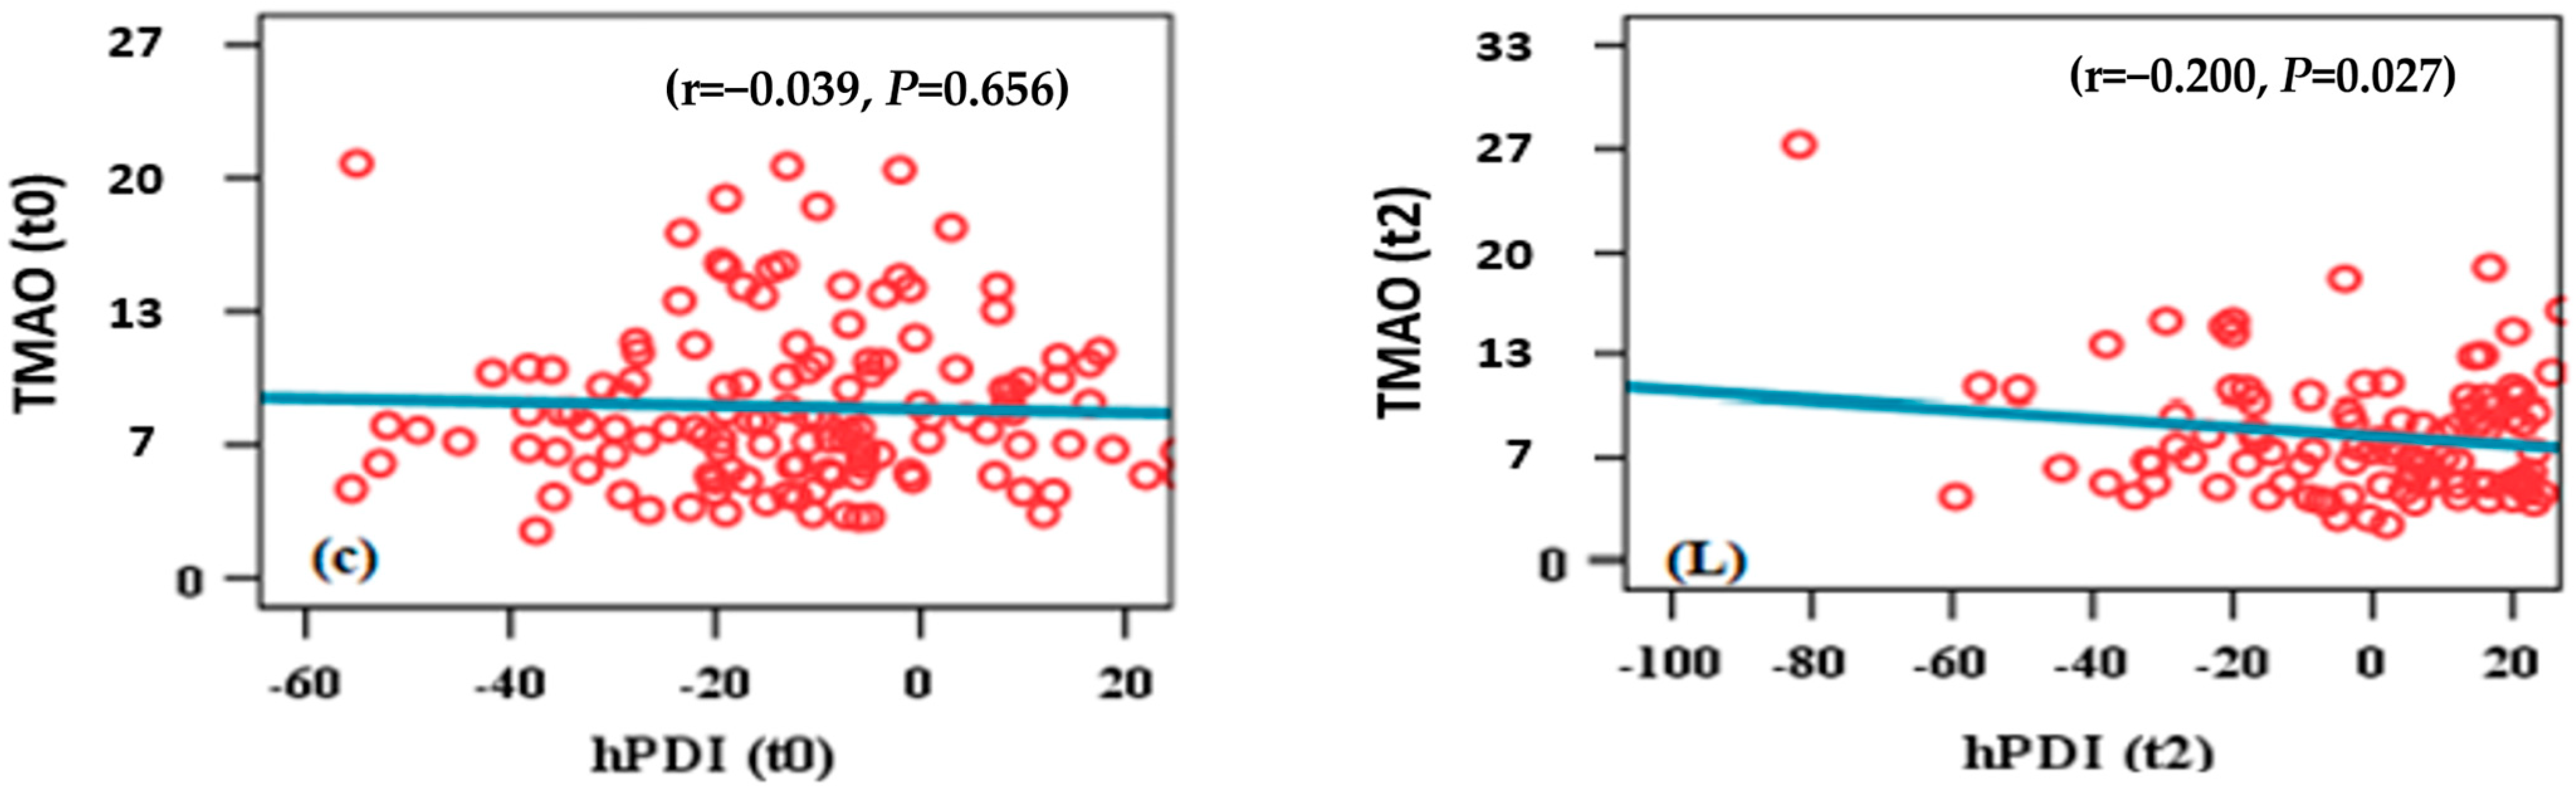
3.4. TMAO and hPDI Scatter Plot
3.5. TMAO and PDI Scatter Plot

4. Discussion
5. Conclusions
6. Strengths and Limitations
Author Contributions
Funding
Institutional Review Board Statement
Informed Consent Statement
Data Availability Statement
Acknowledgments
Conflicts of Interest
Correction Statement
References
- Wang, Z.; Bergeron, N.; Levison, B.S.; Li, X.S.; Chiu, S.; Jia, X.; Koeth, R.A.; Li, L.; Wu, Y.; Tang, W.H.W.; et al. Impact of chronic dietary red meat, white meat, or non-meat protein on trimethylamine N-oxide metabolism and renal excretion in healthy men and women. Eur. Heart J. 2019, 40, 583–594. [Google Scholar] [CrossRef] [PubMed]
- Awwad, H.M.; Geisel, J.; Obeid, R. Determination of trimethylamine, trimethylamine N-oxide, and taurine in human plasma and urine by UHPLC-MS/MS technique. J. Chromatogr. B Anal. Technol. Biomed. Life Sci. 2016, 1038, 12–18. [Google Scholar] [CrossRef] [PubMed]
- Costabile, G.; Vetrani, C.; Bozzetto, L.; Giacco, R.; Bresciani, L.; Del Rio, D.; Vitale, M.; Della Pepa, G.; Brighenti, F.; Riccardi, G.; et al. Plasma TMAO increase after healthy diets: Results from 2 randomized controlled trials with dietary fish, polyphenols, and whole-grain cereals. Am. J. Clin. Nutr. 2021, 114, 1342–1350. [Google Scholar] [CrossRef]
- Janeiro, M.H.; Ramirez, M.J.; Milagro, F.I.; Martinez, J.A.; Solas, M. Implication of Trimethylamine N-Oxide (TMAO) in Disease: Potential Biomarker or New Therapeutic Target. Nutrients 2018, 10, 1398. [Google Scholar] [CrossRef]
- Fennema, D.; Phillips, I.R.; Shephard, E.A. Trimethylamine and Trimethylamine N-Oxide, a Flavin-Containing Monooxygenase 3 (FMO3)-Mediated Host-Microbiome Metabolic Axis Implicated in Health and Disease. Drug Metab. Dispos. 2016, 44, 1839–1850. [Google Scholar] [CrossRef]
- Bennett, B.J.; de Aguiar Vallim, T.Q.; Wang, Z.; Shih, D.M.; Meng, Y.; Gregory, J.; Allayee, H.; Lee, R.; Graham, M.; Crooke, R.; et al. Trimethylamine-N-oxide, a metabolite associated with atherosclerosis, exhibits complex genetic and dietary regulation. Cell Metab. 2013, 17, 49–60. [Google Scholar] [CrossRef]
- Koeder, C.; Kranz, R.M.; Anand, C.; Husain, S.; Alzughayyar, D.; Schoch, N.; Hahn, A.; Englert, H. Effect of a 1-Year Controlled Lifestyle Intervention on Body Weight and Other Risk Markers (the Healthy Lifestyle Community Programme, Cohort 2). Obes. Facts 2022, 15, 228–239. [Google Scholar] [CrossRef]
- Koeder, C.; Alzughayyar, D.; Anand, C.; Kranz, R.M.; Husain, S.; Schoch, N.; Hahn, A.; Englert, H. The healthful plant-based diet index as a tool for obesity prevention-The healthy lifestyle community program cohort 3 study. Obes. Sci. Pract. 2023, 9, 296–304. [Google Scholar] [CrossRef]
- Schiattarella, G.G.; Sannino, A.; Toscano, E.; Giugliano, G.; Gargiulo, G.; Franzone, A.; Trimarco, B.; Esposito, G.; Perrino, C. Gut microbe-generated metabolite trimethylamine-N-oxide as cardiovascular risk biomarker: A systematic review and dose-response meta-analysis. Eur. Heart J. 2017, 38, 2948–2956. [Google Scholar] [CrossRef]
- Heianza, Y.; Ma, W.; Manson, J.E.; Rexrode, K.M.; Qi, L. Gut Microbiota Metabolites and Risk of Major Adverse Cardiovascular Disease Events and Death: A Systematic Review and Meta-Analysis of Prospective Studies. J. Am. Heart Assoc. 2017, 6, e004947. [Google Scholar] [CrossRef]
- Zhang, C.; Yin, A.; Li, H.; Wang, R.; Wu, G.; Shen, J.; Zhang, M.; Wang, L.; Hou, Y.; Ouyang, H.; et al. Dietary Modulation of Gut Microbiota Contributes to Alleviation of Both Genetic and Simple Obesity in Children. EBioMedicine 2015, 2, 968–984. [Google Scholar] [CrossRef] [PubMed]
- Turnbaugh, P.J.; Ley, R.E.; Mahowald, M.A.; Magrini, V.; Mardis, E.R.; Gordon, J.I. An obesity-associated gut microbiome with increased capacity for energy harvest. Nature 2006, 444, 1027–1031. [Google Scholar] [CrossRef] [PubMed]
- Tang, W.H.; Wang, Z.; Li, X.S.; Fan, Y.; Li, D.S.; Wu, Y.; Hazen, S.L. Increased Trimethylamine N-Oxide Portends High Mortality Risk Independent of Glycemic Control in Patients with Type 2 Diabetes Mellitus. Clin. Chem. 2017, 63, 297–306. [Google Scholar] [CrossRef] [PubMed]
- Chan, M.M.; Yang, X.; Wang, H.; Saaoud, F.; Sun, Y.; Fong, D. The Microbial Metabolite Trimethylamine N-Oxide Links Vascular Dysfunctions and the Autoimmune Disease Rheumatoid Arthritis. Nutrients 2019, 11, 1821. [Google Scholar] [CrossRef]
- Koeth, R.A.; Wang, Z.; Levison, B.S.; Buffa, J.A.; Org, E.; Sheehy, B.T.; Britt, E.B.; Fu, X.; Wu, Y.; Li, L.; et al. Intestinal microbiota metabolism of L-carnitine, a nutrient in red meat, promotes atherosclerosis. Nat. Med. 2013, 19, 576–585. [Google Scholar] [CrossRef]
- Lichtenstein, A.H.; Appel, L.J.; Vadiveloo, M.; Hu, F.B.; Kris-Etherton, P.M.; Rebholz, C.M.; Sacks, F.M.; Thorndike, A.N.; Van Horn, L.; Wylie-Rosett, J. 2021 Dietary Guidance to Improve Cardiovascular Health: A Scientific Statement from the American Heart Association. Circulation 2021, 144, e472–e487. [Google Scholar] [CrossRef]
- Cho, C.E.; Taesuwan, S.; Malysheva, O.V.; Bender, E.; Tulchinsky, N.F.; Yan, J.; Sutter, J.L.; Caudill, M.A. Trimethylamine-N-oxide (TMAO) response to animal source foods varies among healthy young men and is influenced by their gut microbiota composition: A randomized controlled trial. Mol. Nutr. Food Res. 2017, 61, 1600324. [Google Scholar] [CrossRef]
- Erickson, M.L.; Malin, S.K.; Wang, Z.; Brown, J.M.; Hazen, S.L.; Kirwan, J.P. Effects of Lifestyle Intervention on Plasma Trimethylamine N-Oxide in Obese Adults. Nutrients 2019, 11, 179. [Google Scholar] [CrossRef]
- Wang, Z.; Levison, B.S.; Hazen, J.E.; Donahue, L.; Li, X.M.; Hazen, S.L. Measurement of trimethylamine-N-oxide by stable isotope dilution liquid chromatography tandem mass spectrometry. Anal. Biochem. 2014, 455, 35–40. [Google Scholar] [CrossRef]
- Satija, A.; Bhupathiraju, S.N.; Spiegelman, D.; Chiuve, S.E.; Manson, J.E.; Willett, W.; Rexrode, K.M.; Rimm, E.B.; Hu, F.B. Healthful and unhealthful plant-based diets and the risk of coronary heart disease in US adults. J. Am. Coll. Cardiol. 2017, 70, 411–422. [Google Scholar] [CrossRef]
- Koeder, C.; Hahn, A.; Englert, H. Effect of a 6-Month Controlled Lifestyle Intervention on Common Carotid Intima-Media Thickness. J. Nutr. Health Aging 2021, 25, 869–877. [Google Scholar] [CrossRef] [PubMed]
- Tang, W.H.; Wang, Z.; Fan, Y.; Levison, B.; Hazen, J.E.; Donahue, L.M.; Wu, Y.; Hazen, S.L. Prognostic value of elevated levels of intestinal microbe-generated metabolite trimethylamine-N-oxide in patients with heart failure: Refining the gut hypothesis. J. Am. Coll. Cardiol. 2014, 64, 1908–1914. [Google Scholar] [CrossRef] [PubMed]
- Troseid, M.; Hov, J.R.; Nestvold, T.K.; Thoresen, H.; Berge, R.K.; Svardal, A.; Lappegard, K.T. Major Increase in Microbiota-Dependent Proatherogenic Metabolite TMAO One Year After Bariatric Surgery. Metab. Syndr. Relat. Disord. 2016, 14, 197–201. [Google Scholar] [CrossRef] [PubMed]
- Randrianarisoa, E.; Lehn-Stefan, A.; Wang, X.; Hoene, M.; Peter, A.; Heinzmann, S.S.; Zhao, X.; Konigsrainer, I.; Konigsrainer, A.; Balletshofer, B.; et al. Relationship of Serum Trimethylamine N-Oxide (TMAO) Levels with early Atherosclerosis in Humans. Sci. Rep. 2016, 6, 26745. [Google Scholar] [CrossRef]
- Obeid, R.; Awwad, H.M.; Keller, M.; Geisel, J. Trimethylamine-N-oxide and its biological variations in vegetarians. Eur. J. Nutr. 2017, 56, 2599–2609. [Google Scholar] [CrossRef]
- Boutagy, N.E.; Neilson, A.P.; Osterberg, K.L.; Smithson, A.T.; Englund, T.R.; Davy, B.M.; Hulver, M.W.; Davy, K.P. Probiotic supplementation and trimethylamine-N-oxide production following a high-fat diet. Obesity 2015, 23, 2357–2363. [Google Scholar] [CrossRef]
- David, L.A.; Maurice, C.F.; Carmody, R.N.; Gootenberg, D.B.; Button, J.E.; Wolfe, B.E.; Ling, A.V.; Devlin, A.S.; Varma, Y.; Fischbach, M.A.; et al. Diet rapidly and reproducibly alters the human gut microbiome. Nature 2014, 505, 559–563. [Google Scholar] [CrossRef]
- Gan, Z.H.; Cheong, H.C.; Tu, Y.K.; Kuo, P.H. Association between Plant-Based Dietary Patterns and Risk of Cardiovascular Disease: A Systematic Review and Meta-Analysis of Prospective Cohort Studies. Nutrients 2021, 13, 3952. [Google Scholar] [CrossRef]
- Crimarco, A.; Springfield, S.; Petlura, C.; Streaty, T.; Cunanan, K.; Lee, J.; Fielding-Singh, P.; Carter, M.M.; Topf, M.A.; Wastyk, H.C.; et al. A randomized crossover trial on the effect of plant-based compared with animal-based meat on trimethylamine-N-oxide and cardiovascular disease risk factors in generally healthy adults: Study With Appetizing Plantfood-Meat Eating Alternative Trial (SWAP-MEAT). Am. J. Clin. Nutr. 2020, 112, 1188–1199. [Google Scholar] [CrossRef]
- Wu, W.K.; Chen, C.C.; Liu, P.Y.; Panyod, S.; Liao, B.Y.; Chen, P.C.; Kao, H.L.; Kuo, H.C.; Kuo, C.H.; Chiu, T.H.T.; et al. Identification of TMAO-producer phenotype and host-diet-gut dysbiosis by carnitine challenge test in human and germ-free mice. Gut 2019, 68, 1439–1449. [Google Scholar] [CrossRef]
- Abbate, M.; Gallardo-Alfaro, L.; Bibiloni, M.D.M.; Tur, J.A. Efficacy of dietary intervention or in combination with exercise on primary prevention of cardiovascular disease: A systematic review. Nutr. Metab. Cardiovasc. Dis. 2020, 30, 1080–1093. [Google Scholar] [CrossRef]
- Morze, J.; Danielewicz, A.; Hoffmann, G.; Schwingshackl, L. Diet Quality as Assessed by the Healthy Eating Index, Alternate Healthy Eating Index, Dietary Approaches to Stop Hypertension Score, and Health Outcomes: A Second Update of a Systematic Review and Meta-Analysis of Cohort Studies. J. Acad. Nutr. Diet. 2020, 120, 1998–2031.e15. [Google Scholar] [CrossRef] [PubMed]
- Ivanova, S.; Delattre, C.; Karcheva-Bahchevanska, D.; Benbasat, N.; Nalbantova, V.; Ivanov, K. Plant-Based Diet as a Strategy for Weight Control. Foods 2021, 10, 3052. [Google Scholar] [CrossRef] [PubMed]
- Kahleova, H.; Fleeman, R.; Hlozkova, A.; Holubkov, R.; Barnard, N.D. A plant-based diet in overweight individuals in a 16-week randomized clinical trial: Metabolic benefits of plant protein. Nutr. Diabetes 2018, 8, 58. [Google Scholar] [CrossRef] [PubMed]

| Variable | Intervention Group (n = 115) | Control Group (n = 63) | p-Value # |
|---|---|---|---|
| Men, n (%) | 33 (28.2%) | 36 (42.4%) | 0.036 a |
| Age at baseline, years | 58.0 ± 8.5 | 54.7 ± 10.5 | 0.014 b |
| Body weight, kg | 82.0 ± 15.1 | 82.9 ± 17.9 | 0.739 c |
| BMI, kg/m2 | 27.5 ± 4.5 | 28.0 ± 5.7 | 0.526 c |
| Overweight, n (%) | 39 (33.3%) | 20 (31.3%) | 0.721 a |
| Obesity, n (%) | 32 (27.4%) | 25 (39.1%) | 0.216 a |
| TMAO, µmol/L | 9.68 ± 1.25 | 8.4 ± 0.62 | 0.469 b |
| Smoker status, n (%) | 0.000 a | ||
| Never | 60 (53.1) | 28 (48.3) | |
| Ex-smoker | 46 (10.7) | 0 (0.0) | |
| Smoker | 7 (6.2) | 30 (51.7) | |
| Marital status, n (%) | 0.590 a | ||
| Married | 90 (78.9%) | 59 (86.8%) | |
| Partner (unmarried) | 7 (6.1%) | 3 (4.4%) | |
| Single (not widowed) | 13 (7.1) | 13 (7.1) | |
| Single (widowed) | 10 (8.8) | 3 (4.4) |
Disclaimer/Publisher’s Note: The statements, opinions and data contained in all publications are solely those of the individual author(s) and contributor(s) and not of MDPI and/or the editor(s). MDPI and/or the editor(s) disclaim responsibility for any injury to people or property resulting from any ideas, methods, instructions or products referred to in the content. |
© 2025 by the authors. Licensee MDPI, Basel, Switzerland. This article is an open access article distributed under the terms and conditions of the Creative Commons Attribution (CC BY) license (https://creativecommons.org/licenses/by/4.0/).
Share and Cite
Alzughayyar, D.-K.N.; Weber, R.-M.; Husain, S.; Schoch, N.; Englert, H. Impact of the Healthy Lifestyle Community Program (HLCP-3) on Trimethylamine N-Oxide (TMAO) and Risk Profile Parameters Related to Lifestyle Diseases During the Six Months Following an Intervention Study. Nutrients 2025, 17, 298. https://doi.org/10.3390/nu17020298
Alzughayyar D-KN, Weber R-M, Husain S, Schoch N, Englert H. Impact of the Healthy Lifestyle Community Program (HLCP-3) on Trimethylamine N-Oxide (TMAO) and Risk Profile Parameters Related to Lifestyle Diseases During the Six Months Following an Intervention Study. Nutrients. 2025; 17(2):298. https://doi.org/10.3390/nu17020298
Chicago/Turabian StyleAlzughayyar, Dima-Karam Nasereddin, Ragna-Marie Weber, Sarah Husain, Nora Schoch, and Heike Englert. 2025. "Impact of the Healthy Lifestyle Community Program (HLCP-3) on Trimethylamine N-Oxide (TMAO) and Risk Profile Parameters Related to Lifestyle Diseases During the Six Months Following an Intervention Study" Nutrients 17, no. 2: 298. https://doi.org/10.3390/nu17020298
APA StyleAlzughayyar, D.-K. N., Weber, R.-M., Husain, S., Schoch, N., & Englert, H. (2025). Impact of the Healthy Lifestyle Community Program (HLCP-3) on Trimethylamine N-Oxide (TMAO) and Risk Profile Parameters Related to Lifestyle Diseases During the Six Months Following an Intervention Study. Nutrients, 17(2), 298. https://doi.org/10.3390/nu17020298