
Diet Quality, Metabolic Syndrome, and Nativity Status: Elucidating Metabolic Advantage and Disadvantage Among Non-US-Native and US-Native Populations Using NHANES Data (2013–2018)


Abstract
1. Introduction
2. Materials and Methods
2.1. Metabolic Syndrome
2.2. Dietary Quality
2.3. Nativity Status
2.4. Sociodemographics
2.5. Statistical Analysis
3. Results
Interactions Among Diet Quality, MetS, and Nativity Status
4. Discussion
Strengths and Limitations
5. Conclusions
Author Contributions
Funding
Institutional Review Board Statement
Informed Consent Statement
Data Availability Statement
Acknowledgments
Conflicts of Interest
References
- Noubiap, J.J.; Nansseu, J.R.; Lontchi-Yimagou, E.; Nkeck, J.R.; Nyaga, U.F.; Ngouo, A.T.; Tounouga, D.N.; Tianyi, F.-L.; Foka, A.J.; Ndoadoumgue, A.L.; et al. Geographic distribution of metabolic syndrome and its components in the general adult population: A meta-analysis of global data from 28 million individuals. Diabetes Res. Clin. Pract. 2022, 188, 109924. [Google Scholar] [CrossRef]
- Castro-Barquero, S.; Ruiz-León, A.M.; Sierra-Pérez, M.; Estruch, R.; Casas, R. Dietary Strategies for Metabolic Syndrome: A Comprehensive Review. Nutrients 2020, 12, 2983. [Google Scholar] [CrossRef] [PubMed]
- Kong, N.W.; Ning, H.; Zhong, V.W.; Paluch, A.; Wilkins, J.T.; Lloyd-Jones, D.; Allen, N.B. Association between diet quality and incident cardiovascular disease stratified by body mass index. Am. J. Prev. Cardiol. 2021, 8, 100298. [Google Scholar] [CrossRef] [PubMed]
- Sanjeevi, N.; Freeland-Graves, J.H. Low diet quality is associated with adverse levels of metabolic health markers and clustering of risk factors in adults with type 2 diabetes. J. Hum. Nutr. Diet. 2023, 36, 31–39. [Google Scholar] [CrossRef] [PubMed]
- Miller, V.; Webb, P.; Cudhea, F.; Shi, P.; Zhang, J.; Reedy, J.; Erndt-Marino, J.; Coates, J.; Mozaffarian, D. Global dietary quality in 185 countries from 1990 to 2018 show wide differences by nation, age, education, and urbanicity. Nat. Food 2022, 3, 694–702. [Google Scholar] [CrossRef] [PubMed]
- Castañeda, H.; Holmes, S.M.; Madrigal, D.S.; Young, M.-E.D.; Beyeler, N.; Quesada, J. Immigration as a Social Determinant of Health. Annu. Rev. Public Health 2015, 36, 375–392. [Google Scholar] [CrossRef] [PubMed]
- Budiman, A.; Tamir, C.; Mora, L.; Noe-Bustamante, L. Facts on U.S. Immigrants. 2018. Pew Research Center. 2020. Available online: https://www.pewresearch.org/race-and-ethnicity/2020/08/20/facts-on-u-s-immigrants/ (accessed on 27 December 2024).
- Berggreen-Clausen, A.; Pha, S.H.; Alvesson, H.M.; Andersson, A.; Daivadanam, M. Food environment interactions after migration: A scoping review on low- and middle-income country immigrants in high-income countries. Public Health Nutr. 2022, 25, 136–158. [Google Scholar] [CrossRef]
- Rosenthal, T.; Touyz, R.M.; Oparil, S. Migrating Populations and Health: Risk Factors for Cardiovascular Disease and Metabolic Syndrome. Curr. Hypertens. Rep. 2022, 24, 325–340. [Google Scholar] [CrossRef]
- Coronado, G.; Chio-Lauri, J.; Cruz, R.D.; Roman, Y.M. Health Disparities of Cardiometabolic Disorders Among Filipino Americans: Implications for Health Equity and Community-Based Genetic Research. J. Racial Ethn. Health Disparities 2022, 9, 6. [Google Scholar] [CrossRef] [PubMed]
- LeCroy, M.N.; Suss, R.; Russo, R.G.; Sifuentes, S.; Beasley, J.M.; Barajas-Gonzalez, R.G.; Chebli, P.; Foster, V.; Kwon, S.C.; Trinh-Shevrin, C.; et al. Looking Across and Within: Immigration as a Unifying Structural Factor Impacting Cardiometabolic Health and Diet. Ethn. Dis. 2024, 33, 130–139. [Google Scholar] [CrossRef]
- Brown, T.H. Racial Stratification, Immigration, and Health Inequality: A Life Course-Intersectional Approach. Soc. Forces 2018, 96, 1507–1540. [Google Scholar] [CrossRef]
- Oh, H.; Goehring, J.; Jacob, L.; Smith, L. Revisiting the Immigrant Epidemiological Paradox: Findings from the American Panel of Life 2019. Int. J. Environ. Res. Public Health 2021, 18, 4619. [Google Scholar] [CrossRef]
- Carabello, M.; Wolfson, J.A. Mexican immigrant health advantage in metabolic syndrome? Examining the contributions of demographic, socioeconomic, and health behavior characteristics. SSM Popul. Health 2021, 16, 100932. [Google Scholar] [CrossRef] [PubMed]
- Boen, C.E.; Hummer, R.A. Longer-but Harder-Lives? The Hispanic Health Paradox and the Social Determinants of Racial, Ethnic, and Immigrant-Native Health Disparities from Midlife through Late Life. J. Health Soc. Behav. 2019, 60, 434–452. [Google Scholar] [CrossRef] [PubMed]
- Konikowska, K.; Bombała, W.; Szuba, A.; Różańska, D.; Regulska-Ilow, B. Metabolic Syndrome Is Associated with Low Diet Quality Assessed by the Healthy Eating Index-2015 (HEI-2015) and Low Concentrations of High-Density Lipoprotein Cholesterol. Biomedicines 2022, 10, 2487. [Google Scholar] [CrossRef]
- National Cancer Institute. Healthy Eating Index SAS Code|EGRP/DCCPS/NCI/NIH. Healthy Eating Index SAS Code. Available online: https://epi.grants.cancer.gov/hei/sas-code.html (accessed on 8 October 2024).
- Viruell-Fuentes, E.A.; Miranda, Y.; Abdulrahim, S. More than culture: Structural racism, intersectionality theory, and immigrant health. Soc. Sci. Med. 2012, 75, 2099–2106. [Google Scholar] [CrossRef]
- Adeyemi-Benson, O.S.; Roehll, A.M.; Flores, E.; Singleton, C.R. Differences in Nutrient Intake and Diet Quality among Non-Hispanic Black Adults by Place of Birth and Length of Time in the United States. Nutrients 2023, 15, 3644. [Google Scholar] [CrossRef]
- Needham, B.L.; Ali, T.; Allgood, K.L.; Ro, A.; Hirschtick, J.L.; Fleischer, N.L. Institutional Racism and Health: A Framework for Conceptualization, Measurement, and Analysis. J. Racial Ethn. Health Disparities 2023, 10, 1997–2019. [Google Scholar] [CrossRef] [PubMed]
- Dallman, M.F.; Pecoraro, N.; Akana, S.F.; la Fleur, S.E.; Gomez, F.; Houshyar, H.; Bell, M.E.; Bhatnagar, S.; Laugero, K.D.; Manalo, S. Chronic stress and obesity: A new view of ‘comfort food’. Proc. Natl. Acad. Sci. USA 2003, 100, 11696–11701. [Google Scholar] [CrossRef] [PubMed]
- I Cardel, M.; Chi, X.; Min, Y.-I.; Sims, M.; Musani, S.K.; Dulin, A.; Gravlee, C.C.; Smith, S.M.; DeBoer, M.D.; Gurka, M.J. Experiences of Discrimination Are Associated With Worse Metabolic Syndrome Severity Among African Americans in the Jackson Heart Study. Ann. Behav. Med. 2021, 55, 266–279. [Google Scholar] [CrossRef] [PubMed]
- Hicks, J.; Adams-Campbell, L.L.; Lu, J.; Mills, M.; Dash, C. Validation Study of Physical Activity and Sedentary Behavior in African-American Men and Women. J. Racial Ethn. Health Disparities 2023, 11, 2711–2719. [Google Scholar] [CrossRef]
- Brondolo, E.; Simons, R.R.; Keating, L.H.; Vincent, B.; Kittleman, J.; Roth, A.; Basello, G.; Danyluck, C.; Blair, I.V. Racial/Ethnic Discrimination and Food Consumption: Examination in Diverse Samples. Ann. Behav. Med. 2022, 57, 227–236. [Google Scholar] [CrossRef] [PubMed]
- Jackson, J.S.; Knight, K.M.; Rafferty, J.A. Race and Unhealthy Behaviors: Chronic Stress, the HPA Axis, and Physical and Mental Health Disparities Over the Life Course. Am. J. Public. Health 2010, 100, 933–939. [Google Scholar] [CrossRef]
- Brody, G.H.; Yu, T.; Miller, G.E.; Ehrlich, K.B.; Chen, E. John Henryism Coping and Metabolic Syndrome Among Young Black Adults. Psychosom. Med. 2018, 80, 216. [Google Scholar] [CrossRef]
- Lee, J.R.; Maruthur, N.M.; Yeh, H.-C. Nativity and prevalence of cardiometabolic diseases among U.S. Asian immigrants. J. Diabetes Its Complicat. 2020, 34, 107679. [Google Scholar] [CrossRef]
- Paixão, T.M.; Teixeira, L.R.; de Andrade, C.A.F.; Sepulvida, D.; Martinez-Silveira, M.; Nunes, C.; Siqueira, C.E.G. Systematic Review and Meta-Analysis of Metabolic Syndrome and Its Components in Latino Immigrants to the USA. Int. J. Environ. Res. Public Health 2023, 20, 1307. [Google Scholar] [CrossRef]
- Delavari, M.; Sønderlund, A.L.; Swinburn, B.; Mellor, D.; Renzaho, A. Acculturation and obesity among migrant populations in high income countries--a systematic review. BMC Public Health 2013, 13, 458. [Google Scholar] [CrossRef]
- Batalova, J.B.J. Frequently Requested Statistics on Immigrants and Immigration in the United States. Available online: https://www.migrationpolicy.org/article/frequently-requested-statistics-immigrants-and-immigration-united-states-2024 (accessed on 4 October 2024).
- Smith, D.I.; Tatum, K.L.; Lefbom, L.; Moore, B.; Barnard, R.; Harnack, L.; Foster, B.; Bean, M.K. Stretch your SNAP: Stakeholder perspectives of a novel benefits program to enhance diet quality. Prev. Med. Rep. 2024, 40, 102676. [Google Scholar] [CrossRef] [PubMed]
- Jeong, I.K. The Role of Cortisol in the Pathogenesis of the Metabolic Syndrome. Diabetes Metab. J. 2012, 36, 207–210. [Google Scholar] [CrossRef] [PubMed]
- Cox, T.L.; Krukowski, R.; Love, S.J.; Eddings, K.; DiCarlo, M.; Chang, J.Y.; Prewitt, T.E.; West, D.S. Stress Management–Augmented Behavioral Weight Loss Intervention for African American Women: A Pilot, Randomized Controlled Trial. Health Educ. Behav. 2013, 40, 78–87. [Google Scholar] [CrossRef] [PubMed]
- Bowleg, L. The Problem With the Phrase Women and Minorities: Intersectionality—An Important Theoretical Framework for Public Health. Am. J. Public. Health 2012, 102, 1267–1273. [Google Scholar] [CrossRef] [PubMed]
- Lewis, T.T.; Van Dyke, M.E. Discrimination and the Health of African Americans: The Potential Importance of Intersectionalities. Curr. Dir. Psychol. Sci. 2018, 27, 176–182. [Google Scholar] [CrossRef] [PubMed]

| Variable | N (%) | US-Native (n = 4098) | Non-US-Native (n = 1744) | p |
|---|---|---|---|---|
| Age (Years) [n (%)] * | <0.0001 | |||
| 20–29 | 921 (17.9%) | 730 (88.7) | 191 (13.2) | |
| 30–39 | 983 (17.1%) | 641 (74.5) | 342 (25.5) | |
| 40–49 | 952 (17.3%) | 608 (77.8) | 344 (22.2) | |
| 50–59 | 1033 (19.5%) | 679 (82.4) | 354 (17.6) | |
| 60–69 | 1061 (16.9%) | 721 (87.4) | 340(12.6) | |
| 70–79 | 580 (7.7%) | 435 (85.8) | 145 (14.2) | |
| ≥80 | 312 (3.6%) | 284 (93.8) | 28 (6.2) | |
| Sex | 0.6827 | |||
| Male | 2849 (49.2%) | 2004 (82.3) | 845 (17.7) | |
| Female | 2993 (50.8%) | 2094 (82.7) | 899 (17.3) | |
| Race/Ethnicity | <0.0001 | |||
| Mexican American | 856 (8.7%) | 345 (43.75) | 511 (56.2) | |
| Other Hispanic | 647 (6.0%) | 225 (39.0) | 422 (61.0) | |
| Non-Hispanic White | 2270 (66.2%) | 2163 (95.0) | 107 (5.0) | |
| Non-Hispanic Black | 1193 (10.2%) | 1086 (90.9) | 107 (9.1) | |
| Non-Hispanic Asian | 653 (4.9) | 81 (13.2) | 572 (86.8) | |
| Other race—including multiracial | 223 (3.8) | 198 (87.4) | 25 (12.6) | |
| Years of Residency in the US * | <0.0001 | |||
| <1 | 46 (0.60) | -- | 46 (0.60) | |
| ≥1, <10 | 297 (3.3) | -- | 297 (3.3) | |
| ≥10, <20 | 432 (4.8) | -- | 432 (4.8) | |
| 20+ | 902 (8.3) | -- | 902 (8.3) | |
| Refused | 26 (0.25) | -- | 26 (0.25) | |
| Did not know | 41 (0.55) | -- | 41 (0.55) | |
| BMI Category | <0.0001 | |||
| Underweight | 67 (1.6) | 21 (1.1) | ||
| Normal weight | 1016 (26.3) | 536 (30.4) | ||
| Overweight | 1226 (30.9) | 671 (38.2) | ||
| Obesity | 1789 (41.2) | 516 (30.3) | ||
| Education Level | <0.0001 | |||
| <12 years | 1213 (13.4) | 618 (15.1) | 595 (34.1) | |
| High school, GED, or equivalent | 1304 (23) | 1013 (24.7) | 291 (16.6) | |
| Some college | 1828 (32.1) | 1481 (36.1) | 347 (19.9) | |
| College or above | 1495 (31.5) | 985 (24.0) | 510 (29.2) | |
| Refused or did not know | 2 (0.01) | 1 (0.02) | 1 (0.05) | |
| Household Income | <0.0001 | |||
| <USD 20,000 | 990 (11.1) | 744 (77.7) | 305 (22.3) | |
| USD 20,000–44,999 | 1601 (22.8) | 1125 (78.4) | 478 (21.6) | |
| USD 45,000–74,999 | 1089 (20.7) | 813 (86.6) | 276 (13.4) | |
| USD 75,000–99,000 | 549 (11.9) | 409 (87.1) | 140 (12.9) | |
| USD 100,000+ | 1032 (25.4) | 712 (86.5) | 320 (13.5) | |
| Missing, refused, or did not know | 329 (4.13) | 179 (66.4) | 150 (33.6) |
| US-Native (n = 4098) | Non-US-Native (n = 1744) | p ‡ | |
|---|---|---|---|
| Clinical MetS Components (Mean ± SE) ** | |||
| Fasting plasma glucose (mg/dL) | 107.661 ± 0.602 | 109.419 ± 1.022 | 0.159 |
| HDL cholesterol (mg/dL) | 55.063 ± 0.429 | 53.509 ± 0.626 | 0.045 * |
| Male | 49.312 ± 0.513 | 47.750 ± 0.692 | 0.109 |
| Female | 60.613 ± 0.668 | 59.187 ± 0.935 | 0.172 |
| Triglycerides (mg/dL) | 113.143 ± 1.819 | 127.725 ± 4.598 | 0.003 * |
| Mean arterial pressure (mmHg) | 87.417 ± 0.269 | 87.472 ± 0.426 | 0.907 |
| Systolic blood pressure | 122.245 ± 0.347 | 120.899 ± 0.622 | 0.060 |
| Diastolic blood pressure | 70.003 ± 0.338 | 70.758 ± 0.501 | 0.142 |
| Waist circumference (cm) | 101.268 ± 0.419 | 95.492 ± 0.561 | <0.0001 * |
| Male | 103.078 ± 0.513 | 97.709 ± 0.754 | <0.0001 * |
| Female | 99.521 ± 0.546 | 93.306 ± 0.746 | <0.0001 * |
| MetS z-score | −0.608 ± 0.064 | −0.684 ± 0.100 | 0.473 |
| Male | −0.712 ± 0.087 | −0.716 ± 0.124 | 0.977 |
| Female | −0.509 ± 0.085 | −0.653 ± 0.144 | 0.347 |
| Categorical MetS designation [n (%)] † | 0.336 | ||
| Does not have MetS | 2545 (62.1) | 1111 (63.7) | |
| Has MetS | 1553 (37.9) | 633 (36.3) | |
| Categorical MetS score [n (%)] † | 0.324 | ||
| 0 | 200 (79.9) | 90 (20.1) | |
| 1 | 959 (80.5) | 459 (19.5) | |
| 2 | 1386 (83.1) | 562 (16.9) | |
| 3 | 1050 (82.5) | 423 (17.5) | |
| 4 | 455 (84.5) | 185 (15.5) | |
| 5 | 48 (86.4) | 25 (13.6) |
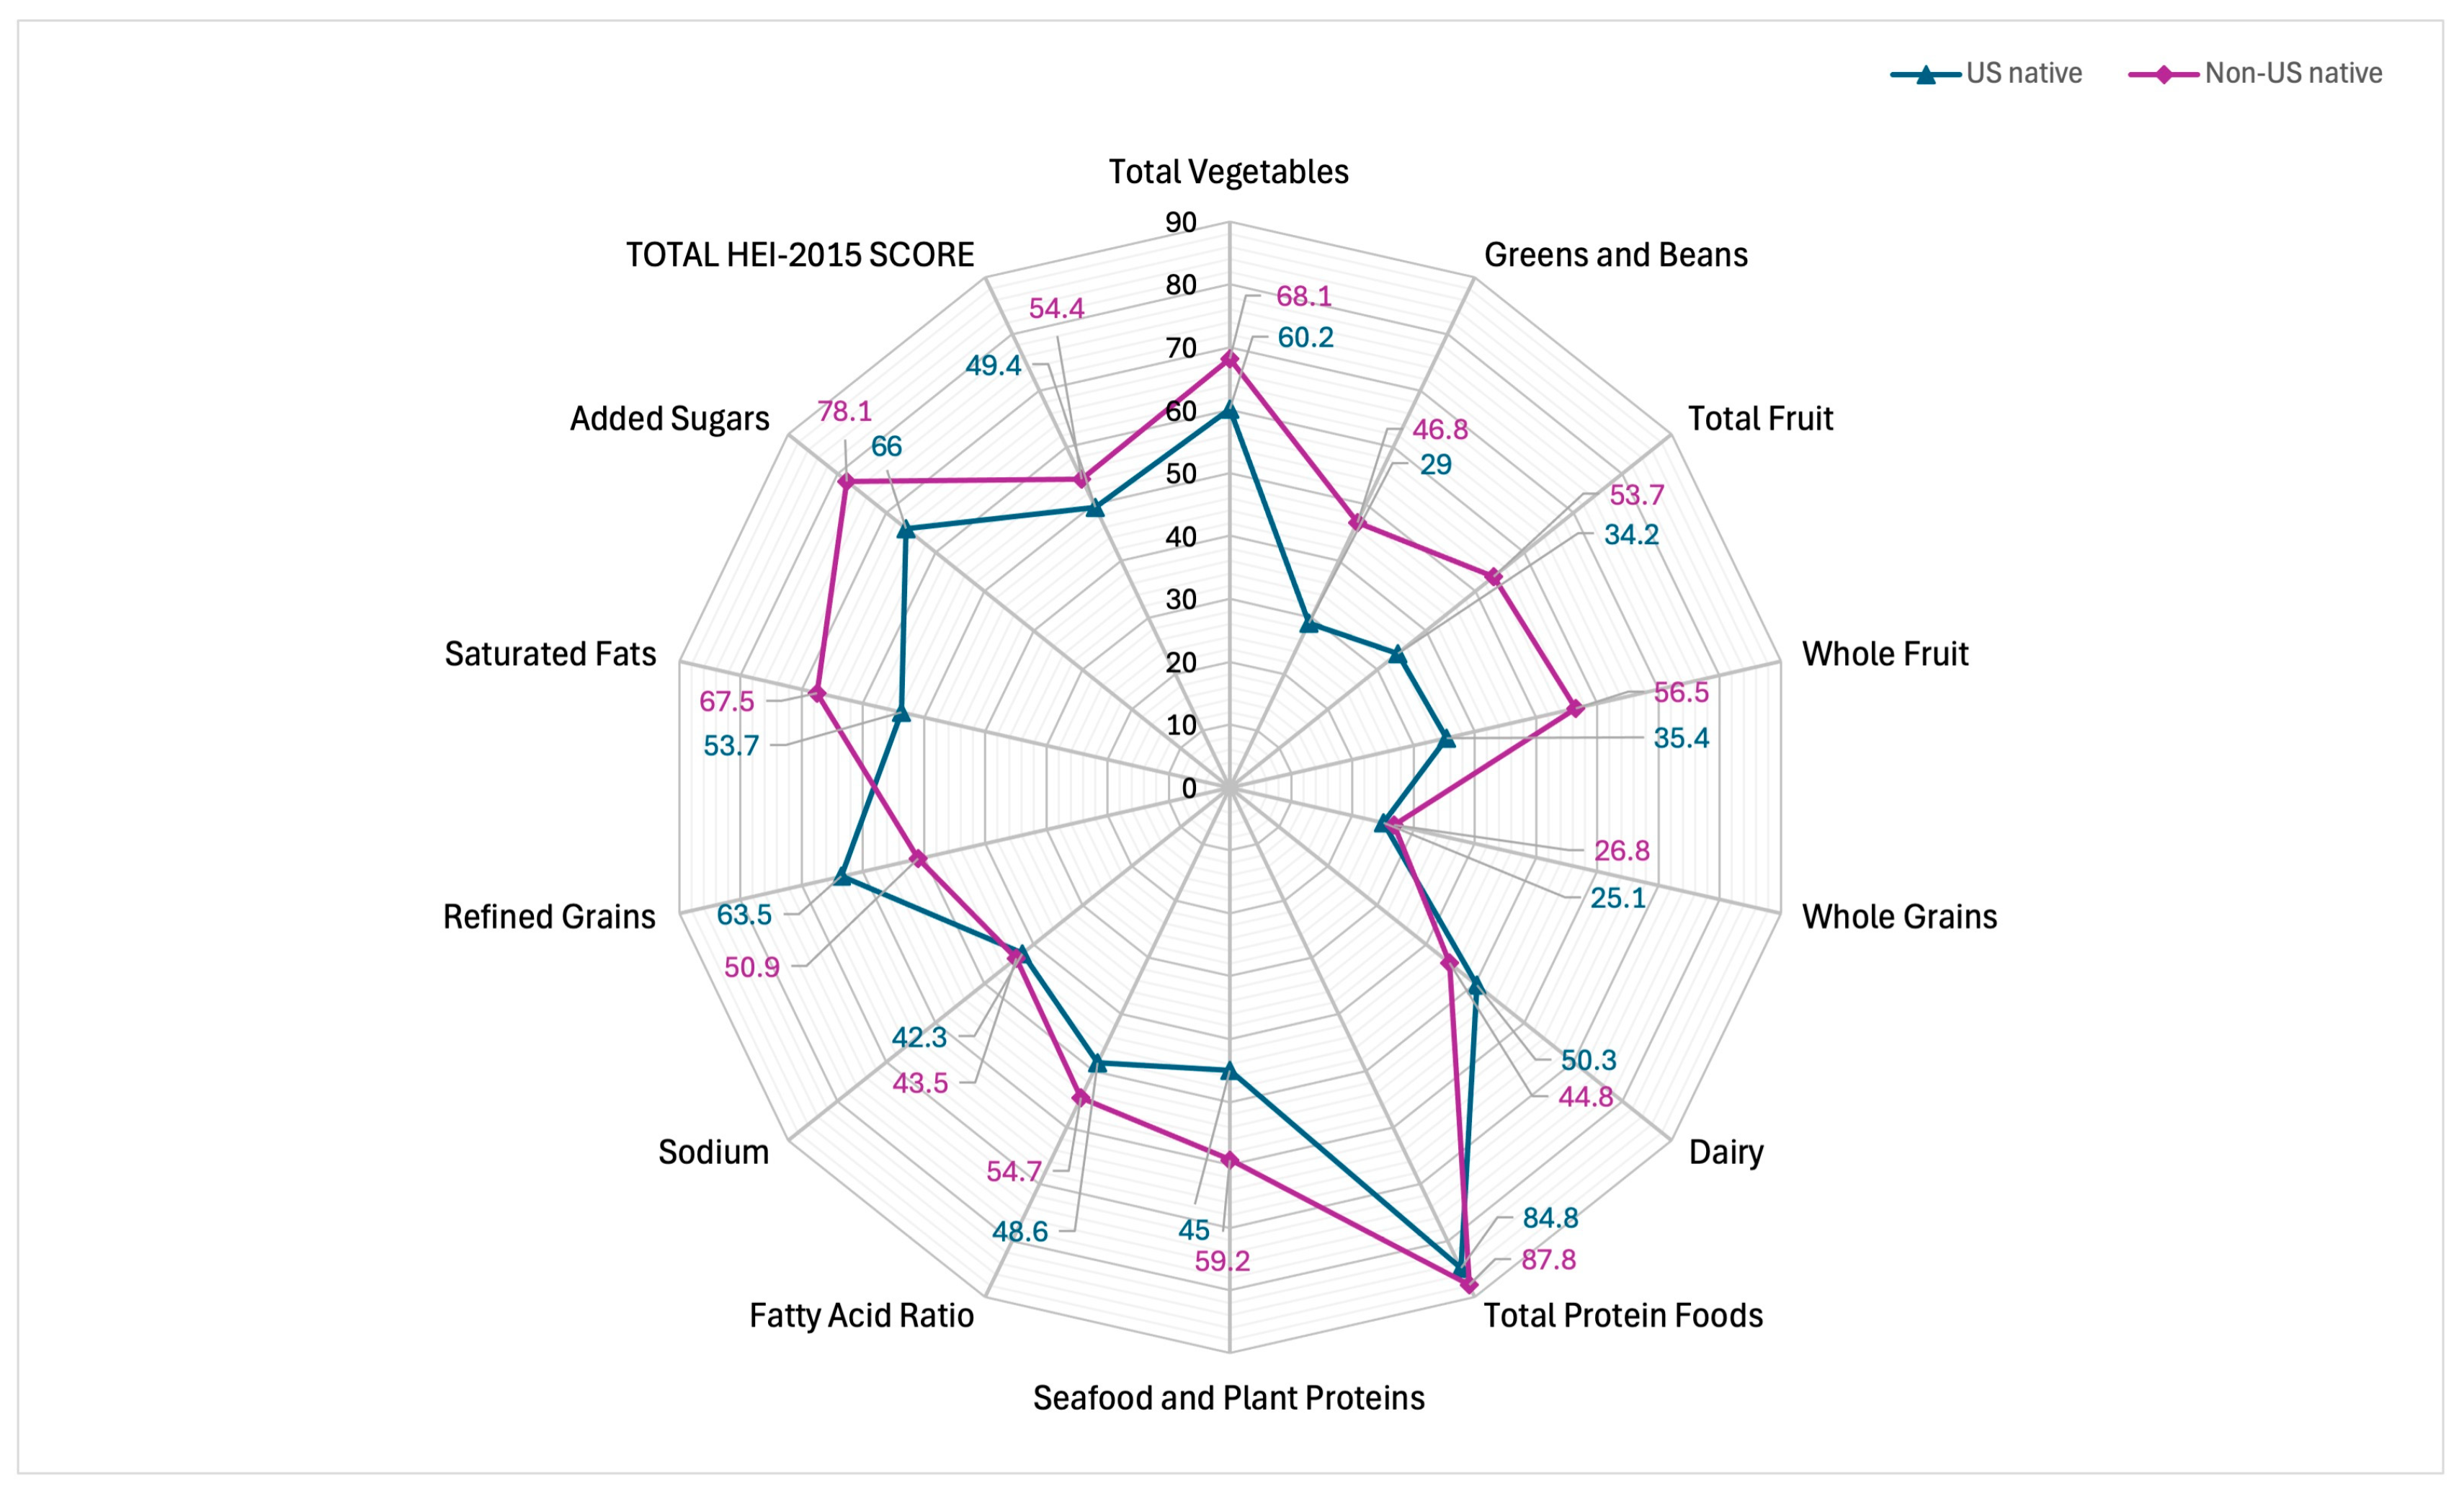
| US-Native (n = 4098) | Non-US-Native (n = 1744) | |||||
|---|---|---|---|---|---|---|
| Food/Nutrient Component | Mean (SE) ** | 95% CI for Mean | Percent Score | Mean (SE) ** | 95% CI for Mean | Percent Score |
| Total vegetables | 3.012 (0.043) | 2.926, 3.0988 | 60.2 | 3.406 (0.061) | 3.282, 3.529 | 68.1 |
| Greens and beans | 1.448 (0.053) | 1.342, 1.554 | 29.0 | 2.338 (0.086) | 2.165, 2.512 | 46.8 |
| Total fruit | 1.708 (0.064) | 1.578, 1.837 | 34.2 | 2.683 (0.065) | 2.552, 2.815 | 53.7 |
| Whole fruit | 1.768 (0.077) | 1.613, 1.922 | 35.4 | 2.826 (0.079) | 2.667, 2.986 | 56.5 |
| Whole grains | 2.513 (0.091) | 2.33, 2.696 | 25.1 | 2.685 (0.156) | 2.371, 2.998 | 26.8 |
| Dairy | 5.033 (0.101) | 4.831, 5.236 | 50.3 | 4.484 (0.104) | 4.274, 4.693 | 44.8 |
| Total protein foods | 4.241 (0.03) | 4.18, 4.303 | 84.8 | 4.388 (0.037) | 4.313, 4.463 | 87.8 |
| Seafood and plant proteins | 2.252 (0.052) | 2.148, 2.357 | 45.0 | 2.958 (0.079) | 2.799, 3.118 | 59.2 |
| Fatty acid ratio | 4.861 (0.077) | 4.707, 5.015 | 48.6 | 5.474 (0.108) | 5.256, 5.961 | 54.7 |
| Sodium | 4.226 (0.094) | 4.035, 4.416 | 42.3 | 4.348 (0.156) | 4.033, 4.663 | 43.5 |
| Refined grains | 6.346 (0.084) | 6.177, 6.515 | 63.5 | 5.092 (0.148) | 4.794, 5.39 | 50.9 |
| Saturated fats | 5.375 (0.074) | 5.225, 5.524 | 53.7 | 6.747 (0.110) | 6.525, 6.968 | 67.5 |
| Added sugars | 6.597 (0.115) | 6.364, 6.829 | 66.0 | 7.806(0.086) | 7.633, 7.979 | 78.1 |
| TOTAL HEI-2015 SCORE | 49.38 (0.479) | 48.415, 50.344 | 49.4 | 55.234 (0.609) | 54.008, 56.46 | 54.44 |
| Race/Ethnicity | Birth Country Mean ± SE | p † | |
|---|---|---|---|
| US-Native (N = 4098) | Non-US-Native (N = 1744) | ||
| Total Unstratified Sample | 49.380 ± 0.214 | 55.234 ± 0.332 | <0.0001 * |
| Mexican American | 46.984 ± 0.969 | 51.200 ± 0.859 | <0.0001 * |
| Other Hispanic | 48.177 ± 1.707 | 53.964 ± 0.796 | 0.007 * |
| Non-Hispanic White | 49.836 ± 0.601 | 57.926 ± 1.595 | <0.0001 * |
| Non-Hispanic Black | 47.383 ± 0.515 | 55.427 ± 1.627 | <0.0001 * |
| Non-Hispanic Asian | 52.209 ± 1.636 | 58.108 ± 0.929 | 0.003 * |
| Other and/or multiracial | 49.867 ± 1.303 | 57.805 ± 2.934 | 0.021 * |
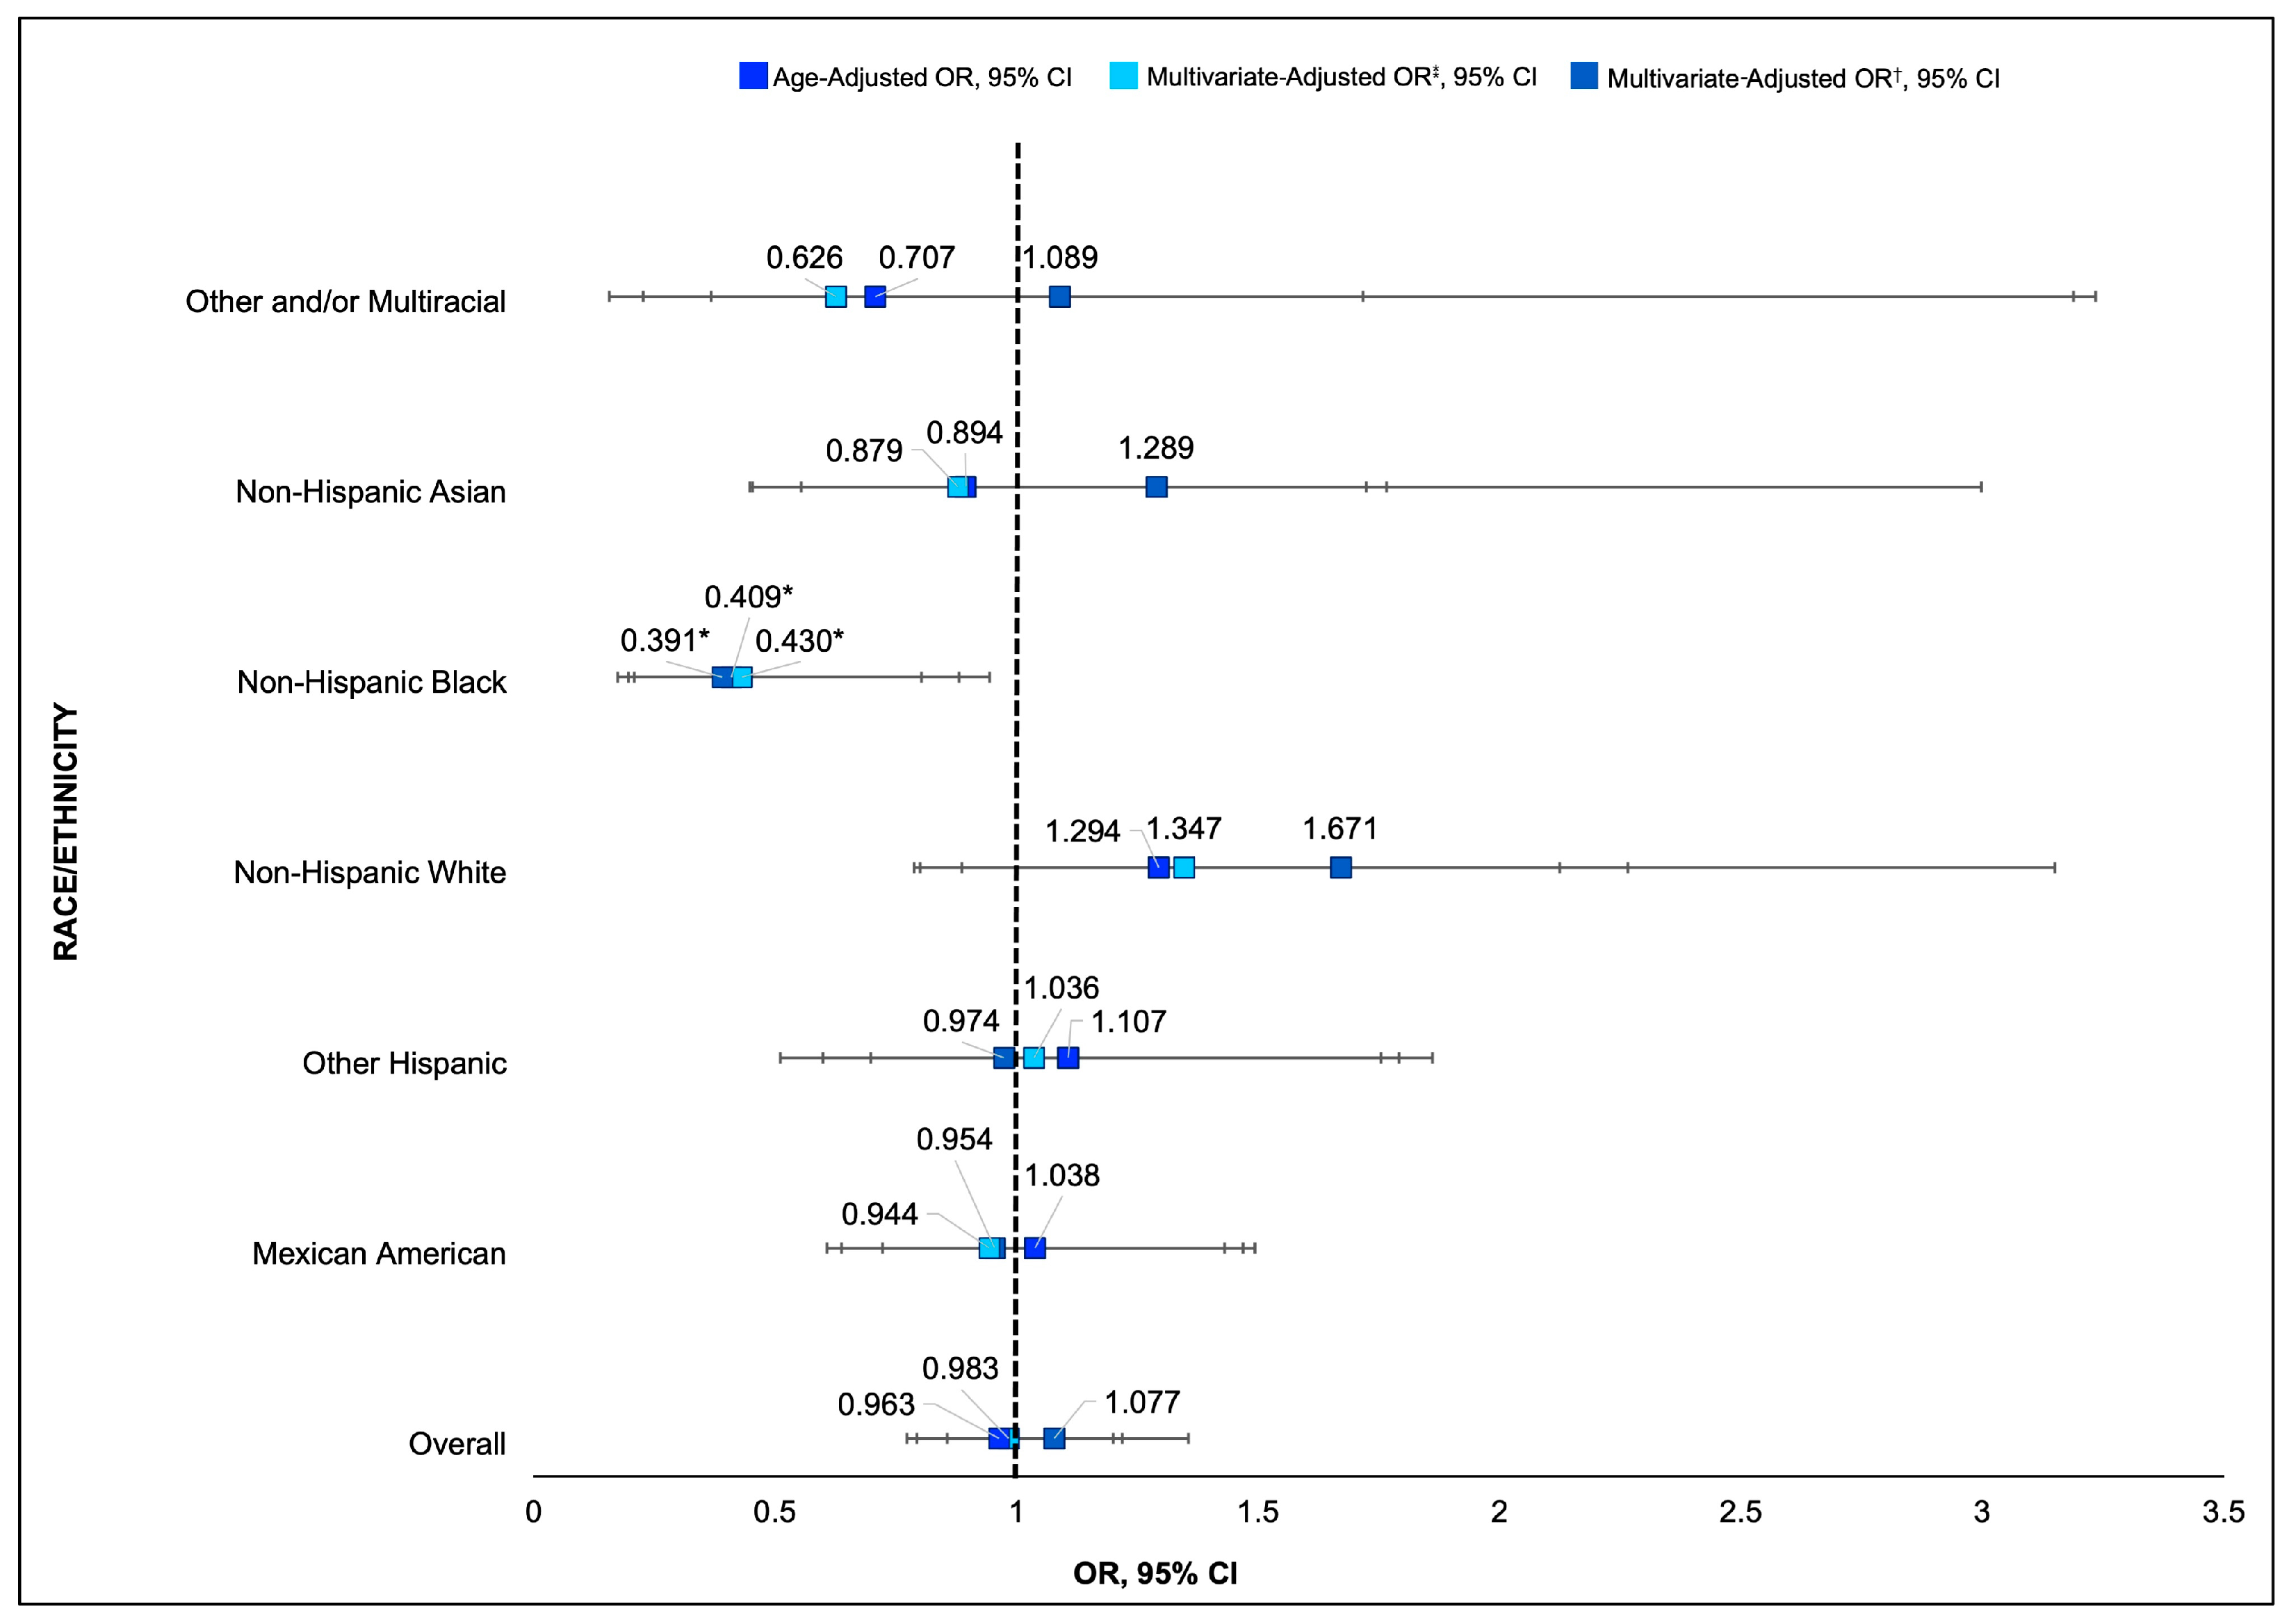
| Race/Ethnicity | Age-Adjusted OR (95% CI) | p | Multivariate OR ● (95% CI) | p | Multivariate—HEI OR † (95% CI) | p |
|---|---|---|---|---|---|---|
| Mexican American | 1.038 (0.72–1.49) | 0.835 | 0.954 (0.64–1.43) | 0.817 | 0.944 (0.61–1.46) | 0.795 |
| Other Hispanic | 1.107 (0.69–1.75) | 0.660 | 1.036 (0.60–1.79) | 0.897 | 0.974 (0.51–1.86) | 0.935 |
| Non-Hispanic White | 1.294 (0.79–2.12) | 0.301 | 1.347 (0.80–2.27) | 0.254 | 1.671 (0.88–3.15) | 0.110 |
| Non-Hispanic Black | 0.409 (0.21–0.80) | 0.011 * | 0.430 (0.19–0.94) | 0.036 * | 0.391 (0.17–0.88) | 0.024 * |
| Non-Hispanic Asian | 0.894 (0.45–1.77) | 0.745 | 0.879 (0.45–1.72) | 0.702 | 1.289 (0.55–2.99) | 0.548 |
| Other and/or multiracial | 0.707 (0.16–3.19) | 0.645 | 0.626 (0.23–1.72) | 0.357 | 1.089 (0.37–3.23) | 0.875 |
| Race/Ethnicity | Individual MetS Clinical Components OR (95% CI) | ||||
|---|---|---|---|---|---|
| Waist Circumference | Triglycerides | HDL Cholesterol | Fasting Plasma Glucose | Blood Pressure | |
| Overall | 0.588 (0.497–0.696) * | 1.314(1.049–1.646) * | 0.832(0.612–1.130) | 1.336(1.044–1.709) | 1.003 (0.829–1.213) |
| Mexican American | 0.720 (0.458–1.136) | 1.366 (0.884–2.112) | 0.856 (0.500–1.466) | 1.286(0.688–2.407) | 0.758 (0.533–1.079) |
| Other Hispanic | 0.352 (0.191–0.648) * | 0.714 (0.409–1.245) | 0.888 (0.458–1.722) | 0.842(0.499–1.576) | 0.979 (0.528–1.816) |
| Non-Hispanic White | 0.722 (0.388–1.345) | 1.308 (0.665–2.574) | 1.262(0.495–3.221) | 1.327 (0.812–2.169) | 1.104 (0.579–2.107) |
| Non-Hispanic Black | 0.544 (0.325–0.943) * | 0.365 (0.080–1.663) | 0.633(0.349–1.149) | 0.773 (0.403–1.485) | 0.521 (0.285–0.953) |
| Non-Hispanic Asian | 1.175 (0.491–2.815) | 0.974 (0.444–2.137) | 0.308 (0.135–0.700) * | 1.635 (0.644–4.151) | 1.137 (0.632–2.786) |
| Other and/or multiracial | 2.120 (0.339–13.243) | 4.970 (1.146–21.547) * | 0.859 (0.266–2.766) | 0.352 (0.085–1.454) | 0.652 (0.266–2.582) |
Disclaimer/Publisher’s Note: The statements, opinions and data contained in all publications are solely those of the individual author(s) and contributor(s) and not of MDPI and/or the editor(s). MDPI and/or the editor(s) disclaim responsibility for any injury to people or property resulting from any ideas, methods, instructions or products referred to in the content. |
© 2025 by the authors. Licensee MDPI, Basel, Switzerland. This article is an open access article distributed under the terms and conditions of the Creative Commons Attribution (CC BY) license (https://creativecommons.org/licenses/by/4.0/).
Share and Cite
Smith, D.I.; Sakarcan, E.; Adams-Campbell, L.; Dash, C. Diet Quality, Metabolic Syndrome, and Nativity Status: Elucidating Metabolic Advantage and Disadvantage Among Non-US-Native and US-Native Populations Using NHANES Data (2013–2018). Nutrients 2025, 17, 215. https://doi.org/10.3390/nu17020215
Smith DI, Sakarcan E, Adams-Campbell L, Dash C. Diet Quality, Metabolic Syndrome, and Nativity Status: Elucidating Metabolic Advantage and Disadvantage Among Non-US-Native and US-Native Populations Using NHANES Data (2013–2018). Nutrients. 2025; 17(2):215. https://doi.org/10.3390/nu17020215
Chicago/Turabian StyleSmith, Danyel I., Eren Sakarcan, Lucile Adams-Campbell, and Chiranjeev Dash. 2025. "Diet Quality, Metabolic Syndrome, and Nativity Status: Elucidating Metabolic Advantage and Disadvantage Among Non-US-Native and US-Native Populations Using NHANES Data (2013–2018)" Nutrients 17, no. 2: 215. https://doi.org/10.3390/nu17020215
APA StyleSmith, D. I., Sakarcan, E., Adams-Campbell, L., & Dash, C. (2025). Diet Quality, Metabolic Syndrome, and Nativity Status: Elucidating Metabolic Advantage and Disadvantage Among Non-US-Native and US-Native Populations Using NHANES Data (2013–2018). Nutrients, 17(2), 215. https://doi.org/10.3390/nu17020215