Healthy Grains in Healthy Diets: The Contribution of Grain Foods to Diet Quality and Health in the National Health and Nutrition Examination Survey 2017–2023
Abstract
1. Introduction
2. Materials and Methods
2.1. Participant Characteristics
2.2. Dietary Intakes Data from 24 h Recalls
2.3. Selection of Grain Foods
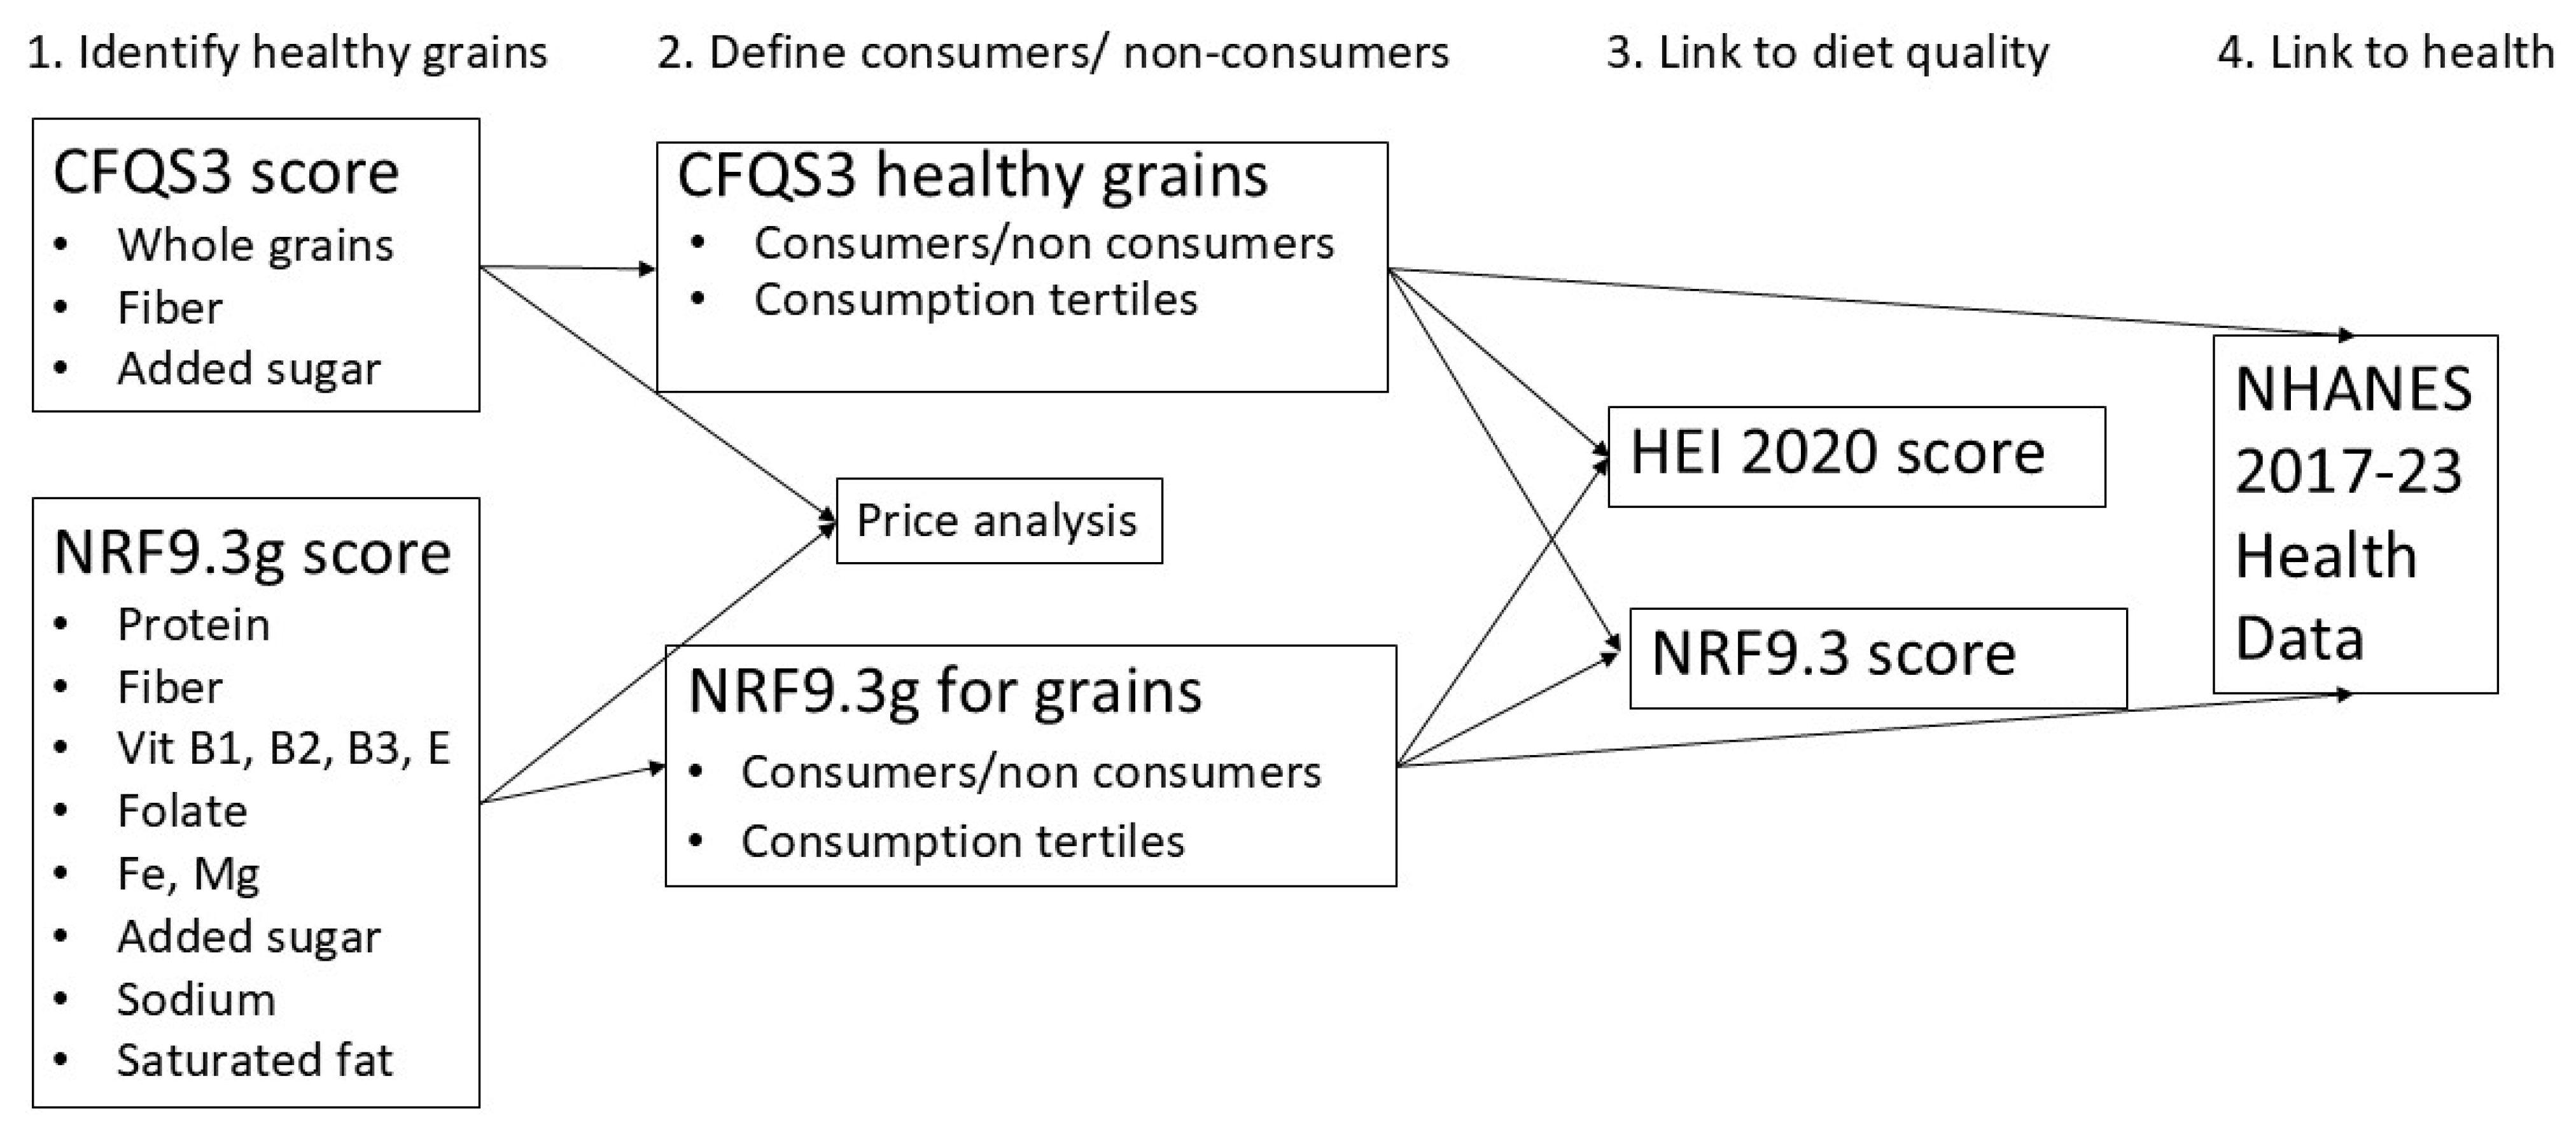
2.4. Identification of Healthy Grain Foods
2.5. Dietary Quality Metrics NRF and HEI 2020
2.6. Health Outcome Measures
2.7. The Price of Healthy Grains
2.8. Plan of Analyses
3. Results
3.1. Healthy Grain Foods Identified by CFQS-3
3.2. Healthy Grain Foods Identified by NRF9.3g
3.3. Healthy Grain Foods Consumption by Socio-Demographics
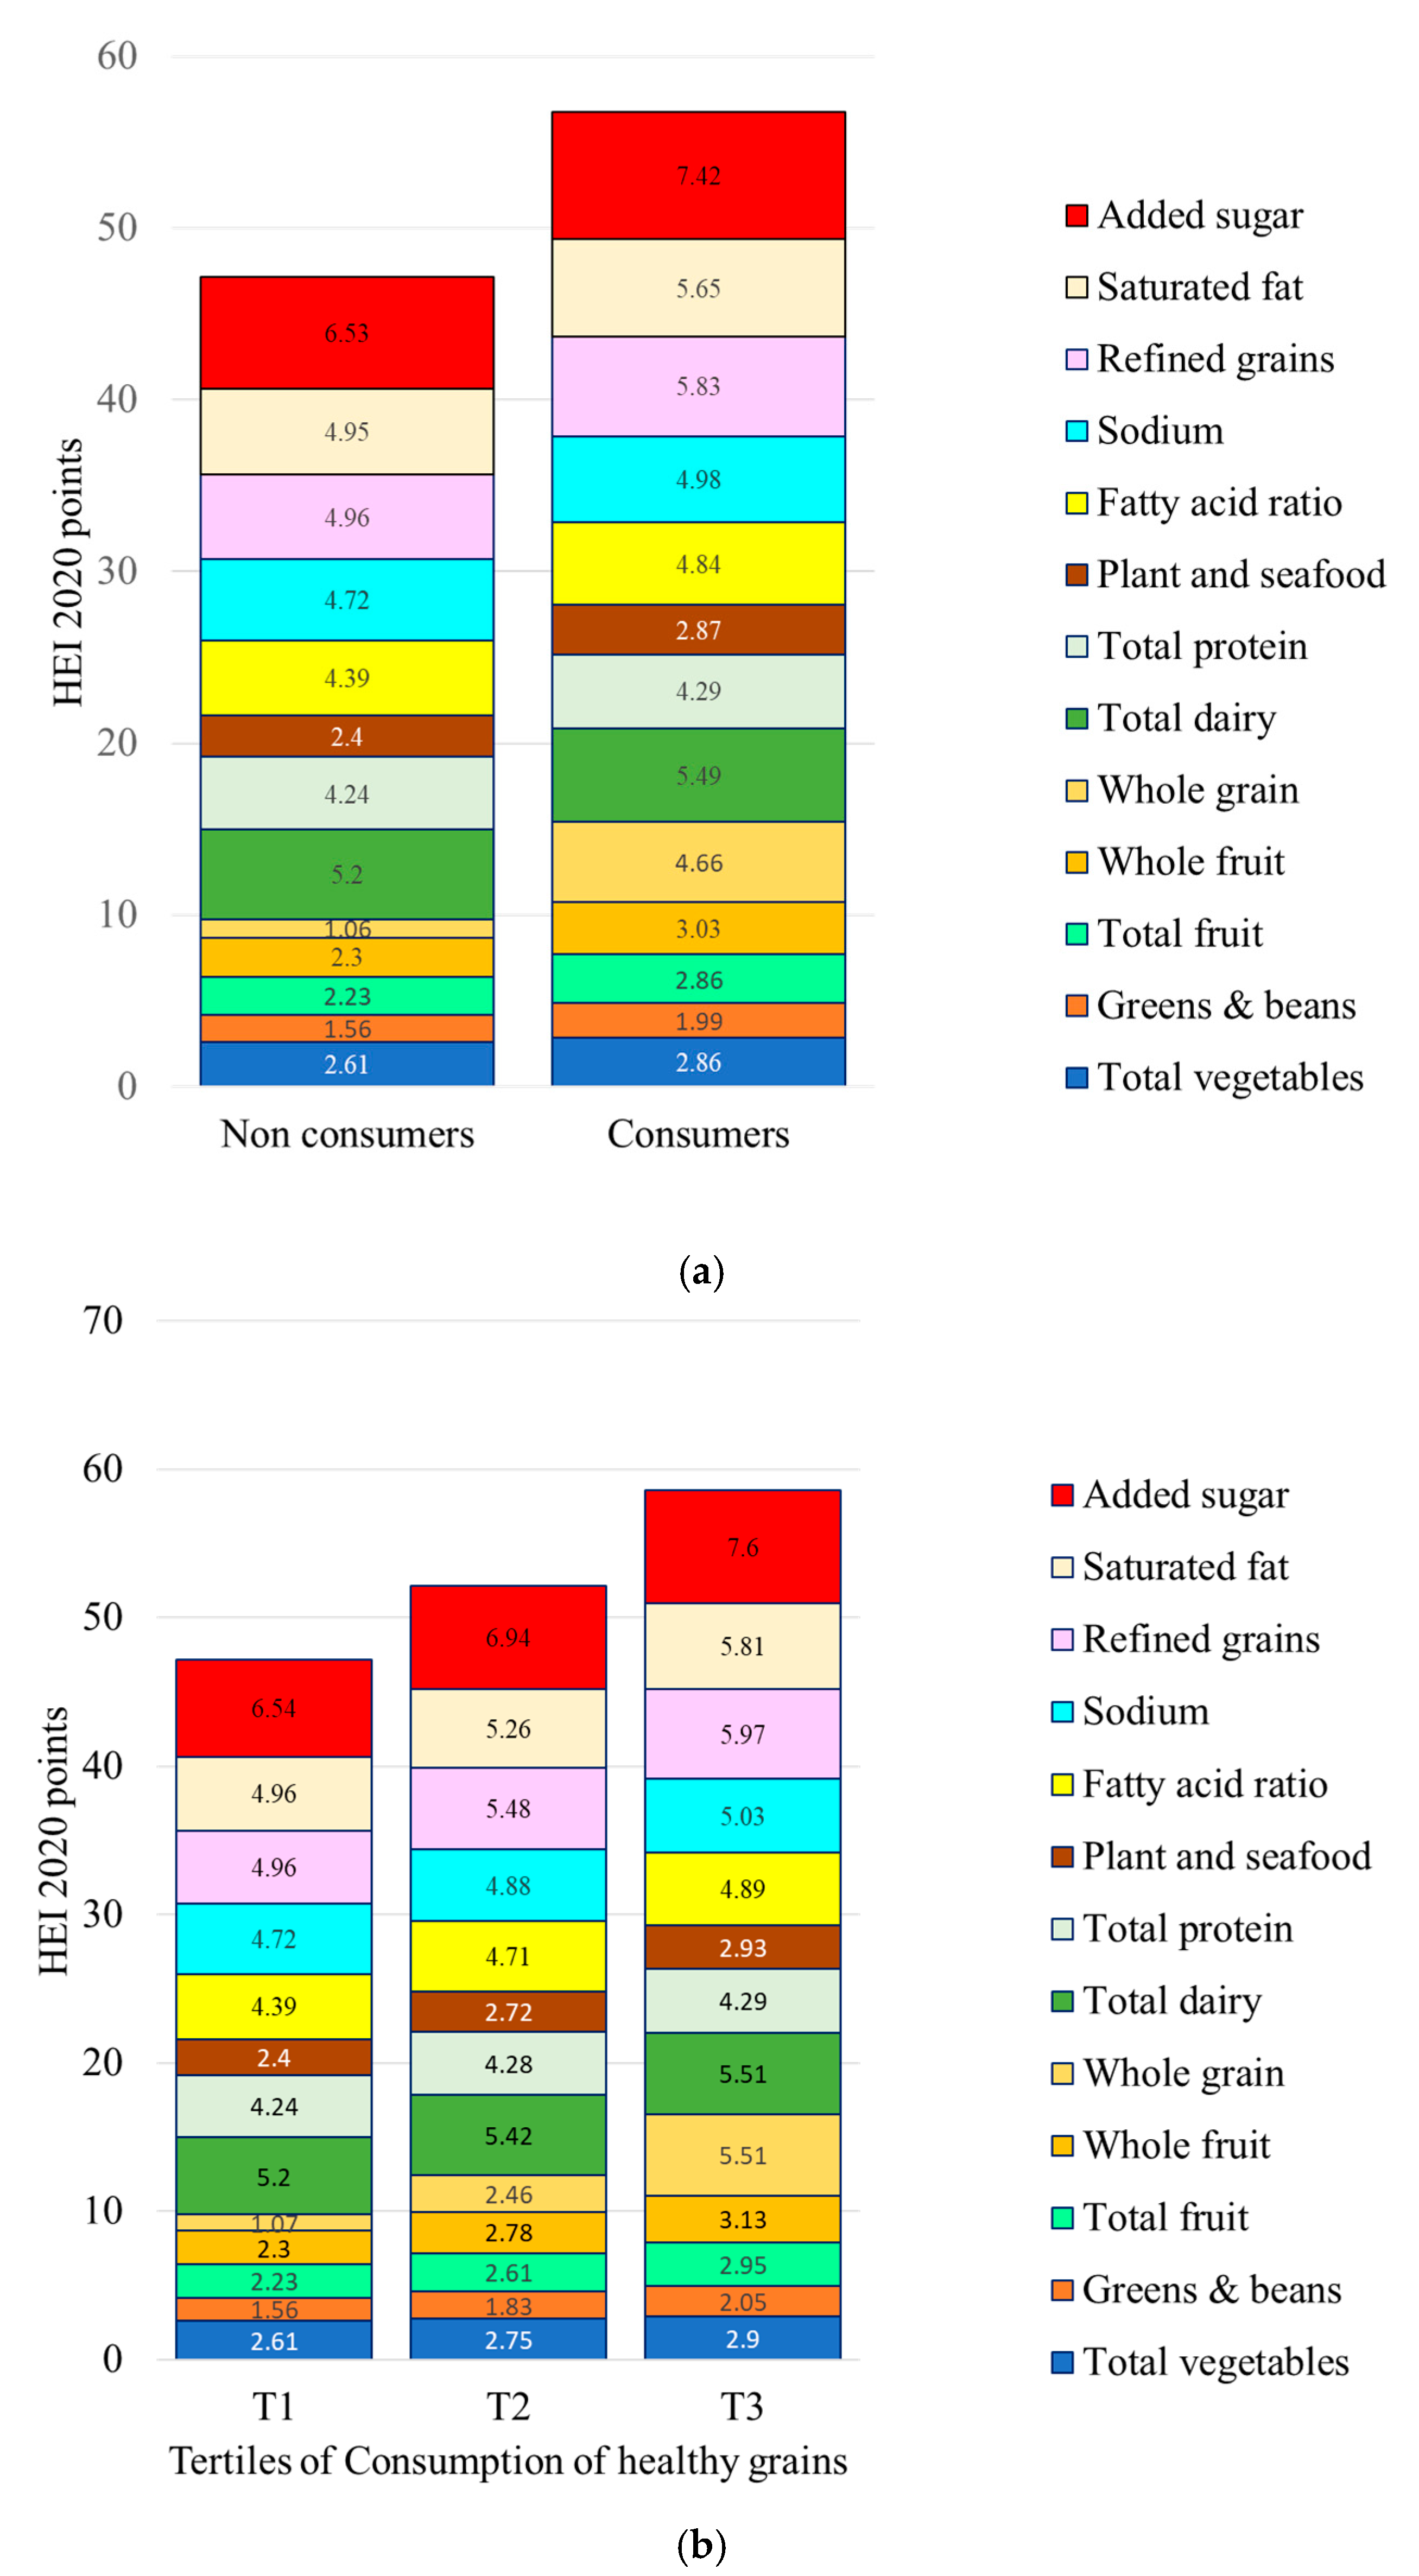
3.4. Healthy Grains and Diet Quality Metrics: The HEI 2020
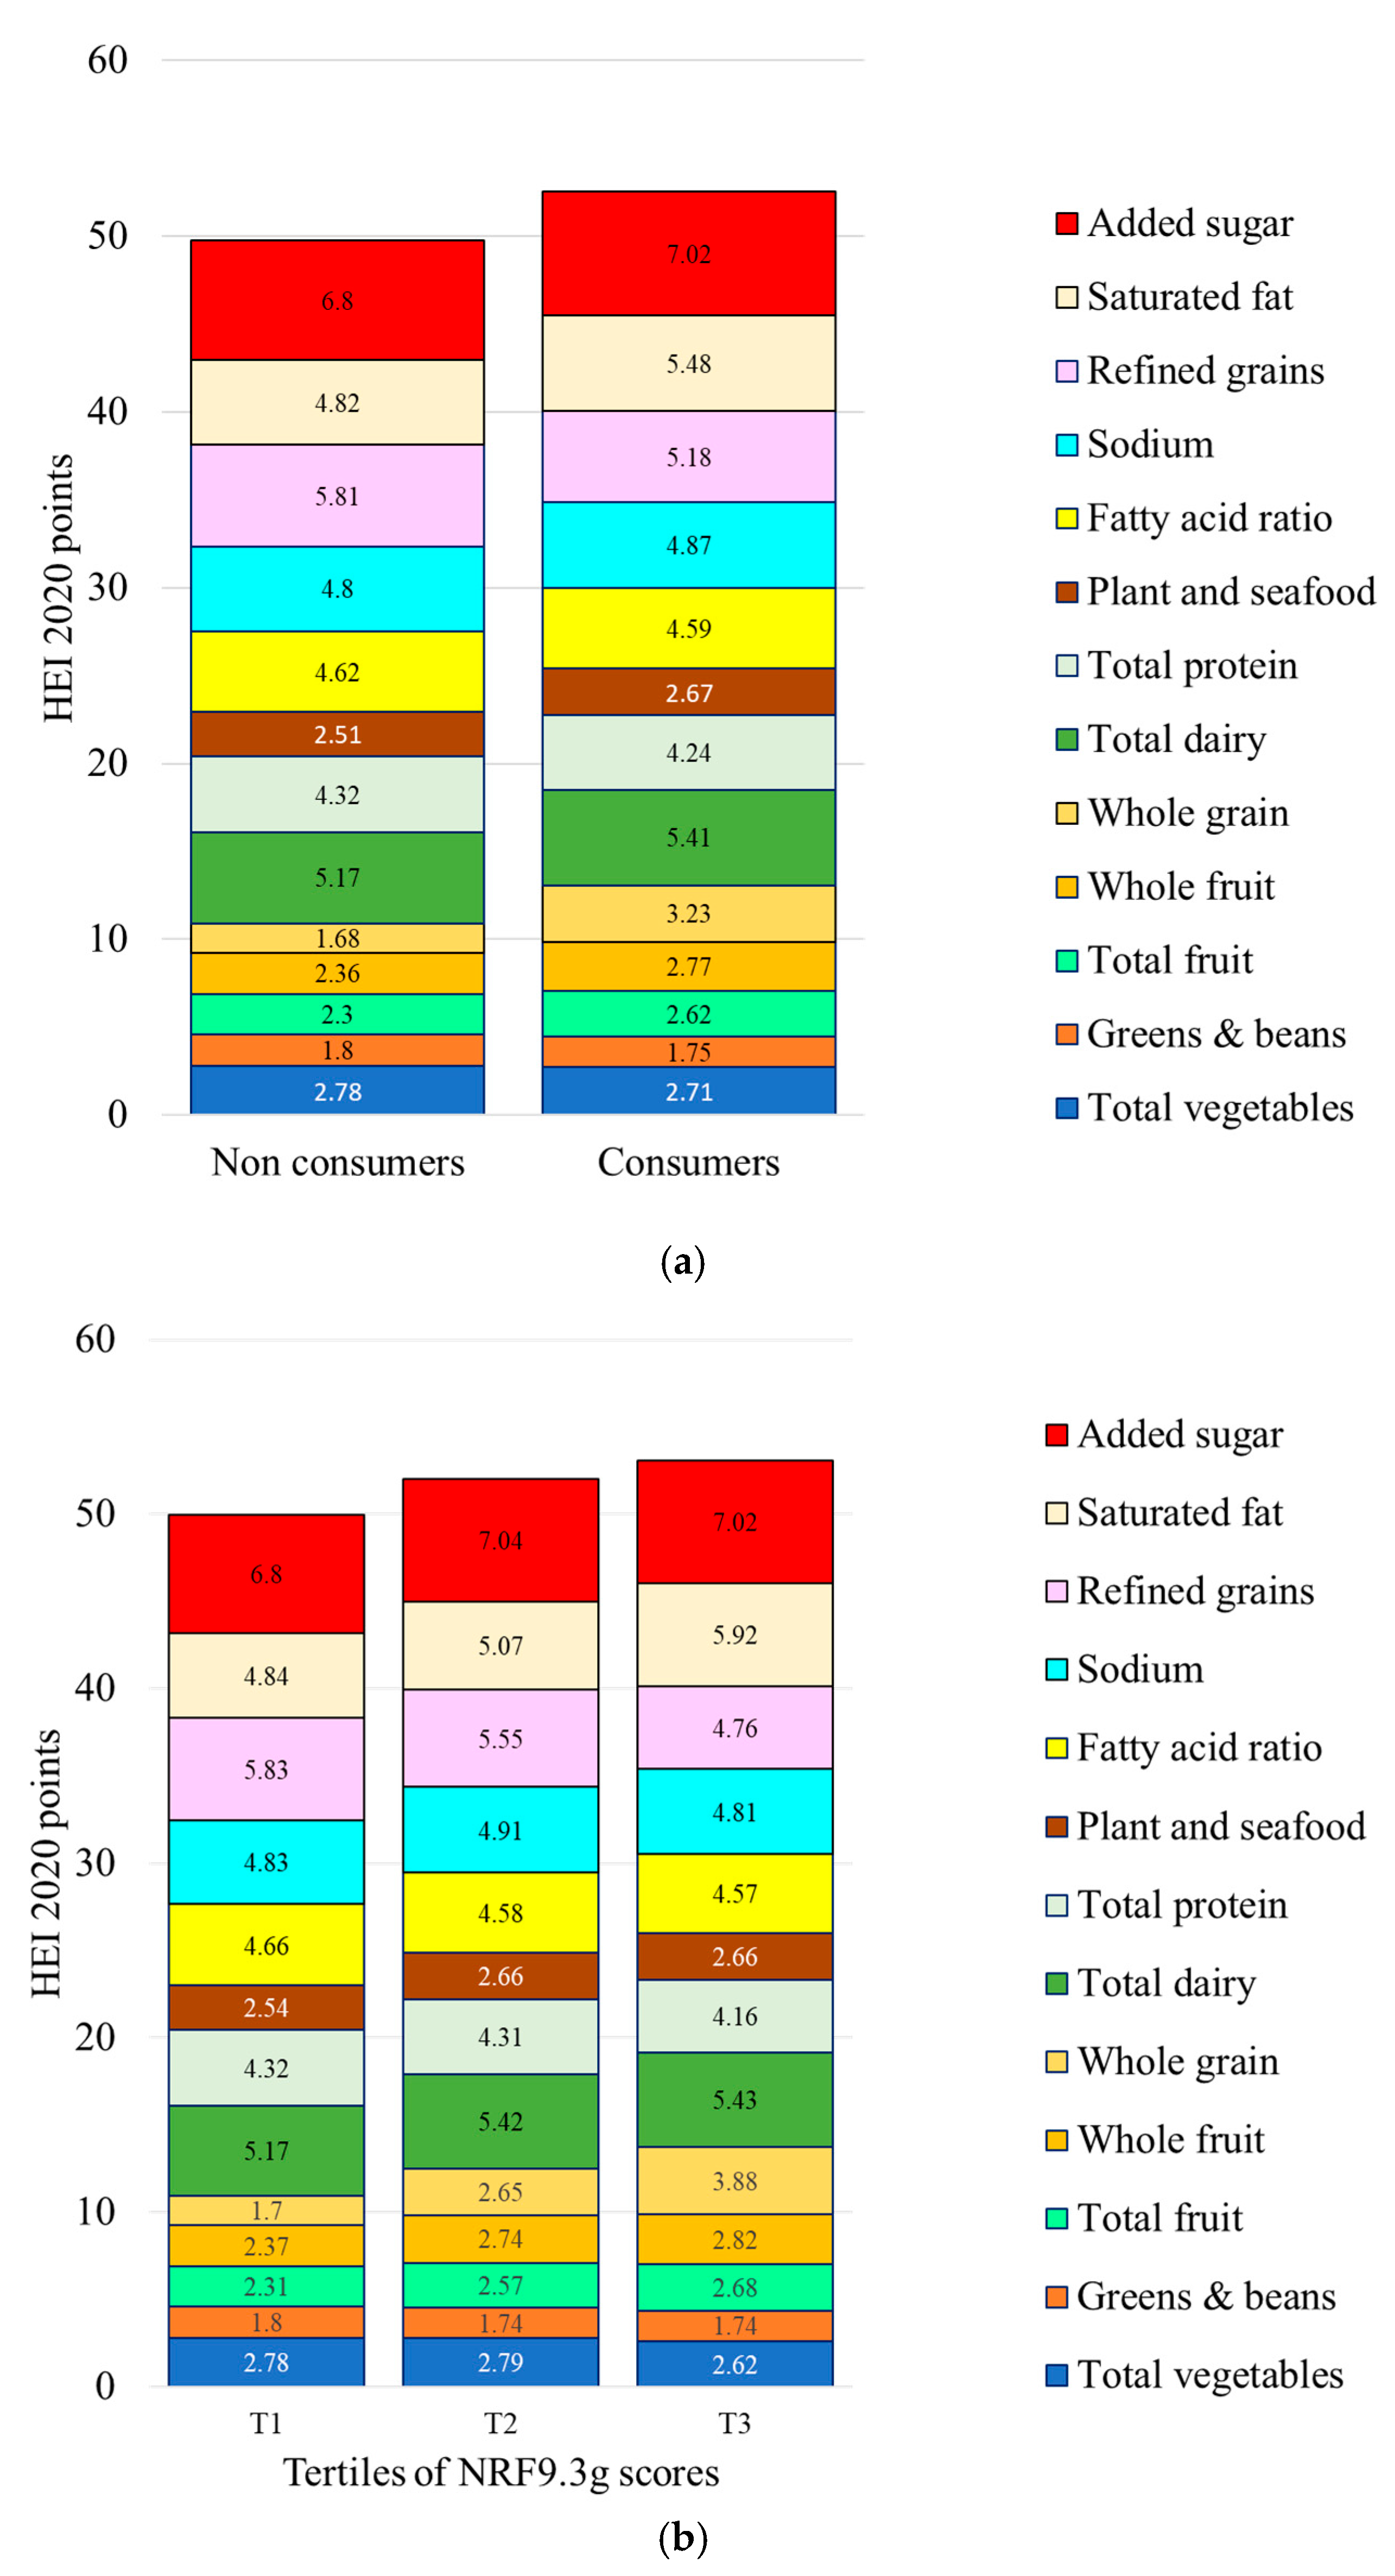
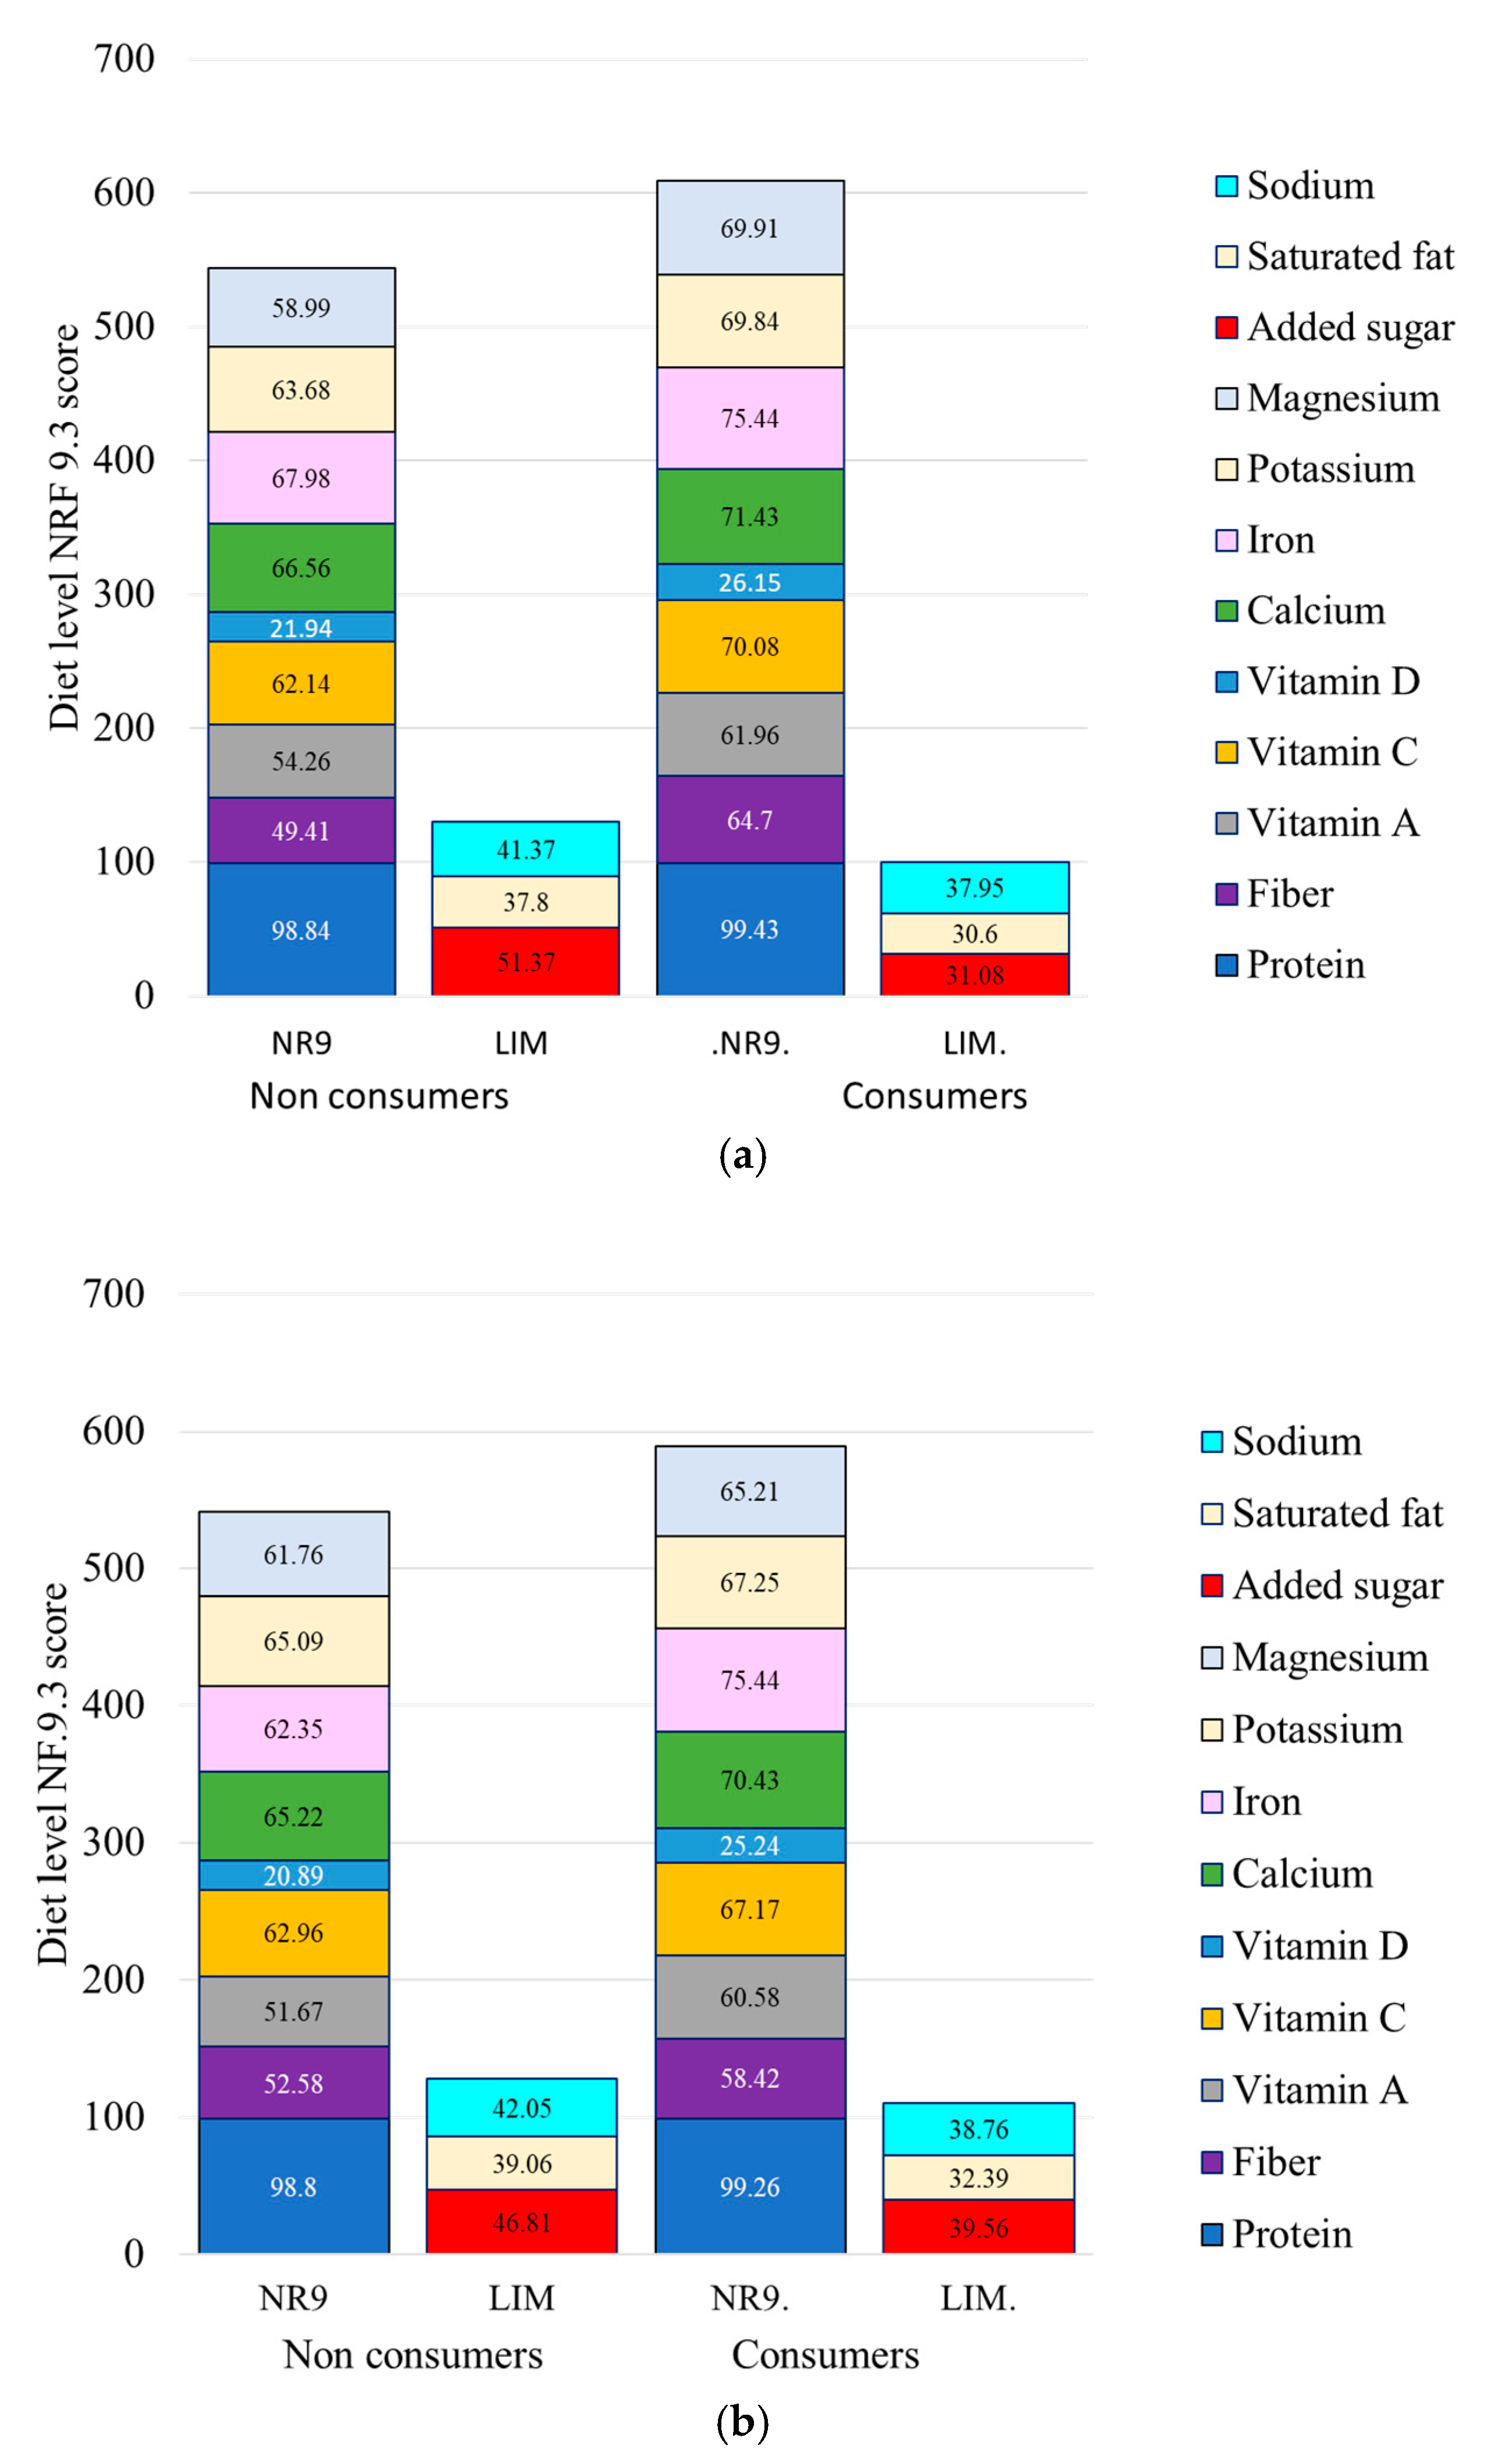
3.5. Healthy Grains and Diet Quality Metrics: Diet-Level NRF Score
3.6. The Price of Healthy Grain Foods
3.7. Analysis of Cross Sectional Health Outcomes
4. Discussion
4.1. Healthy Grain Foods and Consumption Patterns
4.2. Healthy Grains Consumption, Diet Quality and Selected Health Outcomes
4.3. Healthy Grain Foods in the NOVA Classification System
4.4. Study Limitations
5. Conclusions
Supplementary Materials
Author Contributions
Funding
Institutional Review Board Statement
Informed Consent Statement
Data Availability Statement
Acknowledgments
Conflicts of Interest
References
- U.S. Department of Agriculture; U.S. Department of Health and Human Services. Dietary Guidelines for Americans, 2020–2025. U.S. Department of Agriculture 2020. Available online: https://www.dietaryguidelines.gov (accessed on 12 June 2025).
- U.S. Department of Agriculture; U.S. Department of Health and Human Services. Dietary Guidelines Advisory Committee Report, 2025–2030. Available online: https://www.dietaryguidelines.gov/2025-advisory-committee-report (accessed on 4 August 2025).
- Poutanen, K.S.; Kårlund, A.O.; Gómez-Gallego, C.; Johansson, D.P.; Scheers, N.M.; Marklinder, I.M.; Eriksen, A.K.; Silventoinen, P.C.; Nordlund, E.; Sozer, N.; et al. Grains—A Major Source of Sustainable Protein for Health. Nutr. Rev. 2022, 80, 1648–1663. [Google Scholar] [CrossRef]
- Mobley, A.R.; Slavin, J.L.; Hornick, B.A. The Future of Recommendations on Grain Foods in Dietary Guidance. J. Nutr. 2013, 143, 1527S–1532S. [Google Scholar] [CrossRef] [PubMed]
- Ferruzzi, M.G.; Jonnalagadda, S.S.; Liu, S.; Marquart, L.; McKeown, N.; Reicks, M.; Riccardi, G.; Seal, C.J.; Slavin, J.; Thielecke, F.; et al. Developing a standard definition of whole-grain foods for dietary recommendations: Summary report of a multidisciplinary expert roundtable discussion. Adv. Nutr. 2014, 5, 198–207. [Google Scholar] [CrossRef]
- Reicks, M.; Jonnalagadda, S.; Albertson, A.M.; Joshi, N. Total dietary fiber and whole grain intake in relation to dietary quality in U.S. adults: National Health and Nutrition Examination Survey 2003–2006. Nutr. Res. 2014, 34, 226–234. [Google Scholar] [CrossRef]
- Albertson, A.M.; Thompson, D.; Franko, D.L.; Kleinman, R.E.; Barton, B.A.; Crockett, S.J. Consumption of breakfast cereal is associated with positive health outcomes: Evidence from the National Health and Nutrition Examination Survey (NHANES). Public Health Nutr. 2008, 11, 608–615. [Google Scholar] [CrossRef]
- Smith, J.D.; Jain, N.; Bailey, R.L. Ready-to-eat cereal fortification: A modelling study on the impact of changing ready-to-eat cereal fortification levels on population intake of nutrients. Public Health Nutr. 2020, 23, 2165–2178. [Google Scholar] [CrossRef]
- Smith, J.; Jain, N.; Normington, J.; Holschuh, N.; Zhu, Y. Associations of ready-to-eat cereal consumption and income with dietary outcomes: Results from the National Health and Nutrition Examination Survey 2015–2018. Front. Nutr. 2022, 9, 816548. [Google Scholar] [CrossRef]
- Drewnowski, A.; Fulgoni, V.L. Nutrient Density: Principles and Evaluation Tools. Am. J. Clin. Nutr. 2014, 99, 1223S–1228S. [Google Scholar] [CrossRef] [PubMed]
- Van Der Bend, D.L.M.; Van Eijsden, M.; Van Roost, M.H.I.; De Graaf, K.; Roodenburg, A.J.C. The Nutri-Score Algorithm: Evaluation of Its Validation Process. Front. Nutr. 2022, 9, 974003. [Google Scholar] [CrossRef]
- Byron, C.; Kissock, K.R.; Barrett, E.M.; Koerner, T.B.; Baker, M.; Hendrie, G.A. Aligning front-of-pack labelling with dietary guidelines: Including whole grains in the Health Star Rating. Eur. J. Nutr. 2024, 63, 2025–2033. [Google Scholar] [CrossRef] [PubMed]
- Liu, J.; Rehm, C.D.; Shi, P.; McKeown, N.M.; Mozaffarian, D.; Micha, R. A Comparison of Different Practical Indices for Assessing Carbohydrate Quality among Carbohydrate-Rich Processed Products in the US. PLoS ONE 2020, 15, e0231572. [Google Scholar] [CrossRef] [PubMed]
- Tan, D.; Drewnowski, A.; Lê, K.-A. New Metrics of Dietary Carbohydrate Quality. Curr. Opin. Clin. Nutr. Metab. Care 2023, 26, 358–363. [Google Scholar] [CrossRef]
- Tan, D.; Olden, A.; Orengo, A.; Francey, C.; Campos, V.; Fayet-Moore, F.; Kim, J.; Lê, K.-A. An Assessment of Three Carbohydrate Metrics of Nutritional Quality for Packaged Foods and Beverages in Australia and Southeast Asia. Nutrients 2020, 12, 2771. [Google Scholar] [CrossRef]
- Schulz, R.; Slavin, J. Perspective: Defining Carbohydrate Quality for Human Health and Environmental Sustainability. Adv. Nutr. 2021, 12, 1108–1121. [Google Scholar] [CrossRef]
- Comerford, K.B.; Papanikolaou, Y.; Jones, J.M.; Rodriguez, J.; Slavin, J.; Angadi, S.; Drewnowski, A. Toward an Evidence-Based Definition and Classification of Carbohydrate Food Quality: An Expert Panel Report. Nutrients 2021, 13, 2667. [Google Scholar] [CrossRef]
- Drewnowski, A.; Maillot, M.; Papanikolaou, Y.; Jones, J.M.; Rodriguez, J.; Slavin, J.; Angadi, S.S.; Comerford, K.B. A New Carbohydrate Food Quality Scoring System to Reflect Dietary Guidelines: An Expert Panel Report. Nutrients 2022, 14, 1485. [Google Scholar] [CrossRef]
- Comerford, K.B.; Drewnowski, A.; Papanikolaou, Y.; Jones, J.M.; Slavin, J.; Angadi, S.S.; Rodriguez, J. Application of a New Carbohydrate Food Quality Scoring System: An Expert Panel Report. Nutrients 2023, 15, 1288. [Google Scholar] [CrossRef] [PubMed]
- Fulgoni, V.L.; Keast, D.R.; Drewnowski, A. Development and Validation of the Nutrient-Rich Foods Index: A Tool to Measure Nutritional Quality of Foods. J. Nutr. 2009, 139, 1549–1554. [Google Scholar] [CrossRef]
- National Cancer Institute. Developing the Healthy Eating Index (HEI). 2025. Available online: https://epi.grants.cancer.gov/hei/developing.html (accessed on 12 June 2025).
- Centers for Disease Control and Prevention. NHANES Survey Methods and Analytic Guidelines. 2025. Available online: https://wwwn.cdc.gov/nchs/nhanes/analyticguidelines.aspx (accessed on 12 June 2025).
- Centers for Disease Control and Prevention. 2017–March 2020 Pre-Pandemic Laboratory Data—Continuous NHANES. 2020. Available online: https://wwwn.cdc.gov/nchs/nhanes/search/datapage.aspx?Component=Laboratory&Cycle=2017-2020 (accessed on 12 June 2025).
- National Center for Health Statistics. National Health and Nutrition Examination Survey (NHANES) Ethics Review Board Approval. Available online: https://www.cdc.gov/nchs/nhanes/about/erb.html (accessed on 4 August 2025).
- U.S. Department of Agriculture, Agricultural Research Service. Food and Nutrient Database for Dietary Studies (FNDDS). 2024. Available online: https://catalog.data.gov/dataset/food-and-nutrient-database-for-dietary-studies-fndds-f9910 (accessed on 15 August 2024).
- U.S. Department of Agriculture, Agricultural Research Service. Food Patterns Equivalents Database. 2025. Available online: http://ars.usda.gov/northeast-area/beltsville-md-bhnrc/beltsville-human-nutrition-research-center/food-surveys-research-group/docs/fped-databases/ (accessed on 8 April 2025).
- World Health Organization. Body Mass Index. 2024. Available online: https://www.who.int/data/gho/data/themes/topics/topic-details/GHO/body-mass-index (accessed on 5 August 2025).
- Centers for Disease Control Evidence Based Guidelines for Childhood Obesity. 2024. Available online: https://www.cdc.gov/obesity/child-obesity-strategies/evidence-based-guidelines.html (accessed on 5 August 2025).
- Huang, P.L. A comprehensive definition for metabolic syndrome. Dis. Model Mech. 2009, 2, 231–237. [Google Scholar] [CrossRef] [PubMed] [PubMed Central]
- U.S. Department of Agriculture. Economic Research Service. Purchase to Plate Tool. Available online: https://www.ers.usda.gov/data-products/purchase-to-plate (accessed on 5 August 2025).
- U.S. Department of Agriculture. Thrifty Food Plan; U.S. Department of Agriculture: Washington, DC, USA, 2021; Available online: https://fns-prod.azureedge.us/sites/default/files/resource-files/TFP2021.pdf (accessed on 5 August 2025).
- Fulgoni, V.L.; Chu, Y.; O’Shea, M.; Slavin, J.L. Whole-grain consumption is associated with diet quality and nutrient intake in children and adults: The National Health and Nutrition Examination Survey, 2009–2012. Nutr. Res. 2015, 35, 161–168. [Google Scholar] [CrossRef]
- O’Neil, C.E.; Zanovec, M.; Cho, S.S.; Nicklas, T.A. Whole-grain consumption is associated with diet quality and nutrient intake in adults: The National Health and Nutrition Examination Survey 1999–2004. J. Am. Diet. Assoc. 2010, 110, 1461–1468. [Google Scholar] [CrossRef] [PubMed]
- Darmon, N.; Drewnowski, A. Does social class predict diet quality? Am. J. Clin. Nutr. 2008, 87, 1107–1117. [Google Scholar] [CrossRef] [PubMed]
- Blumfield, M.; McConnell, A.; Cassettari, T.; Petocz, P.; Warner, M.; Campos, V.; Lê, K.-A.; Minehira, K.; Marshall, S.; Fayet-Moore, F. Balanced Carbohydrate Ratios Are Associated with Improved Diet Quality in Australia: A Nationally Representative Cross-Sectional Study. PLoS ONE 2021, 16, e0253582. [Google Scholar] [CrossRef]
- Cacau, L.T.; Sampaio, H.A.C.; Carioca, A.A.F.; Bezerra, I.N.; Pinheiro, L.G.P.; Vasques, P.H.D.; Rocha, D.C.; Meneses, A.F.; Mendes, A.L.R.F. Higher Carbohydrate Quality Index Is Associated with Better Adequate Micronutrient Consumption in Brazilian Women. Nutr. Hosp. 2022, 39, 594–602. [Google Scholar] [CrossRef]
- Reynolds, A.; Mann, J.; Cummings, J.; Winter, N.; Mete, E.; Te Morenga, L. Carbohydrate Quality and Human Health: A Series of Systematic Reviews and Meta-Analyses. Lancet 2019, 393, 434–445. [Google Scholar] [CrossRef] [PubMed]
- Sievenpiper, J.L. Low-Carbohydrate Diets and Cardiometabolic Health: The Importance of Carbohydrate Quality over Quantity. Nutr. Rev. 2020, 78, 69–77. [Google Scholar] [CrossRef]
- Choumenkovitch, S.F.; McKeown, N.M.; Tovar, A.; Hyatt, R.R.; Kraak, V.I.; Hastings, A.V.; Herzog, J.B.; Economos, C.D. Whole Grain Consumption Is Inversely Associated with BMI Z-Score in Rural School-Aged Children. Public Health Nutr. 2013, 16, 212–218. [Google Scholar] [CrossRef] [PubMed]
- Wang, Y.; Feng, J.; Liu, T.; Gong, Z.; Zhuo, Q. Association between Whole-Grain Intake and Obesity Defined by Different Anthropometric Indicators and Dose–Response Relationship Analysis among U.S. Adults: A Population-Based Study. Nutrients 2024, 16, 2373. [Google Scholar] [CrossRef]
- McKeown, N.M.; Troy, L.M.; Jacques, P.F.; Hoffmann, U.; O’Donnell, C.J.; Fox, C.S. Whole- and Refined-Grain Intakes Are Differentially Associated with Abdominal Visceral and Subcutaneous Adiposity in Healthy Adults: The Framingham Heart Study. Am. J. Clin. Nutr. 2010, 92, 1165–1171. [Google Scholar] [CrossRef]
- Pereira, M.A.; Jacobs, D.R.; Slattery, M.L.; Ruth, K.J.; Van Horn, L.; Hilner, J.E.; Kushi, L.H. The Association of Whole Grain Intake and Fasting Insulin in a Biracial Cohort of Young Adults: The CARDIA Study. CVD Prev. 1998, 1, 231–242. [Google Scholar]
- Aune, D.; Keum, N.; Giovannucci, E.; Fadnes, L.T.; Boffetta, P.; Greenwood, D.C.; Tonstad, S.; Vatten, L.J.; Riboli, E.; Norat, T. Whole grain consumption and risk of cardiovascular disease, cancer, and all cause and cause specific mortality: Systematic review and dose-response meta-analysis of prospective studies. BMJ 2016, 353, i2716. [Google Scholar] [CrossRef] [PubMed]
- GBD 2017 Diet Collaborators. Health effects of dietary risks in 195 countries, 1990–2017: A systematic analysis for the Global Burden of Disease Study 2017. Lancet 2019, 393, 1958–1972. [Google Scholar] [CrossRef] [PubMed]
- Make America Healthy Again Commission. MAHA Report. 2025. Available online: https://www.whitehouse.gov/wp-content/uploads/2025/05/MAHA-Report-The-White-House.pdf (accessed on 12 June 2025).
- Steele, E.M.; O’Connor, L.E.; Juul, F.; Khandpur, N.; Galastri Baraldi, L.; Monteiro, C.A.; Parekh, N.; Herrick, K.A. Identifying and Estimating Ultraprocessed Food Intake in the US NHANES According to the Nova Classification System of Food Processing. J. Nutr. 2023, 153, 225–241. [Google Scholar] [CrossRef]
- Scuccimarra, E.A.; Arnaud, A.; Tassy, M.; Lê, K.-A.; Mainardi, F. Predicting Carbohydrate Quality in a Global Database of Packaged Foods. Front. Nutr. 2025, 12, 1530846. [Google Scholar] [CrossRef] [PubMed]
| CFQS-3 | Component Scores | Score Range |
|---|---|---|
| Fiber | 1 point if fiber >10 g/100 g carb portion; else 0 point | 0 to 1 |
| Added sugars | 1 point if added sugar <10 g/100 g carb portion; else 0 point | 0 to 1 |
| Whole grains | 1 point if whole grains >25 g/100 g dry weight; else 0 point | 0 to 1 |
| CFQS-3 | Sum of points | 0 to 3 |
| NRF9.3g Identifies Healthy Grain Foods | NRF Identifies Healthy Diets | ||
|---|---|---|---|
| Nutrients | Reference Daily Values | Nutrients | Reference Daily Values |
| Protein | 50 g | Protein | 50 g |
| Fiber | 28 g | Fiber | 28 g |
| Iron | 18 mg | Vitamin A | 900 mcg RAE |
| Vitamin B1 (thiamin) | 1.2 mg | Vitamin C | 90 mg |
| Vitamin B2 (riboflavin) | 1.3 mg | Iron | 18 mg |
| Vitamin B3 (niacin) | 16 mg | Potassium | 4700 mg |
| Folate | 400 mcg | Magnesium | 420 mg |
| Magnesium | 420 mg | Calcium | 1300 mg |
| Vitamin E | 15 mg | Vitamin D | 20 mcg |
| Added sugar | 50 g | Added sugar | 50 g |
| Saturated fatty acid | 20 g | Saturated fatty acid | 20 g |
| Sodium | 2300 mg | Sodium | |
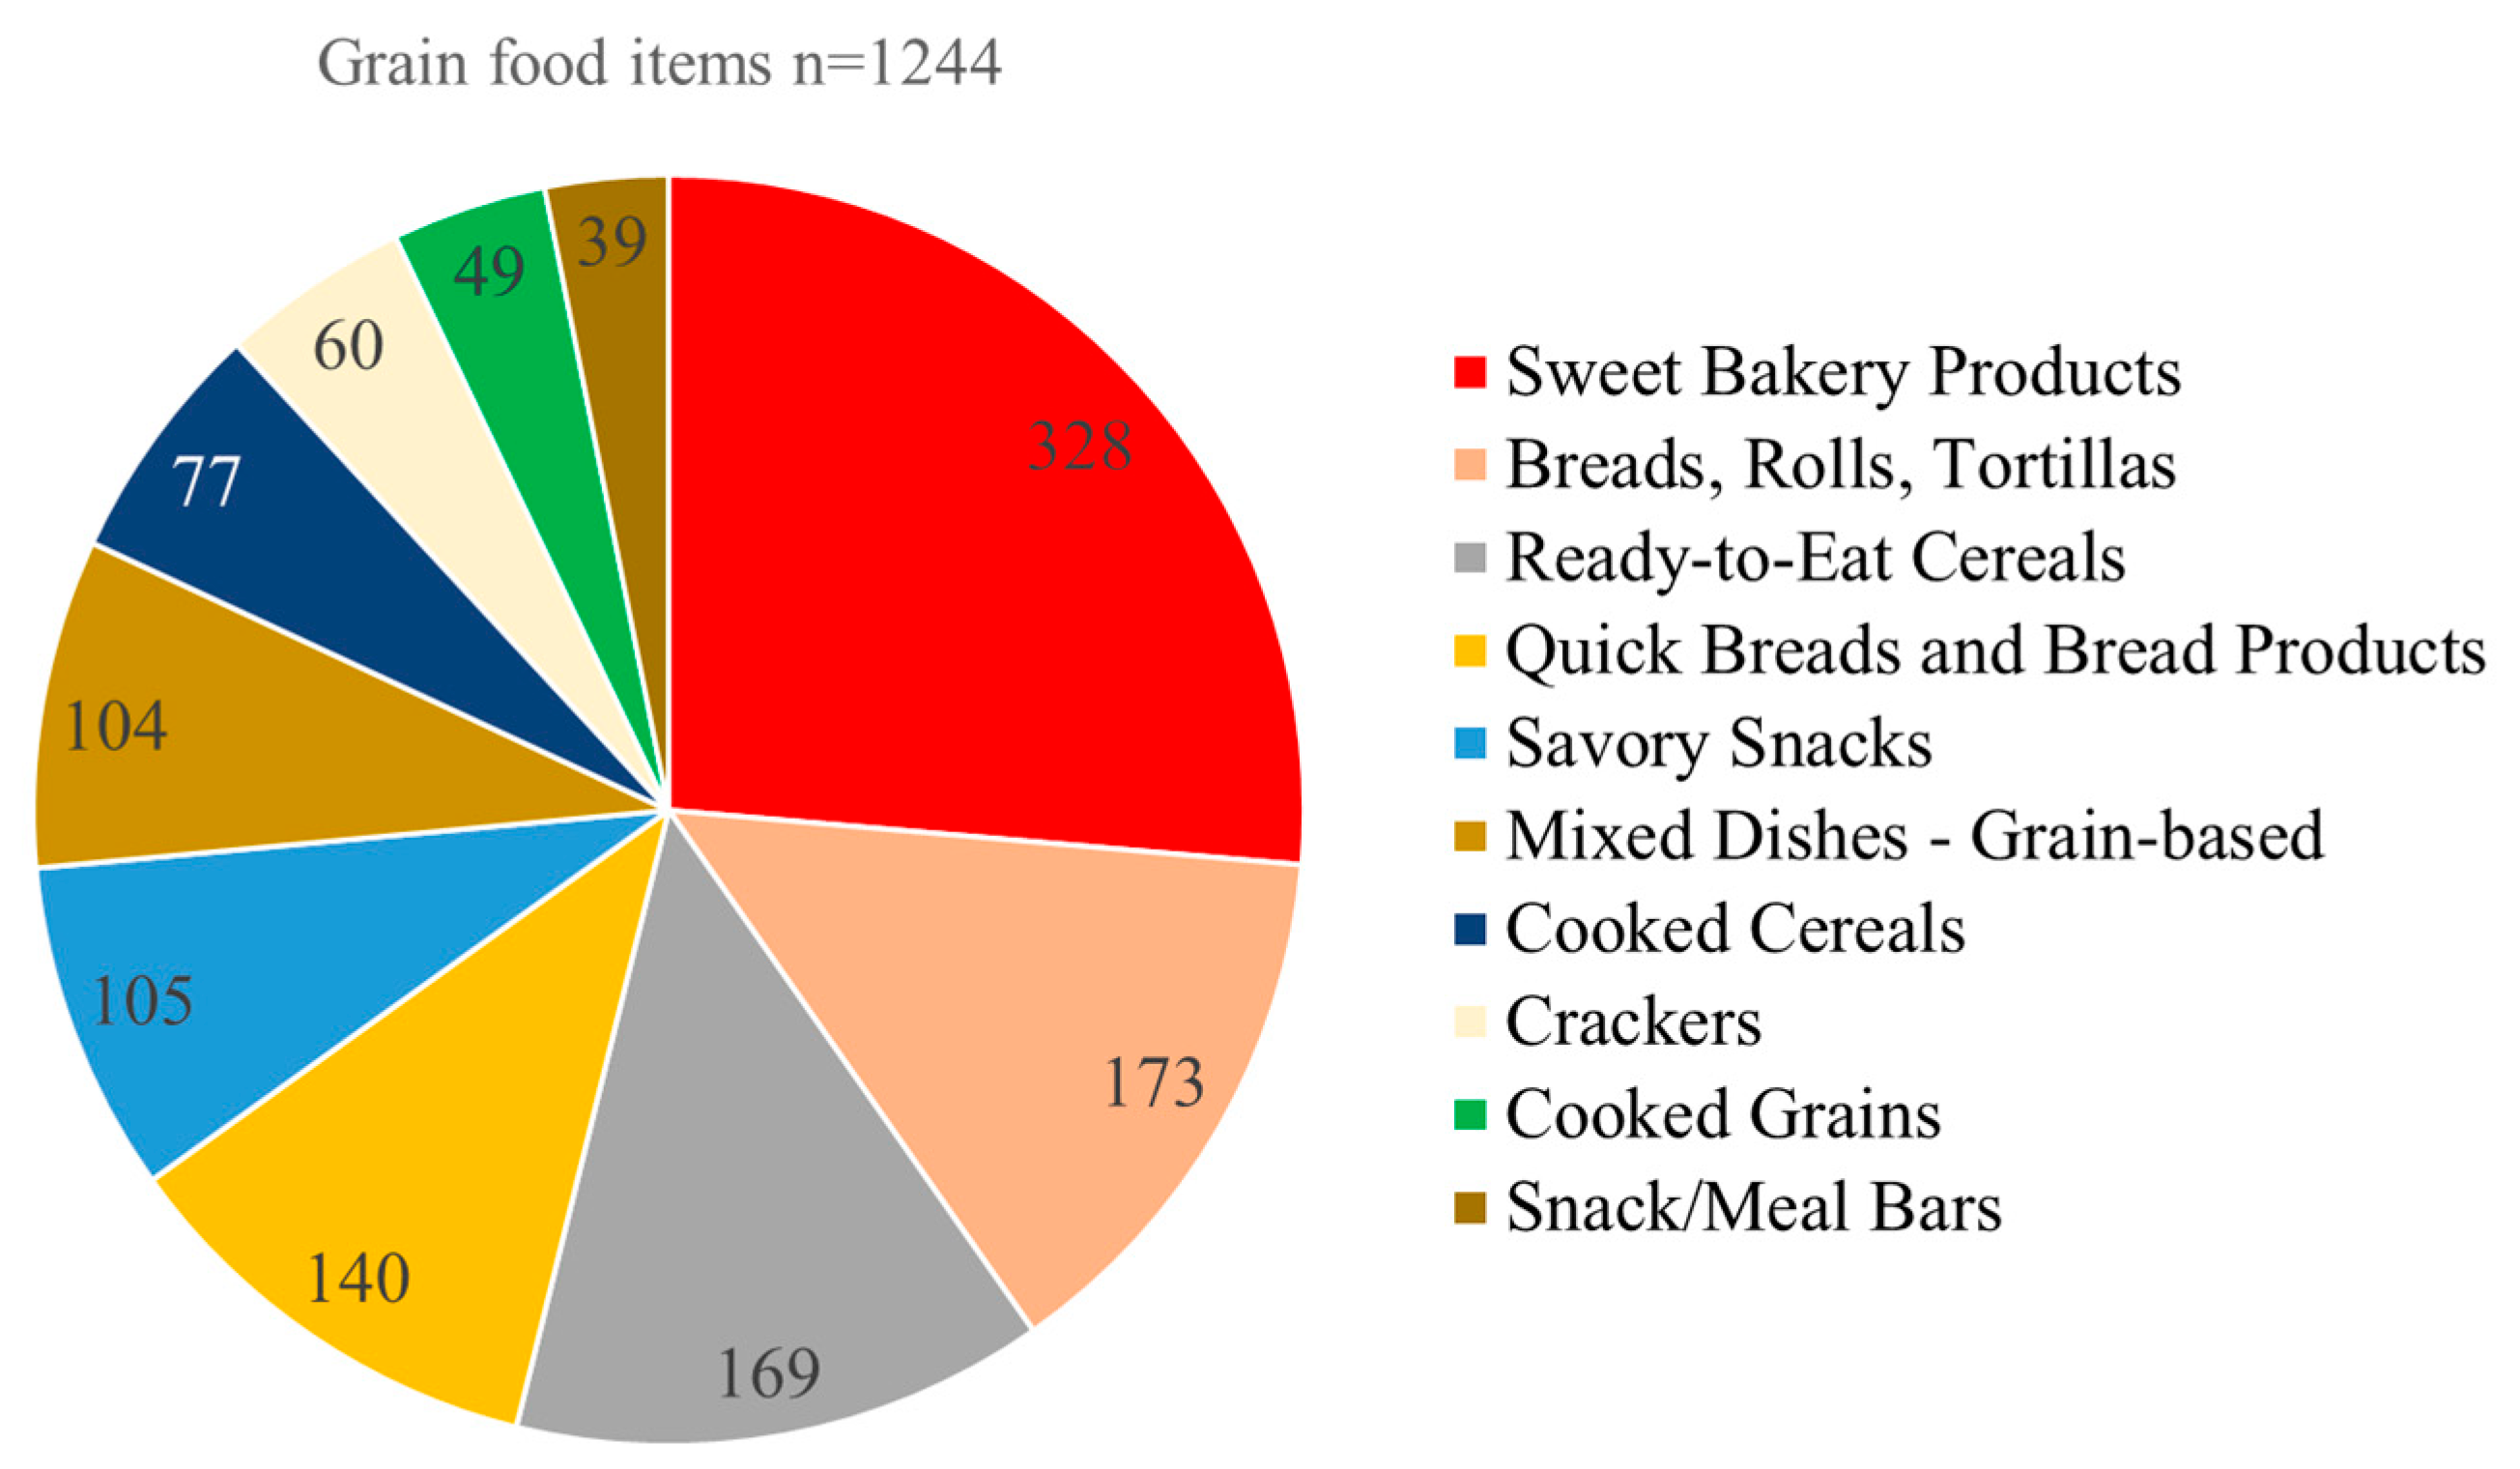
| Grain Categories | N | Fiber 1 | Added Sugar 2 | Whole Grain 3 |
|---|---|---|---|---|
| All Grain Foods | 1244 | 21.4 | 43.8 | 30.7 |
| Cooked Cereals | 77 | 42.8 | 66.2 | 54.5 |
| Cooked Grains | 49 | 30.6 | 97.9 | 44.8 |
| Savory Snacks | 105 | 39.0 | 86.6 | 49.5 |
| Ready-to-Eat Cereals | 169 | 40.2 | 12.4 | 71.0 |
| Breads, Rolls, Tortillas | 173 | 30.6 | 72.8 | 33.5 |
| Crackers | 60 | 30.0 | 63.3 | 31.6 |
| Mixed Dishes—Grain-based | 104 | 12.5 | 96.1 | 29.8 |
| Quick Breads and Bread Products | 140 | 6.4 | 36.4 | 20.7 |
| Snack/Meal Bars | 39 | 23.0 | 0.0 | 10.2 |
| Sweet Bakery Products | 328 | 2.4 | 6.0 | 1.5 |
| Grain Categories | N | Mean | SD | Min | Max |
|---|---|---|---|---|---|
| All grain foods | 1244 | 40.9 | 51.2 | −28.0 | 608.7 |
| Ready-to-Eat Cereals | 169 | 128.7 | 76.0 | 25.8 | 608.7 |
| Cooked Cereals | 77 | 52.9 | 27.4 | 0.5 | 144.2 |
| Breads, Rolls, Tortillas | 173 | 49.5 | 11.8 | 15.5 | 80.9 |
| Snack/Meal Bars | 39 | 48.7 | 59.4 | −19.5 | 283.8 |
| Mixed Dishes—Grain-based | 104 | 40.1 | 15.0 | −23.8 | 77.5 |
| Cooked Grains | 49 | 33.8 | 13.1 | 0.3 | 60.7 |
| Crackers | 60 | 30.5 | 11.1 | 8.4 | 61.9 |
| Quick Breads and Bread Products | 140 | 29.1 | 19.7 | −1.6 | 87.7 |
| Savory Snacks | 105 | 21.2 | 16.1 | −26.8 | 60.4 |
| Sweet Bakery Products | 328 | 2.0 | 12.7 | −28.0 | 47.7 |
| Total Grain Foods | Healthy Grains Defined by CFQS-3 | Healthy Grains Defined by NRF9.3g | ||||||||||||||
|---|---|---|---|---|---|---|---|---|---|---|---|---|---|---|---|---|
| g/d | g/d | % of Total Grains | g/d | % of Total Grains | ||||||||||||
| N | Mean | SD | p * | Mean | SD | p | Mean | SD | p | Mean | SD | p | Mean | SD | p | |
| All | 14,720 | 160.45 | 139.58 | 35.78 | 76.64 | 19.09 | 28.57 | 53.13 | 76.72 | 33.02 | 33.28 | |||||
| Income-to-poverty ratio | ||||||||||||||||
| 0–0.99 | 2583 | 149.38 | 145.44 | 0.0702 | 28.79 | 70.47 | 0.0004 | 16.39 | 28.10 | 0.0025 | 50.51 | 84.70 | 0.1337 | 33.26 | 35.03 | 0.1251 |
| 1–1.99 | 3140 | 156.26 | 146.13 | 31.89 | 72.40 | 17.67 | 28.66 | 53.55 | 81.19 | 34.25 | 34.38 | |||||
| 2–3.49 | 2941 | 159.01 | 128.87 | 31.25 | 66.17 | 17.83 | 27.39 | 51.88 | 72.40 | 32.49 | 32.80 | |||||
| 3.50–5 | 4394 | 167.37 | 137.29 | 41.41 | 85.10 | 20.78 | 28.81 | 55.87 | 75.61 | 33.49 | 32.40 | |||||
| Sex | ||||||||||||||||
| Male | 6927 | 174.27 | 158.02 | <0.0001 | 38.08 | 86.81 | 0.0071 | 18.17 | 28.54 | 0.0351 | 56.78 | 85.00 | <0.0001 | 32.52 | 33.42 | 0.1608 |
| Female | 7793 | 147.31 | 117.93 | 33.60 | 65.43 | 19.97 | 28.58 | 49.65 | 67.73 | 33.50 | 33.13 | |||||
| Age classes | ||||||||||||||||
| 6–11 y | 1678 | 165.57 | 104.21 | 0.0752 | 24.90 | 45.77 | <0.0001 | 14.28 | 21.68 | <0.0001 | 57.09 | 62.90 | <0.0001 | 34.56 | 28.71 | <0.0001 |
| 12–19 y | 2117 | 159.02 | 149.51 | 24.36 | 56.67 | 14.37 | 25.06 | 57.27 | 92.78 | 34.43 | 33.95 | |||||
| 20–59 y | 6317 | 156.81 | 145.62 | 34.53 | 77.35 | 18.64 | 29.03 | 49.24 | 75.86 | 30.97 | 33.90 | |||||
| ≥60 y | 4608 | 167.78 | 130.28 | 47.63 | 88.79 | 23.94 | 30.31 | 58.80 | 74.08 | 36.57 | 32.57 | |||||
| Ethnicity | ||||||||||||||||
| Mexican American | 1576 | 149.51 | 158.02 | <0.0001 | 41.52 | 86.81 | <0.0001 | 24.90 | 28.54 | <0.0001 | 41.26 | 85.00 | <0.0001 | 28.74 | 33.42 | <0.0001 |
| Non-Hispanic Black | 3271 | 148.13 | 134.56 | 24.58 | 62.09 | 14.23 | 26.38 | 44.54 | 69.54 | 30.15 | 34.10 | |||||
| Non-Hispanic White | 6345 | 154.56 | 129.35 | 34.69 | 74.62 | 19.02 | 28.43 | 57.53 | 79.37 | 35.97 | 33.79 | |||||
| Other Hispanic | 1447 | 162.30 | 117.93 | 33.43 | 65.43 | 18.27 | 28.58 | 45.54 | 67.73 | 27.64 | 33.13 | |||||
| Other Race-Including Multi-Racial | 2081 | 214.63 | 188.79 | 51.12 | 98.94 | 20.52 | 28.83 | 54.31 | 82.33 | 27.79 | 31.26 | |||||
| Non-Consumers and Consumers of Healthy Grains (CFQ-3 Based) | Tertiles of Consumptions of Healthy Grains (CFQS-3 Based) | ||||||||
|---|---|---|---|---|---|---|---|---|---|
| NC * | C * | Total | T1 ** [0,0] *** | T2 [0,225] | T3 [225,1400] | Total | |||
| % | % | % | p | % | % | % | % | p | |
| IPR | <0.0001 | <0.0001 | |||||||
| 0–0.99 | 14.85 | 10.75 | 12.93 | 14.85 | 11.60 | 10.43 | 12.93 | ||
| 1–1.99 | 18.53 | 15.31 | 17.03 | 18.53 | 14.90 | 15.47 | 17.03 | ||
| 2–3.49 | 20.76 | 19.96 | 20.38 | 20.76 | 22.35 | 19.07 | 20.38 | ||
| 3.50–5 | 35.70 | 43.15 | 39.17 | 35.70 | 40.19 | 44.26 | 39.17 | ||
| Sex | |||||||||
| Male | 51.84 | 45.21 | 48.75 | <0.0001 | 51.84 | 37.94 | 47.92 | 48.75 | <0.0001 |
| Female | 48.16 | 54.79 | 51.25 | 48.16 | 62.06 | 52.08 | 51.25 | ||
| Age classes | |||||||||
| 6–11 y | 7.75 | 8.65 | 8.17 | <0.0001 | 7.75 | 12.75 | 7.12 | 8.17 | <0.0001 |
| 12–19 y | 12.97 | 9.56 | 11.38 | 12.97 | 10.08 | 9.36 | 11.38 | ||
| 20–59 y | 59.76 | 51.85 | 56.07 | 59.76 | 48.61 | 53.06 | 56.07 | ||
| ≥60 y | 19.52 | 29.95 | 24.38 | 19.52 | 28.56 | 30.47 | 24.38 | ||
| Ethnicity | |||||||||
| Mexican American | 7.55 | 11.00 | 9.16 | <0.0001 | 7.55 | 8.95 | 11.76 | 9.16 | <0.0001 |
| Non-Hispanic Black | 14.51 | 8.53 | 11.72 | 14.51 | 10.16 | 7.92 | 11.72 | ||
| Non-Hispanic White | 58.67 | 60.84 | 59.68 | 58.67 | 63.50 | 59.85 | 59.68 | ||
| Other Hispanic | 9.33 | 8.06 | 8.73 | 9.33 | 7.97 | 8.09 | 8.73 | ||
| Other/Multi-Racial | 9.94 | 11.58 | 10.70 | 9.94 | 9.41 | 12.38 | 10.70 | ||
| Non-Consumers and Consumers of Healthy Grains (NRF9.3g Based) | Tertiles of Consumptions of Healthy Grains (NRF9.3g Based) | ||||||||
|---|---|---|---|---|---|---|---|---|---|
| NC * | C * | Total | p | T1 ** [0,105] *** | T2 [105,525] | T3 [525,1330] | Total | p | |
| IPR | % | % | % | % | % | % | |||
| 0–0.99 | 14.45 | 12.25 | 12.93 | 0.0012 | 14.56 | 12.26 | 12.00 | 12.93 | 0.0269 |
| 1–1.99 | 17.43 | 16.85 | 17.03 | 17.19 | 16.98 | 16.92 | 17.03 | ||
| 2–3.49 | 20.54 | 20.31 | 20.38 | 20.41 | 20.24 | 20.50 | 20.38 | ||
| 3.50–5 | 35.58 | 40.80 | 39.17 | 36.06 | 40.53 | 40.90 | 39.17 | ||
| Sex | |||||||||
| Male | 50.41 | 48.00 | 48.75 | 0.0158 | 50.10 | 44.75 | 51.34 | 48.75 | <0.0001 |
| Female | 49.59 | 52.00 | 51.25 | 49.90 | 55.25 | 48.66 | 51.25 | ||
| Age classes | |||||||||
| 6–11 y | 5.04 | 9.59 | 8.17 | <0.0001 | 5.45 | 9.31 | 9.72 | 8.17 | <0.0001 |
| 12–19 y | 11.54 | 11.30 | 11.38 | 11.48 | 10.51 | 12.12 | 11.38 | ||
| 20–59 y | 65.42 | 51.83 | 56.07 | 65.10 | 53.26 | 49.97 | 56.07 | ||
| ≥60 y | 17.99 | 27.28 | 24.38 | 17.96 | 26.93 | 28.19 | 24.38 | ||
| Ethnicity | |||||||||
| Mexican American | 9.87 | 8.84 | 9.16 | <0.0001 | 9.83 | 10.63 | 7.07 | 9.16 | <0.0001 |
| Non-Hispanic Black | 14.55 | 10.43 | 11.72 | 14.39 | 10.54 | 10.26 | 11.72 | ||
| Non-Hispanic White | 54.27 | 62.13 | 59.68 | 53.97 | 60.16 | 64.81 | 59.68 | ||
| Other Hispanic | 9.87 | 8.22 | 8.73 | 10.31 | 8.66 | 7.26 | 8.73 | ||
| Other/Multi-Racial | 11.43 | 10.38 | 10.70 | 11.50 | 10.02 | 10.59 | 10.70 | ||
| Price, $/100 g | Price, $/100 kcal | ||||||||
|---|---|---|---|---|---|---|---|---|---|
| N | Mean 2 | SD | 95% LCL | 95% UCL | Mean 2 | SD | 95% LCL | 95% UCL | |
| Sub sample 1 | 786 | 0.89 | 0.51 | 0.86 | 0.93 | 0.27 | 0.16 | 0.26 | 0.28 |
| CFQS-3 | |||||||||
| 0 point | 334 | 0.95 a | 0.40 | 0.91 | 1.00 | 0.27 a | 0.12 | 0.26 | 0.28 |
| 1 point | 259 | 0.83 b | 0.61 | 0.75 | 0.90 | 0.26 a | 0.19 | 0.24 | 0.29 |
| 2 or 3 points | 193 | 0.87 a,b | 0.50 | 0.80 | 0.94 | 0.27 a | 0.18 | 0.25 | 0.30 |
| p | 0.0100 | 0.8337 | |||||||
| NRF9.3g | |||||||||
| T1 | 281 | 1.03 a | 0.42 | 0.98 | 1.08 | 0.28 a | 0.13 | 0.27 | 0.30 |
| T2 | 231 | 0.93 a | 0.68 | 0.85 | 1.02 | 0.29 a | 0.22 | 0.26 | 0.31 |
| T3 | 274 | 0.71 b | 0.33 | 0.67 | 0.75 | 0.24 b | 0.12 | 0.23 | 0.26 |
| p | <0.001 | 0.0017 | |||||||
| CFQ-3 Based | NRF9.3 Based | |||||||
|---|---|---|---|---|---|---|---|---|
| NC * | C * | All | p | NC * | C * | All | p | |
| % | % | % | % | % | % | |||
| Body Weight | ||||||||
| Underweight | 1.72 | 2.08 | 1.89 | <0.0001 | 1.60 | 2.02 | 1.89 | <0.0001 |
| Normal weight | 29.38 | 32.27 | 30.72 | 26.91 | 32.45 | 30.72 | ||
| Overweight | 27.16 | 30.31 | 28.63 | 29.02 | 28.46 | 28.63 | ||
| Obese | 41.09 | 34.56 | 38.04 | 41.85 | 36.32 | 38.04 | ||
| Missing | 0.65 | 0.78 | 0.71 | 0.62 | 0.75 | 0.71 | ||
| Waist circumference | ||||||||
| Below | 38.27 | 40.29 | 39.22 | 0.3457 | 39.47 | 39.11 | 39.22 | 0.9649 |
| Above (Obese) | 59.13 | 57.34 | 58.28 | 58.03 | 58.40 | 58.28 | ||
| Missing | 2.61 | 2.38 | 2.50 | 2.51 | 2.49 | 2.50 | ||
| HDL cholesterol | ||||||||
| Low | 27.42 | 23.99 | 25.80 | 0.0482 | 25.04 | 26.16 | 25.80 | 0.1348 |
| High | 66.01 | 69.87 | 67.84 | 67.40 | 68.05 | 67.84 | ||
| Missing | 6.57 | 6.14 | 6.36 | 7.55 | 5.80 | 6.36 | ||
Disclaimer/Publisher’s Note: The statements, opinions and data contained in all publications are solely those of the individual author(s) and contributor(s) and not of MDPI and/or the editor(s). MDPI and/or the editor(s) disclaim responsibility for any injury to people or property resulting from any ideas, methods, instructions or products referred to in the content. |
© 2025 by the authors. Licensee MDPI, Basel, Switzerland. This article is an open access article distributed under the terms and conditions of the Creative Commons Attribution (CC BY) license (https://creativecommons.org/licenses/by/4.0/).
Share and Cite
Drewnowski, A.; Gazan, R.; Maillot, M. Healthy Grains in Healthy Diets: The Contribution of Grain Foods to Diet Quality and Health in the National Health and Nutrition Examination Survey 2017–2023. Nutrients 2025, 17, 2674. https://doi.org/10.3390/nu17162674
Drewnowski A, Gazan R, Maillot M. Healthy Grains in Healthy Diets: The Contribution of Grain Foods to Diet Quality and Health in the National Health and Nutrition Examination Survey 2017–2023. Nutrients. 2025; 17(16):2674. https://doi.org/10.3390/nu17162674
Chicago/Turabian StyleDrewnowski, Adam, Rozenn Gazan, and Matthieu Maillot. 2025. "Healthy Grains in Healthy Diets: The Contribution of Grain Foods to Diet Quality and Health in the National Health and Nutrition Examination Survey 2017–2023" Nutrients 17, no. 16: 2674. https://doi.org/10.3390/nu17162674
APA StyleDrewnowski, A., Gazan, R., & Maillot, M. (2025). Healthy Grains in Healthy Diets: The Contribution of Grain Foods to Diet Quality and Health in the National Health and Nutrition Examination Survey 2017–2023. Nutrients, 17(16), 2674. https://doi.org/10.3390/nu17162674


