
Gut Hormones and Postprandial Metabolic Effects of Isomaltulose vs. Saccharose Consumption in People with Metabolic Syndrome

 , , , ,
 .png) , ,
, ,  and
and
Abstract
1. Introduction
2. Materials and Methods
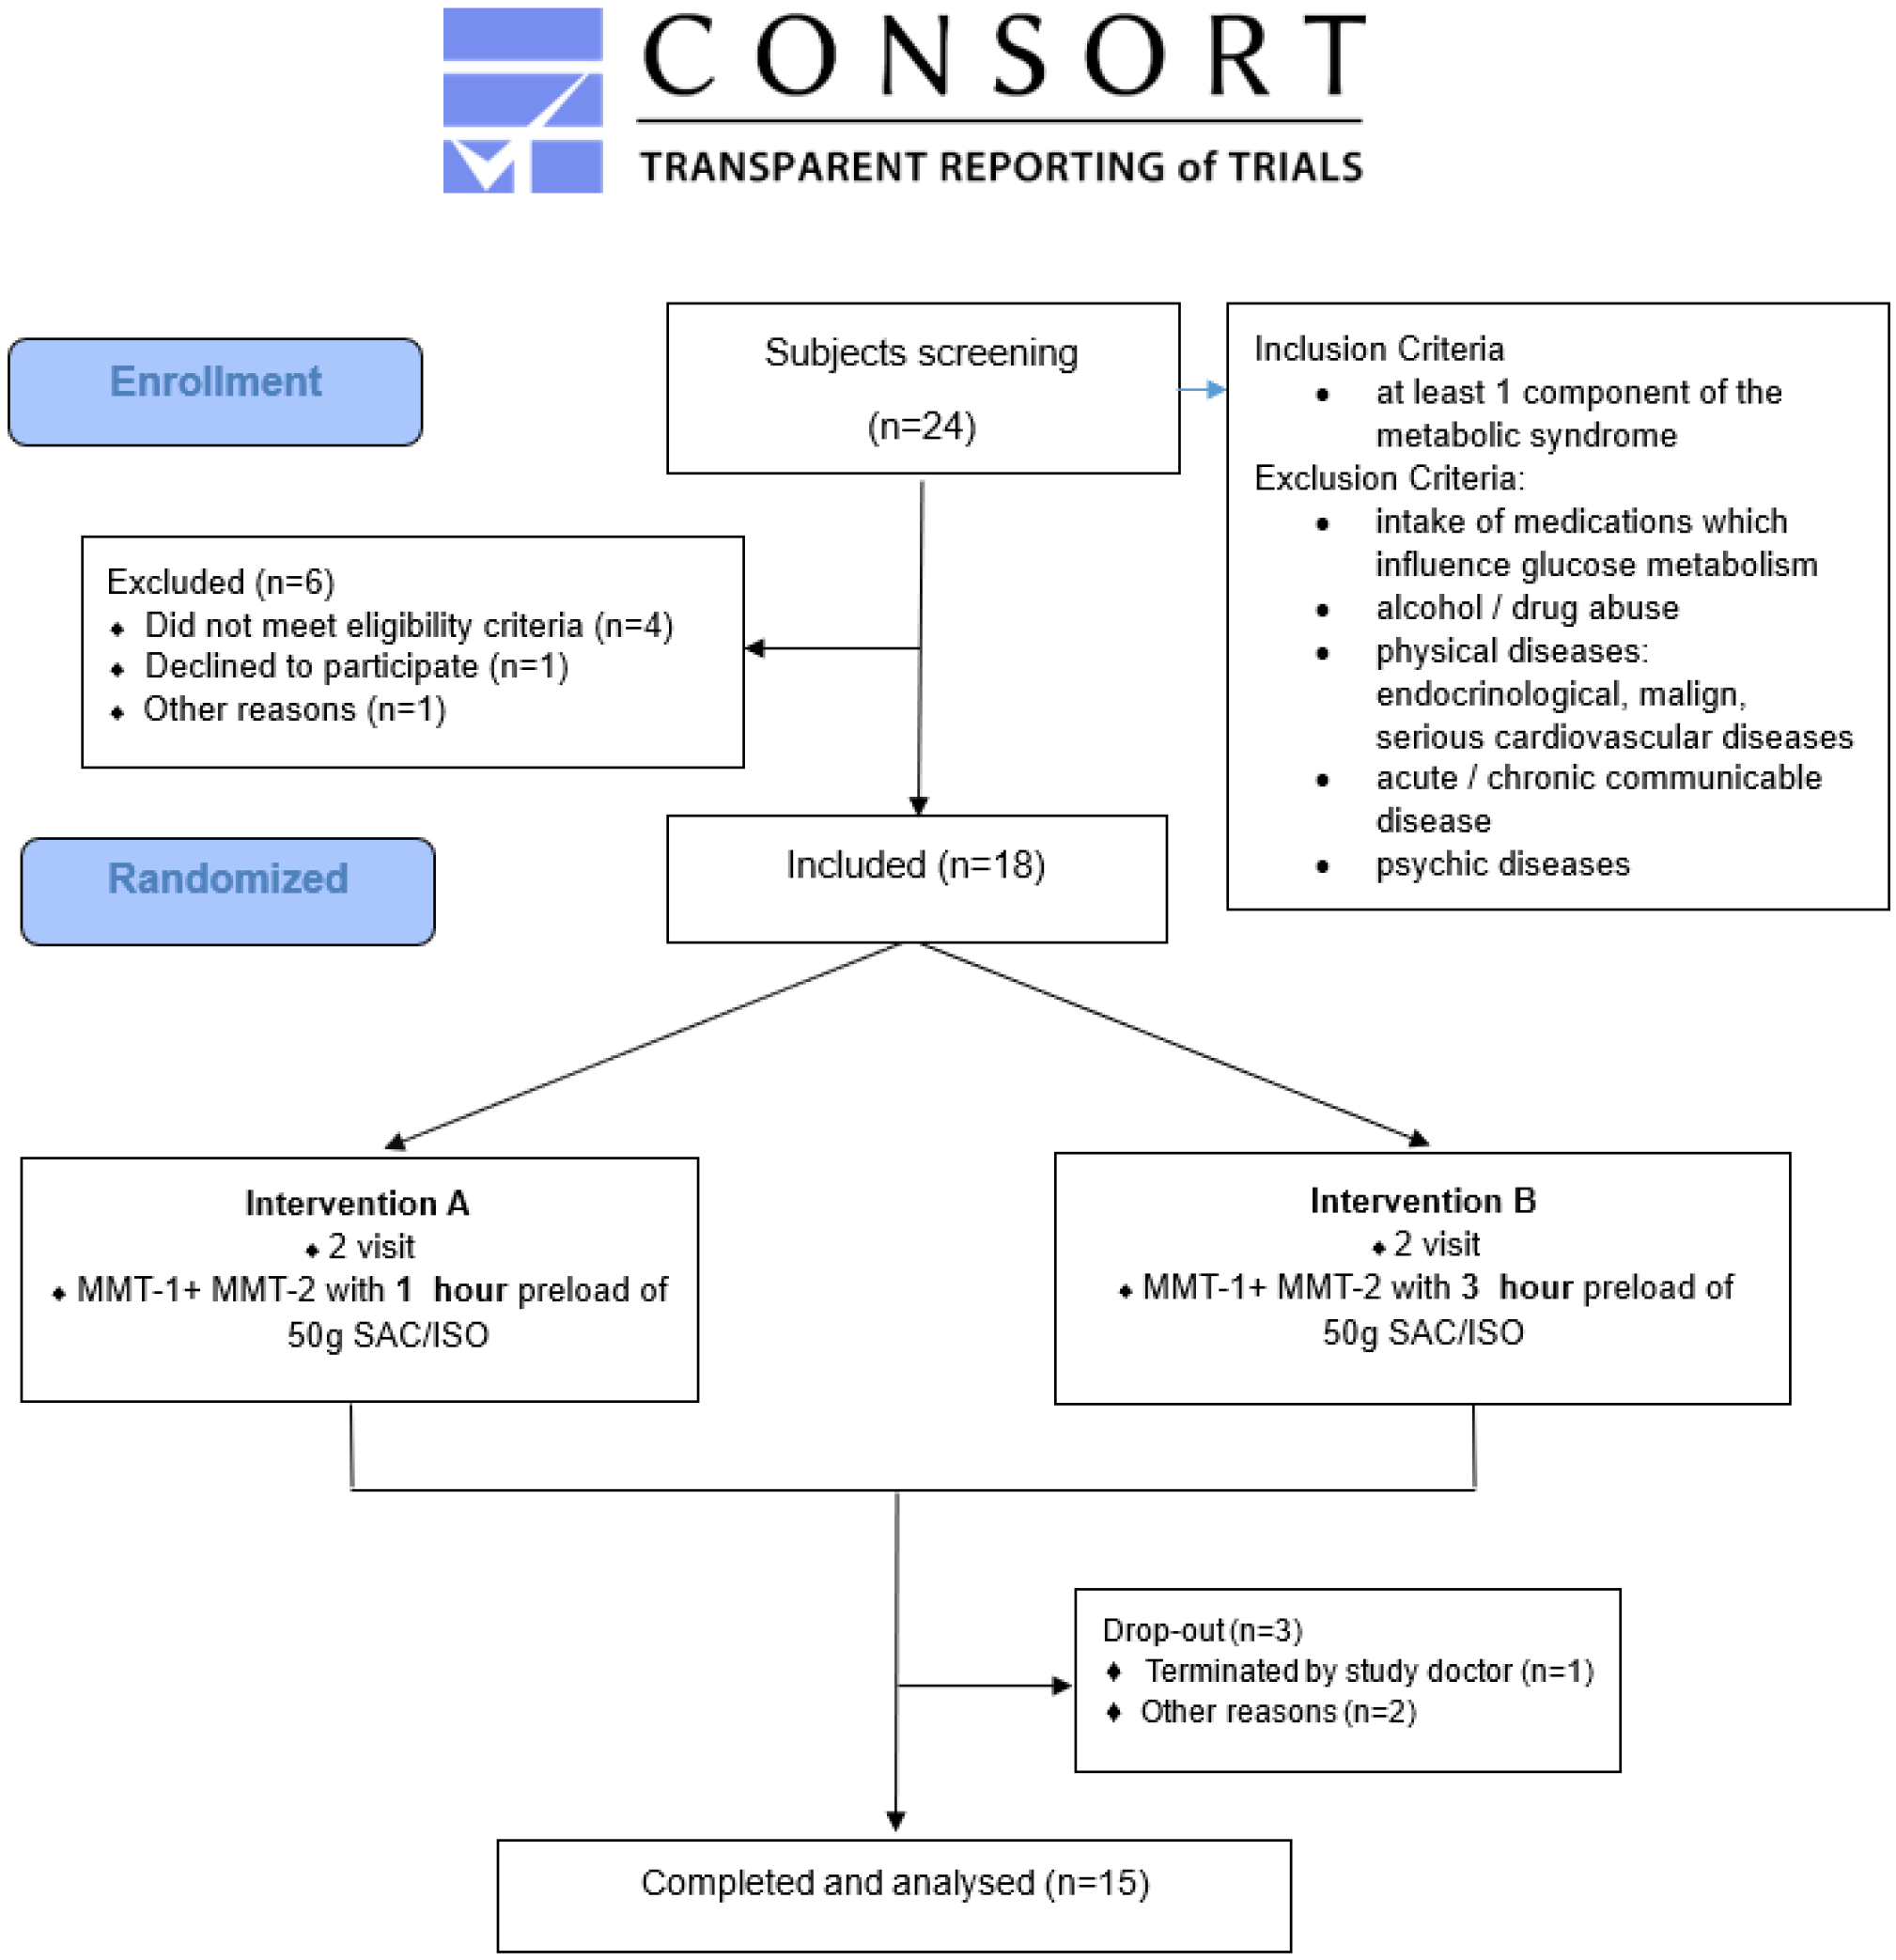
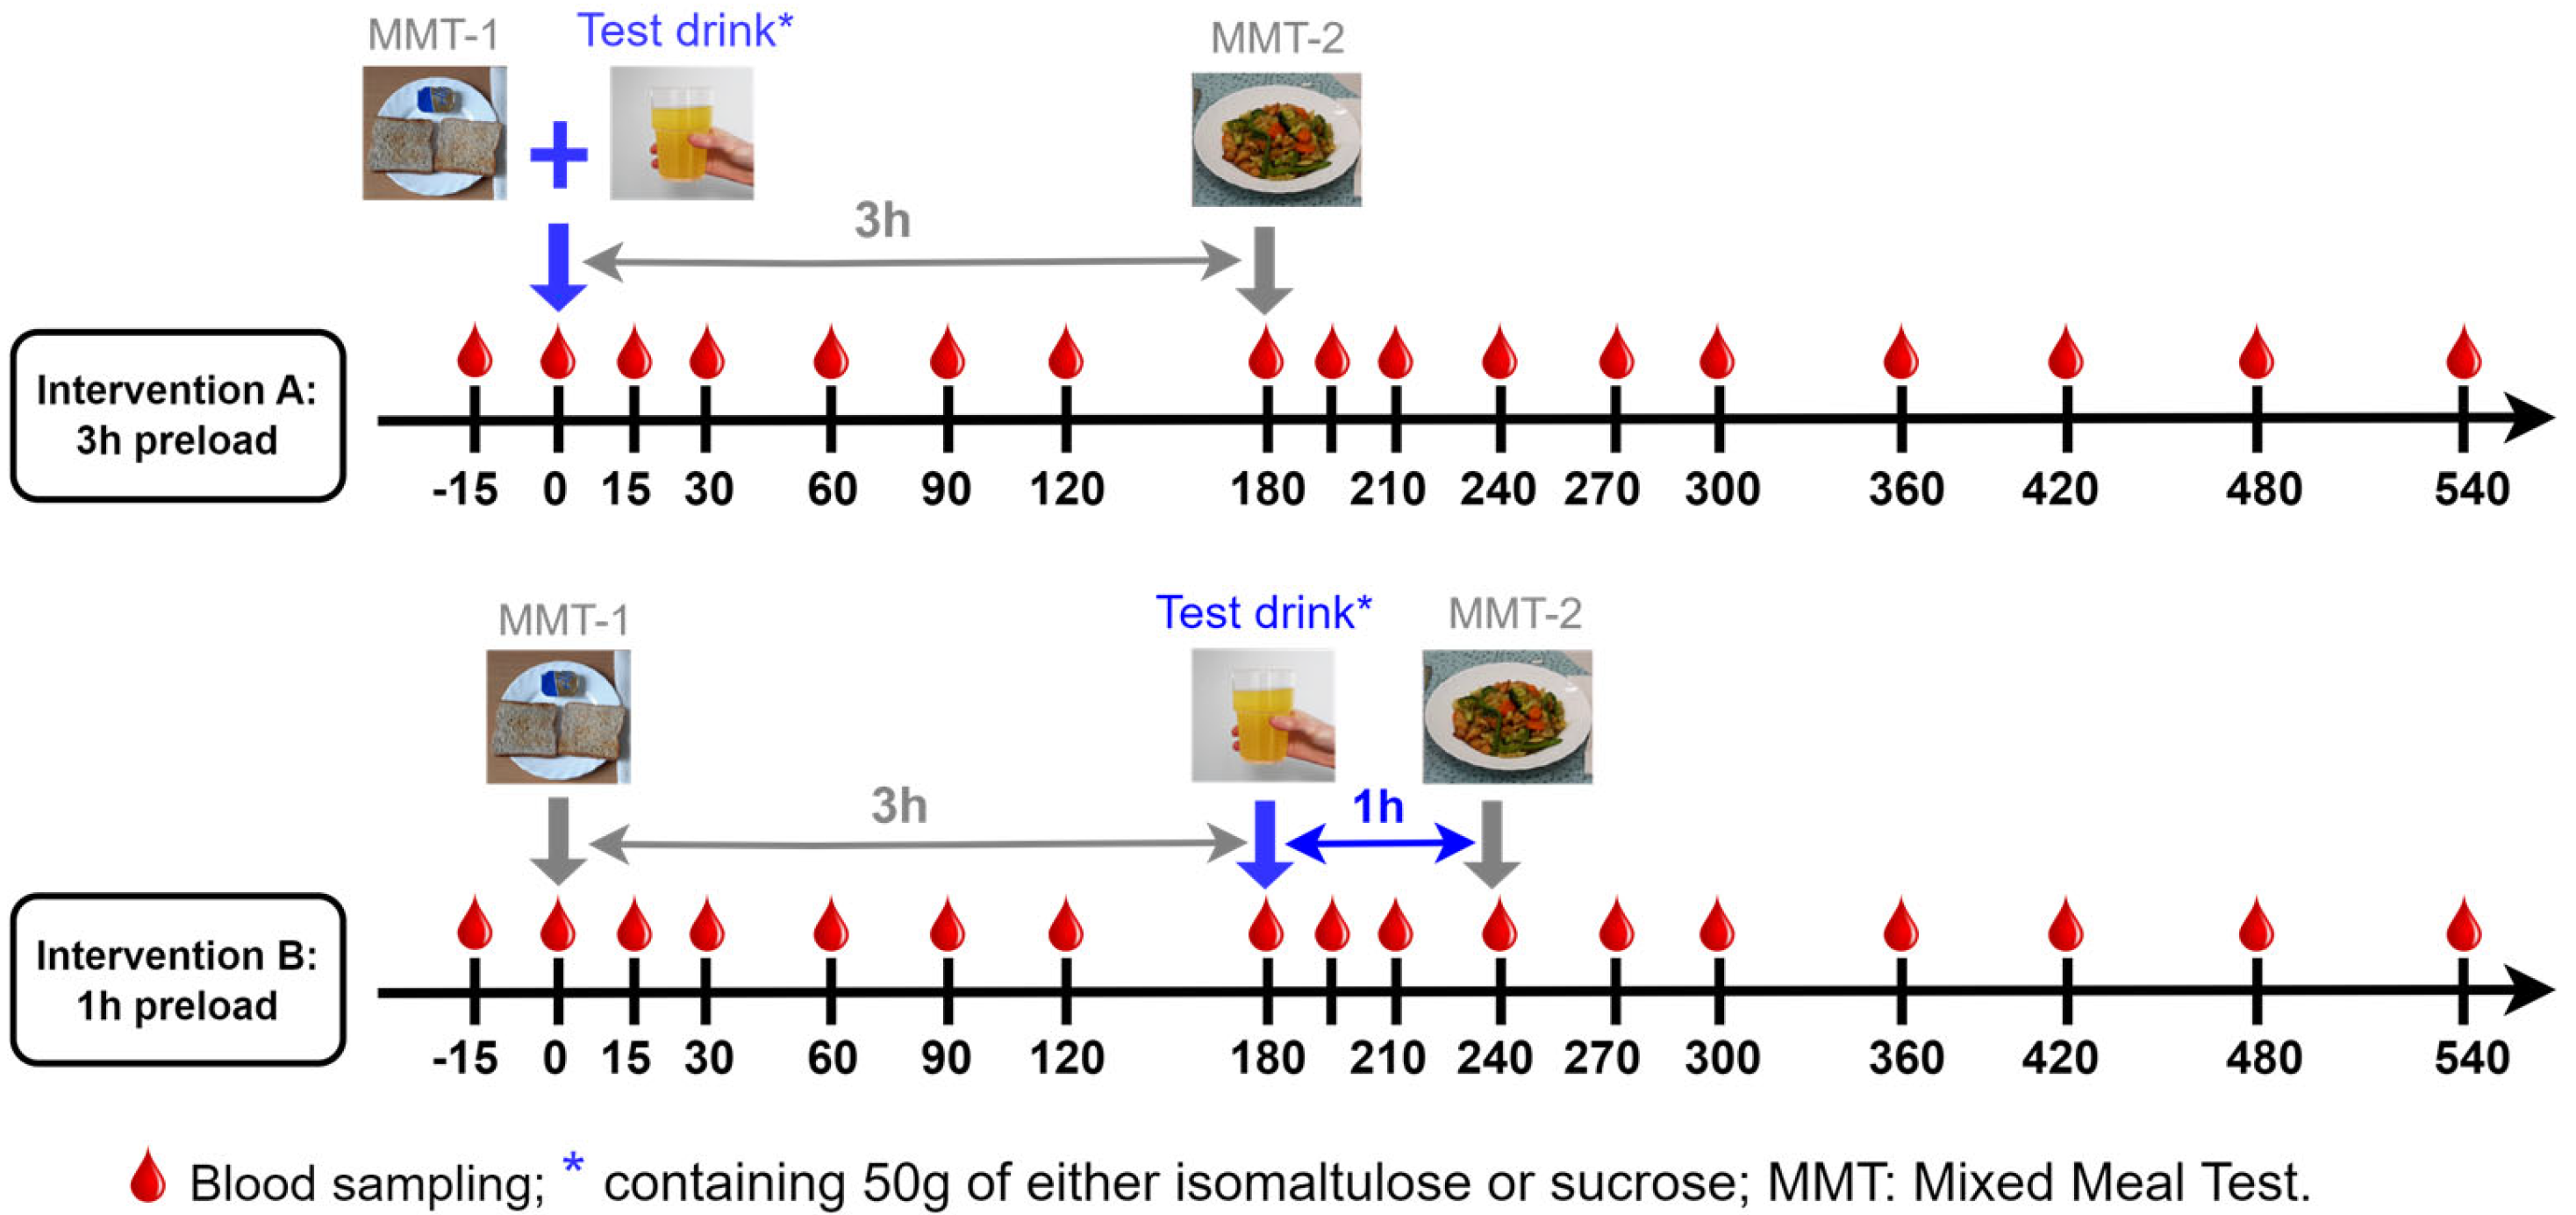
2.1. Ethics and Study Design
2.2. Biomarkers Measurements
2.3. Calculations and Statistical Analysis
3. Results
3.1. Metabolic Parameter Responses to ISO/SUC Preload
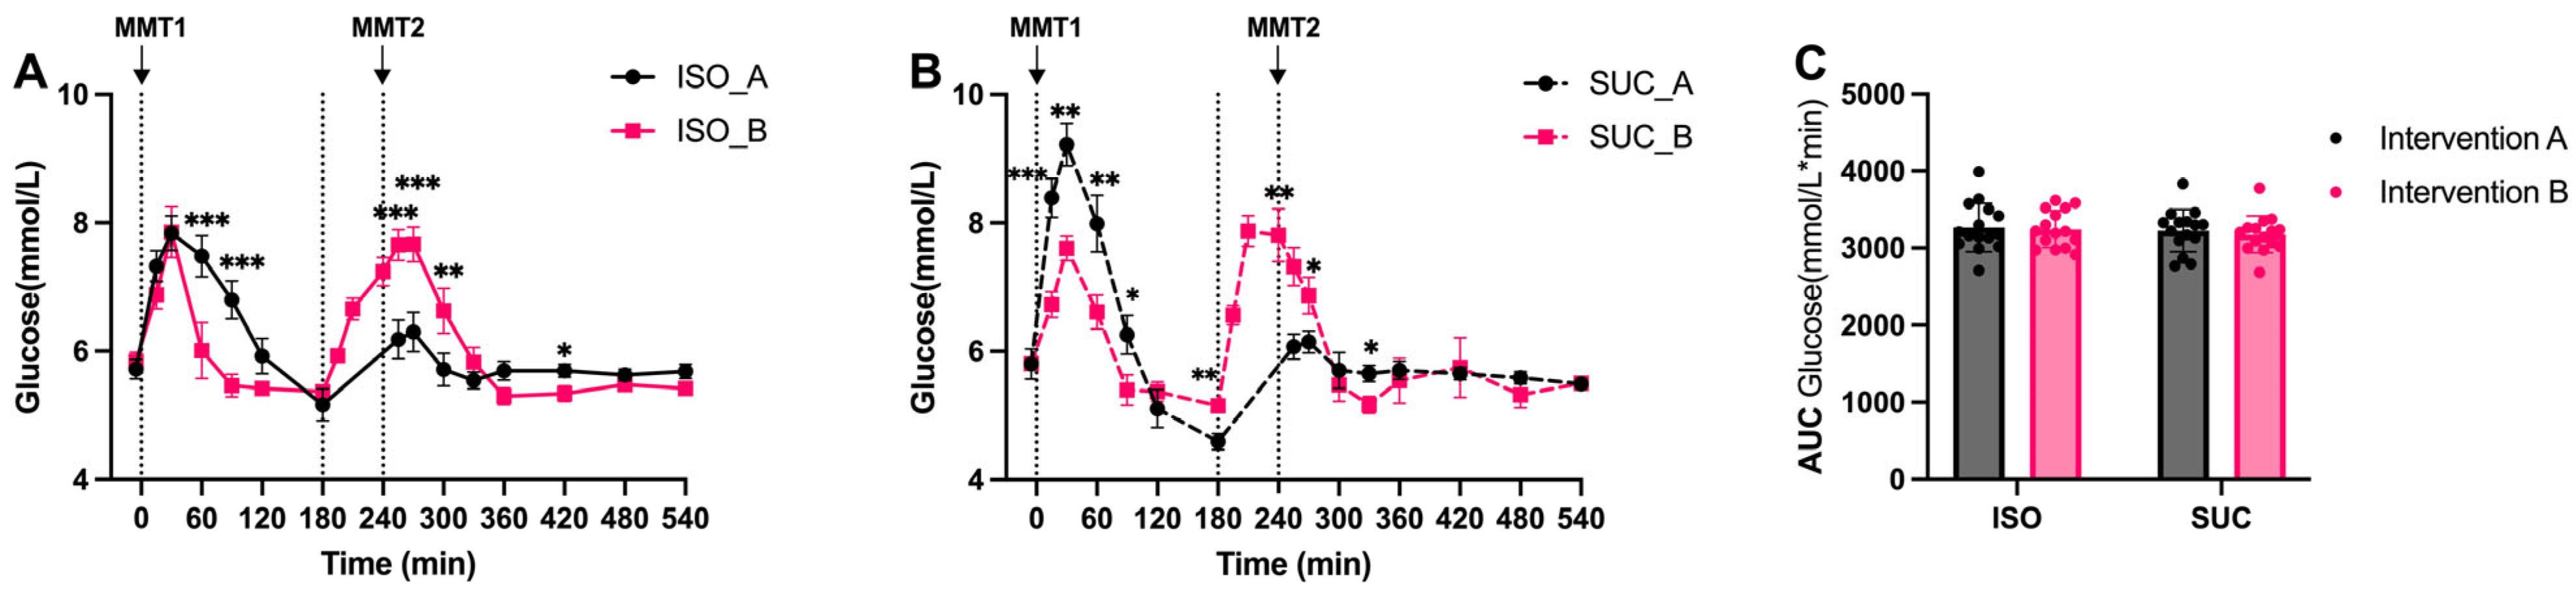
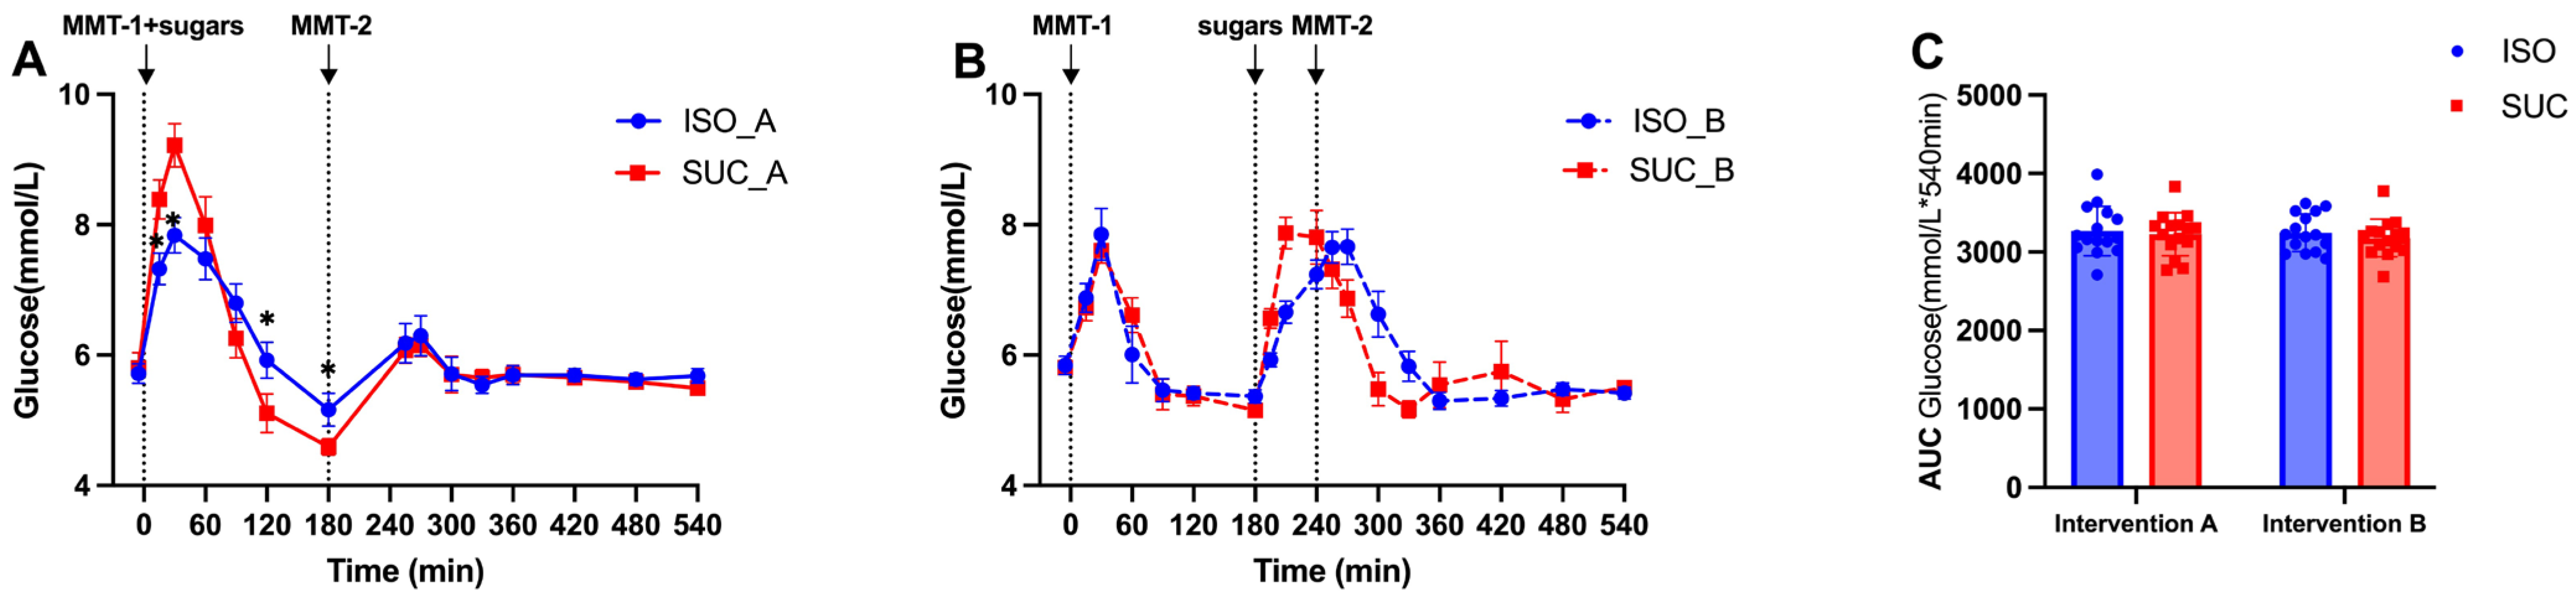
3.1.1. Glucose
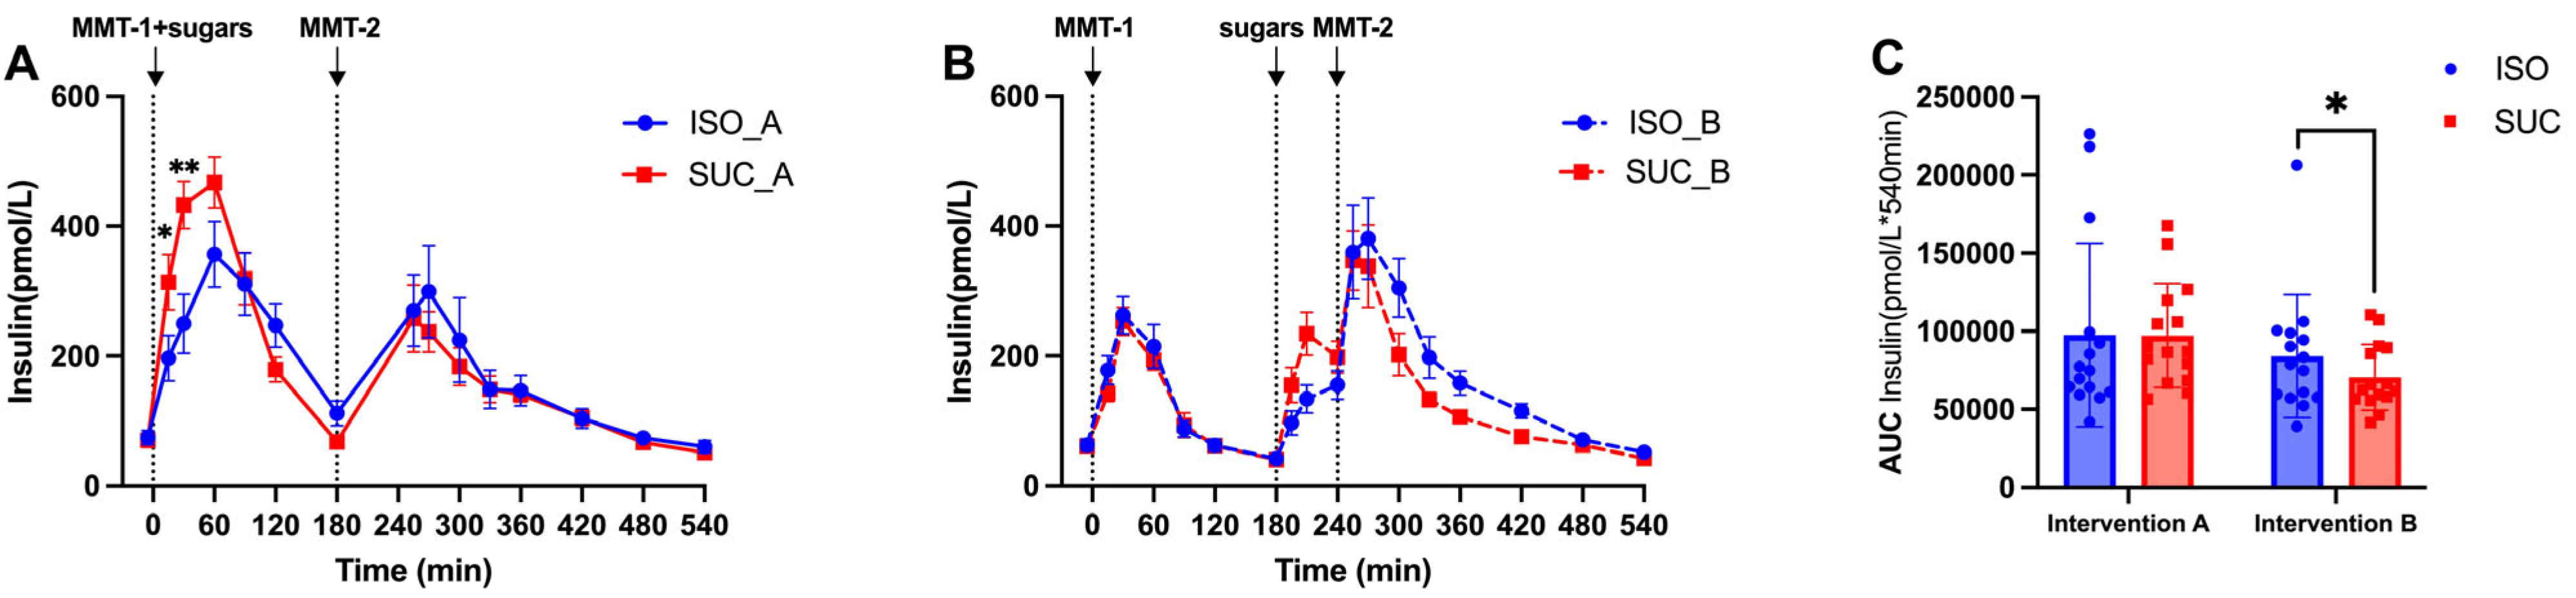
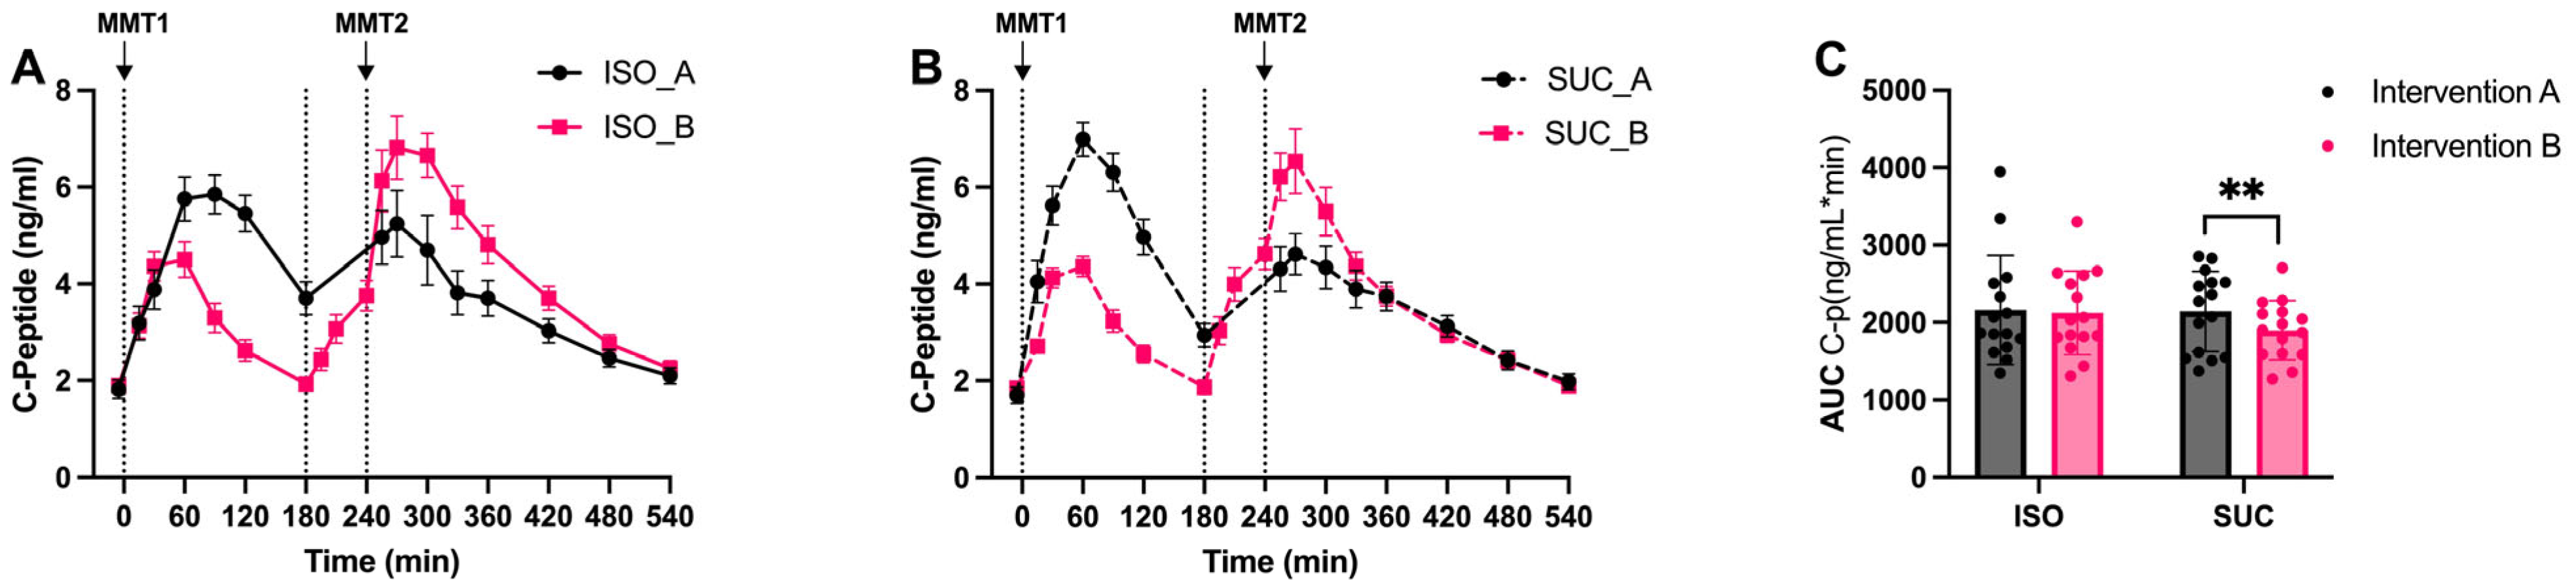
3.1.2. Insulin
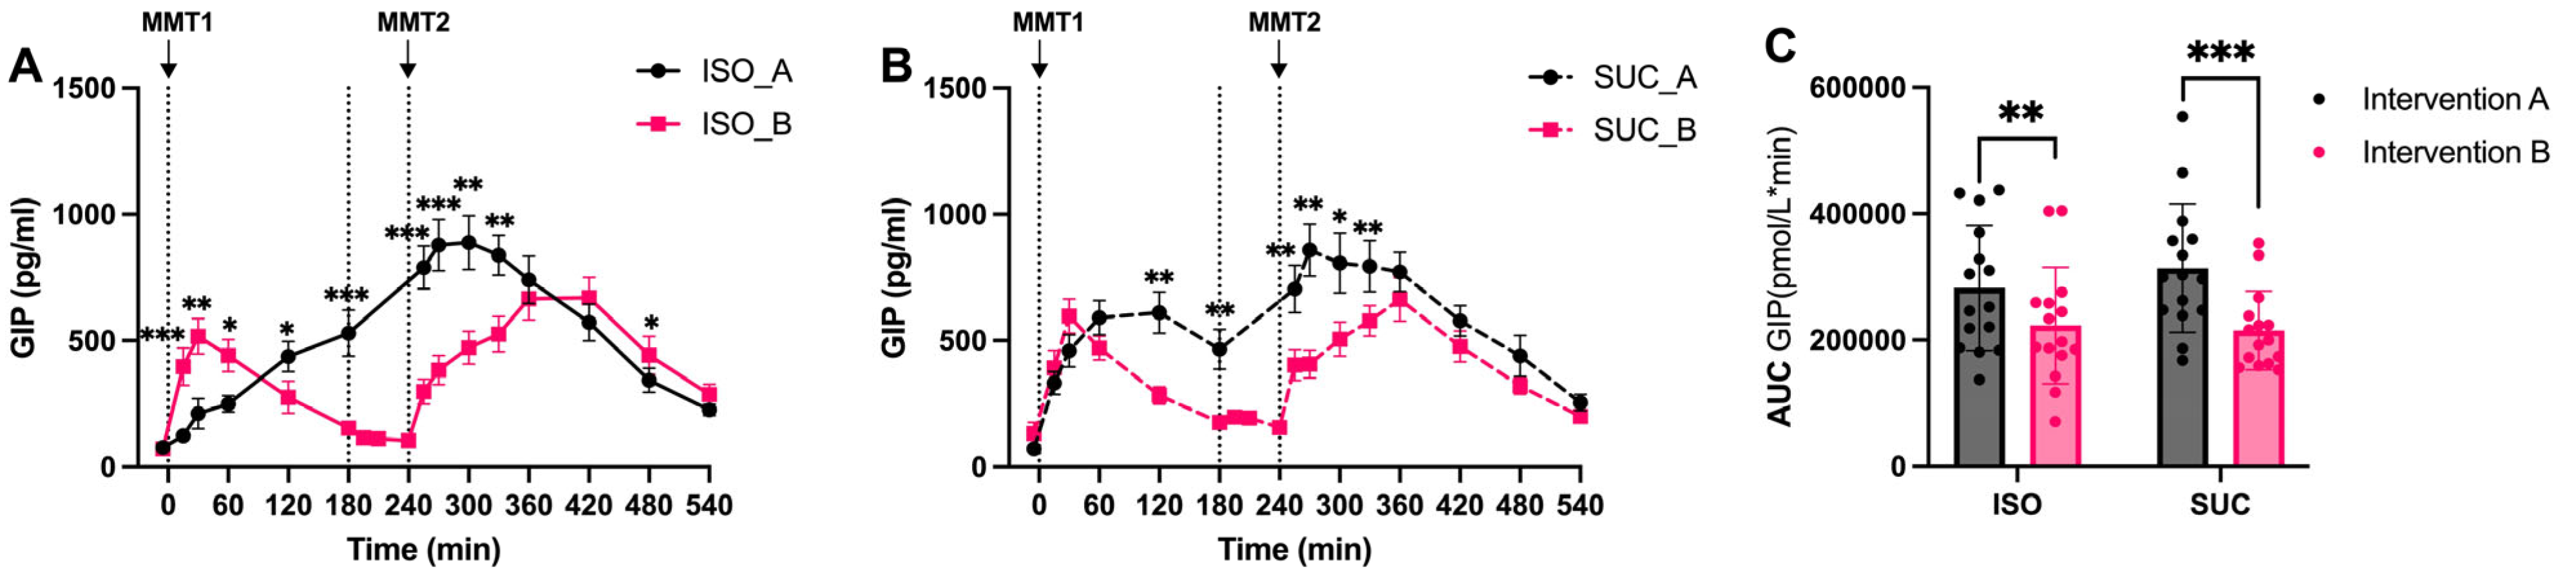
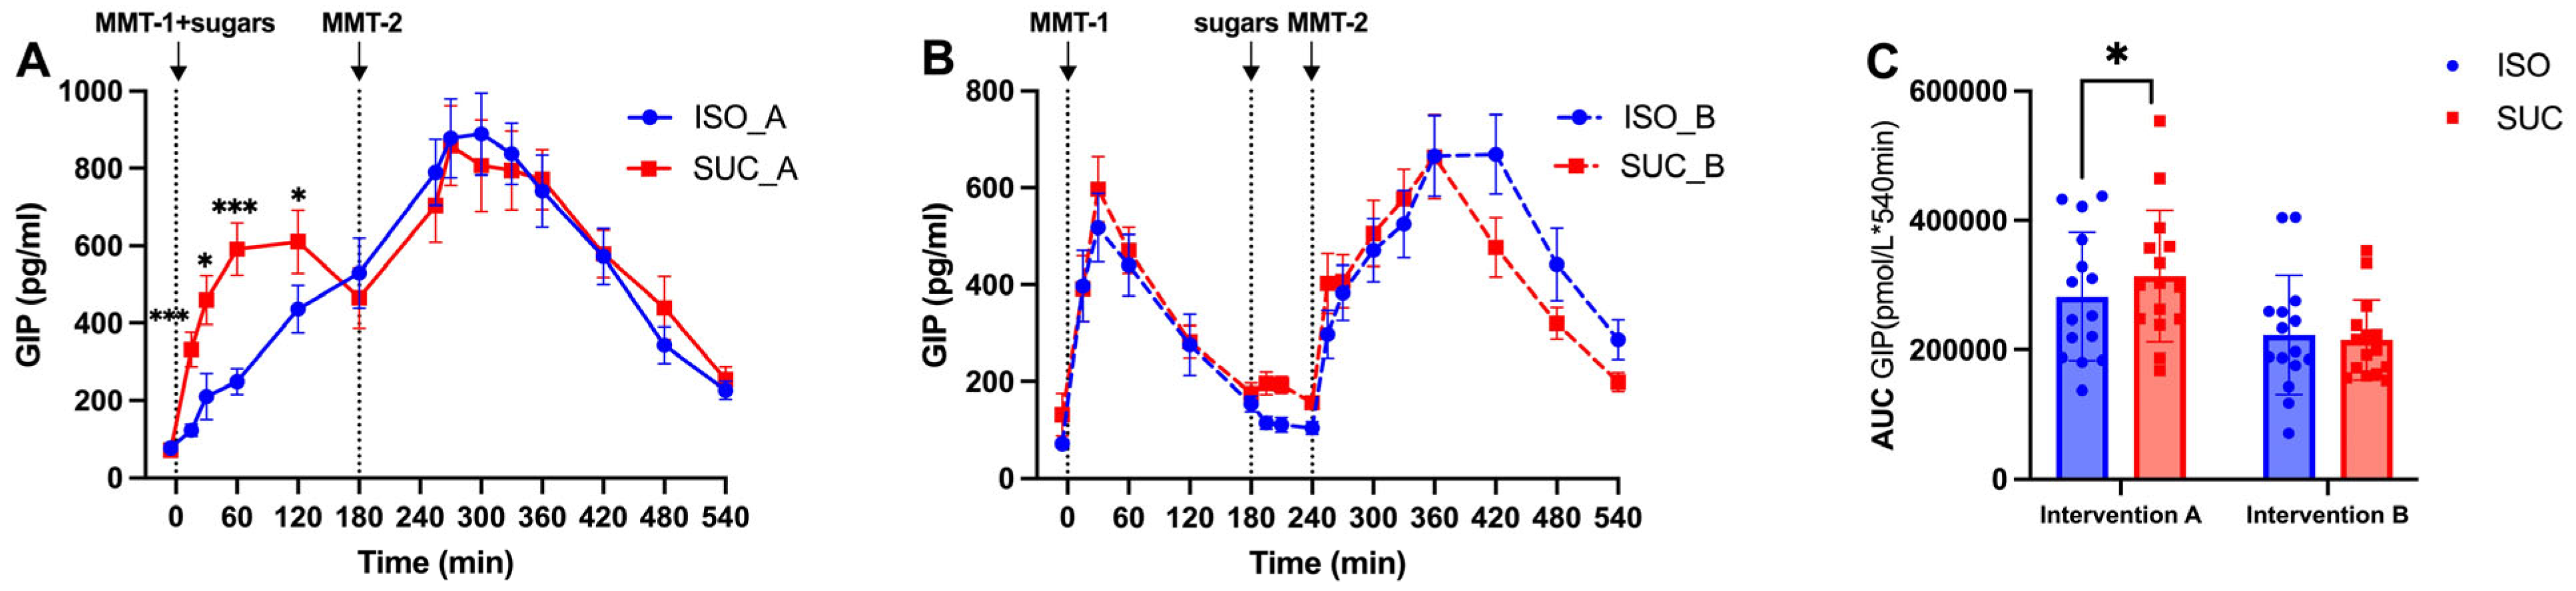
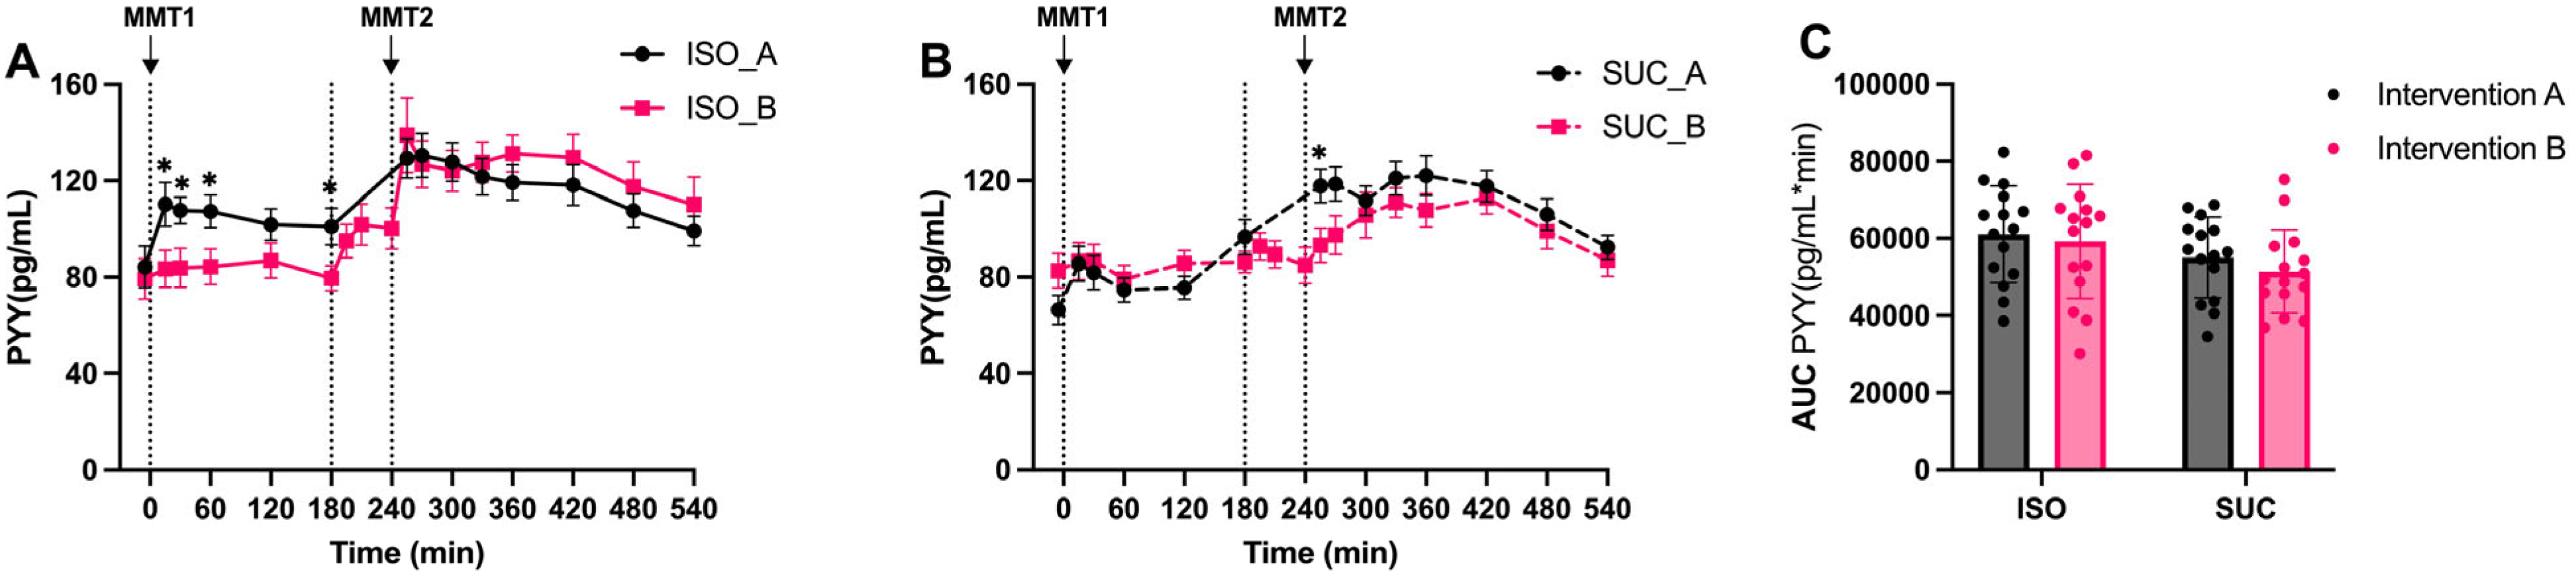
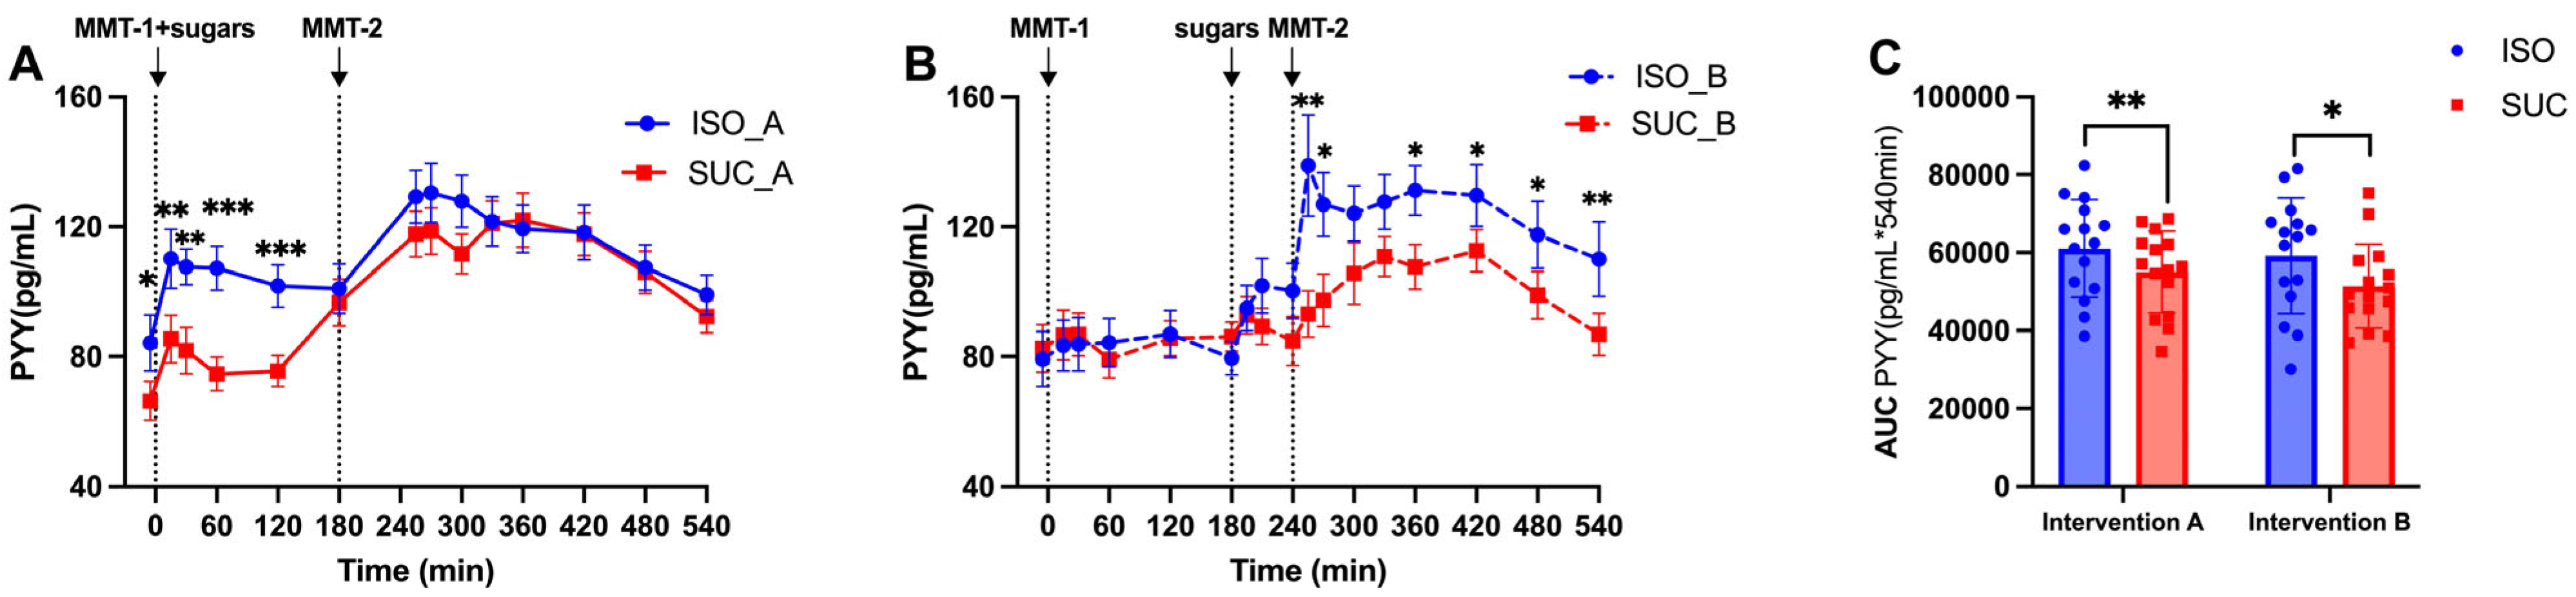
3.1.3. Gut Hormones (GIP, GLP-1, PYY)
4. Discussion
5. Conclusions
Author Contributions
Funding
Institutional Review Board Statement
Informed Consent Statement
Data Availability Statement
Acknowledgments
Conflicts of Interest
Abbreviations
| AUC | Area Under the Curve |
| DPP-4i | Dipeptidyl Peptidase-4 inhibitor |
| FFAR2/3 | Free Fatty Acid Receptor 2/3 |
| GI | Glycemic Index |
| GIP | Glucose-dependent Insulinotropic Polypeptide |
| GLP-1 | Glucagon-Like Peptide-1 |
| HOMA-IR | Homeostatic Model Assessment for Insulin Resistance |
| ISO | Isomaltulose |
| MetS | Metabolic Syndrome |
| MMT | Mixed Meal Test |
| OGTT | Oral Glucose Tolerance Test |
| PYY | Peptide YY |
| SUC | Saccharose |
| SCFA | Short-Chain Fatty Acids |
| SGLT1 | Sodium-Glucose Cotransporter-1 |
| SME | Second Meal Effect |
| T2DM | Type 2 Diabetes |
Appendix A

| Quantity (g) | Energy (kcal) | CH (g) | F (g) | P (g) | Fiber (g) | |
|---|---|---|---|---|---|---|
| Dinner the evening before | ||||||
| Chicken meal (Frosta) | 500 | 520 | 62.0 | 14.0 | 32.5 | 7.5 |
| Breakfast fixed component (MMT-1) | ||||||
| Toast whole grain (REWE) | 50 | 128 | 24.0 | 2.0 | 4.0 | 1.5 |
| Butter (Meggle) | 17 | 126 | 0.0 | 14.0 | 0.1 | 0.0 |
| Total | 67 | 254 | 24.0 | 16.0 | 4.1 | 1.5 |
| Lunch (MMT-2) | ||||||
| “Spätzle” meal (Frosta) | 500 | 530 | 65.0 | 14.0 | 33.0 | 9.0 |
| Olive oil (Henry Lamotte) | 15 | 133 | 0.0 | 15.0 | 0.0 | 0.0 |
| Total | 515 | 663 | 65.0 | 29.0 | 33.0 | 9.0 |
| Test Meal (ISO/SUC) | ||||||
| Citrus drink (BENEO) | 400 | 202.5 | 50.0 | 0.0 | 0.0 | 0.0 |
References
- Alberti, K.G.; Eckel, R.H.; Grundy, S.M.; Zimmet, P.Z.; Cleeman, J.I.; Donato, K.A.; Fruchart, J.C.; James, W.P.T.; Loria, C.M.; Smith, S.C., Jr. Harmonizing the metabolic syndrome: A joint interim statement of the International Diabetes Federation Task Force on Epidemiology and Prevention; National Heart, Lung, and Blood Institute; American Heart Association; World Heart Federation; International Atherosclerosis Society; and International Association for the Study of Obesity. Circulation 2009, 120, 1640–1645. [Google Scholar]
- Brunner, S.; Holub, I.; Theis, S.; Gostner, A.; Melcher, R.; Wolf, P.; Amann-Gassner, U.; Scheppach, W.; Hauner, H. Metabolic effects of replacing sucrose by isomaltulose in subjects with type 2 diabetes: A randomized double-blind trial. Diabetes Care 2012, 35, 1249–1251. [Google Scholar] [CrossRef] [PubMed]
- Keyhani-Nejad, F.; Kemper, M.; Schueler, R.; Pivovarova, O.; Rudovich, N.; Pfeiffer, A.F. Effects of Palatinose and Sucrose Intake on Glucose Metabolism and Incretin Secretion in Subjects With Type 2 Diabetes. Diabetes Care 2016, 39, e38–e39. [Google Scholar] [CrossRef] [PubMed]
- Pfeiffer, A.F.H.; Keyhani-Nejad, F. High Glycemic Index Metabolic Damage—A Pivotal Role of GIP and GLP-1. Trends Endocrinol. Metab. 2018, 29, 289–299. [Google Scholar] [CrossRef]
- Keyhani-Nejad, F.; Yanez, R.L.B.; Kemper, M.; Schueler, R.; Pivovarova-Ramich, O.; Rudovich, N.; Pfeiffer, A.F. Endogenously released GIP reduces and GLP-1 increases hepatic insulin extraction. Peptides 2020, 125, 170231. [Google Scholar] [CrossRef]
- Tian, Y.; Deng, Y.; Zhang, W.; Mu, W. Sucrose isomers as alternative sweeteners: Properties, production, and applications. Appl. Microbiol. Biotechnol. 2019, 103, 8677–8687. [Google Scholar] [CrossRef]
- Ludwig, D.S. The glycemic index: Physiological mechanisms relating to obesity, diabetes, and cardiovascular disease. JAMA 2002, 287, 2414–2423. [Google Scholar] [CrossRef]
- Wolever, T.M.; Jenkins, D.J.; Ocana, A.M.; Rao, V.A.; Collier, G.R. Second-meal effect: Low-glycemic-index foods eaten at dinner improve subsequent breakfast glycemic response. Am. J. Clin. Nutr. 1988, 48, 1041–1047. [Google Scholar] [CrossRef]
- Ballon, A.; Neuenschwander, M.; Schlesinger, S. Breakfast Skipping Is Associated with Increased Risk of Type 2 Diabetes among Adults: A Systematic Review and Meta-Analysis of Prospective Cohort Studies. J. Nutr. 2019, 149, 106–113. [Google Scholar] [CrossRef]
- Salgin, B.; Marcovecchio, M.L.; Humphreys, S.M.; Hill, N.; Chassin, L.J.; Lunn, D.J.; Hovorka, R.; Dunger, D.B. Effects of prolonged fasting and sustained lipolysis on insulin secretion and insulin sensitivity in normal subjects. Am. J. Physiol. Endocrinol. Metab. 2009, 296, E454–E461. [Google Scholar] [CrossRef]
- Antoni, R.; Johnston, K.L.; Collins, A.L.; Robertson, M.D. Investigation into the acute effects of total and partial energy restriction on postprandial metabolism among overweight/obese participants. Br. J. Nutr. 2016, 115, 951–959. [Google Scholar] [CrossRef]
- Willard, F.S.; Douros, J.D.; Gabe, M.B.; Showalter, A.D.; Wainscott, D.B.; Suter, T.M.; Capozzi, M.E.; van der Velden, W.J.; Stutsman, C.; Cardona, G.R.; et al. Tirzepatide is an imbalanced and biased dual GIP and GLP-1 receptor agonist. JCI Insight 2020, 5, e140532. [Google Scholar] [CrossRef]
- Frias, J.P.; Nauck, M.A.; Van, J.; Kutner, M.E.; Cui, X.; Benson, C.; Urva, S.; Gimeno, R.E.; Milicevic, Z.; Robins, D.; et al. Efficacy and safety of LY3298176, a novel dual GIP and GLP-1 receptor agonist, in patients with type 2 diabetes: A randomised, placebo-controlled and active comparator-controlled phase 2 trial. Lancet 2018, 392, 2180–2193. [Google Scholar] [CrossRef] [PubMed]
- Frias, J.P.; Nauck, M.A.; Van, J.; Benson, C.; Bray, R.; Cui, X.; Milicevic, Z.; Urva, S.; Haupt, A.; Robins, D.A. Efficacy and tolerability of tirzepatide, a dual glucose-dependent insulinotropic peptide and glucagon-like peptide-1 receptor agonist in patients with type 2 diabetes: A 12-week, randomized, double-blind, placebo-controlled study to evaluate different dose-escalation regimens. Diabetes Obes. Metab. 2020, 22, 938–946. [Google Scholar] [PubMed]
- Habib, A.M.; Richards, P.; Rogers, G.J.; Reimann, F.; Gribble, F.M. Co-localisation and secretion of glucagon-like peptide 1 and peptide YY from primary cultured human L cells. Diabetologia 2013, 56, 1413–1416. [Google Scholar] [CrossRef] [PubMed]
- Boey, D.; Lin, S.; Karl, T.; Baldock, P.; Lee, N.; Enriquez, R.; Couzens, M.; Slack, K.; Dallmann, R.; Sainsbury, A.; et al. Peptide YY ablation in mice leads to the development of hyperinsulinaemia and obesity. Diabetologia 2006, 49, 1360–1370. [Google Scholar] [CrossRef]
- Hjerpsted, J.B.; Flint, A.; Brooks, A.; Axelsen, M.B.; Kvist, T.; Blundell, J. Semaglutide improves postprandial glucose and lipid metabolism, and delays first-hour gastric emptying in subjects with obesity. Diabetes Obes. Metab. 2018, 20, 610–619. [Google Scholar] [CrossRef]
- Nauck, M.A.; Quast, D.R.; Wefers, J.; Meier, J.J. GLP-1 receptor agonists in the treatment of type 2 diabetes—State-of-the-art. Mol. Metab. 2021, 46, 101102. [Google Scholar] [CrossRef]
- Pérez-Arana, G.-M.; Díaz-Gómez, A.; Camacho-Ramírez, A.; Ribelles-García, A.; Almorza-Gomar, D.; Gracia-Romero, M.; Prada-Oliveira, J.-A. Peptide Tyrosine-Tyrosine Triggers GLP-2-Mediated Intestinal Hypertrophy After Roux-en-Y Gastric Bypass. Obes. Surg. 2022, 32, 4023–4032. [Google Scholar] [CrossRef]
- Wu, T.; Rayner, C.K.; Jones, K.L.; Horowitz, M.; Feinle-Bisset, C.; Standfield, S.D.; Xie, C.; Deacon, C.F.; Holst, J.J.; Albrechtsen, N.J.W. Measurement of plasma glucagon in humans: A shift in the performance of a current commercially available radioimmunoassay kit. Diabetes Obes. Metab. 2022, 24, 1182–1184. [Google Scholar] [CrossRef]
- Baggio, L.L.; Drucker, D.J. Biology of incretins: GLP-1 and GIP. Gastroenterology 2007, 132, 2131–2157. [Google Scholar] [CrossRef]
- Conwell, L.S.; Trost, S.G.; Brown, W.J.; Batch, J.A. Indexes of insulin resistance and secretion in obese children and adolescents: A validation study. Diabetes Care 2004, 27, 314–319. [Google Scholar] [CrossRef]
- Matsuda, M.; DeFronzo, R.A. Insulin sensitivity indices obtained from oral glucose tolerance testing: Comparison with the euglycemic insulin clamp. Diabetes Care 1999, 22, 1462–1470. [Google Scholar] [CrossRef]
- Zhang, J.; Sonnenburg, D.; Tricò, D.; Kabisch, S.; Mari, A.; Theis, S.; Kemper, M.; Pivovarova-Ramich, O.; Rohn, S.; Pfeiffer, A.F.H. Isomaltulose Enhances GLP-1 and PYY Secretion to a Mixed Meal in People With or Without Type 2 Diabetes as Compared to Saccharose. Mol. Nutr. Food Res. 2024, 68, e2300086. [Google Scholar] [CrossRef]
- Tong, J.; D’Alessio, D. Give the receptor a brake: Slowing gastric emptying by GLP-1. Diabetes 2014, 63, 407–409. [Google Scholar] [CrossRef]
- Gandasi, N.R.; Gao, R.; Kothegala, L.; Pearce, A.; Santos, C.; Acreman, S.; Basco, D.; Benrick, A.; Chibalina, M.V.; Clark, A.; et al. GLP-1 metabolite GLP-1(9-36) is a systemic inhibitor of mouse and human pancreatic islet glucagon secretion. Diabetologia 2024, 67, 528–546. [Google Scholar] [CrossRef]
- Zheng, Z.; Zong, Y.; Ma, Y.; Tian, Y.; Pang, Y.; Zhang, C.; Gao, J. Glucagon-like peptide-1 receptor: Mechanisms and advances in therapy. Signal Transduct. Target. Ther. 2024, 9, 234. [Google Scholar] [CrossRef] [PubMed]


| Characteristics (n = 15) | Mets |
|---|---|
| Male:Female | 9:6 |
| Age (years) | 61.9 ± 8.5 |
| BMI (kg/m2) | 30.8 ± 4.0 |
| WHR | 0.96 ± 0.1 |
| Fat mass (%) | 31.8 ± 17.0 |
| Fat-free mass (%) | 61.1 ± 7.2 |
| HbA1c (%) | 5.6 ± 0.1 |
| HOMA-IR | 2.9 ± 0.2 |
| Fasting glucose (mmol/L) | 5.8 ± 0.5 |
| Fasting insulin (pmol/L) | 60.9 ± 23.0 |
| Fasting C-peptide (pmol/L) | 2.0 ± 0.4 |
Disclaimer/Publisher’s Note: The statements, opinions and data contained in all publications are solely those of the individual author(s) and contributor(s) and not of MDPI and/or the editor(s). MDPI and/or the editor(s) disclaim responsibility for any injury to people or property resulting from any ideas, methods, instructions or products referred to in the content. |
© 2025 by the authors. Licensee MDPI, Basel, Switzerland. This article is an open access article distributed under the terms and conditions of the Creative Commons Attribution (CC BY) license (https://creativecommons.org/licenses/by/4.0/).
Share and Cite
Zhang, J.; Sonnenburg, D.; Kabisch, S.; Theis, S.; Kemper, M.; Pivovarova-Ramich, O.; Tricò, D.; Rohn, S.; Pfeiffer, A.F.H. Gut Hormones and Postprandial Metabolic Effects of Isomaltulose vs. Saccharose Consumption in People with Metabolic Syndrome. Nutrients 2025, 17, 2539. https://doi.org/10.3390/nu17152539
Zhang J, Sonnenburg D, Kabisch S, Theis S, Kemper M, Pivovarova-Ramich O, Tricò D, Rohn S, Pfeiffer AFH. Gut Hormones and Postprandial Metabolic Effects of Isomaltulose vs. Saccharose Consumption in People with Metabolic Syndrome. Nutrients. 2025; 17(15):2539. https://doi.org/10.3390/nu17152539
Chicago/Turabian StyleZhang, Jiudan, Dominik Sonnenburg, Stefan Kabisch, Stephan Theis, Margrit Kemper, Olga Pivovarova-Ramich, Domenico Tricò, Sascha Rohn, and Andreas F. H. Pfeiffer. 2025. "Gut Hormones and Postprandial Metabolic Effects of Isomaltulose vs. Saccharose Consumption in People with Metabolic Syndrome" Nutrients 17, no. 15: 2539. https://doi.org/10.3390/nu17152539
APA StyleZhang, J., Sonnenburg, D., Kabisch, S., Theis, S., Kemper, M., Pivovarova-Ramich, O., Tricò, D., Rohn, S., & Pfeiffer, A. F. H. (2025). Gut Hormones and Postprandial Metabolic Effects of Isomaltulose vs. Saccharose Consumption in People with Metabolic Syndrome. Nutrients, 17(15), 2539. https://doi.org/10.3390/nu17152539