


Polyphenol Intake from Herbs and Spices


Abstract
1. Introduction
2. Materials and Methods
2.1. Herb and Spice Questionnaire
- Never;
- Less than once per month;
- 1, 2, or 3 times per month;
- 1, 2, 3, 4, 5, or 6 times per week;
- 1, 2, or >3 times per day.
- <1/2 teaspoon, 1, 2, or >3 teaspoons;
- 1, 2, 3, 4, or >5 shakes, with 3 options for shaker hole size (small, medium and large). Hole sizes were depicted in photographs.
- 1, 2, 3, 4, or >5 turns of a grinder. Photo of pepper grinder was shown.
- “Not sure because it is added during food preparation” and “Not sure/I don’t pay attention” were included in frequency and portion size questions to reduce the likelihood of guessing.
2.2. (Poly)phenol Calculations
2.3. Data Analysis
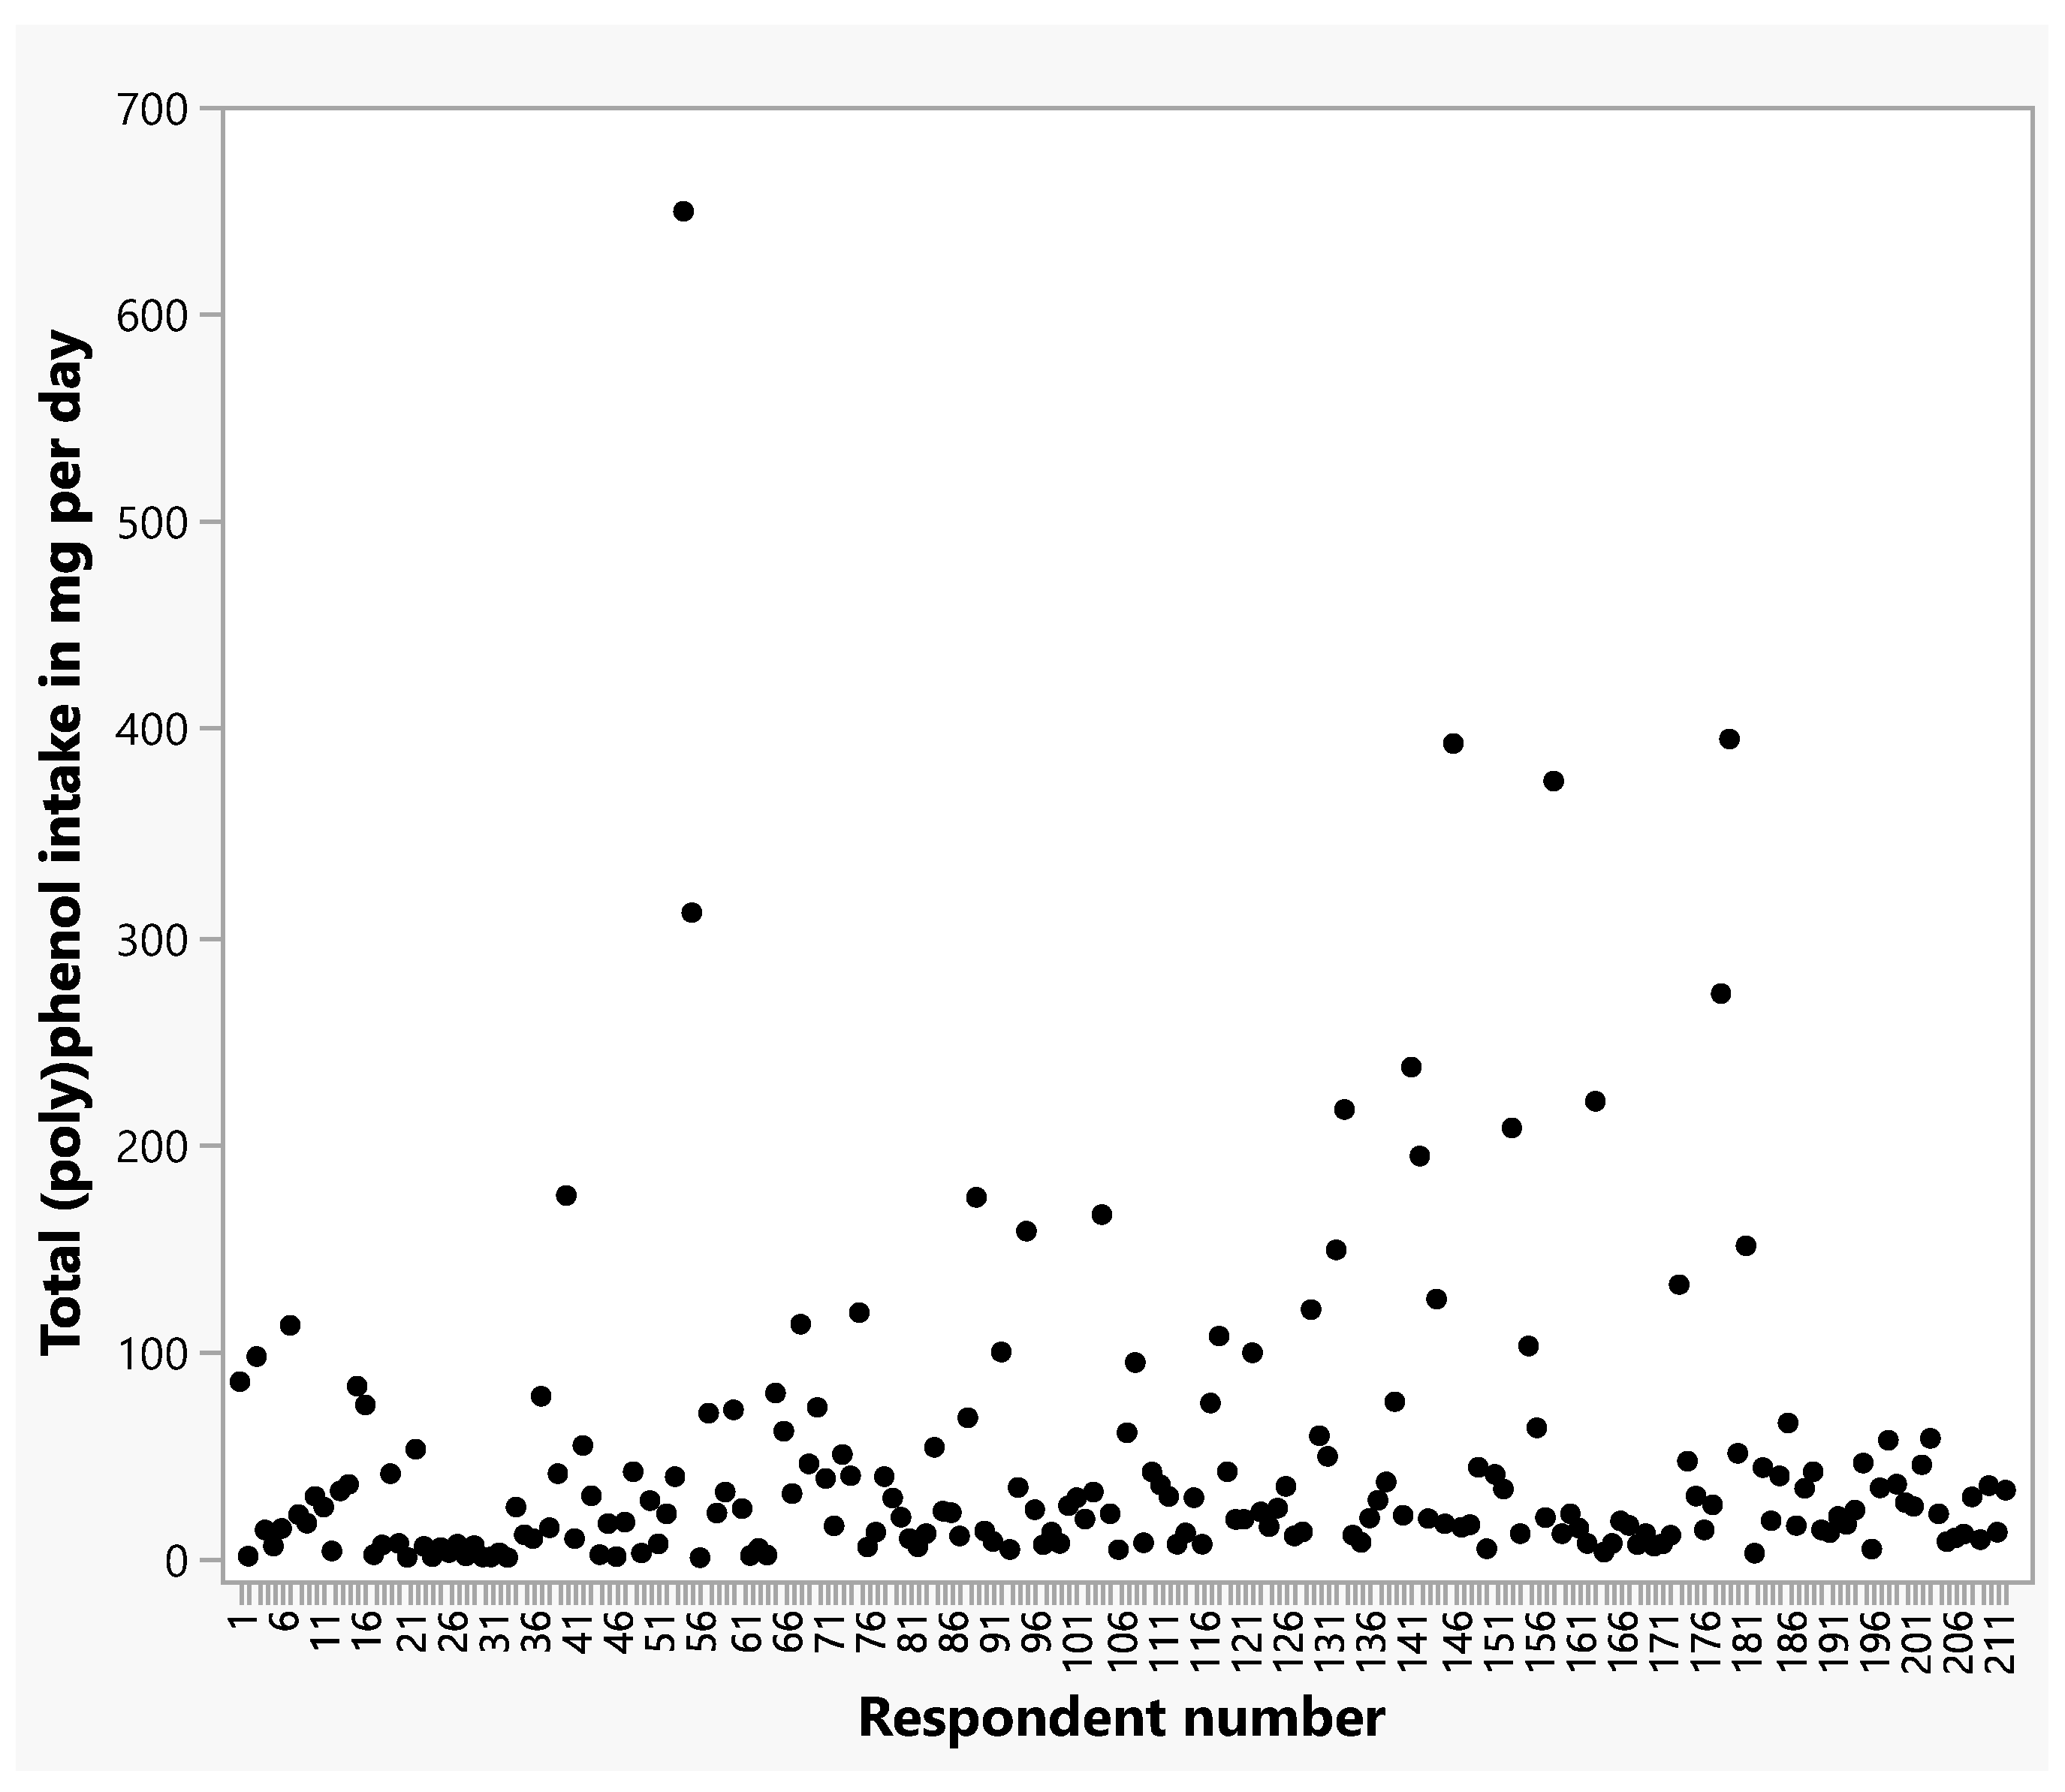
3. Results
4. Discussion
5. Conclusions
Supplementary Materials
Funding
Institutional Review Board Statement
Informed Consent Statement
Data Availability Statement
Acknowledgments
Conflicts of Interest
References
- Tapsell, L.C.; Hemphill, I.; Cobiac, L.; Patch, C.S.; Sullivan, D.R.; Fenech, M.; Roodenrys, S.; Keogh, J.B.; Clifton, P.M.; Williams, P.G.; et al. Health Benefits of Herbs and Spices: The Past, the Present, the Future. Med. J. Aust. 2006, 185, S1–S24. [Google Scholar] [CrossRef]
- Spence, C. Unveiling the Health-Promoting Power of Bioactive Compounds in Herbs and Spices. Curr. Food Sci. Technol. Rep. 2024, 3, 2. [Google Scholar] [CrossRef]
- Jiang, T.A. Health Benefits of Culinary Herbs and Spices. J. AOAC Int. 2019, 102, 395–411. [Google Scholar] [CrossRef]
- Al-Habsi, N.; Al-Khalili, M.; Haque, S.A.; Al Akhzami, N.; Gonzalez-Gonzalez, C.R.; Al Harthi, S.; Al Jufaili, S.M. Herbs and Spices as Functional Food Ingredients: A Comprehensive Review of Their Therapeutic Properties, Antioxidant and Antimicrobial Activities, and Applications in Food Preservation. J. Funct. Foods 2025, 129, 106882. [Google Scholar] [CrossRef]
- Del Bo’, C.; Bernardi, S.; Marino, M.; Porrini, M.; Tucci, M.; Guglielmetti, S.; Cherubini, A.; Carrieri, B.; Kirkup, B.; Kroon, P.; et al. Systematic Review on Polyphenol Intake and Health Outcomes: Is There Sufficient Evidence to Define a Health-Promoting Polyphenol-Rich Dietary Pattern? Nutrients 2019, 11, 1355. [Google Scholar] [CrossRef]
- Zamora-Ros, R.; Forouhi, N.G.; Sharp, S.J.; González, C.A.; Buijsse, B.; Guevara, M.; van der Schouw, Y.T.; Amiano, P.; Boeing, H.; Bredsdorff, L.; et al. The Association between Dietary Flavonoid and Lignan Intakes and Incident Type 2 Diabetes in European Populations: The EPIC-InterAct Study. Diabetes Care 2013, 36, 3961–3970. [Google Scholar] [CrossRef]
- Tresserra-Rimbau, A.; Rimm, E.B.; Medina-Remón, A.; Martínez-González, M.A.; de la Torre, R.; Corella, D.; Salas-Salvadó, J.; Gómez-Gracia, E.; Lapetra, J.; Arós, F.; et al. Inverse Association between Habitual Polyphenol Intake and Incidence of Cardiovascular Events in the PREDIMED Study. Nutr. Metab. Cardiovasc. Dis. 2014, 24, 639–647. [Google Scholar] [CrossRef]
- Grosso, G.; Stepaniak, U.; Micek, A.; Stefler, D.; Bobak, M.; Pająk, A. Dietary Polyphenols Are Inversely Associated with Metabolic Syndrome in Polish Adults of the HAPIEE Study. Eur. J. Nutr. 2017, 56, 1409–1420. [Google Scholar] [CrossRef]
- Bieżanowska-Kopeć, R.; Piątkowska, E. Total Polyphenols and Antioxidant Properties of Selected Fresh and Dried Herbs and Spices. Appl. Sci. 2022, 12, 4876. [Google Scholar] [CrossRef]
- Fact.MR Spice and Herb Market Study by Spices and Herbs for Food, Beverages, Foodservice, Retail/Household, and Personal Care and Cosmetics from 2024 to 2034. 2024. Available online: https://www.factmr.com/report/spice-and-herb-market (accessed on 20 June 2025).
- Blanton, C. Relative Validity of an Online Herb and Spice Consumption Questionnaire. Int. J. Environ. Res. Public Health 2020, 17, 2757. [Google Scholar] [CrossRef]
- Neveu, V.; Perez-Jiménez, J.; Vos, F.; Crespy, V.; du Chaffaut, L.; Mennen, L.; Knox, C.; Eisner, R.; Cruz, J.; Wishart, D.; et al. Phenol-Explorer: An Online Comprehensive Database on Polyphenol Contents in Foods. Database J. Biol. Databases Curation 2010, 2010, bap024. [Google Scholar] [CrossRef]
- Huang, Q.; Braffett, B.H.; Simmens, S.J.; Young, H.A.; Ogden, C.L. Dietary Polyphenol Intake in US Adults and 10-Year Trends: 2007–2016. J. Acad. Nutr. Diet. 2020, 120, 1821–1833. [Google Scholar] [CrossRef]
- Burkholder-Cooley, N.; Rajaram, S.; Haddad, E.; Fraser, G.E.; Jaceldo-Siegl, K. Comparison of Polyphenol Intakes According to Distinct Dietary Patterns and Food Sources in the Adventist Health Study-2 Cohort. Br. J. Nutr. 2016, 115, 2162–2169. [Google Scholar] [CrossRef]
- Pérez-Jiménez, J.; Fezeu, L.; Touvier, M.; Arnault, N.; Manach, C.; Hercberg, S.; Galan, P.; Scalbert, A. Dietary Intake of 337 Polyphenols in French Adults. Am. J. Clin. Nutr. 2011, 93, 1220–1228. [Google Scholar] [CrossRef]
- Biancaniello, E.C.; Tiessen, S.; Hartman, B.; Battram, D.S. Dietary Polyphenol Intake in the Canadian Population: Findings from the 2015 Canadian Community Health Survey-Nutrition. Can. J. Public Health Rev. Can. Sante Publique 2024, 115, 315–331. [Google Scholar] [CrossRef]
- Zamora-Ros, R.; Biessy, C.; Rothwell, J.A.; Monge, A.; Lajous, M.; Scalbert, A.; López-Ridaura, R.; Romieu, I. Dietary Polyphenol Intake and Their Major Food Sources in the Mexican Teachers’ Cohort. Br. J. Nutr. 2018, 120, 353–360. [Google Scholar] [CrossRef]
- Miranda, A.M.; Steluti, J.; Fisberg, R.M.; Marchioni, D.M. Dietary Intake and Food Contributors of Polyphenols in Adults and Elderly Adults of Sao Paulo: A Population-Based Study. Br. J. Nutr. 2016, 115, 1061–1070. [Google Scholar] [CrossRef]
- Song, W.O.; Chun, O.K. Tea Is the Major Source of Flavan-3-Ol and Flavonol in the U.S. Diet. J. Nutr. 2008, 138, 1543S–1547S. [Google Scholar] [CrossRef]
- Chun, O.K.; Floegel, A.; Chung, S.-J.; Chung, C.E.; Song, W.O.; Koo, S.I. Estimation of Antioxidant Intakes from Diet and Supplements in U.S. Adults. J. Nutr. 2010, 140, 317–324. [Google Scholar] [CrossRef]
- Sebastian, R.S.; Wilkinson Enns, C.; Goldman, J.D.; Martin, C.L.; Steinfeldt, L.C.; Murayi, T.; Moshfegh, A.J. A New Database Facilitates Characterization of Flavonoid Intake, Sources, and Positive Associations with Diet Quality among US Adults. J. Nutr. 2015, 145, 1239–1248. [Google Scholar] [CrossRef]
- Kim, K.; Vance, T.M.; Chun, O.K. Estimated Intake and Major Food Sources of Flavonoids among US Adults: Changes between 1999–2002 and 2007–2010 in NHANES. Eur. J. Nutr. 2016, 55, 833–843. [Google Scholar] [CrossRef]
- Ilow, R.; Regulska-Ilow, B.; Rózańska, D.; Misiewicz, D.; Grajeta, H.; Kowalisko, A.; Biernat, J. Assessment of Dietary Flavonoid Intake among 50-Year-Old Inhabitants of Wroclaw in 2008. Adv. Clin. Exp. Med. Off. Organ Wroclaw Med. Univ. 2012, 21, 353–362. [Google Scholar]
- Zujko, M.E.; Witkowska, A.M.; Waśkiewicz, A.; Sygnowska, E. Estimation of Dietary Intake and Patterns of Polyphenol Consumption in Polish Adult Population. Adv. Med. Sci. 2012, 57, 375–384. [Google Scholar] [CrossRef]
- Witkowska, A.M.; Zujko, M.E.; Waśkiewicz, A.; Terlikowska, K.M.; Piotrowski, W. Comparison of Various Databases for Estimation of Dietary Polyphenol Intake in the Population of Polish Adults. Nutrients 2015, 7, 9299–9308. [Google Scholar] [CrossRef]
- Otaki, N.; Kimira, M.; Katsumata, S.-I.; Uehara, M.; Watanabe, S.; Suzuki, K. Distribution and Major Sources of Flavonoid Intakes in the Middle-Aged Japanese Women. J. Clin. Biochem. Nutr. 2009, 44, 231–238. [Google Scholar] [CrossRef]
- Taguchi, C.; Fukushima, Y.; Kishimoto, Y.; Suzuki-Sugihara, N.; Saita, E.; Takahashi, Y.; Kondo, K. Estimated Dietary Polyphenol Intake and Major Food and Beverage Sources among Elderly Japanese. Nutrients 2015, 7, 10269–10281. [Google Scholar] [CrossRef]
- Kim, Y.J.; Park, M.Y.; Chang, N.; Kwon, O. Intake and Major Sources of Dietary Flavonoid in Korean Adults: Korean National Health and Nutrition Examination Survey 2010–2012. Asia Pac. J. Clin. Nutr. 2015, 24, 456–463. [Google Scholar] [CrossRef]
- Zhang, Y.; Cao, J.; Chen, W.; Yang, J.; Hao, D.; Zhang, Y.; Chang, P.; Zhao, X. Reproducibility and Relative Validity of a Food Frequency Questionnaire to Assess Intake of Dietary Flavonol and Flavone in Chinese University Campus Population. Nutr. Res. 2010, 30, 520–526. [Google Scholar] [CrossRef]
- Zhang, Y.; Li, Y.; Cao, C.; Cao, J.; Chen, W.; Zhang, Y.; Wang, C.; Wang, J.; Zhang, X.; Zhao, X. Dietary Flavonol and Flavone Intakes and Their Major Food Sources in Chinese Adults. Nutr. Cancer 2010, 62, 1120–1127. [Google Scholar] [CrossRef]
- Sun, C.; Wang, H.; Wang, D.; Chen, Y.; Zhao, Y.; Xia, W. Using an FFQ to Assess Intakes of Dietary Flavonols and Flavones among Female Adolescents in the Suihua Area of Northern China. Public Health Nutr. 2015, 18, 632–639. [Google Scholar] [CrossRef]
- Wisnuwardani, R.W.; De Henauw, S.; Androutsos, O.; Forsner, M.; Gottrand, F.; Huybrechts, I.; Knaze, V.; Kersting, M.; Le Donne, C.; Marcos, A.; et al. Estimated Dietary Intake of Polyphenols in European Adolescents: The HELENA Study. Eur. J. Nutr. 2019, 58, 2345–2363. [Google Scholar] [CrossRef]
- Spices and Seasonings Market Size, Share & Industry Analysis, By Type (Pepper, Chili, Ginger, Cinnamon, Cumin, Turmeric, Nutmeg and Mace, Cardamom, Cloves, and Others), By Application (Meat and Poultry, Bakery and Confectionery, Frozen Food, Snacks & Convenience Food, and Others), and Regional Forecast, 2024–2032. 2025. Available online: https://www.fortunebusinessinsights.com/industry-reports/spices-and-seasonings-market-101694 (accessed on 20 June 2025).
- Hegli Library Spice Consumption per Capita. 2025. Available online: https://www.helgilibrary.com/indicators/spice-consumption-per-capita/ (accessed on 20 June 2025).
- Grivetti, L. Herbs, Spices, and Flavoring Agents: Part 1: Old World Contributions. Nutr. Today 2016, 51, 139–150. [Google Scholar] [CrossRef]
- Mathea Ford Herbs & Spices, Spices and Culture: 11 Diverse Culinary Practices 2024. Available online: https://usingherbsandspices.com/spices-and-culture-11-diverse-culinary-practices/ (accessed on 20 June 2025).
- Carlsen, M.H.; Blomhoff, R.; Andersen, L.F. Intakes of Culinary Herbs and Spices from a Food Frequency Questionnaire Evaluated against 28-Days Estimated Records. Nutr. J. 2011, 10, 50. [Google Scholar] [CrossRef]
- Sasaki, S.; Kobayashi, M.; Tsugane, S. Validity of a Self-Administered Food Frequency Questionnaire Used in the 5-Year Follow-up Survey of the JPHC Study Cohort I: Comparison with Dietary Records for Food Groups. J. Epidemiol. 2003, 13, S57–S63. [Google Scholar] [CrossRef]
- Pellegrini, N.; Salvatore, S.; Valtueña, S.; Bedogni, G.; Porrini, M.; Pala, V.; Del Rio, D.; Sieri, S.; Miglio, C.; Krogh, V.; et al. Development and Validation of a Food Frequency Questionnaire for the Assessment of Dietary Total Antioxidant Capacity. J. Nutr. 2007, 137, 93–98. [Google Scholar] [CrossRef]
- Uma Pradeep, K.; Geervani, P.; Eggum, B.O. Common Indian Spices: Nutrient Composition, Consumption and Contribution to Dietary Value. Plant Foods Hum. Nutr. Dordr. Neth. 1993, 44, 137–148. [Google Scholar] [CrossRef]
- Bhathal, S.K.; Kaur, H.; Bains, K.; Mahal, A.K. Assessing Intake and Consumption Level of Spices among Urban and Rural Households of Ludhiana District of Punjab, India. Nutr. J. 2020, 19, 121. [Google Scholar] [CrossRef]
- Chociej, P.; Foss, K.; Jabłońska, M.; Ustarbowska, M.; Sawicki, T. The Profile and Content of Polyphenolic Compounds and Antioxidant and Anti-Glycation Properties of Root Extracts of Selected Medicinal Herbs. Plant Foods Hum. Nutr. Dordr. Neth. 2024, 79, 468–473. [Google Scholar] [CrossRef]
- Szydłowska-Czerniak, A.; Kowaluk, A.; Strzelec, M.; Sawicki, T.; Tańska, M. Evaluation of Bioactive Compounds and Chemical Elements in Herbs: Effectiveness of Choline Chloride-Based Deep Eutectic Solvents in Ultrasound-Assisted Extraction. Molecules 2025, 30, 368. [Google Scholar] [CrossRef]
- Nakatani, N. Phenolic Antioxidants from Herbs and Spices. BioFactors Oxf. Engl. 2000, 13, 141–146. [Google Scholar] [CrossRef]
- Lin, L.-Z.; Harnly, J.M. LC-PDA-ESI/MS Identification of the Phenolic Components of Three Compositae Spices: Chamomile, Tarragon, and Mexican Arnica. Nat. Prod. Commun. 2012, 7, 749–752. [Google Scholar] [CrossRef]
- Cortés-Chitala, M.D.C.; Flores-Martínez, H.; Orozco-Ávila, I.; León-Campos, C.; Suárez-Jacobo, Á.; Estarrón-Espinosa, M.; López-Muraira, I. Identification and Quantification of Phenolic Compounds from Mexican Oregano (Lippia Graveolens HBK) Hydroethanolic Extracts and Evaluation of Its Antioxidant Capacity. Molecules 2021, 26, 702. [Google Scholar] [CrossRef]
- Lazaridis, D.G.; Kitsios, A.-P.; Koutoulis, A.S.; Malisova, O.; Karabagias, I.K. Fruits, Spices and Honey Phenolic Compounds: A Comprehensive Review on Their Origin, Methods of Extraction and Beneficial Health Properties. Antioxidants 2024, 13, 1335. [Google Scholar] [CrossRef]
- Murphy, E.W.; Marsh, A.C.; Willis, B.W. Nutrient Content of Spices and Herbs. J. Am. Diet. Assoc. 1978, 72, 174–176. [Google Scholar] [CrossRef]
- Newerli-Guz, J.; Smiechowska, M. Spices and Herbs Nomenclature—Current Results and Trends. Role and Importance in Developing the Quality of Spices and Herbs. Sci. Pap. Silesian Univ. Technol. Organ. Manag. 2024, 207, 389–418. [Google Scholar] [CrossRef]
- Pant, P.; Pandey, S.; Dall’Acqua, S. The Influence of Environmental Conditions on Secondary Metabolites in Medicinal Plants: A Literature Review. Chem. Biodivers. 2021, 18, e2100345. [Google Scholar] [CrossRef]
- U.S. Department of Agriculture, Agricultural Research Service. FoodData Central. 2025. Available online: https://fdc.nal.usda.gov/ (accessed on 20 June 2025).
- Bailey, R.L. Overview of Dietary Assessment Methods for Measuring Intakes of Foods, Beverages, and Dietary Supplements in Research Studies. Curr. Opin. Biotechnol. 2021, 70, 91–96. [Google Scholar] [CrossRef]
- Opara, E.I.; Chohan, M. Culinary Herbs and Spices: Their Bioactive Properties, the Contribution of Polyphenols and the Challenges in Deducing Their True Health Benefits. Int. J. Mol. Sci. 2014, 15, 19183–19202. [Google Scholar] [CrossRef]
- Khatun, M.; Eguchi, S.; Yamaguchi, T.; Takamura, H.; Matoba, T. Effect of Thermal Treatment on Radical-Scavenging Activity of Some Spices. Food Sci. Technol. Res. 2006, 12, 178–185. [Google Scholar] [CrossRef]
- Kim, J.-S.; Kang, O.-J.; Gweon, O.-C. Comparison of Phenolic Acids and Flavonoids in Black Garlic at Different Thermal Processing Steps. J. Funct. Foods 2013, 5, 80–86. [Google Scholar] [CrossRef]
- Pellegrini, N.; Chiavaro, E.; Gardana, C.; Mazzeo, T.; Contino, D.; Gallo, M.; Riso, P.; Fogliano, V.; Porrini, M. Effect of Different Cooking Methods on Color, Phytochemical Concentration, and Antioxidant Capacity of Raw and Frozen Brassica Vegetables. J. Agric. Food Chem. 2010, 58, 4310–4321. [Google Scholar] [CrossRef]
- Palermo, M.; Pellegrini, N.; Fogliano, V. The Effect of Cooking on the Phytochemical Content of Vegetables. J. Sci. Food Agric. 2014, 94, 1057–1070. [Google Scholar] [CrossRef]
- Cuparencu, C.; Bulmuş-Tüccar, T.; Stanstrup, J.; La Barbera, G.; Roager, H.M.; Dragsted, L.O. Towards Nutrition with Precision: Unlocking Biomarkers as Dietary Assessment Tools. Nat. Metab. 2024, 6, 1438–1453. [Google Scholar] [CrossRef]
- Chakraborty, H.; Sun, Q.; Bhupathiraju, S.N.; Schenk, J.M.; Mishchuk, D.O.; Bain, J.R.; He, X.; Sun, J.; Harnly, J.; Simmons, W.; et al. The Dietary Biomarkers Development Consortium: An Initiative for Discovery and Validation of Dietary Biomarkers for Precision Nutrition. Curr. Dev. Nutr. 2025, 9, 107435. [Google Scholar] [CrossRef]
- Vázquez-Fresno, R.; Rosana, A.R.R.; Sajed, T.; Onookome-Okome, T.; Wishart, N.A.; Wishart, D.S. Herbs and Spices- Biomarkers of Intake Based on Human Intervention Studies—A Systematic Review. Genes Nutr. 2019, 14, 18. [Google Scholar] [CrossRef]
- Stromsnes, K.; Lagzdina, R.; Olaso-Gonzalez, G.; Gimeno-Mallench, L.; Gambini, J. Pharmacological Properties of Polyphenols: Bioavailability, Mechanisms of Action, and Biological Effects in In Vitro Studies, Animal Models, and Humans. Biomedicines 2021, 9, 1074. [Google Scholar] [CrossRef]
- Matsui, T. Polyphenols-Absorption and Occurrence in the Body System. Food Sci. Technol. Res. 2022, 28, 13–33. [Google Scholar] [CrossRef]
- van Duynhoven, J.; Vaughan, E.E.; Jacobs, D.M.; Kemperman, R.A.; van Velzen, E.J.J.; Gross, G.; Roger, L.C.; Possemiers, S.; Smilde, A.K.; Doré, J.; et al. Metabolic Fate of Polyphenols in the Human Superorganism. Proc. Natl. Acad. Sci. USA 2011, 108, 4531–4538. [Google Scholar] [CrossRef]
- Manach, C.; Scalbert, A.; Morand, C.; Rémésy, C.; Jiménez, L. Polyphenols: Food Sources and Bioavailability. Am. J. Clin. Nutr. 2004, 79, 727–747. [Google Scholar] [CrossRef]
- Zhang, H.; Yu, D.; Sun, J.; Liu, X.; Jiang, L.; Guo, H.; Ren, F. Interaction of Plant Phenols with Food Macronutrients: Characterisation and Nutritional–Physiological Consequences. Nutr. Res. Rev. 2014, 27, 1–15. [Google Scholar] [CrossRef]
- Maubach, J.; Bracke, M.E.; Heyerick, A.; Depypere, H.T.; Serreyn, R.F.; Mareel, M.M.; De Keukeleire, D. Quantitation of Soy-Derived Phytoestrogens in Human Breast Tissue and Biological Fluids by High-Performance Liquid Chromatography. J. Chromatogr. B Analyt. Technol. Biomed. Life Sci. 2003, 784, 137–144. [Google Scholar] [CrossRef]
- Alldritt, I.; Whitham-Agut, B.; Sipin, M.; Studholme, J.; Trentacoste, A.; Tripp, J.A.; Cappai, M.G.; Ditchfield, P.; Devièse, T.; Hedges, R.E.M.; et al. Metabolomics Reveals Diet-Derived Plant Polyphenols Accumulate in Physiological Bone. Sci. Rep. 2019, 9, 8047. [Google Scholar] [CrossRef]
- Feliciano, R.P.; Mills, C.E.; Istas, G.; Heiss, C.; Rodriguez-Mateos, A. Absorption, Metabolism and Excretion of Cranberry (Poly)Phenols in Humans: A Dose Response Study and Assessment of Inter-Individual Variability. Nutrients 2017, 9, 268. [Google Scholar] [CrossRef]
- Wruss, J.; Lanzerstorfer, P.; Huemer, S.; Himmelsbach, M.; Mangge, H.; Höglinger, O.; Weghuber, D.; Weghuber, J. Differences in Pharmacokinetics of Apple Polyphenols after Standardized Oral Consumption of Unprocessed Apple Juice. Nutr. J. 2015, 14, 32. [Google Scholar] [CrossRef]
- Singla, R.K.; Dubey, A.K.; Garg, A.; Sharma, R.K.; Fiorino, M.; Ameen, S.M.; Haddad, M.A.; Al-Hiary, M. Natural Polyphenols: Chemical Classification, Definition of Classes, Subcategories, and Structures. J. AOAC Int. 2019, 102, 1397–1400. [Google Scholar] [CrossRef]
- Khoddami, A.; Wilkes, M.A.; Roberts, T.H. Techniques for Analysis of Plant Phenolic Compounds. Molecules 2013, 18, 2328–2375. [Google Scholar] [CrossRef]
- Raposo, F.; Borja, R.; Gutiérrez-González, J.A. A Comprehensive and Critical Review of the Unstandardized Folin-Ciocalteu Assay to Determine the Total Content of Polyphenols: The Conundrum of the Experimental Factors and Method Validation. Talanta 2024, 272, 125771. [Google Scholar] [CrossRef]
- Samara, M.; Nasser, A.; Mingelgrin, U. Critical Examination of the Suitability of the Folin-Ciocalteu Reagent Assay for Quantitative Analysis of Polyphenols—The Case of Olive-Mill Wastewater. Am. J. Anal. Chem. 2022, 13, 479–493. [Google Scholar] [CrossRef]
- Ali, A.; Wu, H.; Ponnampalam, E.N.; Cottrell, J.J.; Dunshea, F.R.; Suleria, H.A.R. Comprehensive Profiling of Most Widely Used Spices for Their Phenolic Compounds through LC-ESI-QTOF-MS2 and Their Antioxidant Potential. Antioxidants 2021, 10, 721. [Google Scholar] [CrossRef]


| Anise Herb, Dried Pimpinella Anisum | Basil, Sweet, Dried Ocimum Basilicum | Basil, Sweet, Fresh Ocimum Basilicum |
| Black pepper, Pepper Piper nigrum | Cinnamon Cinnamomum spp. | Clove Syzygium aromaticum |
| Common sage, dried Salvia ocinalis | Common sage, fresh Salvia ocinalis | Common thyme, dried Thymus vulgaris |
| Common thyme, fresh Thymus vulgaris | Cumin Cuminum cyminum | Curry, powder Murraya koenigii |
| Garlic, fresh Allium sativum | Ginger, dried Zingiber officinale | Ginger, fresh Zingiber officinale |
| Marjoram, dried Origanum majorana | Marjoram, fresh Origanum majorana | Nutmeg Myristica fragrans |
| Oregano, dried Origanum spp. | Oregano, fresh Origanum spp. | Parsley, dried Petroselinum crispum |
| Parsley, fresh Petroselinum crispum | Peppermint, fresh Mentha spp. | Rosemary, dried Rosmarinus officinalis |
| Rosemary, fresh Rosmarinus officinalis | Spearmint, fresh Mentha spp. | Turmeric, dried Curcuma longa |
| Median (IQR) | Mean (SD) | |
|---|---|---|
| Per month | 47.44 (60.71) | 72.19 (86.59) |
| Per day | 1.58 (2.02) | 2.41 (2.89) |
| Herb/Spice | n Reporting Intake | % Reporting Intake |
|---|---|---|
| Anise, dried | 19 | 9.00% |
| Basil, sweet, dried | 89 | 42.00% |
| Basil, sweet, fresh | 84 | 39.60% |
| Black pepper | 170 | 80.20% |
| Cinnamon | 136 | 64.20% |
| Cloves | 50 | 23.60% |
| Cumin | 115 | 54.20% |
| Curry | 60 | 28.30% |
| Garlic, fresh | 143 | 67.50% |
| Ginger, dried | 64 | 30.20% |
| Ginger, fresh | 73 | 34.40% |
| Marjoram, dried | 13 | 6.10% |
| Marjoram, fresh | 10 | 4.70% |
| Mint, peppermint | 41 | 19.30% |
| Mint, spearmint | 26 | 12.30% |
| Nutmeg | 55 | 25.90% |
| Oregano, dried | 121 | 57.10% |
| Oregano, fresh | 28 | 13.20% |
| Parsley, dried | 82 | 38.70% |
| Parsley, fresh | 57 | 26.90% |
| Rosemary, dried | 77 | 36.30% |
| Rosemary, fresh | 31 | 14.60% |
| Sage, dried | 32 | 15.10% |
| Sage, fresh | 13 | 6.10% |
| Thyme, dried | 87 | 41.00% |
| Thyme, fresh | 20 | 9.40% |
| Turmeric, dried | 72 | 34.00% |
| g Per Month | g Per Day | |||
|---|---|---|---|---|
| Herb/Spice | Median (IQR) | Mean (SD) | Median (IQR) | Mean (SD) |
| Anise, dried | 1.15 (13.23) | 10.47 (23.36) | 0.44 (0.66) | 0.87 (1.49) |
| Basil, sweet, dried | 1.26 (2.30) | 2.58 (3.26) | 0.32 (0.54) | 0.53 (0.58) |
| Basil, sweet, fresh | 2.28 (4.42) | 3.85 (4.46) | 0.15 (0.37) | 0.33 (0.48) |
| Black pepper | 13.11 (19.80) | 26.08 (44.72) | 0.13 (0.34) | 0.35 (0.58) |
| Cinnamon | 2.69 (6.00) | 7.80 (14.65) | 0.10 (0.15) | 0.31 (0.70) |
| Cloves | 2.06 (4.43) | 6.00 (15.30) | 0.10 (0.53) | 0.37 (0.51) |
| Cumin | 3.05 (4.57) | 9.35 (21.04) | 0.10 (0.29) | 0.21 (0.25) |
| Curry | 2.53 (6.61) | 14.87 (58.89) | 0.09 (0.20) | 0.26 (0.49) |
| Garlic, fresh | 9.52 (16.32) | 15.93 (17.25) | 0.08 (0.22) | 0.5 (1.96) |
| Ginger, dried | 1.43 (3.57) | 5.34 (10.03) | 0.08 (0.22) | 0.31 (0.60) |
| Ginger, fresh | 4.40 (11.00) | 10.05 (14.54) | 0.08 (0.15) | 0.13 (0.15) |
| Marjoram, dried | 0.17 (0.38) | 0.37 (0.50) | 0.07 (0.15) | 0.20 (0.51) |
| Marjoram, fresh | 1.72 (3.41) | 2.26 (2.48) | 0.06 (0.11) | 0.08 (0.08) |
| Mint, peppermint | 0.80 (3.08) | 3.08 (6.04) | 0.05 (0.19) | 0.16 (0.35) |
| Mint, spearmint | 1.59 (5.83) | 4.90 (10.40) | 0.05 (0.12) | 0.18 (0.33) |
| Nutmeg | 1.05 (2.18) | 3.03 (6.49) | 0.05 (0.07) | 0.09 (0.14) |
| Oregano, dried | 1.35 (2.02) | 2.70 (4.09) | 0.04 (0.08) | 0.09 (0.11) |
| Oregano, fresh | 3.90 (10.23) | 10.65 (17.30) | 0.04 (0.44) | 0.35 (0.78) |
| Parsley, dried | 0.49 (1.40) | 0.94 (1.54) | 0.03 (0.07) | 0.10 (0.22) |
| Parsley, fresh | 2.38 (6.64) | 9.26 (17.96) | 0.03 (0.08) | 0.14 (0.45) |
| Rosemary, dried | 0.64 (3.59) | 3.59 (7.44) | 0.03 (0.10) | 0.10 (0.20) |
| Rosemary, fresh | 0.72 (1.80) | 2.50 (4.27) | 0.02 (0.06) | 0.08 (0.14) |
| Sage, dried | 0.35 (0.55) | 2.30 (5.51) | 0.02 (0.12) | 0.12 (0.25) |
| Sage, fresh | 0.52 (2.83) | 2.79 (5.16) | 0.02 (0.09) | 0.09 (0.17) |
| Thyme, dried | 0.98 (2.46) | 4.24 (13.36) | 0.02 (0.05) | 0.03 (0.05) |
| Thyme, fresh | 2.93 (8.77) | 6.25 (7.49) | 0.01 (0.02) | 0.08 (0.18) |
| Turmeric, dried | 3.03 (15.98) | 11.16 (15.18) | 0.01 (0.01) | 0.01 (0.02) |
| Median (IQR) | Mean (SD) | |
|---|---|---|
| Per month | 679.92 (1134.06) | 1143.31 (2327.41) |
| Per day | 22.66 (37.81) | 48.11 (77.58) |
| mg Per Month | mg Per Day | |||
|---|---|---|---|---|
| Herb/Spice | Median (IQR) | Mean (SD) | Median (IQR) | Mean (SD) |
| Anise, dried | 2.07 (23.81) | 18.84 (42.05) | 11.04 (23.71) | 32.09 (81.83) |
| Basil, sweet, dried | 54.58 (99.08) | 111.52 (140.55) | 8.71 (19.40) | 25.21 (47.37) |
| Basil, sweet, fresh | 5.28 (10.23) | 8.92 (10.33) | 4.37 (6.60) | 8.69 (14.91) |
| Black pepper | 131.1 (198.00) | 260.78 (447.23) | 3.48 (12.78) | 10.74 (22.80) |
| Cinnamon | 261.32 (582.05) | 756.32 (1421.21) | 2.14 (11.28) | 7.87 (10.71) |
| Cloves | 331.21 (711.33) | 962.79 (2454.84) | 2.07 (3.11) | 6.35 (14.29) |
| Cumin | 62.24 (93.18) | 190.59 (428.73) | 1.82 (3.30) | 3.72 (4.69) |
| Curry | 27.24 (71.01) | 159.88 (633.05) | 1.40 (2.10) | 2.81 (4.25) |
| Garlic, fresh | 8.29 (14.21) | 13.86 (15.02) | 1.22 (3.19) | 3.32 (5.39) |
| Ginger, dried | 6.75 (16.86) | 25.25 (47.46) | 1.14 (3.43) | 2.44 (2.93) |
| Ginger, fresh | 8.98 (22.44) | 20.50 (29.67) | 0.91 (2.37) | 5.33 (21.10) |
| Marjoram, dried | 6.62 (14.57) | 14.36 (19.13) | 0.67 (1.38) | 1.92 (4.12) |
| Marjoram, fresh | 14.71 (29.10) | 19.31 (21.19) | 0.59 (1.49) | 2.56 (8.08) |
| Mint, peppermint | 7.79 (30.14) | 30.15 (59.17) | 0.54 (3.01) | 3.01 (6.24) |
| Mint, spearmint | 104.54 (383.32) | 322.21 (683.98) | 0.49 (0.97) | 0.64 (0.71) |
| Nutmeg | 19.96 (41.52) | 57.74 (123.64) | 0.34 (0.54) | 2.24 (5.36) |
| Oregano, dried | 42.08 (62.93) | 84.25 (127.49) | 0.30 (0.75) | 0.68 (0.99) |
| Oregano, fresh | 36.47 (95.61) | 99.53 (161.71) | 0.28 (0.47) | 0.46 (0.50) |
| Parsley, dried | 7.68 (22.19) | 14.84 (24.43) | 0.26 (0.65) | 0.90 (1.54) |
| Parsley, fresh | 2.12 (5.91) | 8.24 (15.98) | 0.26 (1.00) | 1.00 (1.97) |
| Rosemary, dried | 16.12 (90.35) | 90.40 (187.28) | 0.26 (0.74) | 0.49 (0.81) |
| Rosemary, fresh | 7.80 (19.50) | 27.08 (46.21) | 0.22 (0.56) | 0.84 (1.58) |
| Sage, dried | 10.22 (16.07) | 67.11 (160.82) | 0.22 (0.49) | 0.48 (0.64) |
| Sage, fresh | 0.95 (5.25) | 5.16 (9.55) | 0.18 (0.34) | 0.30 (0.34) |
| Thyme, dried | 17.71 (44.65) | 76.88 (242.44) | 0.07 (0.20) | 0.27 (0.53) |
| Thyme, fresh | 34.35 (102.90) | 73.28 (87.80) | 0.07 (0.79) | 0.63 (1.40) |
| Turmeric, dried | 64.18 (338.31) | 236.17 (321.3) | 0.03 (0.17) | 0.17 (0.32) |
| Herb/Spice | Median (IQR) | Mean (SD) |
|---|---|---|
| Anise, dried | 0.60 (3.00)% | 18.59 (38.48)% |
| Basil, sweet, dried | 5.80 (11.95)% | 12.12 (16.60)% |
| Basil, sweet, fresh | 0.70 (1.25)% | 2.42 (11.06)% |
| Black pepper | 23.90 (35.40)% | 30.71 (27.19)% |
| Cinnamon | 31.75 (40.03)% | 34.77 (25.02)% |
| Cloves | 14.30 (30.60)% | 27.02 (28.84)% |
| Cumin | 7.30 (12.90)% | 14.33 (19.80)% |
| Curry | 4.50 (6.55)% | 6.94 (7.33)% |
| Garlic, fresh | 0.90 (1.90)% | 2.28 (4.19)% |
| Ginger, dried | 1.05 (2.73)% | 3.78 (9.73)% |
| Ginger, fresh | 0.80 (2.08)% | 3.73 (12.34)% |
| Marjoram, dried | 0.50 (2.68)% | 1.35 (1.39)% |
| Marjoram, fresh | 1.45 (53.85)% | 25.18 (41.19)% |
| Mint, peppermint | 1.50 (2.50)% | 6.05 (15.37)% |
| Mint, spearmint | 8.25 (16.05)% | 17.84 (26.76)% |
| Nutmeg | 1.90 (3.45)% | 4.59 (9.02)% |
| Oregano, dried | 5.30 (7.75)% | 8.57 (11.10)% |
| Oregano, fresh | 2.65 (12.53)% | 7.78 (10.91)% |
| Parsley, dried | 0.85 (1.93)% | 2.35 (4.43)% |
| Parsley, fresh | 0.65 (0.85)% | 1.01 (1.21)% |
| Rosemary, dried | 1.90 (7.70)% | 6.97 (11.18)% |
| Rosemary, fresh | 0.90 (1.90)% | 2.14 (3.06)% |
| Sage, dried | 0.90 (1.90)% | 4.44 (9.41)% |
| Sage, fresh | 0.30 (1.60)% | 1.86 (3.94)% |
| Thyme, dried | 2.00 (4.90)% | 5.74 (12.43)% |
| Thyme, fresh | 4.00 (8.10)% | 6.82 (8.09)% |
| Turmeric, dried | 6.20 (22.80)% | 19.72 (27.30)% |
Disclaimer/Publisher’s Note: The statements, opinions and data contained in all publications are solely those of the individual author(s) and contributor(s) and not of MDPI and/or the editor(s). MDPI and/or the editor(s) disclaim responsibility for any injury to people or property resulting from any ideas, methods, instructions or products referred to in the content. |
© 2025 by the author. Licensee MDPI, Basel, Switzerland. This article is an open access article distributed under the terms and conditions of the Creative Commons Attribution (CC BY) license (https://creativecommons.org/licenses/by/4.0/).
Share and Cite
Blanton, C. Polyphenol Intake from Herbs and Spices. Nutrients 2025, 17, 2445. https://doi.org/10.3390/nu17152445
Blanton C. Polyphenol Intake from Herbs and Spices. Nutrients. 2025; 17(15):2445. https://doi.org/10.3390/nu17152445
Chicago/Turabian StyleBlanton, Cynthia. 2025. "Polyphenol Intake from Herbs and Spices" Nutrients 17, no. 15: 2445. https://doi.org/10.3390/nu17152445
APA StyleBlanton, C. (2025). Polyphenol Intake from Herbs and Spices. Nutrients, 17(15), 2445. https://doi.org/10.3390/nu17152445