
A Low-Gluten Diet Reduces the Abundance of Potentially Beneficial Bacteria in Healthy Adult Gut Microbiota

 , , ,
, , ,  and
and
Abstract
1. Introduction
2. Material and Methods
2.1. Study Design
2.2. Diet Intervention
2.3. Faecal Samples Collection and DNA Extraction
2.4. 16S Ribosomal RNA (16S rRNA) Gene Sequencing
2.5. Quantitative PCR
2.6. Cultural Evaluation of Total Anaerobes, Enterobacteriaceae, and the Gluten-Degrading Community Levels
2.7. Isolation and Identification of the Main Gluten-Degrading Bacterial Species
2.8. Faecal Fermentative Metabolites Analysis
2.9. Statistical Analysis
3. Results
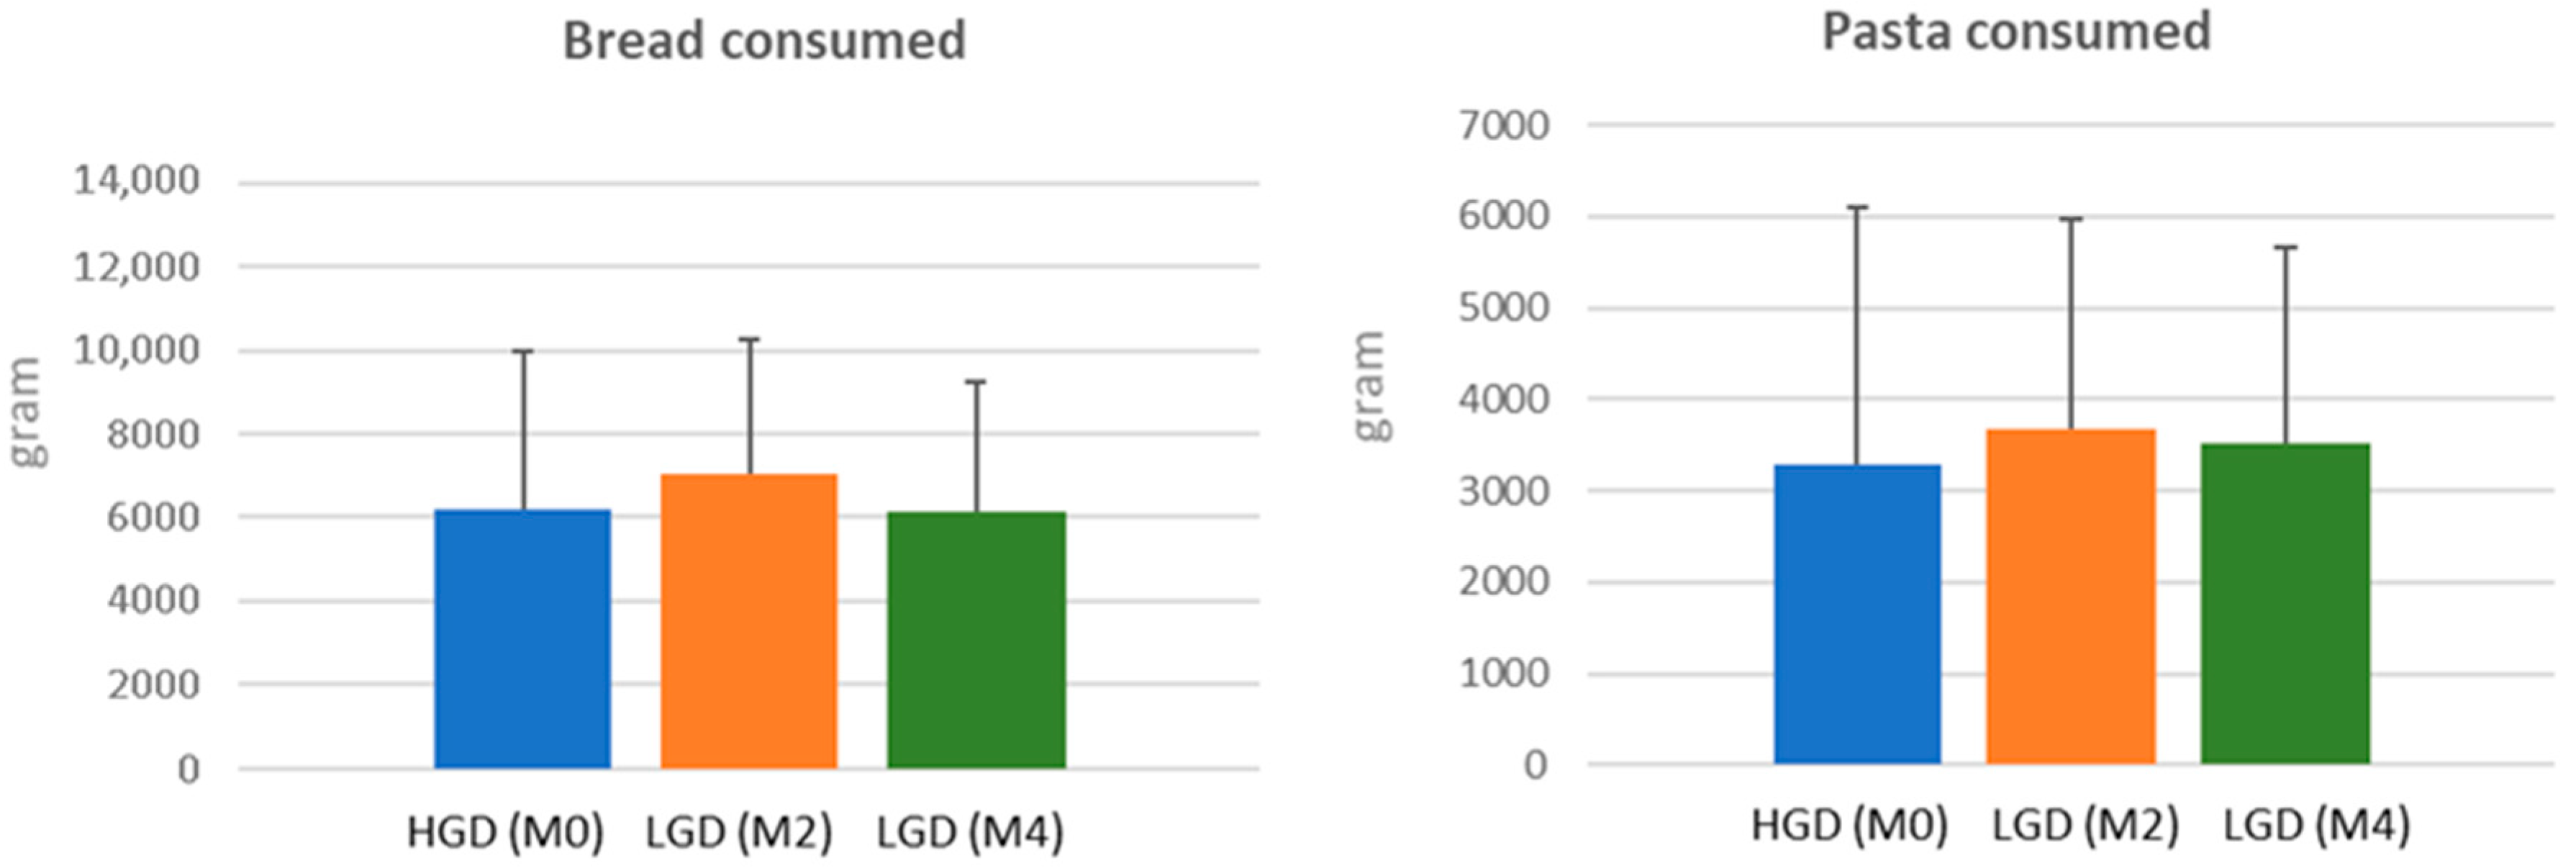
3.1. Food Intake
3.2. Evolution of Gut Microbial Diversity and Richness After a Low-Gluten Diet
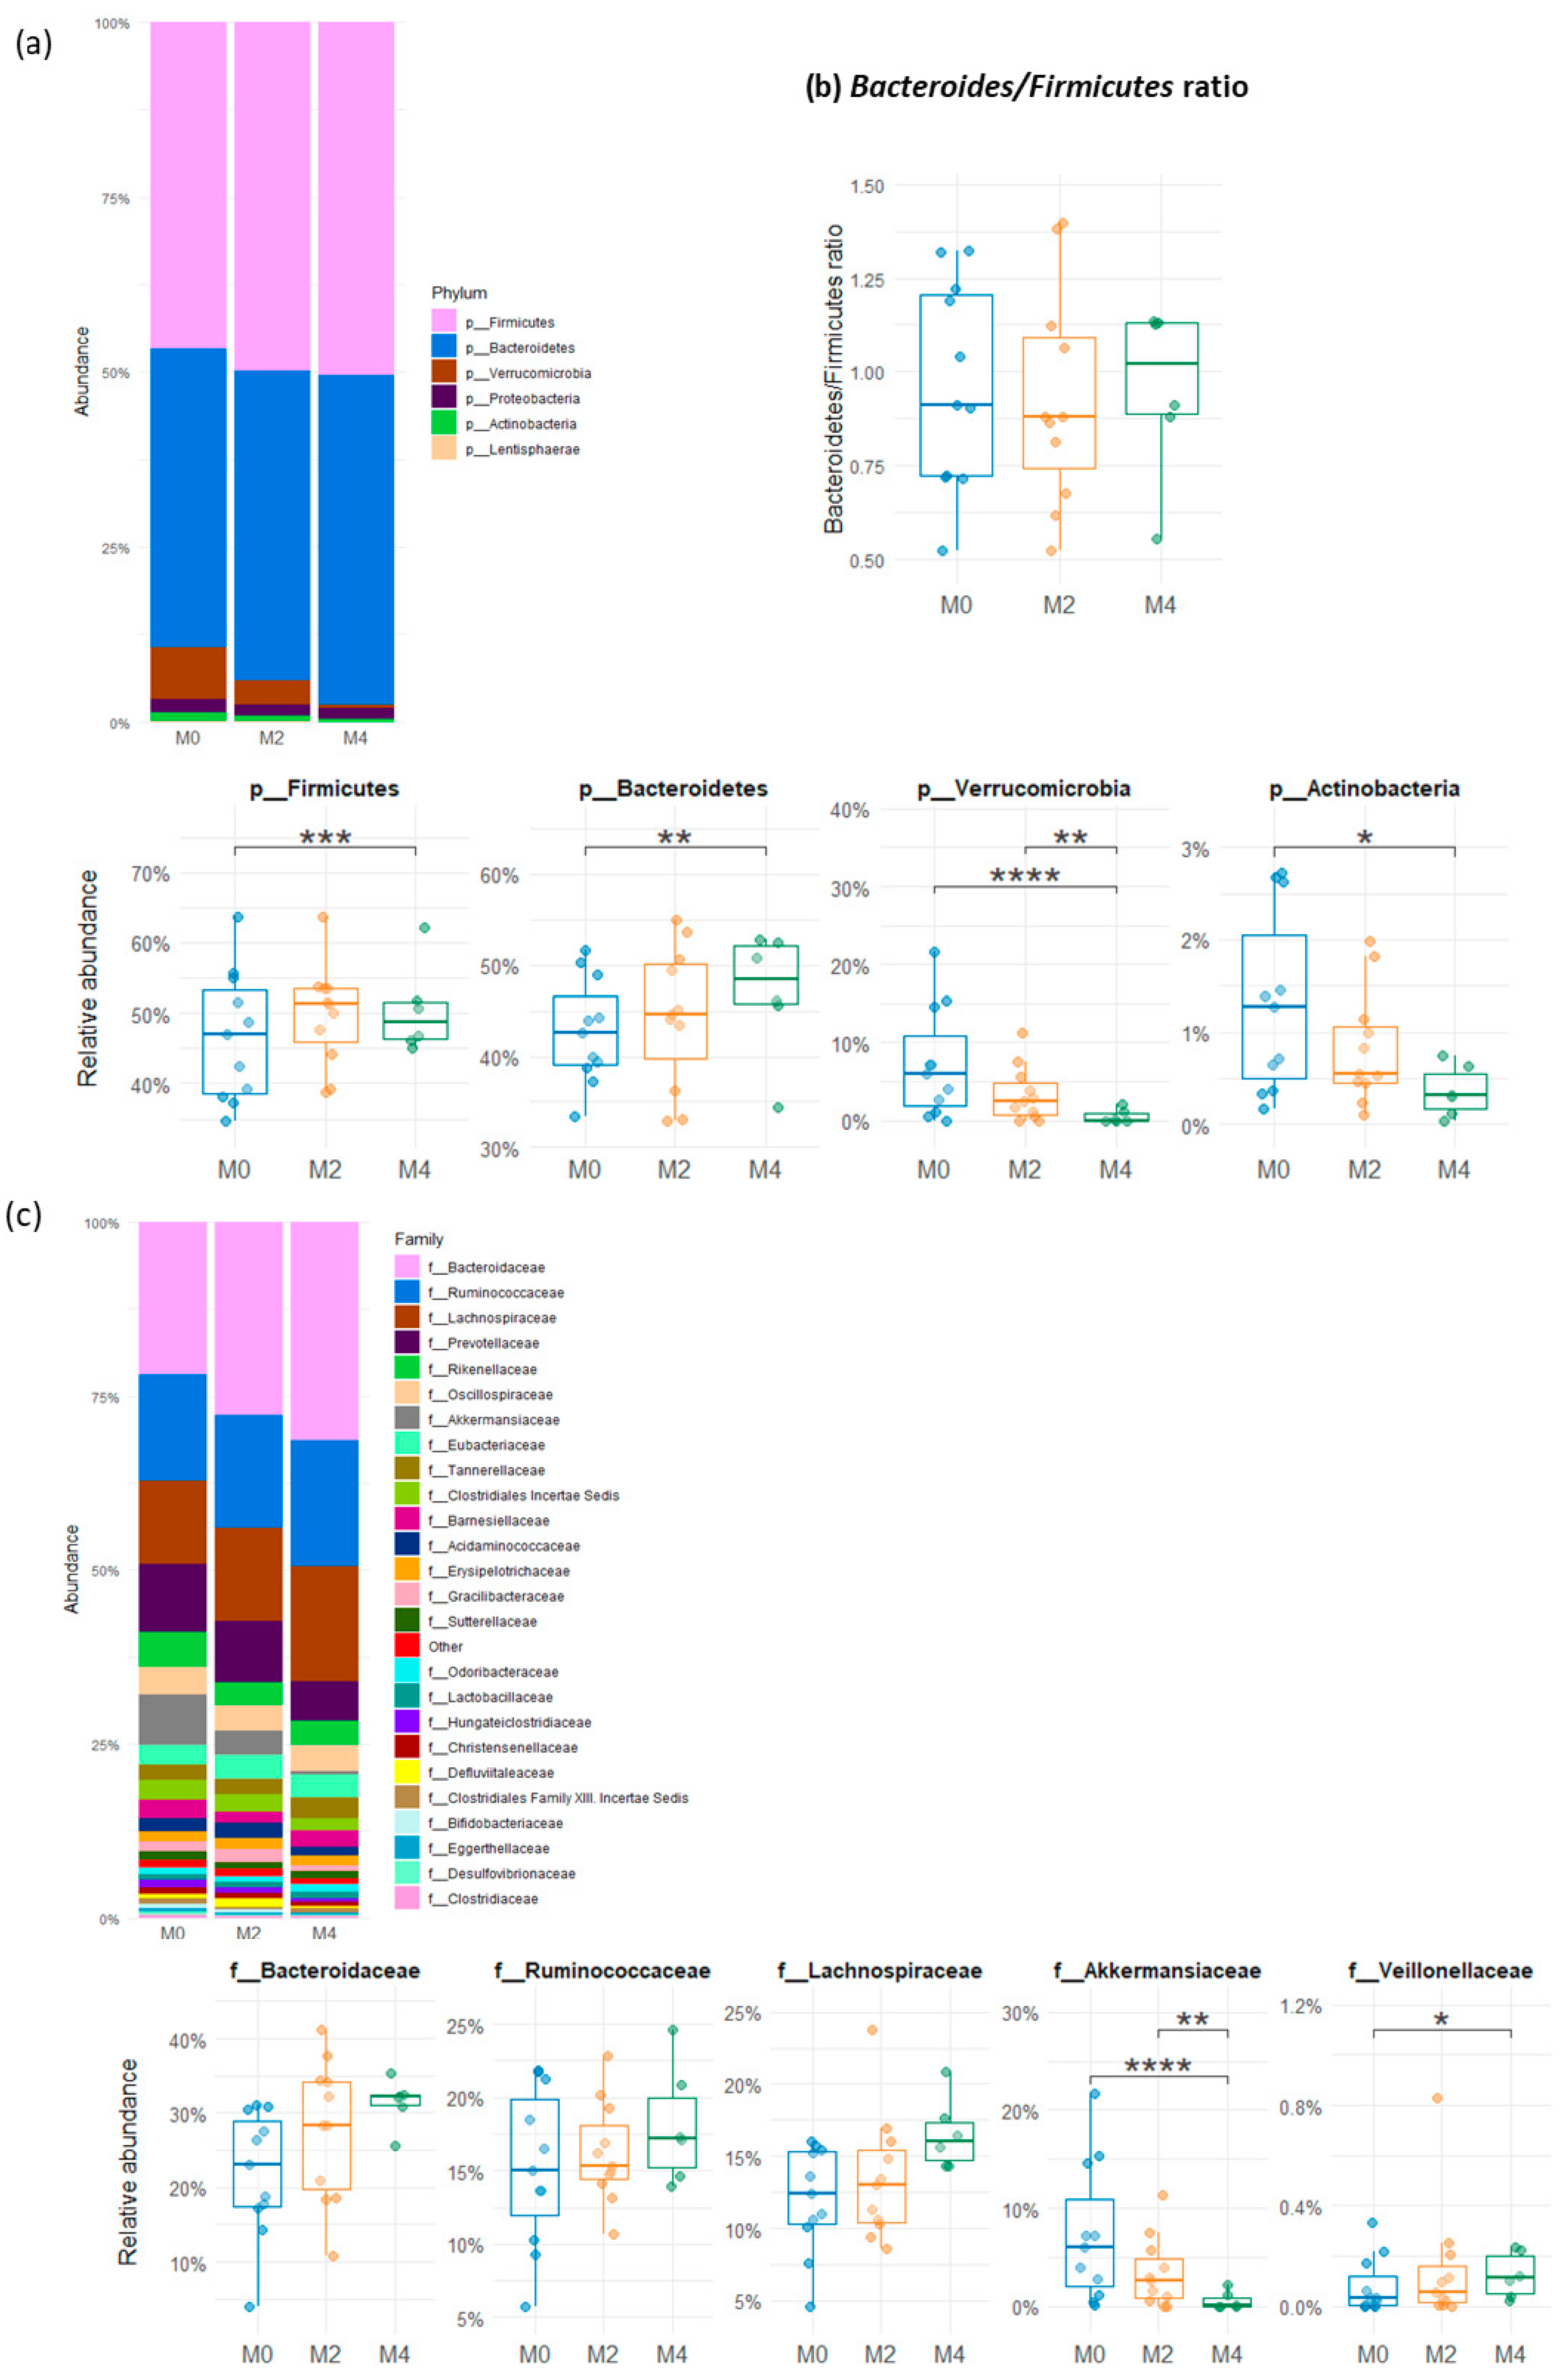
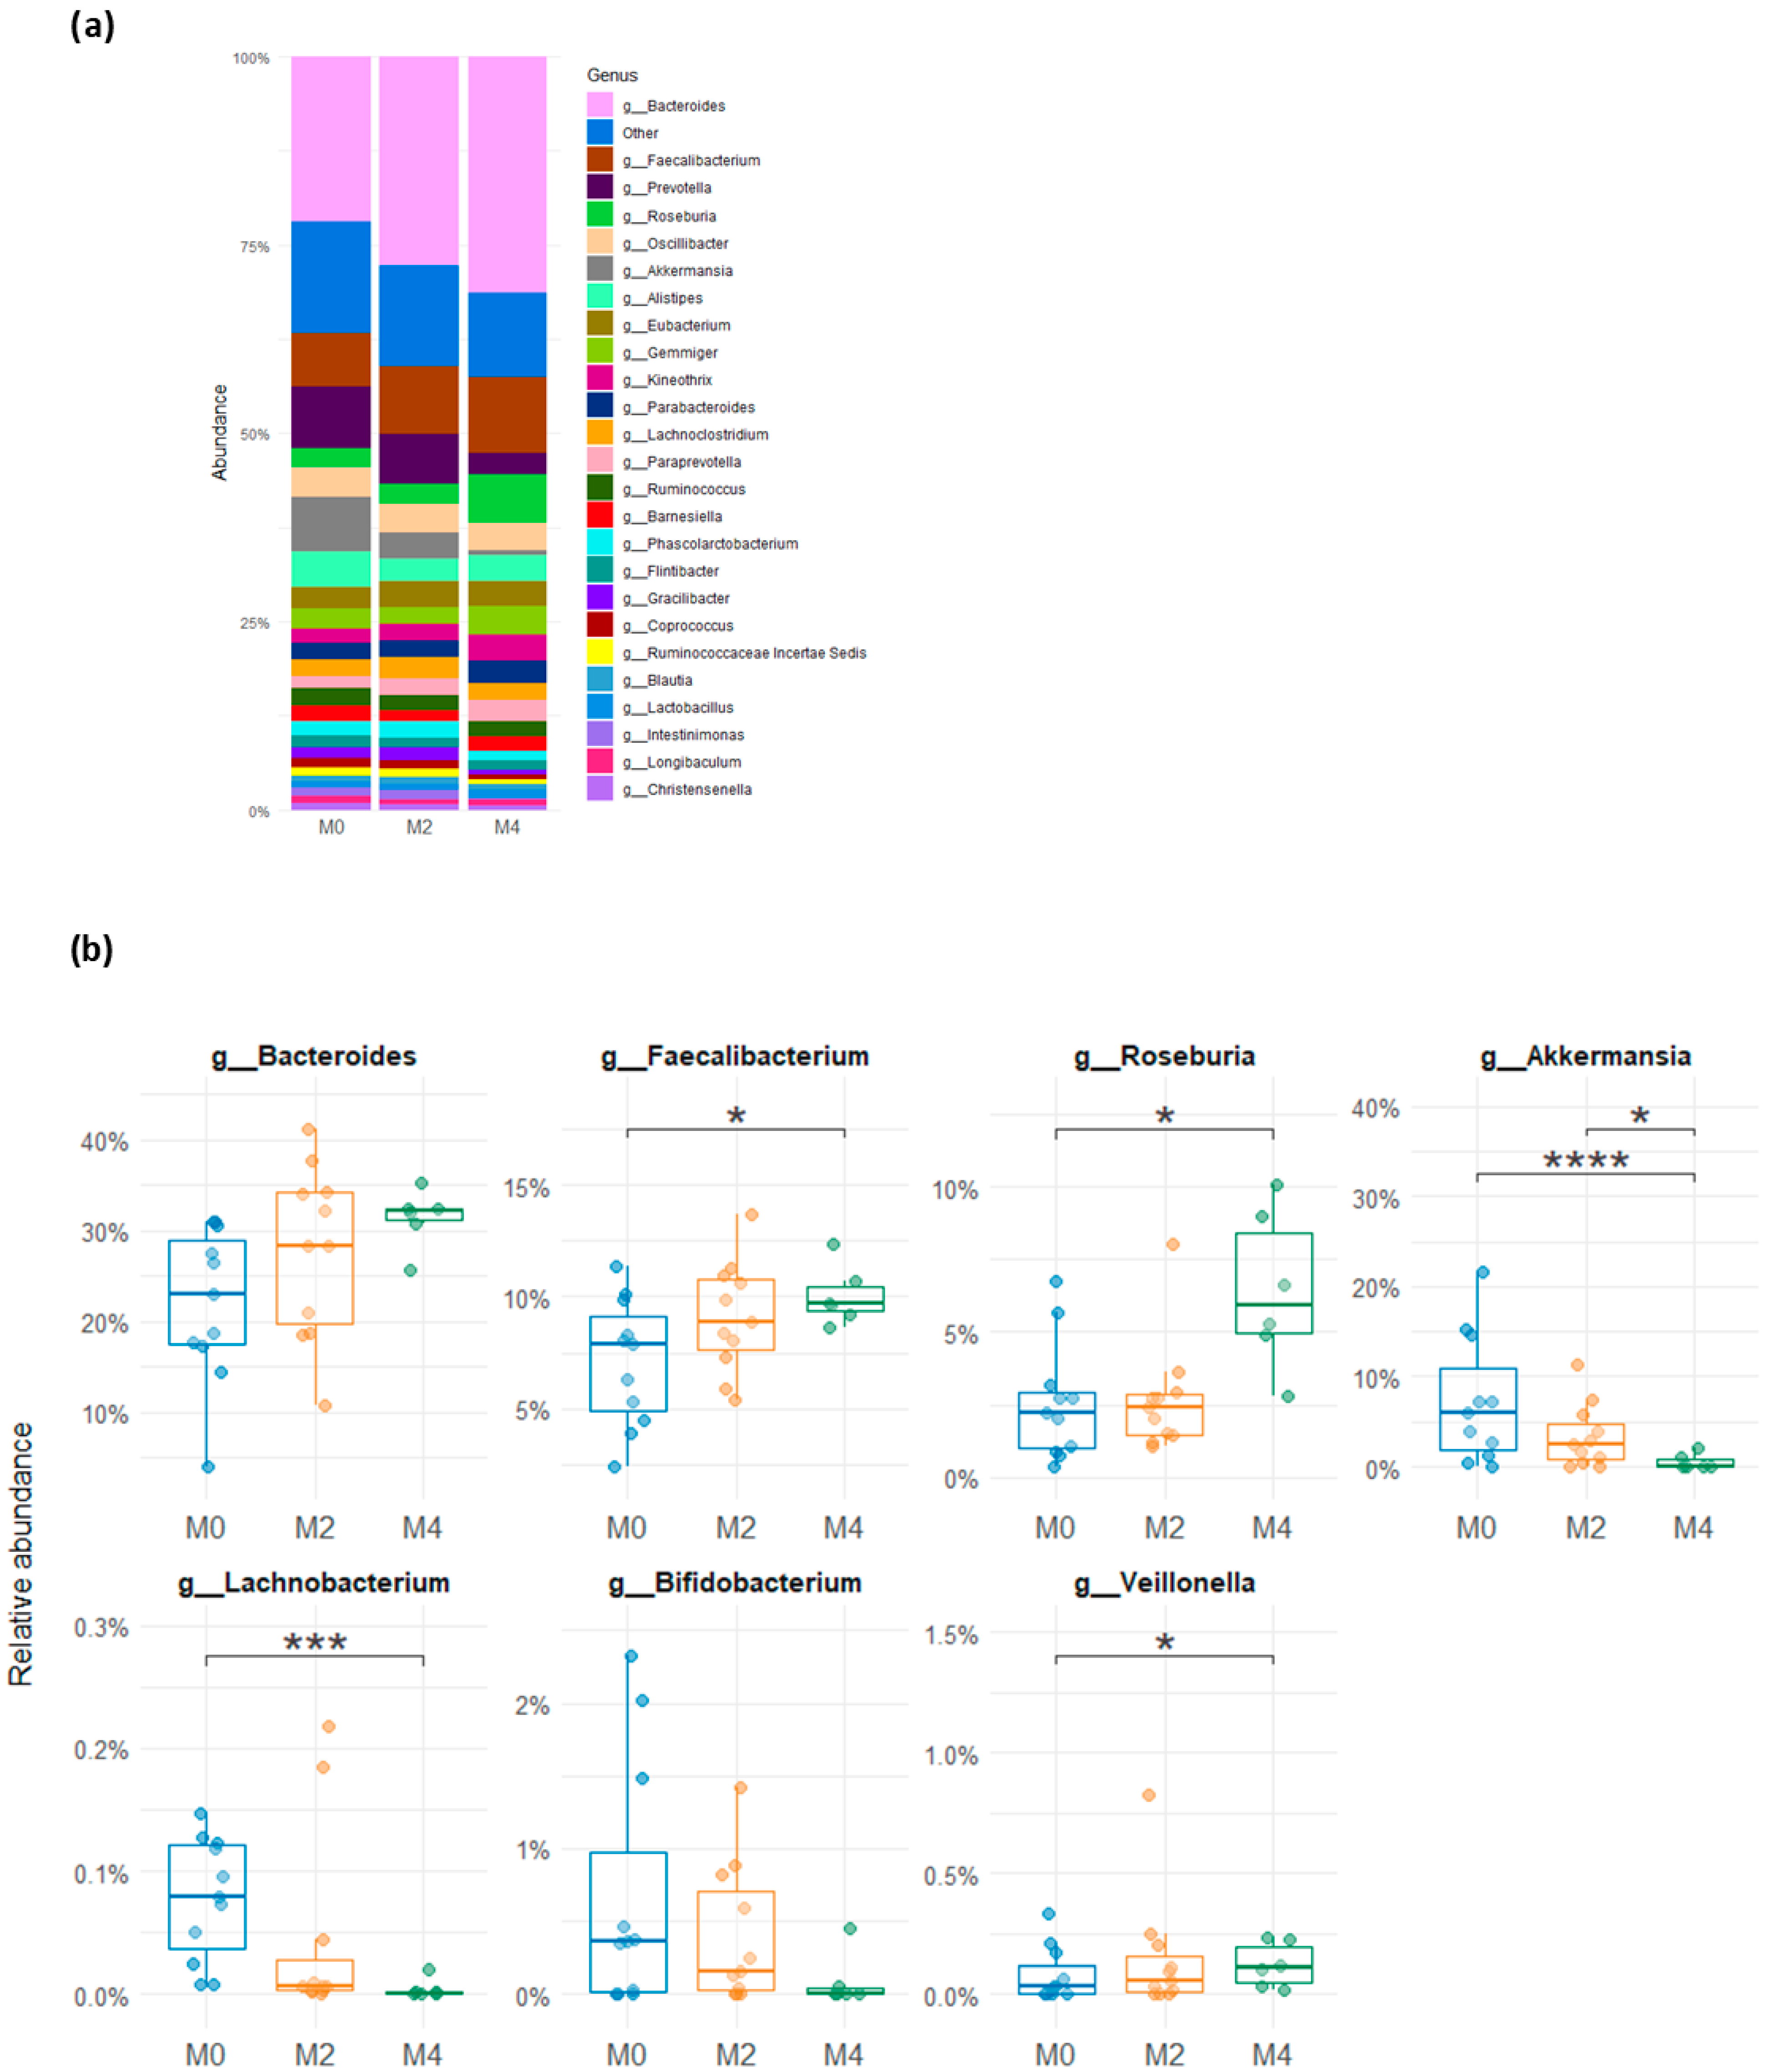
3.3. Variability in Relative Abundance of the Gut Microbial Groups After a Low-Gluten Diet
3.4. Molecular Quantification of Microbial Groups from the Human Gut After a Low-Gluten Diet
3.5. Evolution of Cultivable Total Anaerobes, Enterobacteriaceae and Gluten-Degrading Community
3.6. Analysis of Faecal Fermentative Metabolites
3.7. Composition of the Cultivable Gluten-Degrading Community
4. Discussion
5. Conclusions
Author Contributions
Funding
Institutional Review Board Statement
Informed Consent Statement
Data Availability Statement
Acknowledgments
Conflicts of Interest
References
- Hansen, L.B.S.; Roager, H.M.; Søndertoft, N.B.; Gøbel, R.J.; Kristensen, M.; Vallès-Colomer, M.; Vieira-Silva, S.; Ibrügger, S.; Lind, M.V.; Mærkedahl, R.B.; et al. A Low-Gluten Diet Induces Changes in the Intestinal Microbiome of Healthy Danish Adults. Nat. Commun. 2018, 9, 4630. [Google Scholar] [CrossRef] [PubMed]
- Caio, G.; Lungaro, L.; Segata, N.; Guarino, M.; Zoli, G.; Volta, U.; De Giorgio, R. Effect of Gluten-Free Diet on Gut Microbiota Composition in Patients with Celiac Disease and Non-Celiac Gluten/Wheat Sensitivity. Nutrients 2020, 12, 1832. [Google Scholar] [CrossRef] [PubMed]
- Bonder, M.J.; Tigchelaar, E.F.; Cai, X.; Trynka, G.; Cenit, M.C.; Hrdlickova, B.; Zhong, H.; Vatanen, T.; Gevers, D.; Wijmenga, C.; et al. The Influence of a Short-Term Gluten-Free Diet on the Human Gut Microbiome. Genome Med. 2016, 8, 45. [Google Scholar] [CrossRef] [PubMed]
- Niland, B.; Cash, B.D. Health Benefits and Adverse Effects of a Gluten-Free Diet in Non-Celiac Disease Patients. Gastroenterol. Hepatol. 2018, 14, 82–91. [Google Scholar]
- Cardo, A.; Churruca, I.; Lasa, A.; Navarro, V.; Vázquez-Polo, M.; Perez-Junkera, G.; Larretxi, I. Nutritional Imbalances in Adult Celiac Patients Following a Gluten-Free Diet. Nutrients 2021, 13, 2877. [Google Scholar] [CrossRef] [PubMed]
- Tortora, R.; Capone, P.; De Stefano, G.; Imperatore, N.; Gerbino, N.; Donetto, S.; Monaco, V.; Caporaso, N.; Rispo, A. Metabolic Syndrome in Patients with Coeliac Disease on a Gluten-free Diet. Aliment. Pharmacol. Ther. 2015, 41, 352–359. [Google Scholar] [CrossRef] [PubMed]
- De Palma, G.; Nadal, I.; Collado, M.C.; Sanz, Y. Effects of a Gluten-Free Diet on Gut Microbiota and Immune Function in Healthy Adult Human Subjects. Br. J. Nutr. 2009, 102, 1154–1160. [Google Scholar] [CrossRef] [PubMed]
- Hoppe, C.; Gøbel, R.; Kristensen, M.; Lind, M.V.; Matthiessen, J.; Christensen, T.; Trolle, E.; Fagt, S.; Madsen, M.L.; Husby, S. Intake and Sources of Gluten in 20- to 75-Year-Old Danish Adults: A National Dietary Survey. Eur. J. Nutr. 2017, 56, 107–117. [Google Scholar] [CrossRef] [PubMed]
- Van Overbeek, F.M.; Uil-Dieterman, I.G.A.; Mol, I.W.; Köhler-Brands, L.; Heymans, H.S.A.; Mulder, C.J.J. The Daily Gluten Intake in Relatives of Patients with Coeliac Disease Compared with That of the General Dutch Population. Eur. J. Gastroenterol. Hepatol. 1997, 9, 1097–1099. [Google Scholar] [CrossRef] [PubMed]
- Godon, J.J.; Zumstein, E.; Dabert, P.; Habouzit, F.; Moletta, R. Molecular Microbial Diversity of an Anaerobic Digestor as Determined by Small-Subunit rDNA Sequence Analysis. Appl. Environ. Microbiol. 1997, 63, 2802–2813. [Google Scholar] [CrossRef] [PubMed]
- McMurdie, P.J.; Holmes, S. Phyloseq: An R Package for Reproducible Interactive Analysis and Graphics of Microbiome Census Data. PLoS ONE 2013, 8, e61217. [Google Scholar] [CrossRef] [PubMed]
- Furet, J.-P.; Firmesse, O.; Gourmelon, M.; Bridonneau, C.; Tap, J.; Mondot, S.; Doré, J.; Corthier, G. Comparative Assessment of Human and Farm Animal Faecal Microbiota Using Real-Time Quantitative PCR: Human and Farm Animal Faecal Microbiota. FEMS Microbiol. Ecol. 2009, 68, 351–362. [Google Scholar] [CrossRef] [PubMed]
- Guo, X.; Xia, X.; Tang, R.; Zhou, J.; Zhao, H.; Wang, K. Development of a Real-Time PCR Method for Firmicutes and Bacteroidetes in Faeces and Its Application to Quantify Intestinal Population of Obese and Lean Pigs. Lett. Appl. Microbiol. 2008, 47, 367–373. [Google Scholar] [CrossRef] [PubMed]
- Yang, Y.-W.; Chen, M.-K.; Yang, B.-Y.; Huang, X.-J.; Zhang, X.-R.; He, L.-Q.; Zhang, J.; Hua, Z.-C. Use of 16S rRNA Gene-Targeted Group-Specific Primers for Real-Time PCR Analysis of Predominant Bacteria in Mouse Feces. Appl. Environ. Microbiol. 2015, 81, 6749–6756. [Google Scholar] [CrossRef] [PubMed]
- Delroisse, J.-M.; Boulvin, A.-L.; Parmentier, I.; Dauphin, R.D.; Vandenbol, M.; Portetelle, D. Quantification of Bifidobacterium spp. and Lactobacillus spp. in Rat Fecal Samples by Real-Time PCR. Microbiol. Res. 2008, 163, 663–670. [Google Scholar] [CrossRef] [PubMed]
- Ramirez-Farias, C.; Slezak, K.; Fuller, Z.; Duncan, A.; Holtrop, G.; Louis, P. Effect of Inulin on the Human Gut Microbiota: Stimulation of Bifidobacterium adolescentis and Faecalibacterium prausnitzii. Br. J. Nutr. 2008, 101, 541–550. [Google Scholar] [CrossRef] [PubMed]
- Collado, M.C.; Donat, E.; Ribes-Koninckx, C.; Calabuig, M.; Sanz, Y. Imbalances in Faecal and Duodenal Bifidobacterium Species Composition in Active and Non-Active Coeliac Disease. BMC Microbiol. 2008, 8, 232. [Google Scholar] [CrossRef] [PubMed]
- Huijsdens, X.W.; Linskens, R.K.; Mak, M.; Meuwissen, S.G.M.; Vandenbroucke-Grauls, C.M.J.E.; Savelkoul, P.H.M. Quantification of Bacteria Adherent to Gastrointestinal Mucosa by Real-Time PCR. J. Clin. Microbiol. 2002, 40, 4423–4427. [Google Scholar] [CrossRef] [PubMed]
- Chassard, C.; Goumy, V.; Leclerc, M.; Del’homme, C.; Bernalier-Donadille, A. Characterization of the Xylan-Degrading Microbial Community from Human Faeces: Xylanolytic Microbiota from Human Faeces. FEMS Microbiol. Ecol. 2007, 61, 121–131. [Google Scholar] [CrossRef] [PubMed]
- Leedle, J.A.; Hespell, R.B. Differential Carbohydrate Media and Anaerobic Replica Plating Techniques in Delineating Carbohydrate-Utilizing Subgroups in Rumen Bacterial Populations. Appl. Environ. Microbiol. 1980, 39, 709–719. [Google Scholar] [CrossRef] [PubMed]
- Robert, C.; Bernalier-Donadille, A. The Cellulolytic Microflora of the Human Colon: Evidence of Microcrystalline Cellulose-Degrading Bacteria in Methane-Excreting Subjects. FEMS Microbiol. Ecol. 2003, 46, 81–89. [Google Scholar] [CrossRef] [PubMed]
- Chassard, C.; Delmas, E.; Robert, C.; Lawson, P.A.; Bernalier-Donadille, A. Ruminococcus champanellensis sp. Nov., a Cellulose-Degrading Bacterium from Human Gut Microbiota. Int. J. Syst. Evol. Microbiol. 2012, 62, 138–143. [Google Scholar] [CrossRef] [PubMed]
- Matulova, M.; Nouaille, R.; Capek, P.; Péan, M.; Forano, E.; Delort, A.-M. Degradation of Wheat Straw by Fibrobacter succinogenes S85: A Liquid- and Solid-State Nuclear Magnetic Resonance Study. Appl. Environ. Microbiol. 2005, 71, 1247–1253. [Google Scholar] [CrossRef] [PubMed]
- Zhao, G.; Nyman, M.; Åke Jönsson, J. Rapid Determination of Short-Chain Fatty Acids in Colonic Contents and Faeces of Humans and Rats by Acidified Water-Extraction and Direct-Injection Gas Chromatography. Biomed. Chromatogr. 2006, 20, 674–682. [Google Scholar] [CrossRef] [PubMed]
- Falony, G.; Vieira-Silva, S.; Raes, J. Richness and Ecosystem Development across Faecal Snapshots of the Gut Microbiota. Nat. Microbiol. 2018, 3, 526–528. [Google Scholar] [CrossRef] [PubMed]
- Tap, J.; Furet, J.; Bensaada, M.; Philippe, C.; Roth, H.; Rabot, S.; Lakhdari, O.; Lombard, V.; Henrissat, B.; Corthier, G.; et al. Gut Microbiota Richness Promotes Its Stability upon Increased Dietary Fibre Intake in Healthy Adults. Environ. Microbiol. 2015, 17, 4954–4964. [Google Scholar] [CrossRef] [PubMed]
- Everard, A.; Belzer, C.; Geurts, L.; Ouwerkerk, J.P.; Druart, C.; Bindels, L.B.; Guiot, Y.; Derrien, M.; Muccioli, G.G.; Delzenne, N.M.; et al. Cross-Talk between Akkermansia muciniphila and Intestinal Epithelium Controls Diet-Induced Obesity. Proc. Natl. Acad. Sci. USA 2013, 110, 9066–9071. [Google Scholar] [CrossRef] [PubMed]
- Salonen, A.; De Vos, W.M. Impact of Diet on Human Intestinal Microbiota and Health. Annu. Rev. Food Sci. Technol. 2014, 5, 239–262. [Google Scholar] [CrossRef] [PubMed]
- Zou, Y.; Chen, T. Engineered Akkermansia Muciniphila: A Promising Agent against Diseases (Review). Exp. Ther. Med. 2020, 20, 285. [Google Scholar] [CrossRef] [PubMed]
- Depommier, C.; Everard, A.; Druart, C.; Plovier, H.; Van Hul, M.; Vieira-Silva, S.; Falony, G.; Raes, J.; Maiter, D.; Delzenne, N.M.; et al. Supplementation with Akkermansia muciniphila in Overweight and Obese Human Volunteers: A Proof-of-Concept Exploratory Study. Nat. Med. 2019, 25, 1096–1103. [Google Scholar] [CrossRef] [PubMed]
- Bueno, C.; Thys, R.; Tischer, B. Potential Effects of the Different Matrices to Enhance the Polyphenolic Content and Antioxidant Activity in Gluten-Free Bread. Foods 2023, 12, 4415. [Google Scholar] [CrossRef] [PubMed]
- Feng, G.; Han, K.; Yang, Q.; Feng, W.; Guo, J.; Wang, J.; Yang, X. Interaction of Pyrogallol-Containing Polyphenols with Mucin Reinforces Intestinal Mucus Barrier Properties. J. Agric. Food Chem. 2022, 70, 9536–9546. [Google Scholar] [CrossRef] [PubMed]
- Collado, M.C.; Derrien, M.; Isolauri, E.; De Vos, W.M.; Salminen, S. Intestinal Integrity and Akkermansia muciniphila, a Mucin-Degrading Member of the Intestinal Microbiota Present in Infants, Adults, and the Elderly. Appl. Environ. Microbiol. 2007, 73, 7767–7770. [Google Scholar] [CrossRef] [PubMed]
- Golfetto, L.; Senna, F.D.D.; Hermes, J.; Beserra, B.T.S.; França, F.D.S.; Martinello, F. Lower Bifidobacteria counts in adult patients with celiac disease on a gluten-free diet. Arq. Gastroenterol. 2014, 51, 139–143. [Google Scholar] [CrossRef] [PubMed]
- Halmos, E.P.; Christophersen, C.T.; Bird, A.R.; Shepherd, S.J.; Gibson, P.R.; Muir, J.G. Diets That Differ in Their FODMAP Content Alter the Colonic Luminal Microenvironment. Gut 2015, 64, 93–100. [Google Scholar] [CrossRef] [PubMed]
- Bennet, S.M.P.; Böhn, L.; Störsrud, S.; Liljebo, T.; Collin, L.; Lindfors, P.; Törnblom, H.; Öhman, L.; Simrén, M. Multivariate Modelling of Faecal Bacterial Profiles of Patients with IBS Predicts Responsiveness to a Diet Low in FODMAPs. Gut 2018, 67, 872–881. [Google Scholar] [CrossRef] [PubMed]
- Caminero, A.; Herrán, A.R.; Nistal, E.; Pérez-Andrés, J.; Vaquero, L.; Vivas, S.; Ruiz De Morales, J.M.G.; Albillos, S.M.; Casqueiro, J. Diversity of the Cultivable Human Gut Microbiome Involved in Gluten Metabolism: Isolation of Microorganisms with Potential Interest for Coeliac Disease. FEMS Microbiol. Ecol. 2014, 88, 309–319. [Google Scholar] [CrossRef] [PubMed]
- Chassaing, B.; Koren, O.; Goodrich, J.; Poole, A.; Srinivasan, S.; Ley, R.E.; Gewirtz, A.T. Dietary Emulsifiers Impact The Mouse Gut Microbiota Promoting Colitis and Metabolic Syndrome. Nature 2015, 519, 92–96. [Google Scholar] [CrossRef] [PubMed]
- Mbaye, B.; Magdy Wasfy, R.; Borentain, P.; Tidjani Alou, M.; Mottola, G.; Bossi, V.; Caputo, A.; Gerolami, R.; Million, M. Increased Fecal Ethanol and Enriched Ethanol-Producing Gut Bacteria Limosilactobacillus fermentum, Enterocloster bolteae, Mediterraneibacter gnavus and Streptococcus mutans in Nonalcoholic Steatohepatitis. Front. Cell. Infect. Microbiol. 2023, 13, 1279354. [Google Scholar] [CrossRef] [PubMed]
- Chen, J.; Vitella, L. Gut Microbiota Metabolites in NAFLD Pathogenesis and Therapeutic Implications. Int. J. Mol. Sci. 2020, 21, 5214. [Google Scholar] [CrossRef] [PubMed]
- Haas, K.N.; Blanchard, J.L. Reclassification of the Clostridium clostridioforme and Clostridium sphenoides Clades as Enterocloster Gen. Nov. and Lacrimispora Gen. Nov., Including Reclassification of 15 Taxa. Int. J. Syst. Evol. Microbiol. 2020, 70, 23–34. [Google Scholar] [CrossRef] [PubMed]
- Herrán, A.R.; Pérez-Andrés, J.; Caminero, A.; Nistal, E.; Vivas, S.; Ruiz De Morales, J.M.; Casqueiro, J. Gluten-Degrading Bacteria Are Present in the Human Small Intestine of Healthy Volunteers and Celiac Patients. Res. Microbiol. 2017, 168, 673–684. [Google Scholar] [CrossRef] [PubMed]


| Nutrient | HGD (n = 40) | LGD (n = 40) | p | ||
|---|---|---|---|---|---|
| Mean | SD | Mean | SD | ||
| Energy (Kcal) | 2505.1 | 561.0 | 2529.2 | 600.5 | ns |
| Protein (g) | 100.6 | 22.6 | 89.6 | 25.4 | ns |
| Protein (%) | 15.9 | 1.9 | 14.3 | 2.2 | ns |
| Carbohydrates (g) | 277.2 | 70.2 | 272.0 | 83.7 | ns |
| Carbohydrates (%) | 43.2 | 4.1 | 42.7 | 6.5 | ns |
| Fat (g) | 101.3 | 24.3 | 102.9 | 26.6 | ns |
| Fat (%) | 35.9 | 4.7 | 36.8 | 5.7 | ns |
| Strains | Subject | Identification | ||
|---|---|---|---|---|
| Class | Family | Species | ||
| LG1,5 | 1 | Clostridia | Lachnospiraceae | Enterocloster boltae |
| JB51 | 3 | Clostridia | Lachnospiraceae | Enterocloster boltae |
| LG3,1 | 1 | Clostridia | Lachnospiraceae | Enterocloster clostridioformis |
| M61 | 6 | Clostridia | Lachnospiraceae | Enterocloster citronae |
| LG4 | 1 | Clostridia | Lachnospiraceae | Hungatella hathewayi |
| M51 | 5 | Clostridia | Oscillospiraceae | Flavonifractor plautii |
| LG2,1 | 1 | Erysipelotricha | Erysipelotrichaceae | Clostridium innocuum |
| L32 | 4 | Erysipelotricha | Erysipelotrichaceae | Clostridium innocuum |
| LG2,2 | 1 | Erysipelotricha | Coprobacillaceae | Thomasclavelia ramosa |
| B9 | 2 | Actinomycetes | Bifidobacteriaceae | Bifidobacterium longum |
| LG1 | 1 | Gammaproteobacteria | Enterobacteriaceae | Escherichia coli |
| N61 | 6 | Gammaproteobacteria | Enterobacteriaceae | Escherichia coli |
Disclaimer/Publisher’s Note: The statements, opinions and data contained in all publications are solely those of the individual author(s) and contributor(s) and not of MDPI and/or the editor(s). MDPI and/or the editor(s) disclaim responsibility for any injury to people or property resulting from any ideas, methods, instructions or products referred to in the content. |
© 2025 by the authors. Licensee MDPI, Basel, Switzerland. This article is an open access article distributed under the terms and conditions of the Creative Commons Attribution (CC BY) license (https://creativecommons.org/licenses/by/4.0/).
Share and Cite
Delmas, E.; Bingula, R.; Del’homme, C.; Meunier, N.; Caille, A.; Lyon-Belgy, N.; Richard, R.; Do Couto, M.G.; Wittrant, Y.; Bernalier-Donadille, A. A Low-Gluten Diet Reduces the Abundance of Potentially Beneficial Bacteria in Healthy Adult Gut Microbiota. Nutrients 2025, 17, 2389. https://doi.org/10.3390/nu17152389
Delmas E, Bingula R, Del’homme C, Meunier N, Caille A, Lyon-Belgy N, Richard R, Do Couto MG, Wittrant Y, Bernalier-Donadille A. A Low-Gluten Diet Reduces the Abundance of Potentially Beneficial Bacteria in Healthy Adult Gut Microbiota. Nutrients. 2025; 17(15):2389. https://doi.org/10.3390/nu17152389
Chicago/Turabian StyleDelmas, Eve, Rea Bingula, Christophe Del’homme, Nathalie Meunier, Aurélie Caille, Noëlle Lyon-Belgy, Ruddy Richard, Maria Gloria Do Couto, Yohann Wittrant, and Annick Bernalier-Donadille. 2025. "A Low-Gluten Diet Reduces the Abundance of Potentially Beneficial Bacteria in Healthy Adult Gut Microbiota" Nutrients 17, no. 15: 2389. https://doi.org/10.3390/nu17152389
APA StyleDelmas, E., Bingula, R., Del’homme, C., Meunier, N., Caille, A., Lyon-Belgy, N., Richard, R., Do Couto, M. G., Wittrant, Y., & Bernalier-Donadille, A. (2025). A Low-Gluten Diet Reduces the Abundance of Potentially Beneficial Bacteria in Healthy Adult Gut Microbiota. Nutrients, 17(15), 2389. https://doi.org/10.3390/nu17152389