

Comparative Effects of Time-Restricted Eating and the Ketogenic Diet on QRISK3-Assessed Cardiovascular Risk in Individuals with Obesity: A Longitudinal Analysis of Metabolic, Anthropometric, and Lifestyle Factors


Abstract
1. Introduction
2. Materials and Methods
2.1. Patient Inclusion and Exclusion Criteria
- ◦
- Adults aged 25 years or older with a BMI > 25 kg/m2 seeking nutritional counseling for weight loss.
- ◦
- Individuals from both urban and rural environments, representing diverse educational backgrounds.
- ◦
- Women at different menopausal stages (both menopausal and non-menopausal).
- ◦
- Participants who
- -
- Provided signed informed consent.
- -
- Completed all scheduled evaluations and demonstrated adherence to the prescribed dietary program throughout the study period were included in the final analysis.
- ◦
- Physiological Conditions:
- -
- Pregnant or breastfeeding women.
- ◦
- Medical and Pharmacological Conditions:
- -
- Use of dietary supplements or anti-obesity medications [25].
- -
- Patients with diabetes mellitus treated with:
- -
- Oral hypoglycemic agents associated with a risk of hypoglycemia (e.g., sulfonylureas) [26].
- -
- Insulin therapy.
- -
- History of dietary therapy in the past 12 months.
- -
- History of bariatric surgery.
- -
- Acute pancreatitis, renal or liver diseases (including chronic kidney disease and liver failure).
- -
- Porphyria diagnosis.
- ◦
- Obesity Due to Specific Etiologies:
- -
- Genetic conditions (e.g., Prader–Willi syndrome).
- -
- Iatrogenic causes (e.g., insulin therapy, corticosteroid therapy, antipsychotics).
- -
- Endocrinological disorders (e.g., Cushing’s syndrome, hypothyroidism, hypogonadism) [27].
- ◦
- Lifestyle and Compliance Issues:
- 12 ounces (355 mL) of beer (5% alcohol by volume).
- 8 ounces (237 mL) of malt liquor (7% alcohol by volume).
- 5 ounces (148 mL) of wine (12% alcohol by volume).
- 1.5 ounces (44 mL) of liquor or distilled spirits (40% alcohol by volume, also known as 80-proof liquor).
- -
- Adhere to the prescribed dietary program.
- -
- Attend scheduled medical visits.
2.2. Comprehensive Clinical Evaluation
- -
- A comprehensive anamnesis was conducted to collect data on demographic characteristics, medical history, behavioral factors, and laboratory results from the previous six months.
- -
- The QRISK3 score was calculated, interpreted, and explained, including the contributing variables, the absolute score, and the relative risk score.The primary non-invasive technique used was bioelectrical impedance analysis (BIA) for precise segmental body composition assessment. Based on these parameters, participants were stratified into subgroups for further analysis.
- ⇒
- Personal medical history: A detailed anamnesis assessed comorbidities relevant to QRISK3, including hypertension, diabetes, kidney disease, and cardiovascular risk factors. Family history of early angina or myocardial infarction was also recorded. Recent biological data, including glucose, lipid profile, uric acid, HbA1c, TSH, FT4, HOMA-IR, and 25-OH vitamin D, were collected for participant stratification. Menopausal status was documented for its impact on metabolic and cardiovascular risk.
- ⇒
- Factors related to behavior and lifestyle evaluated were as follows:
- ◦
- Physical activity level: Participants needed at least 150 min of moderate to vigorous exercise weekly or 30 min daily to avoid being classified as sedentary.
- ◦
- Sleep duration: Less than 7 h of sleep per night was considered sleep deprivation, following established guidelines [29].
- ◦
- ◦
- Smoking status: Participants were categorized as non-smokers, ex-smokers, or smokers (light: <10 cigarettes/day, moderate: 10–19/day, heavy: ≥20/day) for QRISK3 assessment.
- ⇒
- Nutritional status was evaluated using BMI, calculated as weight (kg)/height2 (m2) [31,32]. All measurements were conducted by a trained physician to ensure precision and reliability. To minimize variability, assessments were standardized by performing them at the same time of day, with participants advised to avoid intense physical activity and hydration fluctuations prior to evaluation.
- ◦
- Height Measurement: Height was assessed using a calibrated wall-mounted stadiometer, with participants standing upright, barefoot, and aligned for accuracy.
- ◦
- Body Weight Measurement: Weight was recorded using a certified mechanical scale (max. 180 kg), with participants standing upright, wearing minimal clothing, and without footwear.
- ◦
- Circumference Measurements: Waist circumference was measured at the midpoint between the last palpable rib and the iliac crest, while hip circumference was taken at the widest buttock region, using a non-elastic, calibrated tape parallel to the floor.
- ◦
- Waist-to-Hip Ratio (WHR): WHR was calculated as waist circumference (cm) divided by hip circumference (cm), ensuring standardized positioning and minimizing measurement error.
2.3. QRISK3 Score Calculation and Cardiovascular Risk Assessment
- Age (years).
- Sex (male/female).
- Ethnicity.
- Body mass index (BMI) (kg/m2).
- Systolic blood pressure (mmHg).
- Total cholesterol to high-density lipoprotein cholesterol (TC/HDL) ratio.
- Smoking status (non-smoker, ex-smoker, light smoker < 10 cigarettes/day, moderate smoker 10–19 cigarettes/day, heavy smoker ≥ 20 cigarettes/day).
- Diagnosis of hypertension.
- Diagnosis of type 2 diabetes mellitus.
- Diagnosis of chronic kidney disease (stages 3, 4, or 5).
- Diagnosis of rheumatoid arthritis.
- Diagnosis of systemic lupus erythematosus.
- History of atrial fibrillation.
- History of migraine.
- Diagnosis of severe mental illness (e.g., schizophrenia, bipolar disorder, major depression).
- Use of atypical antipsychotic medication.
- Regular corticosteroid therapy.
- Presence of erectile dysfunction (in male participants).
2.4. Clinical Weight Management Intervention
2.5. Statistical Analysis
3. Results
3.1. Baseline Characteristics of Participants Across Dietary Groups
3.2. Longitudinal and Comparative Analysis of Health Markers
4. Discussion
5. Conclusions
Author Contributions
Funding
Institutional Review Board Statement
Informed Consent Statement
Data Availability Statement
Acknowledgments
Conflicts of Interest
Abbreviations
References
- Kleinert, S.; Horton, R. Obesity: A major global health challenge. Lancet 2015, 385, 941. [Google Scholar]
- Pigeyre, M.; Yazdi, F.T.; Kaur, Y.; Meyre, D. Recent progress in genetics, epigenetics and metagenomics unveils the pathophysiology of human obesity. Clin. Sci. 2016, 130, 943–986. [Google Scholar] [CrossRef] [PubMed]
- Hubert, H.B.; Feinleib, M.; McNamara, P.M.; Castelli, W.P. Obesity as an independent risk factor for cardiovascular disease: A 26-year follow-up of participants in the Framingham Heart Study. Circulation 1983, 67, 968–977. [Google Scholar] [CrossRef] [PubMed]
- Kusminski, C.M.; Perez-Tilve, D.; Müller, T.D.; DiMarchi, R.D.; Tschöp, M.H.; Scherer, P.E. Transforming obesity: The advancement of multi-receptor drugs. Cell 2024, 187, 3829–3853. [Google Scholar] [CrossRef] [PubMed] [PubMed Central]
- Brüning, J.C.; Fenselau, H. Integrative neurocircuits that control metabolism and food intake. Science 2023, 381, eabl7398. [Google Scholar] [CrossRef] [PubMed]
- Busetto, L.; Dicker, D.; Frühbeck, G.; Halford, J.C.G.; Sbraccia, P.; Yumuk, V.; Goossens, G.H. A new framework for the diagnosis, staging and management of obesity in adults. Nat. Med. 2024, 30, 2395–2399. [Google Scholar] [CrossRef] [PubMed]
- Neufeld, L.M.; Hendriks, S.; Hugas, M. Healthy Diet: A Definition for the United Nations Food Systems Summit 2021. In Science and Innovations for Food Systems Transformation [Internet]; Von Braun, J., Afsana, K., Fresco, L.O., Hassan, M.H.A., Eds.; Springer: Cham, Switzerland, 2023. Available online: https://www.ncbi.nlm.nih.gov/books/NBK599644/ (accessed on 2 May 2025). [CrossRef]
- Bachar, A.; Birk, R. Ketogenic Diet Intervention for Obesity Weight-Loss—A Narrative Review, Challenges, and Open Questions. Curr. Nutr. Rep. 2025, 14, 43. [Google Scholar] [CrossRef]
- Westman, E.C.; Feinman, R.D.; Mavropoulos, J.C.; Vernon, M.C.; Volek, J.S.; Wortman, J.A.; Yancy, W.S.; Phinney, S.D. Low-carbohydrate nutrition and metabolism. Am. J. Clin. Nutr. 2007, 86, 276–284. [Google Scholar] [CrossRef] [PubMed]
- Masood, W.; Annamaraju, P.; Uppaluri, K.R. Ketogenic Diet. In StatPearls [Internet]; StatPearls Publishing: Treasure Island, FL, USA, 2023. Available online: https://www.ncbi.nlm.nih.gov/books/NBK499830/ (accessed on 29 May 2025).
- Oh, R.; Gilani, B.; Uppaluri, K.R. Low-Carbohydrate Diet. [Updated 17 August 2023]. In StatPearls [Internet]; StatPearls Publishing: Treasure Island, FL, USA, 2025. Available online: https://www.ncbi.nlm.nih.gov/books/NBK537084/ (accessed on 2 May 2025).
- O’Neill, B.; Raggi, P. The ketogenic diet: Pros and cons. Atherosclerosis 2020, 292, 119–126. [Google Scholar] [CrossRef] [PubMed]
- Ezpeleta, M.; Cienfuegos, S.; Lin, S.; Pavlou, V.; Gabel, K.; Tussing-Humphreys, L.; Varady, K.A. Time-restricted eating: Watching the clock to treat obesity. Cell Metab. 2024, 36, 301–314. [Google Scholar] [CrossRef] [PubMed] [PubMed Central]
- Chaix, A.; Manoogian, E.N.C.; Melkani, G.C.; Panda, S. Time-Restricted Eating to Prevent and Manage Chronic Metabolic Diseases. Annu. Rev. Nutr. 2019, 39, 291–315. [Google Scholar] [CrossRef] [PubMed] [PubMed Central]
- Patikorn, C.; Roubal, K.; Veettil, S.K.; Chandran, V.; Pham, T.; Lee, Y.Y.; Giovannucci, E.L.; Varady, K.A.; Chaiyakunapruk, N. Intermittent Fasting and Obesity-Related Health Outcomes: An Umbrella Review of Meta-analyses of Randomized Clinical Trials. JAMA Netw. Open 2021, 4, e2139558. [Google Scholar] [CrossRef] [PubMed] [PubMed Central]
- Varady, K.A.; Cienfuegos, S.; Ezpeleta, M.; Gabel, K. Clinical application of intermittent fasting for weight loss: Progress and future directions. Nat. Rev. Endocrinol. 2022, 18, 309–321. [Google Scholar] [CrossRef] [PubMed]
- Heymsfield, S.B.; Gonzalez, M.C.; Shen, W.; Redman, L.; Thomas, D. Weight loss composition is one-fourth fat-free mass: A critical review and critique of this widely cited rule. Obes. Rev. 2014, 15, 310–321. [Google Scholar] [CrossRef]
- Templeman, I.; Smith, H.A.; Chowdhury, E.; Chen, Y.C.; Carroll, H.; Johnson-Bonson, D.; Hengist, A.; Smith, R.; Creighton, J.; Clayton, D.; et al. A randomized controlled trial to isolate the effects of fasting and energy restriction on weight loss and metabolic health in lean adults. Sci. Transl. Med. 2021, 13, eabd8034. [Google Scholar] [CrossRef] [PubMed]
- Olgin, J.E.; Wu, N.; Weiss, E.J.; Heymsfield, S.B.; Philip, E.; Lowe, D.A.; Moore, A.H.; Vittinghoff, E.; Shepherd, J.A.; Kelly, N.; et al. Effects of Time-Restricted Eating on Weight Loss and Other Metabolic Parameters in Women and Men With Overweight and Obesity: The TREAT Randomized Clinical Trial. JAMA Intern. Med. 2020, 180, 1491–1499. [Google Scholar] [CrossRef]
- Hippisley-Cox, J.; Coupland, C.; Brindle, P. Development and validation of QRISK3 risk prediction algorithms to estimate future risk of cardiovascular disease: Prospective cohort study. BMJ 2017, 357, j2099. [Google Scholar] [CrossRef] [PubMed] [PubMed Central]
- ClinRisk Ltd. QRISK3-2018 Risk Calculator [Internet]; ClinRisk Ltd.: Leeds, UK, 2017; Available online: https://qrisk.org/three/ (accessed on 29 May 2025).
- Collins, G.S.; Altman, D.G. An independent external validation and evaluation of QRISK cardiovascular risk prediction: A prospective open cohort study. BMJ 2009, 339, b2584. [Google Scholar] [CrossRef] [PubMed] [PubMed Central]
- D’Agostino, R.B., Sr.; Vasan, R.S.; Pencina, M.J.; Wolf, P.A.; Cobain, M.; Massaro, J.M.; Kannel, W.B. General cardiovascular risk profile for use in primary care: The Framingham Heart Study. Circulation 2008, 117, 743–753. [Google Scholar] [CrossRef] [PubMed]
- Estruch, R.; Ros, E.; Salas-Salvadó, J.; Covas, M.I.; Corella, D.; Arós, F.; Gómez-Gracia, E.; Ruiz-Gutiérrez, V.; Fiol, M.; Lapetra, J.; et al. Primary Prevention of Cardiovascular Disease with a Mediterranean Diet Supplemented with Extra-Virgin Olive Oil or Nuts. N. Engl. J. Med. 2018, 378, e34. [Google Scholar] [CrossRef] [PubMed]
- Holt, R.I.; Bushe, C.; Citrome, L. Diabetes and schizophrenia 2005: Are we any closer to understanding the link? J. Psychopharmacol. 2005, 19 (Suppl. 6), 56–65. [Google Scholar] [CrossRef] [PubMed]
- Mitchell, S.L.; Leon, D.A.C.; Chaugai, S.; Kawai, V.K.; Levinson, R.T.; Wei, W.Q.; Stein, C.M. Pharmacogenetics of hypoglycemia associated with sulfonylurea therapy in usual clinical care. Pharmacogenomics J. 2020, 20, 831–839. [Google Scholar] [CrossRef] [PubMed] [PubMed Central]
- Magiakou, M.A.; Mastorakos, G.; Oldfield, E.H.; Gomez, M.T.; Doppman, J.L.; Cutler, G.B., Jr.; Nieman, L.K.; Chrousos, G.P. Cushing’s syndrome in children and adolescents. Presentation, diagnosis, and therapy. N. Engl. J. Med. 1994, 331, 629–636. [Google Scholar] [CrossRef] [PubMed]
- Alcohol Use and Your Health. 2024. Available online: https://www.cdc.gov/alcohol/about-alcohol-use/index.html (accessed on 8 March 2025).
- Watson, N.F.; Badr, M.S.; Belenky, G.; Bliwise, D.L.; Buxton, O.M.; Buysse, D.; Dinges, D.F.; Gangwisch, J.; Grandner, M.A.; Kushida, C.; et al. Recommended Amount of Sleep for a Healthy Adult: A Joint Consensus Statement of the American Academy of Sleep Medicine and Sleep Research Society. Sleep 2015, 38, 843–844. [Google Scholar] [CrossRef] [PubMed] [PubMed Central]
- Jagannathan, K.; Aydogan, G.; Spilka, N.; Kranzler, H.R.; Koellinger, P.D.; Nave, G.; Wetherill, R.R.; Daviet, R. Associations between alcohol consumption and gray and white matter volumes in the UK Biobank. Nat. Commun. 2022, 13, 1175. [Google Scholar] [CrossRef]
- Kuriyan, R. Body composition techniques. Indian J. Med. Res. 2018, 148, 648–658. [Google Scholar] [CrossRef] [PubMed] [PubMed Central]
- Weir, C.B.; Jan, A. BMI Classification Percentile And Cut Off Points. In StatPearls [Internet]; StatPearls Publishing: Treasure Island, FL, USA, 2025. [Google Scholar] [PubMed]
- QRISK3 Calculator. University of Nottingham. Available online: https://qrisk.org/ (accessed on 29 January 2025).
- Andreotti, F.; Crea, F.; Patti, G.; Shoulders, C.C.; Navarese, E.P.; Robishaw, J.; Maseri, A.; Hennekens, C.H. Family history in first degree relatives of patients with premature cardiovascular disease. Int. J. Cardiol. 2021, 333, 215–218. [Google Scholar] [CrossRef] [PubMed]
- Ene, C. Food Labeling in Romania in Relation to Consumer Protection. Econ. Insights Trends Chall. 2014, III (LXVI), 83–95. [Google Scholar]
- Gerrior, S.; Juan, W.; Basiotis, P. An easy approach to calculating estimated energy requirements. Prev. Chronic Dis. 2006, 3, A129. [Google Scholar]
- Human energy requirements: Report of a joint FAO/WHO/UNU Expert Consultation. Food Nutr. Bull. 2005, 26, 166. [PubMed]
- Mozaffarian, D.; Micha, R.; Wallace, S. Effects on coronary heart disease of increasing polyunsaturated fat in place of saturated fat: A systematic review and meta-analysis of randomized controlled trials. PLoS Med. 2010, 7, e1000252. [Google Scholar] [CrossRef] [PubMed] [PubMed Central]
- FAO. Dietary protein quality evaluation in human nutrition: Report of an FAO Expert Consultation. FAO Food Nutr Pap. 2013, 92, 1–66. [Google Scholar]
- Powell-Wiley, T.M.; Poirier, P.; Burke, L.E.; Després, J.P.; Gordon-Larsen, P.; Lavie, C.J.; Lear, S.A.; Ndumele, C.E.; Neeland, I.J.; Sanders, P.; et al. Obesity and Cardiovascular Disease: A Scientific Statement from the American Heart Association. Circulation 2021, 143, e984–e1010. [Google Scholar] [CrossRef] [PubMed] [PubMed Central]
- Hall, J.E.; do Carmo, J.M.; da Silva, A.A.; Wang, Z.; Hall, M.E. Obesity-induced hypertension: Interaction of neurohumoral and renal mechanisms. Circ. Res. 2015, 116, 991–1006. [Google Scholar] [CrossRef]
- Mu, X.; Wu, A.; Hu, H.; Zhou, H.; Yang, M. Assessment of QRISK3 as a predictor of cardiovascular disease events in type 2 diabetes mellitus. Front. Endocrinol. 2022, 13, 1077632. [Google Scholar] [CrossRef]
- Sadeghi, M.; Sarrafzadegan, N.; Mohebian, M.R.; OveisGharan, S.; Mansourian, M.; Talaei, M.; Masoudkabir, F.; Hassannejad, R.; Marateb, H.R.; Roohafza, H.R.; et al. PARS risk charts: A 10-year study of risk assessment for cardiovascular diseases in Eastern Mediterranean Region. PLoS ONE 2017, 12, e0189389, Correction in PLoS ONE 2018, 13, e0191379 https://doi.org/10.1371/journal.pone.0191379. [Google Scholar] [CrossRef]
- Kasim, S.S.; Ibrahim, N.; Malek, S.; Ibrahim, K.S.; Aziz, M.F.; Song, C.; Chia, Y.C.; Ramli, A.S.; Negishi, K.; Mat Nasir, N. Validation of the general Framingham Risk Score (FRS), SCORE2, revised PCE and WHO CVD risk scores in an Asian population. Lancet Reg. Health West. Pac. 2023, 35, 100742. [Google Scholar] [CrossRef] [PubMed] [PubMed Central]
- Stefan, N.; Häring, H.U.; Hu, F.B.; Schulze, M.B. Metabolically healthy obesity: Epidemiology, mechanisms, and clinical implications. Lancet Diabetes Endocrinol. 2013, 1, 152–162. [Google Scholar] [CrossRef] [PubMed]
- Wu, G.; Wu, J.; Lu, Q.; Cheng, Y.; Mei, W. Association between cardiovascular risk factors and atrial fibrillation. Front. Cardiovasc. Med. 2023, 10, 1110424. [Google Scholar] [CrossRef]
- Parsons, R.E.; Liu, X.; Collister, J.A.; Clifton, D.A.; Cairns, B.J.; Clifton, L. Independent external validation of the QRISK3 cardiovascular disease risk prediction model using UK Biobank. Heart 2023, 109, 1690–1697. [Google Scholar] [CrossRef]
- Zinman, B.; Wanner, C.; Lachin, J.M.; Fitchett, D.; Bluhmki, E.; Hantel, S.; Mattheus, M.; Devins, T.; Johansen, O.E.; Woerle, H.J.; et al. Empagliflozin, Cardiovascular Outcomes, and Mortality in Type 2 Diabetes. N. Engl. J. Med. 2015, 373, 2117–2128. [Google Scholar] [CrossRef] [PubMed]
- O’Donovan, G.; Lee, I.M.; Hamer, M.; Stamatakis, E. Association of “Weekend Warrior” and Other Leisure Time Physical Activity Patterns with Risks for All-Cause, Cardiovascular Disease, and Cancer Mortality. JAMA Intern Med. 2017, 177, 335–342. [Google Scholar] [CrossRef] [PubMed]
- Woodward, M.; Brindle, P.; Tunstall-Pedoe, H.; SIGN Group on Risk Estimation. Adding social deprivation and family history to cardiovascular risk assessment: The ASSIGN score from the Scottish Heart Health Extended Cohort (SHHEC). Heart 2007, 93, 172–176. [Google Scholar] [CrossRef] [PubMed] [PubMed Central]
- Kim, J.Y. Optimal Diet Strategies for Weight Loss and Weight Loss Maintenance. J. Obes. Metab. Syndr. 2021, 30, 20–31. [Google Scholar] [CrossRef]
- Makris, A.; Foster, G.D. Dietary approaches to the treatment of obesity. Psychiatr. Clin. N. Am. 2011, 34, 813–827. [Google Scholar] [CrossRef] [PubMed] [PubMed Central]
- Volek, J.S.; Vanheest, J.L.; Forsythe, C.E. Diet and exercise for weight loss: A review of current issues. Sports Med. 2005, 35, 1–9. [Google Scholar] [CrossRef] [PubMed]
- Wirth, A.; Wabitsch, M.; Hauner, H. The prevention and treatment of obesity. Dtsch. Arztebl. Int. 2014, 111, 705–713. [Google Scholar] [CrossRef] [PubMed] [PubMed Central]
- Wang, Z.; Chen, T.; Wu, S.; Dong, X.; Zhang, M.; Ma, G. Impact of the ketogenic diet as a dietary approach on cardiovascular disease risk factors: A meta-analysis of randomized clinical trials. Am. J. Clin. Nutr. 2024, 120, 294–309. [Google Scholar] [CrossRef] [PubMed]
- Gabel, K.; Cienfuegos, S.; Kalam, F.; Ezpeleta, M.; Varady, K.A. Time-Restricted Eating to Improve Cardiovascular Health. Curr. Atheroscler. Rep. 2021, 23, 22. [Google Scholar] [CrossRef] [PubMed] [PubMed Central]

| Variable | TRE N = 26 | KD N = 23 | p-Value |
|---|---|---|---|
| Age | 37.50 (28.25–48.00) | 36.00 (29.50–42.50) | 0.790 |
| BMI | 30.3 (27.4–33.2) | 33.20 (31.9–37.8) | 0.020 |
| WC | 100.50 (91.00–110.75) | 110.00 (97.50–122.50) | 0.040 |
| WHR | 0.90 (0.88–1.07) | 0.98 (0.92–1.17) | 0.040 |
| TC | 187 (167–219) | 200 (145–242) | 0.860 |
| HDL-C | 54 (45–60) | 48 (46–60) | 0.600 |
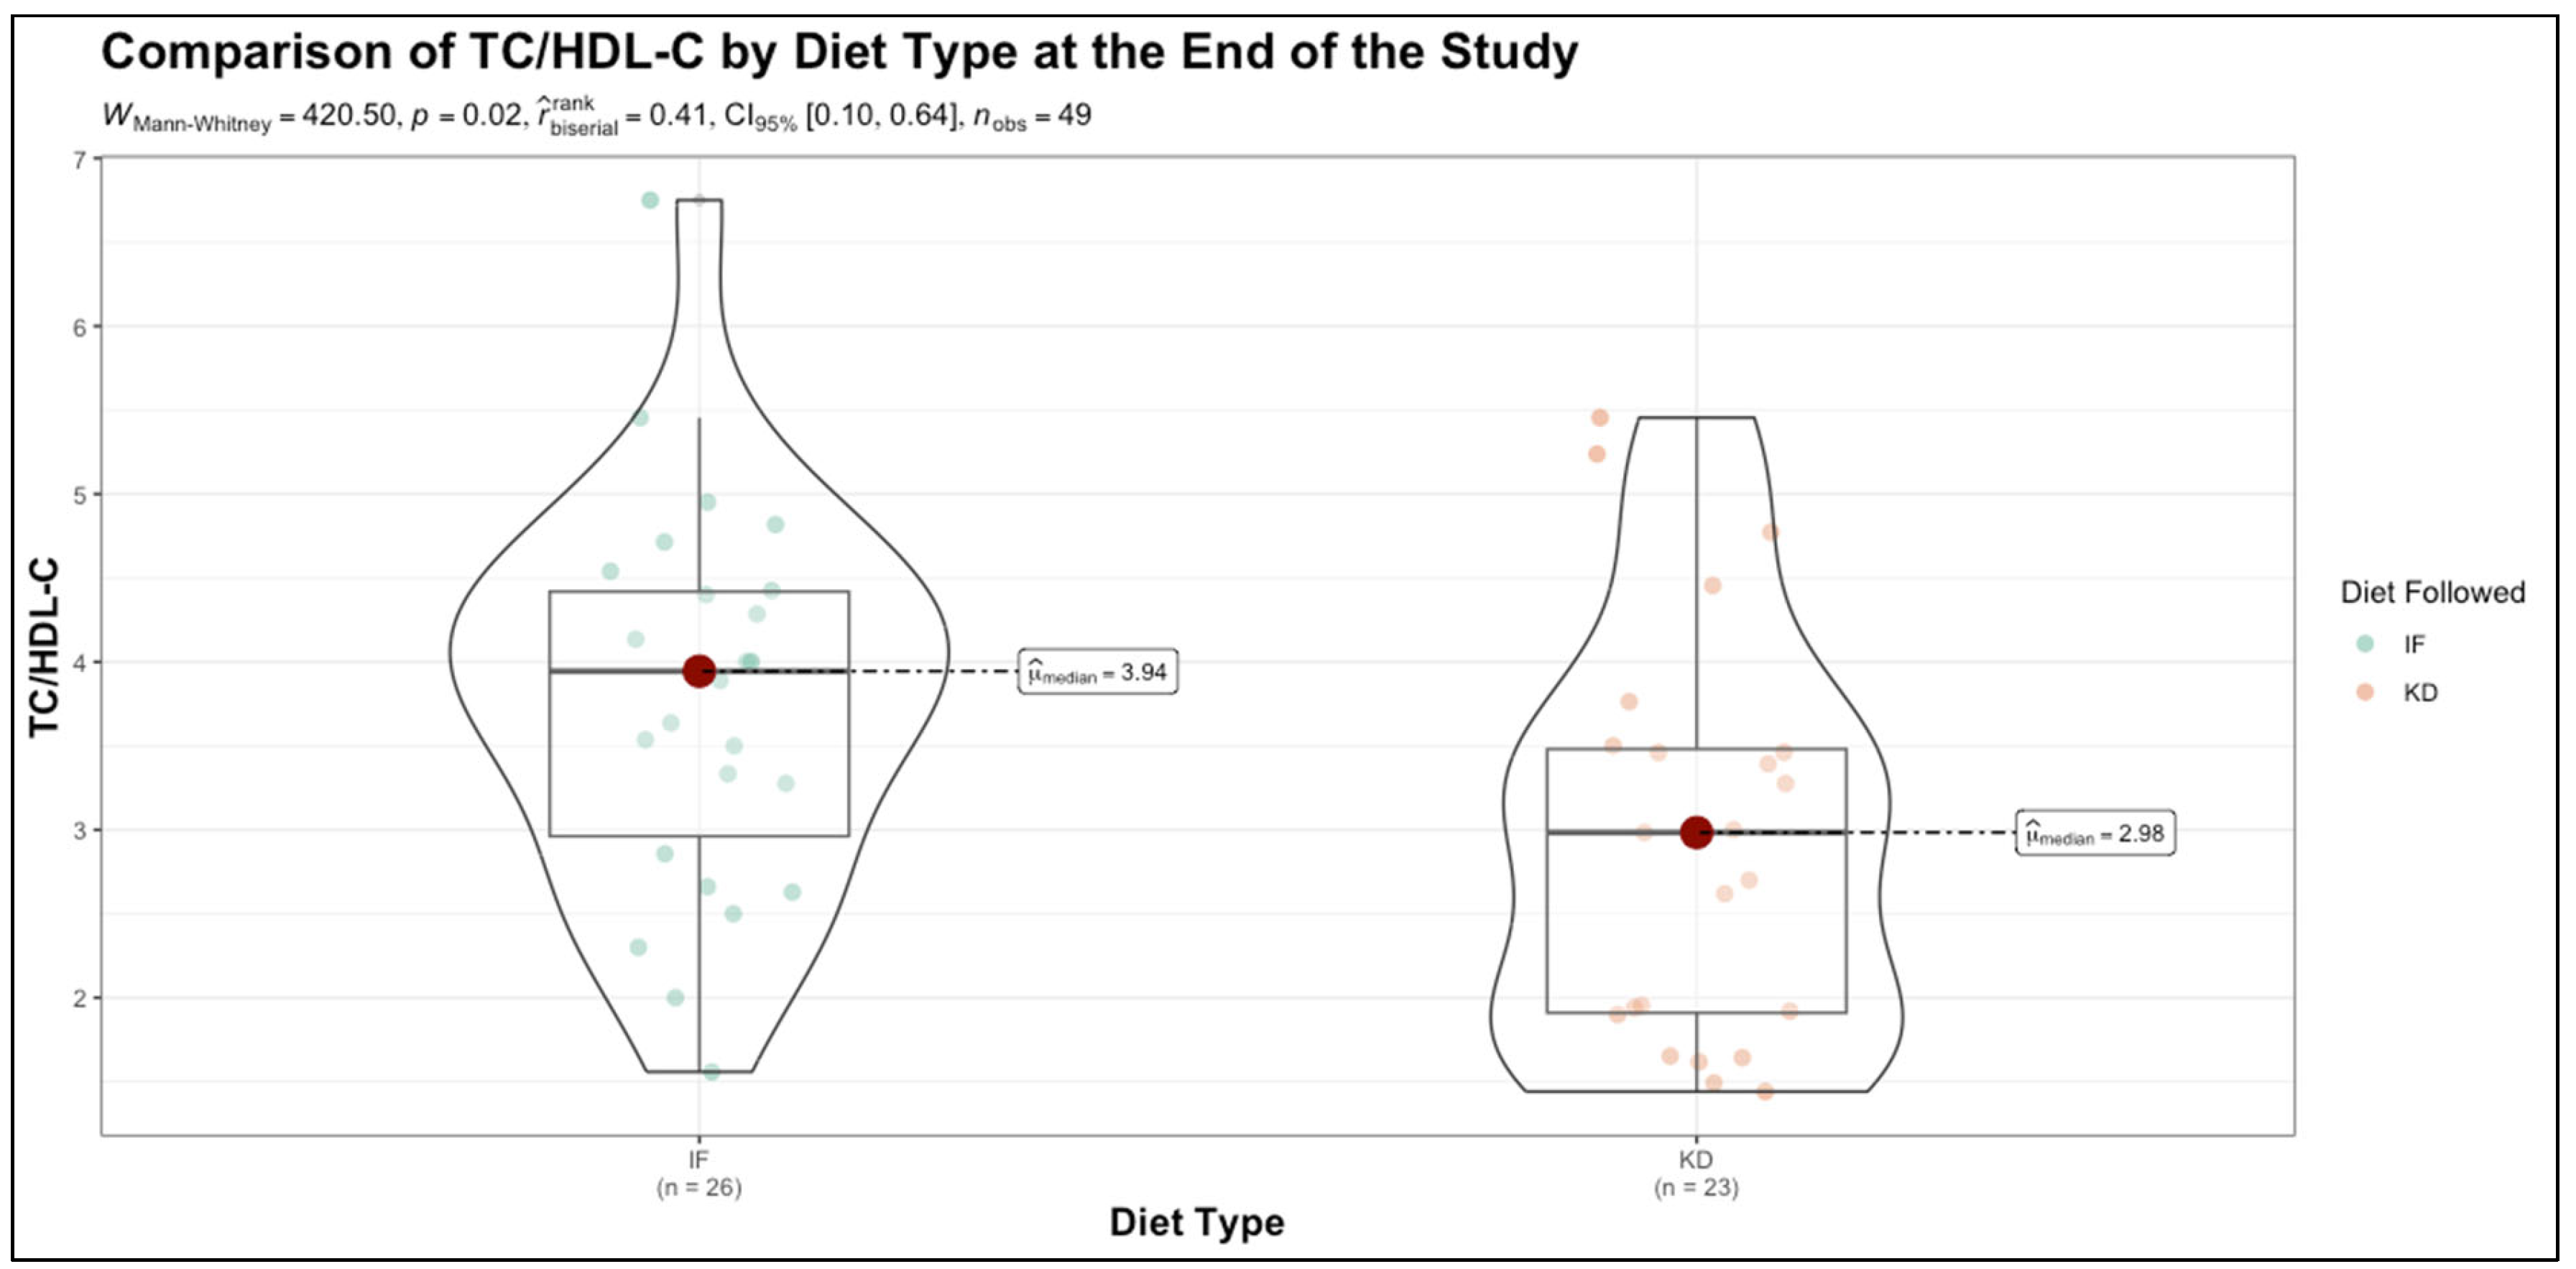
| TC/HDL-C | 3.85 (3.01–4.30) | 3.91 (2.52–4.98) | 0.860 |
| SBP | 126 (112–143) | 122 (115–145) | 0.790 |
| QRISK | 11.75 (6.58–30.12) | 11.80 (7.15–26.15) | 0.700 |
| Relative Risk | 16.70 (8.27–33.83) | 13.00 (10.10–22.20) | 0.620 |
| Non-HDL-C | 139 (104–170) | 155 (85–187) | 0.640 |
| LDL-C | 124 (94–143) | 131 (85–163) | 0.680 |
| Triglycerides | 100 (86–164) | 120 (87–173) | 0.600 |
| Uric Acid | 5.75 (4.67–6.60) | 5.20 (4.05–5.95) | 0.160 |
| Serum Creatinine | 0.67 (0.65–0.71) | 0.64 (0.58–0.72) | 0.410 |
| Fasting Glucose | 96.50 (92.50–106.75) | 100.00 (90.00–119.00) | 0.480 |
| HbA1c | 5.50 (5.23–5.90) | 5.90 (5.15–6.50) | 0.620 |
| HOMA-IR | 2.10 (1.50–3.22) | 3.10 (1.70–6.15) | 0.140 |
| Vitamin D | 22.50 (19.00–30.75) | 21.00 (16.50–25.50) | 0.140 |
| Variable | Class | IF | KD | p-Value |
|---|---|---|---|---|
| Sex | F | 17 (65.38%) | (69.57%) | 0.760 |
| M | 9 (34.62%) | 7 (30.43%) | ||
| Smoker | Yes | 17 (65.38%) | 13 (56.52%) | 0.790 |
| Sedentary | Yes | 10 (38.46%) | 8 (34.78%) | 0.790 |
| Sleep Deficit | Yes | 12 (46.15%) | 8 (34.78%) | 0.420 |
| Menopause | Yes | 7 (26.92%) | 5 (21.74%) | 0.670 |
| FMH CV | Yes | 14 (53.85%) | 7 (30.43%) | 0.100 |
| RA | Yes | 8 (30.77%) | 2 (8.7%) | 0.060 |
| LES | Yes | 9 (34.62%) | 6 (26.09%) | 0.520 |
| ED | Yes | 5 (19.23%) | 2 (8.7%) | 0.290 |
| Migraines | Yes | 16 (61.54%) | 3 (13.04%) | <0.001 |
| AF | Yes | 1 (3.85%) | 0 (0%) | 0.340 |
| Variable | Diet | % Change—Median (Q1,Q3) | Wilcoxon Signed Rank | Mann–Whitney U |
|---|---|---|---|---|
| BMI | TRE | 4.06 (2.41, 6.49) | <0.001 | <0.001 |
| KD | 12.71 (9.84, 16.66) | <0.001 | ||
| WC | TRE | 1.73 (0.91, 3.15) | <0.001 | <0.001 |
| KD | 11.43 (8.75, 13.45) | <0.001 | ||
| WHR | TRE | 2.33 (0.28, 5.65) | <0.001 | <0.001 |
| KD | 11.22 (6.42, 19.21) | <0.001 | ||
| TC | TRE | 2.04 (0.23, 3.99) | <0.001 | <0.001 |
| KD | 18.03 (14.89, 19.88) | <0.001 | ||
| HDL-C | TRE | −2.07 (−5.02, 1.62) | <0.001 | <0.001 |
| KD | 12.73 (8.33, 20.2) | <0.001 | ||
| TC/HDL-C | TRE | −0.76 (−2.78, 4.67) | <0.001 | <0.001 |
| KD | 25.74 (23.13, 30.5) | <0.001 | ||
| SBP | TRE | 1.42 (0, 2.94) | <0.001 | <0.001 |
| KD | 8.97 (3.41, 12.5) | <0.001 | ||
| QRISK | TRE | 2.16 (0.74, 8.03) | <0.001 | <0.001 |
| KD | 38.98 (29.79, 45.38) | <0.001 | ||
| Relative Risk | TRE | 1.61 (0.58, 5.44) | <0.001 | <0.001 |
| KD | 26.76 (18.74, 44.78) | <0.001 | ||
| HbA1c | TRE | 1.58 (0, 1.95) | <0.001 | <0.001 |
| KD | 8.33 (2.72, 13.6) | <0.001 |
| Variable | U Statistics | Mann–Whitney U | Rank-Biserial Correlation | Post Hoc Power |
|---|---|---|---|---|
| BMI Change | 45.0 | <0.001 | 0.849 | 0.804 |
| WC Change | 1.0 | <0.001 | 0.997 | 0.911 |
| WHR Change | 106.5 | <0.001 | 0.644 | 0.570 |
| TC Change | 6.0 | <0.001 | 0.980 | 0.901 |
| HDLc Change | 22.0 | <0.001 | 0.926 | 0.867 |
| TC/HDLc Change | 12.0 | <0.001 | 0.960 | 0.889 |
| SBP Change | 85.0 | <0.001 | 0.716 | 0.660 |
| QRISK3 Change | 48.5 | <0.001 | 0.838 | 0.794 |
| Relative Risk Change | 29.0 | <0.001 | 0.903 | 0.850 |
| HbA1c Change | 103.5 | <0.001 | 0.654 | 0.584 |
Disclaimer/Publisher’s Note: The statements, opinions and data contained in all publications are solely those of the individual author(s) and contributor(s) and not of MDPI and/or the editor(s). MDPI and/or the editor(s) disclaim responsibility for any injury to people or property resulting from any ideas, methods, instructions or products referred to in the content. |
© 2025 by the authors. Licensee MDPI, Basel, Switzerland. This article is an open access article distributed under the terms and conditions of the Creative Commons Attribution (CC BY) license (https://creativecommons.org/licenses/by/4.0/).
Share and Cite
Pescari, D.; Mihuta, M.S.; Bena, A.; Stoian, D. Comparative Effects of Time-Restricted Eating and the Ketogenic Diet on QRISK3-Assessed Cardiovascular Risk in Individuals with Obesity: A Longitudinal Analysis of Metabolic, Anthropometric, and Lifestyle Factors. Nutrients 2025, 17, 1963. https://doi.org/10.3390/nu17121963
Pescari D, Mihuta MS, Bena A, Stoian D. Comparative Effects of Time-Restricted Eating and the Ketogenic Diet on QRISK3-Assessed Cardiovascular Risk in Individuals with Obesity: A Longitudinal Analysis of Metabolic, Anthropometric, and Lifestyle Factors. Nutrients. 2025; 17(12):1963. https://doi.org/10.3390/nu17121963
Chicago/Turabian StylePescari, Denisa, Monica Simina Mihuta, Andreea Bena, and Dana Stoian. 2025. "Comparative Effects of Time-Restricted Eating and the Ketogenic Diet on QRISK3-Assessed Cardiovascular Risk in Individuals with Obesity: A Longitudinal Analysis of Metabolic, Anthropometric, and Lifestyle Factors" Nutrients 17, no. 12: 1963. https://doi.org/10.3390/nu17121963
APA StylePescari, D., Mihuta, M. S., Bena, A., & Stoian, D. (2025). Comparative Effects of Time-Restricted Eating and the Ketogenic Diet on QRISK3-Assessed Cardiovascular Risk in Individuals with Obesity: A Longitudinal Analysis of Metabolic, Anthropometric, and Lifestyle Factors. Nutrients, 17(12), 1963. https://doi.org/10.3390/nu17121963