Sugar-Sweetened Beverage Consumption and Associated Health Risks Awareness Among University Students in Kuwait: A Cross-Sectional Study

 ,
,  ,
,  ,
, Highlights
- High prevalence of SSB intake: In total, 71.5% consumed regular soda; 41.6% were classified as high sugar consumers. The median daily sugar intake from soda alone was 38 g, exceeding recommended limits.
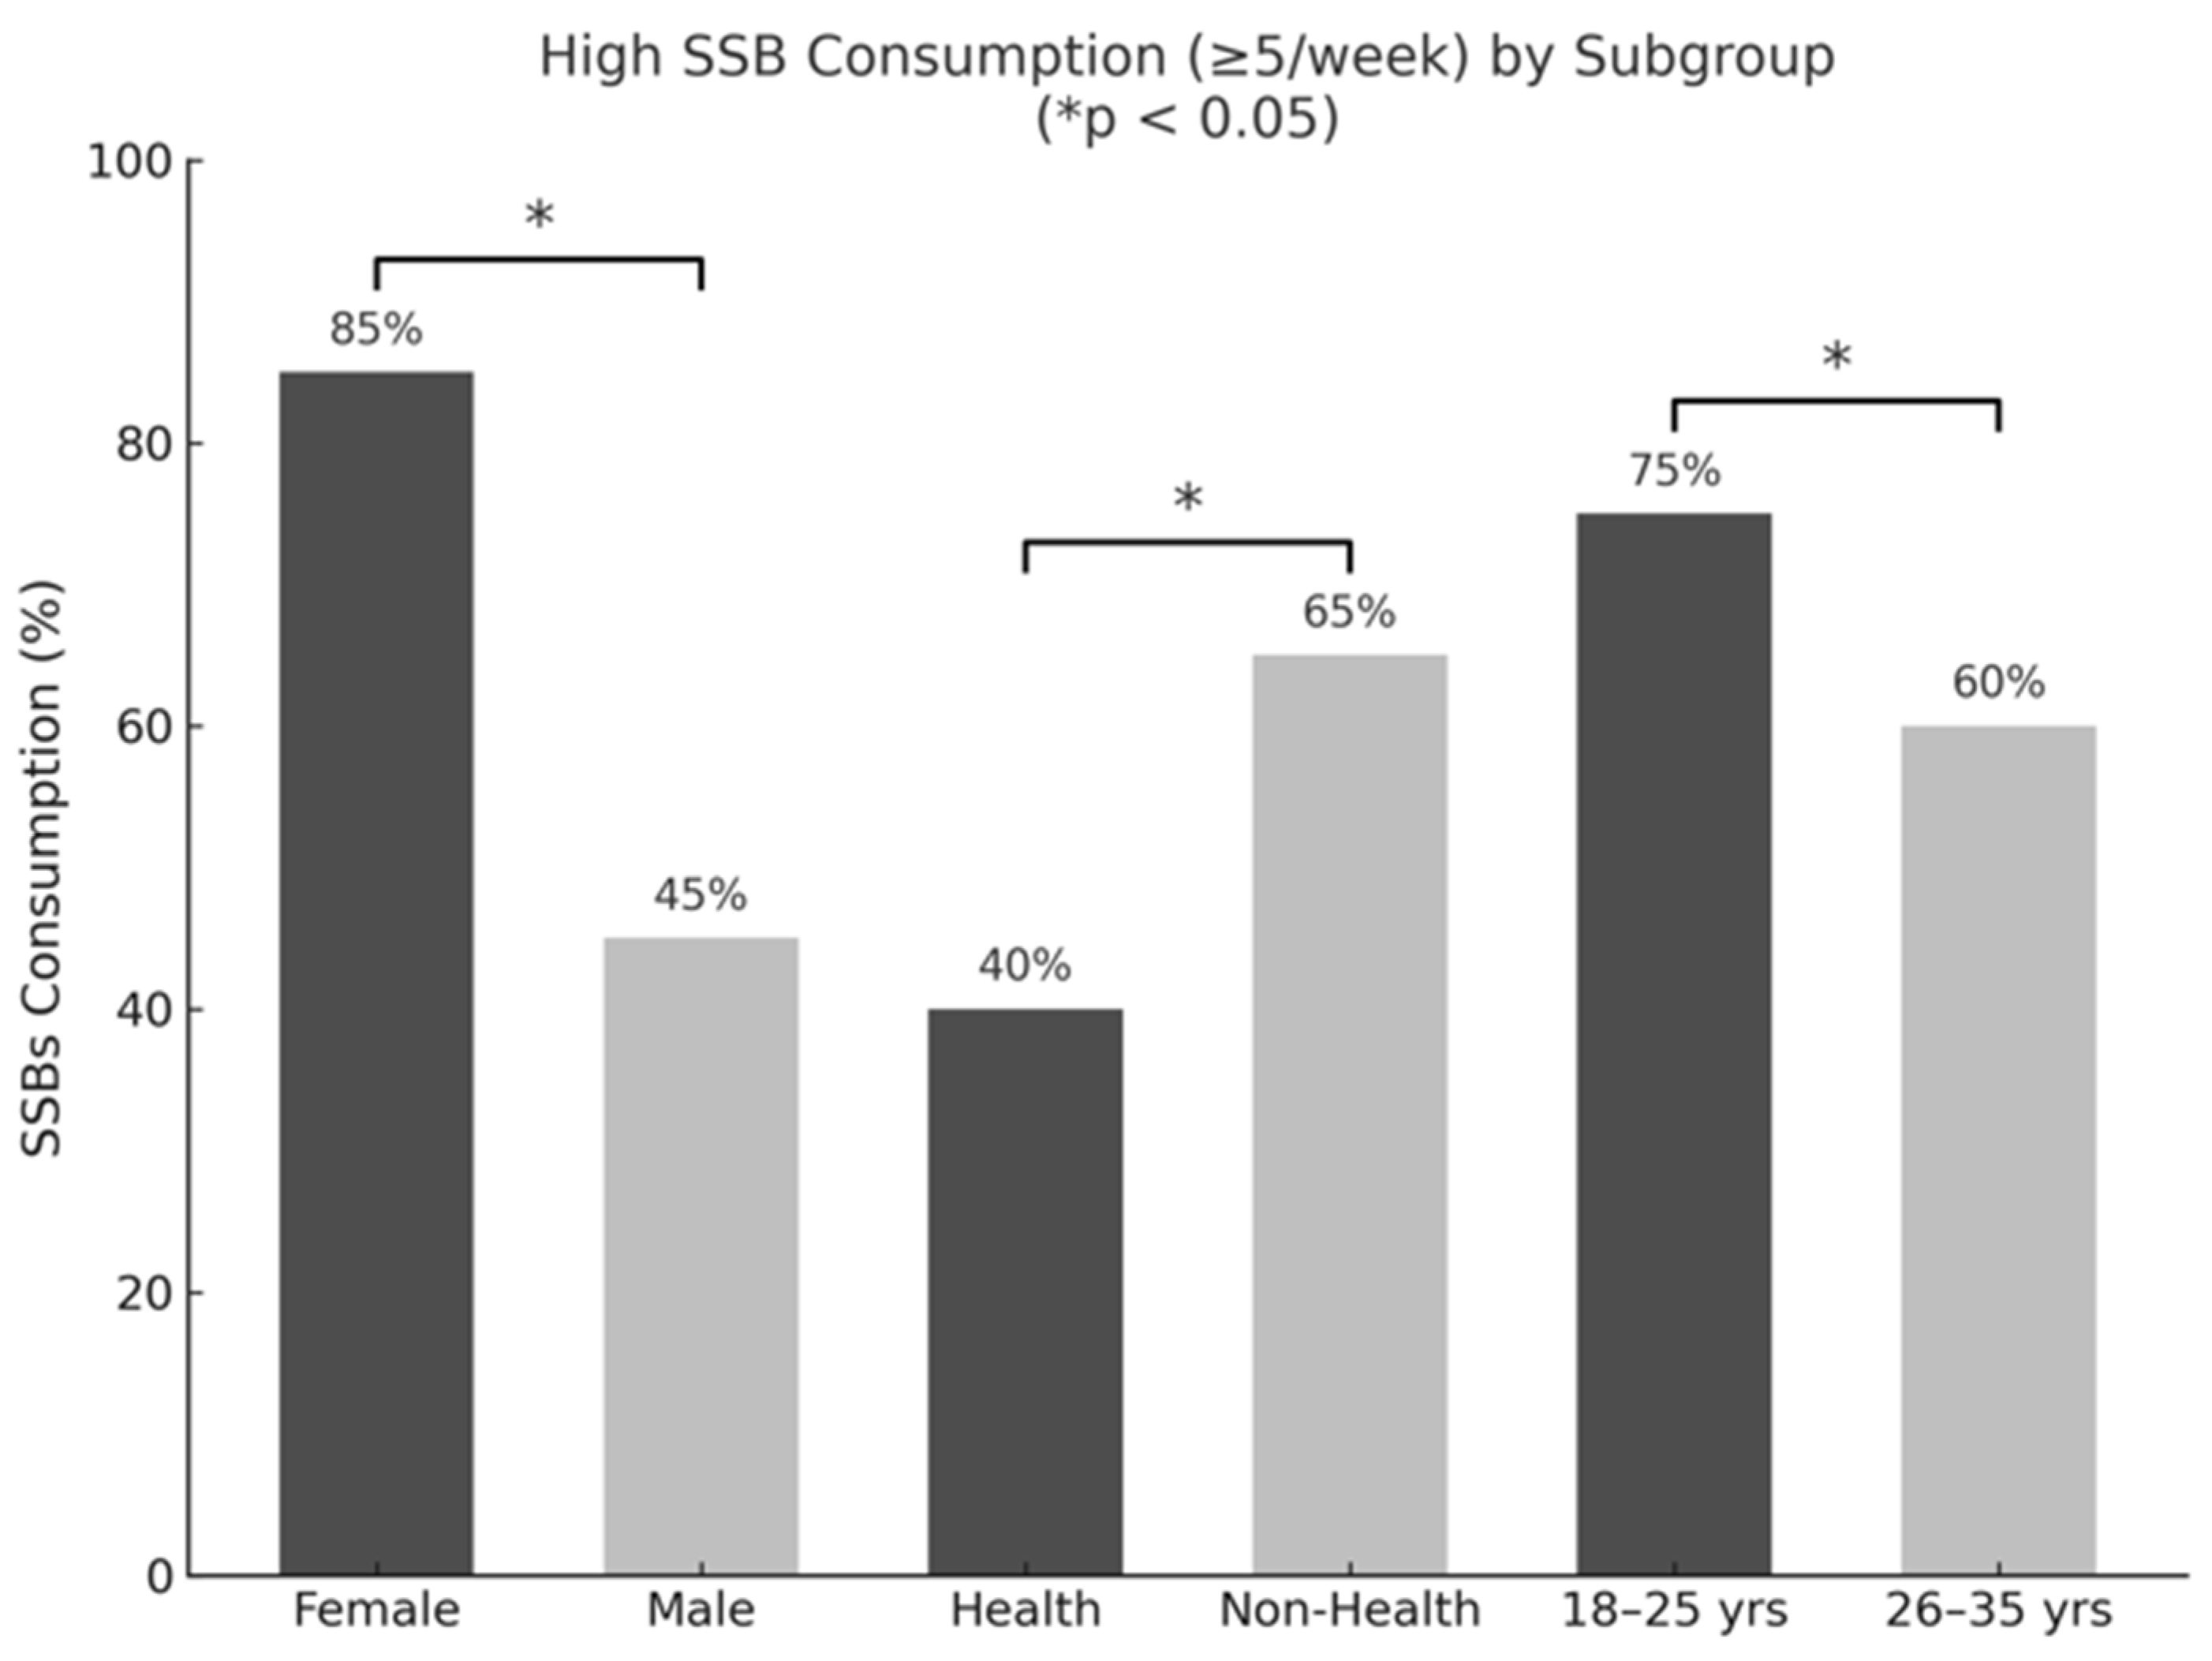
- Demographic disparities: Higher sugar intake was associated with male gender, younger age, and non-health majors.
- Health awareness effect: Awareness of obesity risk, sugar content, and preference for unsweetened juices were linked to lower sugar intake.
Abstract
1. Introduction
2. Materials and Methods
2.1. Study Design and Population
2.2. Survey Instrument
2.3. Variables and Categorization
2.4. Statistical Analysis
3. Results
3.1. Demographic and Anthropometric Characteristics
3.2. Frequency of SSB Consumption
3.3. Associations Between Frequency of SSB Consumption and the Sociodemographic Factors
3.4. Behavior Towards SSB Consumption and Awareness of Health Risks
3.5. Sugar Intake from SSBs
3.6. Associations Between Sugar Intake from SSBs and Gender, Age, BMI, Major Area of Study, MPSB, Awareness of Disease Risk, and Behavior Towards Sugary Drinks
3.7. Regression Analysis of Sugar Intake from SSBs with Independent Variables and the Awareness of Disease Risk and Behavior Towards SSBs
4. Discussion
5. Strengths and Limitations
6. Implications for Public Health and Future Research Prospects
7. Conclusions
Supplementary Materials
Author Contributions
Funding
Institutional Review Board Statement
Informed Consent Statement
Data Availability Statement
Conflicts of Interest
References
- Centers for Disease Control and Prevention. Get the Facts: Sugar-Sweetened Beverages and Consumption; CDC: Atlanta, GA, USA, 2021. Available online: https://www.cdc.gov/nutrition/data-statistics/sugar-sweetened-beverages-intake.html (accessed on 20 February 2022).
- Calcaterra, V.; Cena, H.; Magenes, V.C.; Vincenti, A.; Comola, G.; Beretta, A.; Di Napoli, I.; Zuccotti, G. Sugar-Sweetened Beverages and Metabolic Risk in Children and Adolescents with Obesity: A Narrative Review. Nutrients 2023, 15, 702. [Google Scholar] [CrossRef] [PubMed]
- Malik, V.S.; Hu, F.B. The role of sugar-sweetened beverages in the global epidemics of obesity and chronic diseases. Nat. Rev. Endocrinol. 2022, 18, 205–218. [Google Scholar] [CrossRef] [PubMed]
- Vartanian, L.R.; Schwartz, M.B.; Brownell, K.D. Effects of soft drink consumption on nutrition and health: A systematic review and meta-analysis. Am. J. Public Health 2007, 97, 667–675. [Google Scholar] [CrossRef]
- DiMeglio, D.P.; Mattes, R.D. Liquid versus Solid Carbohydrate: Effects on Food Intake and Body Weight. Int. J. Obes. 2000, 24, 794–800. [Google Scholar] [CrossRef] [PubMed]
- DiNicolantonio, J.J.; O’Keefe, J.H.; Wilson, W.L. Sugar addiction: Is it real? A narrative review. Br. J. Sports Med. 2018, 52, 910–913. [Google Scholar] [CrossRef] [PubMed]
- Weiderpass, E.; Botteri, E.; Longenecker, J.C.; Alkandari, A.; Al-Wotayan, R.; Al Duwairi, Q.; Tuomilehto, J. The prevalence of overweight and obesity in an adult Kuwaiti population in 2014. Front. Endocrinol. 2019, 10, 449. [Google Scholar] [CrossRef]
- Alkandari, A.; Al Arouj, M.; Elkum, N.; Sharma, P.; Devarajan, S.; Abu-Farha, M.; Al-Mulla, F.; Tuomilehto, J.; Bennakhi, A. Adult Diabetes and Prediabetes Prevalence in Kuwait: Data from the Cross-Sectional Kuwait Diabetes Epidemiology Program. J. Clin. Med. 2020, 9, 3420. [Google Scholar] [CrossRef]
- Al-Haifi, A.R.; Al-Awadhi, B.A.; Al-Dashti, Y.A.; Aljazzaf, B.H.; Allafi, A.R.; Al-Mannai, M.A.; Al-Hazzaa, H.M. Prevalence of Overweight and Obesity among Kuwaiti Adolescents and the Perception of Body Weight by Parents or Friends. PLoS ONE 2022, 17, e0262101. [Google Scholar] [CrossRef]
- Al-Nesf, Y.; Kamel, M.; El-Shazly, M.K.; Makboul, G.M.; Sadek, A.A.; El-Sayed, A.M.; El-Fararji, A. Kuwait STEPS 2006; Kuwait Ministry of Health, GCC, WHO. 2006. Available online: https://data.worldobesity.org/country/kuwait-115/ (accessed on 20 December 2024).
- Alhareky, M.; Goodson, J.M.; Tavares, M.; Hartman, M.-L. Beverage Consumption and Obesity in Kuwaiti School Children. Front. Endocrinol. 2024, 14, 1174299. [Google Scholar] [CrossRef]
- Daniel, W.W.; Cross, C.L. Biostatistics: A Foundation for Analysis in the Health Sciences, 10th ed.; Wiley: Hoboken, NJ, USA, 2019; Available online: https://view.publitas.com/uicneuro/neus444biostats/page/1 (accessed on 18 January 2021).
- Nurses’ Health Study. 2019. Available online: https://nurseshealthstudy.org/sites/default/files/questionnaires/2019%20long.pdf (accessed on 20 February 2022).
- Rivard, C.; Smith, D.; McCann, S.; Hyland, A. Taxing sugar-sweetened beverages: A survey of knowledge, attitudes, and behaviors. Public Health Nutrition 2012, 15, 1355–1361. [Google Scholar] [CrossRef]
- West, D.S.; Bursac, Z.; Quimby, D.; Prewitt, T.E.; Spatz, T.; Nash, C.; Mays, G.; Eddings, K. Self-reported sugar-sweetened beverage intake among college students. Obesity 2006, 14, 1825–1831. [Google Scholar] [CrossRef]
- Hoffman, E. >Sugar-Sweetened Beverage Intake Among College Students: A Social-Ecological Model. Unpublished thesis dissertation for Honor Research Distinction degree, Ohio State University, Columbus, OH, USA, 2013. [Google Scholar]
- Bipasha, M.S.; Raisa, T.S.; Goon, S. Sugar-Sweetened Beverages Consumption among University Students of Bangladesh. Int. J. Public Health Sci. 2017, 6, 157–163. [Google Scholar] [CrossRef]
- Otaibi, H.H.A.; Kamel, S.M. Health-risk behaviors associated with sugar-sweetened beverage consumption among Saudi young adults. Biomed. Res. 2017, 28, 8484–8491. Available online: https://www.alliedacademies.org/articles/healthrisk-behaviors-associated-with-sugarsweetened-beverage-consumption-among-saudi-young-adults-8644.html (accessed on 10 April 2021).
- Otaibi, H.H. Sugar-sweetened beverage consumption behavior and knowledge among university students in Saudi Arabia. J. Econ. Bus. Manag. 2017, 5, 173–176. [Google Scholar] [CrossRef]
- Harguth, A. An Assessment of Knowledge, Behavior, and Consumption Patterns Surrounding Sugar-Sweetened Beverages Among Young Adults. Master’s Thesis, Minnesota State University, Mankato, MN, USA, 2020. [Google Scholar]
- Malik, V.S.; Pan, A.; Willett, W.C.; Hu, F.B. Sugar-sweetened beverages and weight gain in children and adults: A systematic review and meta-analysis. Am. J. Clin. Nutr. 2013, 98, 1084–1102. [Google Scholar] [CrossRef]
- Lara-Castor, L.; Micha, R.; Cudhea, F.; Miller, V.; Shi, P.; Zhang, J.; Sharib, J.R.; Erndt-Marino, J.E.; Cash, S.B.; Barquera, S.; et al. Intake of sugar-sweetened beverages among children and adolescents in 185 countries between 1990 and 2018: Population-based study. BMJ 2024, 386, e079234. [Google Scholar] [CrossRef] [PubMed]
- Rosinger, A.; Herrick, K.; Gahche, J.; Park, S. Sugar-Sweetened Beverage Consumption Among U.S. Youth, 2011–2014; NCHS Data Brief (271); National Center for Health Statistics: Hyattsville, MD, USA, 2017; pp. 1–8. [Google Scholar]
- American Heart Association. Sugar 101. Available online: https://www.heart.org/en/healthy-living/healthy-eating/eat-smart/sugar/sugar-101 (accessed on 16 December 2023).
- U.S. Department of Health and Human Services; U.S. Department of Agriculture. 2020–2025 Dietary Guidelines for Americans, 9th ed.; U.S. Department of Agriculture Office of the Assistant Secretary for Civil Rights: Washington, DC, USA, 2020. Available online: https://www.dietaryguidelines.gov/sites/default/files/2020-12/Dietary_Guidelines_for_Americans_2020-2025.pdf (accessed on 17 December 2023).
- Arab Times. Eating Habits Make Kuwaitis Prone to Very High Sugar Intake. Arab Times Kuwait, 21 April 2016. [Google Scholar]
- Alsunni, A.A. Energy Drink Consumption: Beneficial and Adverse Health Effects. Int. J. Health Sci. 2015, 9, 468. [Google Scholar] [CrossRef]
- Asaad, Y.A. Energy Drinks Consumption in Erbil City: A Population-Based Study. Zanco J. Med. Sci. 2017, 21, 1680–1687. [Google Scholar] [CrossRef]
- Ghozayel, M.; Ghaddar, A.; Farhat, G.; Nasreddine, L.; Kara, J.; Jomaa, L. Energy drinks consumption and perceptions among university students in Beirut, Lebanon: A mixed methods approach. PLoS ONE 2020, 15, e0232199. [Google Scholar] [CrossRef]
- Malinauskas, B.M.; Aeby, V.G.; Overton, R.F.; Carpenter-Aeby, T.; Barber-Heidal, K. A survey of energy drink consumption patterns among college students. Nutr. J. 2007, 6, 35. [Google Scholar] [CrossRef]
- Trapp, G.S.; Allen, K.L.; O’Sullivan, T.; Robinson, M.; Jacoby, P.; Oddy, W.H. Energy drink consumption among young Australian adults: Associations with alcohol and illicit drug use. Drug Alcohol Depend. 2014, 134, 30–37. [Google Scholar] [CrossRef]
- Azagba, S.; Langille, D.; Asbridge, M. An emerging adolescent health risk: Caffeinated energy drink consumption patterns among high school students. Prev. Med. 2014, 62, 54–59. [Google Scholar] [CrossRef] [PubMed]
- Alsunni, A.A.; Badar, A. Energy Drinks Consumption Pattern, Perceived Benefits, and Associated Adverse Effects amongst Students at University of Dammam, Saudi Arabia. J. Ayub Med. Coll. Abbottabad 2011, 23, 3–9. [Google Scholar] [PubMed]
- Itany, M.; Diab, B.; Rachidi, S.; Awada, S.; Al Hajje, A.; Bawab, W.; Salameh, P. Consumption of energy drinks among Lebanese youth: A pilot study on the prevalence and side effects. Int. J. High Risk Behav. Addict. 2014, 3, e18857. [Google Scholar] [CrossRef] [PubMed]
- Jacob, S.; Tambawel, J.; Trooshi, F.M.; Alkhoury, Y. Consumption pattern of nutritional health drinks and energy drinks among university students in Ajman, UAE. Gulf Med. J. 2013, 2, 22–26. [Google Scholar]
- Muñoz-Urtubia, N.; Vega-Muñoz, A.; Estrada-Muñoz, C.; Salazar-Sepúlveda, G.; Contreras-Barraza, N.; Castillo, D. Healthy behavior and sports drinks: A systematic review. Nutrients 2023, 15, 2915. [Google Scholar] [CrossRef] [PubMed]
- Malik, V.S.; Popkin, B.M.; Bray, G.A.; Després, J.P.; Willett, W.C.; Hu, F.B. Sugar-sweetened beverages and risk of metabolic syndrome and type 2 diabetes: A meta-analysis. Diabetes Care 2010, 33, 2477–2483. [Google Scholar] [CrossRef] [PubMed]
- Malik, V.S. Sugar-sweetened beverages and cardiometabolic health. Curr. Opin. Cardiol. 2017, 32, 572–579. [Google Scholar] [CrossRef]
- Beck, A.L.; Martinez, S.; Patel, A.I.; Fernandez, A. Trends in Sugar-Sweetened Beverage Consumption among California Children. Public Health Nutr. 2020, 23, 2864–2869. [Google Scholar] [CrossRef]
- Muñoz, V.C.; Rovira, M.U.; Ibáñez, V.V.; Domínguez, J.M.M.; Blanco, G.R.; Rovira, M.U.; Toran, P. Consumption of soft, sports, and energy drinks in adolescents: The BEENIS study. An. Pediatría 2020, 93, 242–250. [Google Scholar]
- Khan, N.; Mukhtar, H. Tea and health: Studies in humans. Curr. Pharm. Des. 2013, 19, 6141–6147. [Google Scholar] [CrossRef]
- Gordon, B. The Health Benefits of Tea. Eat Right. The Academy of Nutrition and Dietetics. 2022. Available online: https://www.eatright.org (accessed on 15 December 2024).
- Tea Association of the U.S.A., Inc. (n.d.). Available online: https://worldteadirectory.com/item/tea-association-u-s-a-inc/ (accessed on 18 December 2024).
- Stangl, S.F. Food Addiction and Added Sugar Consumption in College-Aged Females. Celebrating Scholarship Creativity Day. 2015. Available online: https://digitalcommons.csbsju.edu/elce_cscday/47 (accessed on 10 December 2024).
- Meriç, Ç.; Yabanci, N.; Yılmaz, H. Evaluation of added sugar and sugar-sweetened beverage consumption by university students. Kesmas Natl. Public Health 2021, 16, 9–15. [Google Scholar] [CrossRef]
- Li, D.; Yu, D.; Zhao, L. Trend of sugar-sweetened beverage consumption and intake of added sugar in China’s nine provinces among adults. J. Hyg. Res. 2014, 43, 70–72. [Google Scholar]
- Lee, S.H.; Zhao, L.; Park, S.; Moore, L.V.; Hamner, H.C.; Galuska, D.A.; Blanck, H.M. High added sugars intake among US adults: Characteristics, eating occasions, and top sources, 2015–2018. Nutrients 2023, 15, 265. [Google Scholar] [CrossRef] [PubMed]
- Johnson, R.K.; Appel, L.J.; Brands, M.; Howard, B.V.; Lefevre, M.; Lustig, R.H.; Sacks, F.; Steffen, L.M.; Wylie-Rosett, J.; American Heart Association Nutrition Committee of the Council on Nutrition, Physical Activity, and Metabolism and the Council on Epidemiology and Prevention. Dietary sugars intake and cardiovascular health: A scientific statement from the American Heart Association. Circulation 2009, 120, 1011–1020. [Google Scholar] [CrossRef] [PubMed]
- Chen, L.; Wu, W.; Zhang, N.; Bak, K.H.; Zhang, Y.; Fu, Y. Sugar Reduction in Beverages: Current Trends and New Perspectives from Sensory and Health Viewpoints. Food Res. Int. 2022, 162, 112076. [Google Scholar] [CrossRef] [PubMed]
- Alkazemi, D.; Zafar, T.A.; Ebrahim, M.; Kubow, S. Distorted Weight Perception Correlates with Disordered Eating Attitudes in Kuwaiti College Women. Int. J. Eat. Disord. 2018, 51, 449–458. [Google Scholar] [CrossRef]
- Göbel, P.; Dogan, H. Evaluation of eating attitudes, nutritional status, and anthropometric measurements of women who exercise: The case of Karabük. Black Sea J. Health Sci. 2023, 6, 224–232. [Google Scholar] [CrossRef]
- Park, S.; Lee, S.H.; Merlo, C.; Blanck, H.M. Associations between knowledge of health risks and sugar-sweetened beverage intake among US adolescents. Nutrients 2023, 15, 2408. [Google Scholar] [CrossRef]
- Miller, C.; Dono, J.; Scully, M.; Morley, B.; Ettridge, K. Adolescents’ knowledge and beliefs regarding health risks of soda and diet soda consumption. Public Health Nutr. 2022, 25, 3044–3053. [Google Scholar] [CrossRef]
- Park, S.; Onufrak, S.; Sherry, B.; Blanck, H.M. The relationship between health-related knowledge and sugar-sweetened beverage intake among US adults. J. Acad. Nutr. Diet. 2014, 114, 1059–1066. [Google Scholar] [CrossRef]


| Variables | Female n = 331 (81%) | Male n = 80 (19%) | Total n = 411 (100%) |
|---|---|---|---|
| Age, n (%) | |||
| 18–25 | 262 (79.2) | 50 (62.5) | 312 (75.9) |
| 26–35 | 69 (20.8) | 30 (37.5) | 99 (24.1) |
| Anthropometrics, mean ± SD | |||
| Height a, cm | 158.75 ± 8.42 | 174.34 ± 6.67 | 161.80 ± 10.19 |
| Weight b, kg | 62.13 ± 14.99 | 87.02 ± 30.69 | 66.99 ± 21.45 |
| BMI c, kg/m2 | 24.63 ± 5.31 | 28.73 ± 10.66 | 25.44 ± 6.88 |
| Academic Major, n (%) | |||
| Health sciences | 147 (44.4) | 12 (15.0) | 159 (38.7) |
| Non-health sciences | 184 (55.6) | 68 (85.0) | 252 (61.3) |
| MPSB d,e, n (%) | |||
| <50–100 KD | 82 (25.2) | 18 (23.7) | 100 (24.9) |
| 101–200 KD | 167 (51.2) | 27 (35.5) | 194 (48.3) |
| 201–300 KD | 54 (16.6) | 24 (31.6) | 78 (19.4) |
| 301 KD and more | 23 (7.1) | 7 (9.2) | 30 (7.5) |
| BMI f, (kg/m2) n (%) | |||
| ≤25 | 194 (59.0) | 32 (40.0) | 226 (55.3) |
| >25 | 135 (41.0) | 48 (60.0) | 183 (44.7) |
| SSBs | ≤1/Month n (%) | ≤1/Week n (%) | 2–4/Week n (%) | 5–6/Week n (%) | ≥7/Week n (%) | Total n (%) | Total n (%) |
|---|---|---|---|---|---|---|---|
| Non-Consumers * | Consumers ** | ||||||
| Regular soda a | 115 (28) | 102 (35) | 66 (23) | 29 (10) | 92 (32) | 289 (71.5) | 404 (98.3) |
| Energy drinks b | 291 (72) | 67 (58) | 20 (17) | 5 (4) | 23 (21) | 115 (28.3) | 406 (98.8) |
| Sports drinks c | 359 (89) | 26 (60) | 9 (21) | 4 (10) | 4 (9) | 43 (10.7) | 402 (97.8) |
| Sweetened iced tea d | 273 (67) | 83 (61) | 26 (19) | 9 (7) | 17 (13) | 135 (33.1) | 408 (99.3) |
| Daily Sugar Consumed (g) by SSB Type | ||
|---|---|---|
| SSB (n, %) | Median | IQR [25%, 75%] |
| Regular Soda (337, 87) | 38.10 | [14.04, 56.29] |
| Energy Drinks (164, 42.4) | 11.49 | [4.66, 15.47] |
| Sports Drinks (66, 16.9) | 9.59 | [4.26, 13.66] |
| Sweet Iced Tea (192, 49.7) | 5.37 | [3.71, 6.46] |
| Daily Total Sugar Intake (Z-Scores) | ||
| High intake (n = 160, 41.6%) | 0.70 | [0.38, 1.36] |
| Low intake (n = 226, 58.4%) | −0.58 | [−0.87, −0.32] |
| Z-Score from all SSBs (n = 387, 100%) | −0.24 | [−0.68, 0.48] |
| A: Associations of Sugar Intake from SSBs with Demographic Variables | |||
|---|---|---|---|
| Variables | Low Intake | High Intake | χ2, p, Cramer’s V |
| Gender, n (%) | |||
| Females | 218 (68.3) | 101 (31.7) | 14.25, <0.001, 0.19 |
| Males | 30 (44.1) | 38 (55.9) | |
| Age (years), n (%) | |||
| 18–25 | 183 (61.0) | 117 (39.0) | 4.01, <0.04, 0.04 |
| 26–35 | 65 (74.7) | 22 (25.3) | |
| BMI (kg/m2), n (%) | |||
| ≤25 | 143 (66.8) | 71 (33.2) | 1.48, 0.23, 0.06 |
| >25 | 104 (60.8) | 69 (39.2) | |
| Academic Major, n (%) | |||
| Health sciences | 114 (77.6) | 33 (22.4) | 16.64, <0.001, 0.21 |
| Non-health sciences | 134 (55.8) | 106 (44.2) | |
| MPSB a, KD b, n (%) | |||
| <50–100 | 62 (70.5) | 26 (29.5) | 2.05, 0.56, 0.07 |
| 101–200 | 115 (63.2) | 67 (36.8) | |
| 200–300 | 39 (59.1) | 27 (40.9) | |
| 301 and above | 13 (72.2) | 5 (27.8) | |
| B: Associations of Sugar Intake from the SSBs with Disease Risk Variables | |||
| Variables | Low Intake | High Intake | χ2, p, Cramer’s V |
| Obesity, n (%) | |||
| Yes | 238 (63.5) | 137 (36.5) | 15.27, <0.001, 0.184 |
| No | 5 (41.7) | 7 (58.3) | |
| T2DM c, n (%) | |||
| Yes | 234 (62.9) | 138 (37.1) | 2.10, 0.020, 0.124 |
| No | 6 (40.0) | 9 (60.0) | |
| CVD d, n (%) | |||
| Yes | 211 (62.2) | 128 (37.8) | 2.06, 0.563, 0.033 |
| No | 28 (58.3) | 20 (41.7) | |
| KD e, n (%) | |||
| Yes | 211 (63.0) | 124 (37.0) | 1.74, 0.532, 0.050 |
| No | 31 (59.6) | 21 (40.4) | |
| NAFLD f, n (%) | |||
| Yes | 185 (62.2) | 113 (37.9) | 0.20, 0.532, 0.018 |
| No | 54 (60.7) | 35 (39.3) | |
| TD g, n (%) | |||
| Yes | 235 (63.2) | 137 (36.8) | 4.25, 0.03, 0.134 |
| No | 5 (33.3) | 10 (66.7) | |
| Aware of Sugar Content of SSBs, n (%) | |||
| Yes | 157 (68.3) | 73 (31.7) | 4.25, 0.048, 0.039 |
| No | 90 (57.3) | 67 (42.7) | |
| Preference for Unsweetened Juices, n (%) | |||
| Yes | 167 (69.0) | 75 (31.0) | 14.88, <0.001, 0.192 |
| No | 73 (50.3) | 72 (49.7) | |
| Dependent Variable, High Sugar from SSBs = 1 | B | S.E. | Wald | df | Sig. | Exp (B) | 95% CI | Nagelkerke R Square | |
|---|---|---|---|---|---|---|---|---|---|
| Lower | Upper | ||||||||
| Can frequent intake of SSBs increase the risk of obesity? | −1.95 | 0.57 | 11.65 | 1 | <0.001 | 0.142 | 0.046 | 0.435 | 0.144 |
| Can frequent intake of SSBs increase the risk of T2DM? | 0.39 | 0.55 | 0.49 | 1 | 0.486 | 1.470 | 0.497 | 4.351 | 0.022 |
| Can frequent intake of SSBs increase the risk of CVD? | −0.05 | 0.35 | 0.02 | 1 | 0.883 | 0.949 | 0.477 | 1.892 | 0.012 |
| Can frequent intake of SSBs increase the risk of KD? | −0.19 | 0.36 | 0.26 | 1 | 0.608 | 0.830 | 0.408 | 1.691 | 0.001 |
| Can frequent intake of SSBs increase the risk of NAFLD? | 0.27 | 0.29 | 0.85 | 1 | 0.357 | 1.304 | 0.741 | 2.293 | 0.007 |
| Can frequent intake of SSBs increase the risk of TD? | −0.54 | 0.47 | 1.34 | 1 | 0.247 | 0.580 | 0.231 | 1.458 | 0.013 |
| Do you know how much sugar is in SSBs? | −0.43 | 0.21 | 4.23 | 1 | 0.040 | 0.653 | 0.435 | 0.980 | 0.106 |
| Do you prefer sweetened fruit juices? | −0.81 | 0.22 | 14.63 | 1 | <0.001 | 0.447 | 0.295 | 0.675 | 0.143 |
| Dependent Variable: High Sugar from SSBs = 1 | B | S.E. | Wald | df | Sig. | Exp (B) | 95% CI | Nagelkerke R Square | |
|---|---|---|---|---|---|---|---|---|---|
| Lower | Upper | ||||||||
| Can frequent intake of SSBs increase of risk of obesity? | −1.79 | 0.59 | 9.06 | 1 | 0.003 | 0.167 | 0.052 | 0.536 | 0.144 |
| Age = 1 | −0.78 | 0.27 | 8.07 | 1 | 0.005 | 0.460 | 0.269 | 0.786 | |
| Gender = 1 | 0.87 | 0.28 | 9.95 | 1 | 0.002 | 2.378 | 1.388 | 4.074 | |
| Non-health sciences = 1 | 0.77 | 0.236 | 10.71 | 1 | 0.001 | 2.165 | 1.363 | 3.439 | |
| Do you know how much sugar is in SSBs? | −0.43 | 0.21 | 4.23 | 1 | 0.040 | 0.653 | 0.435 | 0.980 | 0.106 |
| Age = 1 | −0.79 | 0.27 | 8.49 | 1 | 0.004 | 0.455 | 0.268 | 0.733 | |
| Gender = 1 | 0.88 | 0.27 | 10.59 | 1 | 0.001 | 2.412 | 1.420 | 4.098 | |
| Non-health sciences = 1 | 0.83 | 0.23 | 12.63 | 1 | <0.001 | 2.293 | 1.451 | 3.624 | |
| Your preference for fruit juices? | −0.69 | 0.22 | 10.02 | 1 | 0.002 | 0.498 | 0.323 | 0.767 | 0.118 |
| Age = 1 | −0.74 | 0.27 | 7.25 | 1 | 0.007 | 0.478 | 0.279 | 0.818 | |
| Gender = 1 | 0.89 | 0.28 | 10.65 | 1 | 0.001 | 2.456 | 1.432 | 4.212 | |
| Non-health sciences = 1 | 0.74 | 0.24 | 9.62 | 1 | 0.002 | 2.087 | 1.311 | 3.322 | |
Disclaimer/Publisher’s Note: The statements, opinions and data contained in all publications are solely those of the individual author(s) and contributor(s) and not of MDPI and/or the editor(s). MDPI and/or the editor(s) disclaim responsibility for any injury to people or property resulting from any ideas, methods, instructions or products referred to in the content. |
© 2025 by the authors. Licensee MDPI, Basel, Switzerland. This article is an open access article distributed under the terms and conditions of the Creative Commons Attribution (CC BY) license (https://creativecommons.org/licenses/by/4.0/).
Share and Cite
Zafar, T.A.; Alkazemi, D.U.Z.; Muthafar, H.; Alanzi, H.; Sidhu, J.S. Sugar-Sweetened Beverage Consumption and Associated Health Risks Awareness Among University Students in Kuwait: A Cross-Sectional Study. Nutrients 2025, 17, 1646. https://doi.org/10.3390/nu17101646
Zafar TA, Alkazemi DUZ, Muthafar H, Alanzi H, Sidhu JS. Sugar-Sweetened Beverage Consumption and Associated Health Risks Awareness Among University Students in Kuwait: A Cross-Sectional Study. Nutrients. 2025; 17(10):1646. https://doi.org/10.3390/nu17101646
Chicago/Turabian StyleZafar, Tasleem A., Dalal U. Z. Alkazemi, Hasan Muthafar, Hommam Alanzi, and Jiwan S. Sidhu. 2025. "Sugar-Sweetened Beverage Consumption and Associated Health Risks Awareness Among University Students in Kuwait: A Cross-Sectional Study" Nutrients 17, no. 10: 1646. https://doi.org/10.3390/nu17101646
APA StyleZafar, T. A., Alkazemi, D. U. Z., Muthafar, H., Alanzi, H., & Sidhu, J. S. (2025). Sugar-Sweetened Beverage Consumption and Associated Health Risks Awareness Among University Students in Kuwait: A Cross-Sectional Study. Nutrients, 17(10), 1646. https://doi.org/10.3390/nu17101646