

Network Approach to Evaluate the Effect of Diet on Stroke or Myocardial Infarction Using Gaussian Graphical Model


Abstract
1. Introduction
2. Materials and Methods
2.1. Study Population
2.2. Outcome Definition
2.3. Dietary Assessment
2.4. Covariates
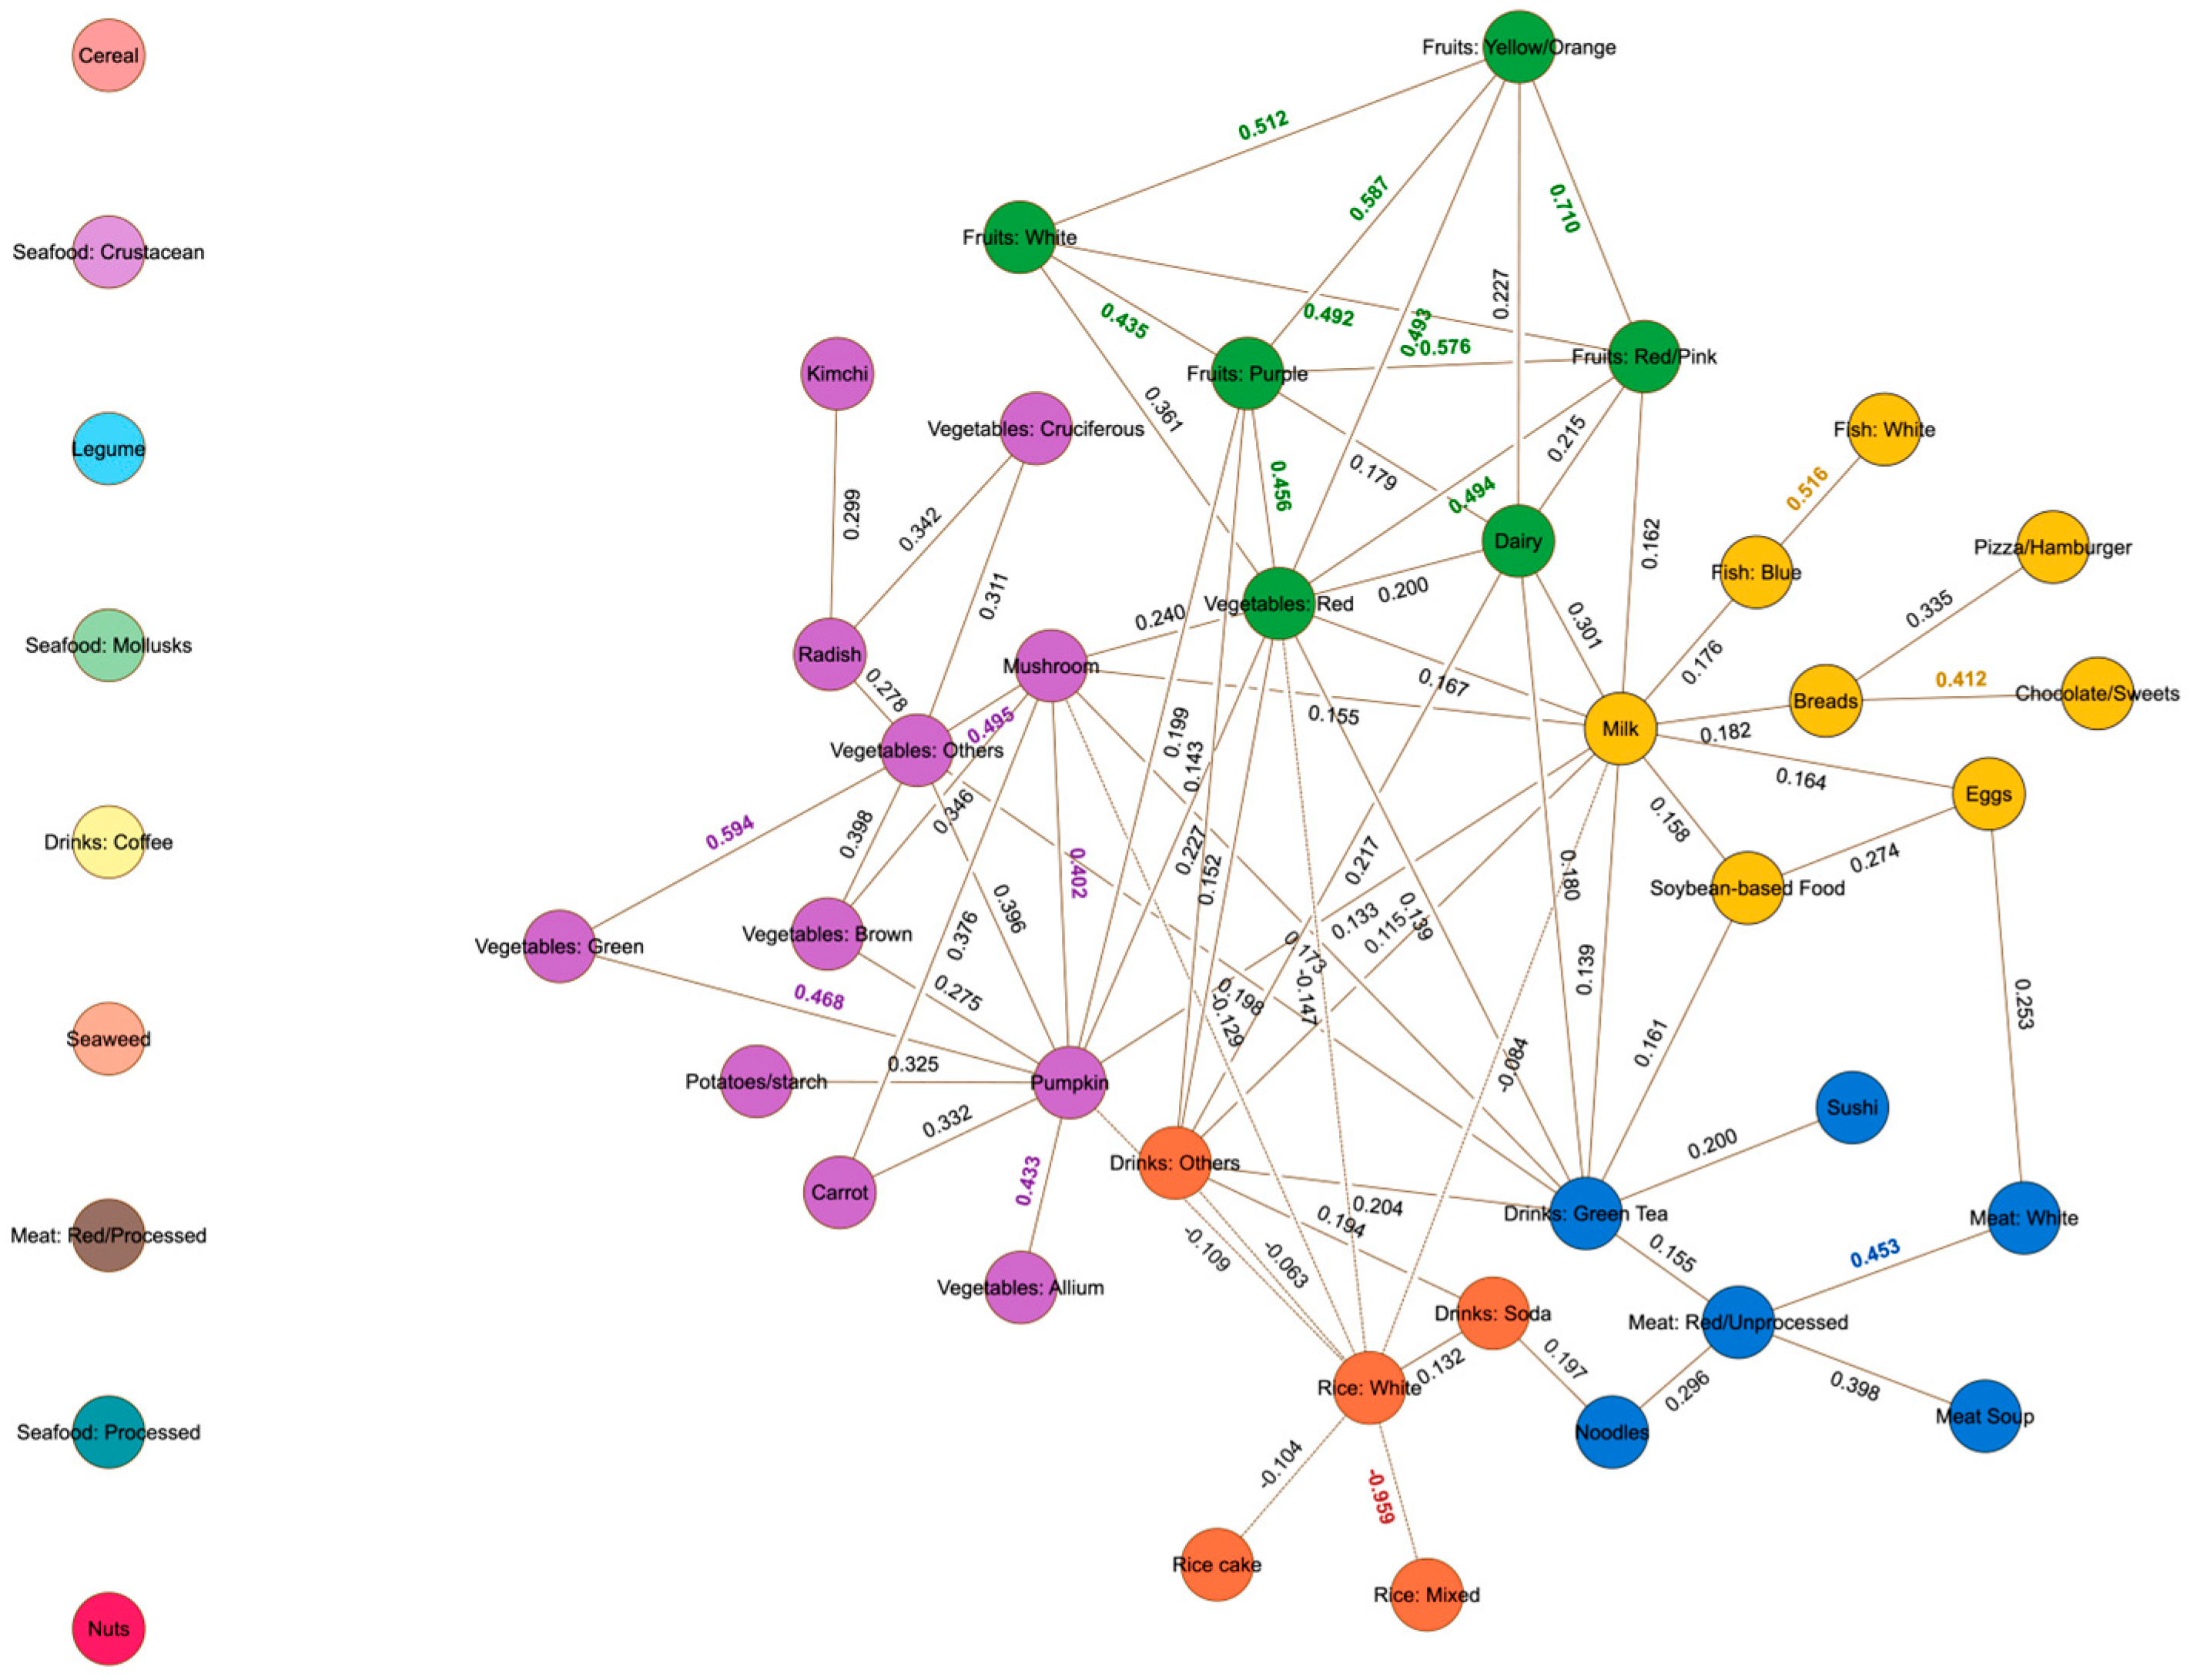
2.5. Network Analysis
2.6. Statistical Analysis
3. Results
4. Discussion
5. Conclusions
Supplementary Materials
Author Contributions
Funding
Institutional Review Board Statement
Informed Consent Statement
Data Availability Statement
Conflicts of Interest
Abbreviations
| KOGES | Korean Genome and Epidemiological Study |
| HEXA | Health Examinee cohort |
| CAVAS | Cardiovascular Disease Association Study cohort |
| AA | Ansan-Ansung cohort |
| MI | Myocardial infarction |
| CVD | Cardiovascular disease |
| GGM | Gaussian graphical model |
| FFQ | Food frequency questionnaire |
| StARS | Stability Approach to Regularization Selection |
| BMI | Body mass index |
| HR | Hazard ratio |
| HCPF | High-Calorie and Processed Food Community |
| FD | Fruits and Dairy Community |
| HPGT | High-Protein and Green Tea Community |
| RHCB | Rice and High-Calorie Beverages Community |
| VEG | Vegetables Community |
| NRF | National Research Foundation of Korea |
| CODA | Clinical & Omics Data Archive |
References
- Kim, J.Y.; Kang, K.; Kang, J.; Koo, J.; Kim, D.H.; Kim, B.J.; Kim, W.J.; Kim, E.G.; Kim, J.G.; Kim, J.M.; et al. Executive Summary of Stroke Statistics in Korea 2018: A Report from the Epidemiology Research Council of the Korean Stroke Society. J. Stroke 2019, 21, 42–59. [Google Scholar] [CrossRef] [PubMed]
- Kim, R.B.; Kim, J.R.; Hwang, J.Y. Epidemiology of myocardial infarction in Korea: Hospitalization incidence, prevalence, and mortality. Epidemiol. Health 2022, 44, e2022057. [Google Scholar] [CrossRef] [PubMed]
- Cardiovascular Diseases (CVDs). Available online: https://www.who.int/news-room/fact-sheets/detail/cardiovascular-diseases-(cvds) (accessed on 3 September 2024).
- Hu, H.; Zhao, Y.; Feng, Y.; Yang, X.; Li, Y.; Wu, Y.; Yuan, L.; Zhang, J.; Li, T.; Huang, H.; et al. Consumption of whole grains and refined grains and associated risk of cardiovascular disease events and all-cause mortality: A systematic review and dose-response meta-analysis of prospective cohort studies. Am. J. Clin. Nutr. 2023, 117, 149–159. [Google Scholar] [CrossRef] [PubMed]
- Helnaes, A.; Kyro, C.; Andersen, I.; Lacoppidan, S.; Overvad, K.; Christensen, J.; Tjonneland, A.; Olsen, A. Intake of whole grains is associated with lower risk of myocardial infarction: The Danish Diet, Cancer and Health Cohort. Am. J. Clin. Nutr. 2016, 103, 999–1007. [Google Scholar] [CrossRef]
- Praagman, J.; Franco, O.H.; Ikram, M.A.; Soedamah-Muthu, S.S.; Engberink, M.F.; van Rooij, F.J.; Hofman, A.; Geleijnse, J.M. Dairy products and the risk of stroke and coronary heart disease: The Rotterdam Study. Eur. J. Nutr. 2015, 54, 981–990. [Google Scholar] [CrossRef]
- de Goede, J.; Soedamah-Muthu, S.S.; Pan, A.; Gijsbers, L.; Geleijnse, J.M. Dairy Consumption and Risk of Stroke: A Systematic Review and Updated Dose-Response Meta-Analysis of Prospective Cohort Studies. J. Am. Heart Assoc. 2016, 5, e002787. [Google Scholar] [CrossRef]
- Blekkenhorst, L.C.; Sim, M.; Bondonno, C.P.; Bondonno, N.P.; Ward, N.C.; Prince, R.L.; Devine, A.; Lewis, J.R.; Hodgson, J.M. Cardiovascular Health Benefits of Specific Vegetable Types: A Narrative Review. Nutrients 2018, 10, 595. [Google Scholar] [CrossRef]
- Oude Griep, L.M.; Verschuren, W.M.; Kromhout, D.; Ocke, M.C.; Geleijnse, J.M. Colors of fruit and vegetables and 10-year incidence of stroke. Stroke 2011, 42, 3190–3195. [Google Scholar] [CrossRef]
- Wennberg, M.; Bergdahl, I.A.; Hallmans, G.; Norberg, M.; Lundh, T.; Skerfving, S.; Stromberg, U.; Vessby, B.; Jansson, J.H. Fish consumption and myocardial infarction: A second prospective biomarker study from northern Sweden. Am. J. Clin. Nutr. 2011, 93, 27–36. [Google Scholar] [CrossRef]
- Larsson, S.C.; Orsini, N. Fish consumption and the risk of stroke: A dose-response meta-analysis. Stroke 2011, 42, 3621–3623. [Google Scholar] [CrossRef]
- Shao, C.; Tang, H.; Zhao, W.; He, J. Nut intake and stroke risk: A dose-response meta-analysis of prospective cohort studies. Sci. Rep. 2016, 6, 30394. [Google Scholar] [CrossRef] [PubMed]
- Shen, L.; Song, L.G.; Ma, H.; Jin, C.N.; Wang, J.A.; Xiang, M.X. Tea consumption and risk of stroke: A dose-response meta-analysis of prospective studies. J. Zhejiang Univ. Sci. B 2012, 13, 652–662. [Google Scholar] [CrossRef] [PubMed]
- Mossavar-Rahmani, Y.; Kamensky, V.; Manson, J.E.; Silver, B.; Rapp, S.R.; Haring, B.; Beresford, S.A.A.; Snetselaar, L.; Wassertheil-Smoller, S. Artificially Sweetened Beverages and Stroke, Coronary Heart Disease, and All-Cause Mortality in the Women’s Health Initiative. Stroke 2019, 50, 555–562. [Google Scholar] [CrossRef] [PubMed]
- Narain, A.; Kwok, C.S.; Mamas, M.A. Soft drinks and sweetened beverages and the risk of cardiovascular disease and mortality: A systematic review and meta-analysis. Int. J. Clin. Pract. 2016, 70, 791–805. [Google Scholar] [CrossRef]
- Micha, R.; Wallace, S.K.; Mozaffarian, D. Red and processed meat consumption and risk of incident coronary heart disease, stroke, and diabetes mellitus: A systematic review and meta-analysis. Circulation 2010, 121, 2271–2283. [Google Scholar] [CrossRef]
- Kim, K.; Hyeon, J.; Lee, S.A.; Kwon, S.O.; Lee, H.; Keum, N.; Lee, J.K.; Park, S.M. Role of Total, Red, Processed, and White Meat Consumption in Stroke Incidence and Mortality: A Systematic Review and Meta-Analysis of Prospective Cohort Studies. J. Am. Heart Assoc. 2017, 6, e005983. [Google Scholar] [CrossRef]
- Shi, Z.Q.; Tang, J.J.; Wu, H.; Xie, C.Y.; He, Z.Z. Consumption of nuts and legumes and risk of stroke: A meta-analysis of prospective cohort studies. Nutr. Metab. Cardiovasc. Dis. 2014, 24, 1262–1271. [Google Scholar] [CrossRef]
- Davis, C.; Bryan, J.; Hodgson, J.; Murphy, K. Definition of the Mediterranean Diet; a Literature Review. Nutrients 2015, 7, 9139–9153. [Google Scholar] [CrossRef]
- Sherzai, A.; Heim, L.T.; Boothby, C.; Sherzai, A.D. Stroke, food groups, and dietary patterns: A systematic review. Nutr. Rev. 2012, 70, 423–435. [Google Scholar] [CrossRef]
- Ding, E.L.; Mozaffarian, D. Optimal dietary habits for the prevention of stroke. Semin. Neurol. 2006, 26, 11–23. [Google Scholar] [CrossRef]
- Tektonidis, T.G.; Akesson, A.; Gigante, B.; Wolk, A.; Larsson, S.C. A Mediterranean diet and risk of myocardial infarction, heart failure and stroke: A population-based cohort study. Atherosclerosis 2015, 243, 93–98. [Google Scholar] [CrossRef] [PubMed]
- Fung, T.T.; Stampfer, M.J.; Manson, J.E.; Rexrode, K.M.; Willett, W.C.; Hu, F.B. Prospective study of major dietary patterns and stroke risk in women. Stroke 2004, 35, 2014–2019. [Google Scholar] [CrossRef] [PubMed]
- Iqbal, R.; Anand, S.; Ounpuu, S.; Islam, S.; Zhang, X.; Rangarajan, S.; Chifamba, J.; Al-Hinai, A.; Keltai, M.; Yusuf, S.; et al. Dietary patterns and the risk of acute myocardial infarction in 52 countries: Results of the INTERHEART study. Circulation 2008, 118, 1929–1937. [Google Scholar] [CrossRef]
- Lockheart, M.S.; Steffen, L.M.; Rebnord, H.M.; Fimreite, R.L.; Ringstad, J.; Thelle, D.S.; Pedersen, J.I.; Jacobs, D.R., Jr. Dietary patterns, food groups and myocardial infarction: A case-control study. Br. J. Nutr. 2007, 98, 380–387. [Google Scholar] [CrossRef]
- Seo, A.R.; Hwang, T.Y. Relationship between Dietary Patterns and Cardiovascular Disease Risk in Korean Older Adults. Int. J. Environ. Res. Public Health 2021, 18, 3703. [Google Scholar] [CrossRef]
- Zhang, F.; Tapera, T.M.; Gou, J. Application of a new dietary pattern analysis method in nutritional epidemiology. BMC Med. Res. Methodol. 2018, 18, 119. [Google Scholar] [CrossRef]
- Hoffmann, K.; Schulze, M.B.; Schienkiewitz, A.; Nothlings, U.; Boeing, H. Application of a new statistical method to derive dietary patterns in nutritional epidemiology. Am. J. Epidemiol. 2004, 159, 935–944. [Google Scholar] [CrossRef]
- Iqbal, K.; Buijsse, B.; Wirth, J.; Schulze, M.B.; Floegel, A.; Boeing, H. Gaussian Graphical Models Identify Networks of Dietary Intake in a German Adult Population. J. Nutr. 2016, 146, 646–652. [Google Scholar] [CrossRef]
- Shutta, K.H.; De Vito, R.; Scholtens, D.M.; Balasubramanian, R. Gaussian graphical models with applications to omics analyses. Stat. Med. 2022, 41, 5150–5187. [Google Scholar] [CrossRef]
- Kim, Y.; Han, B.G.; KoGES Group. Cohort Profile: The Korean Genome and Epidemiology Study (KoGES) Consortium. Int. J. Epidemiol. 2017, 46, e20. [Google Scholar] [CrossRef]
- Health Examinees Study Group. The Health Examinees (HEXA) study: Rationale, study design and baseline characteristics. Asian Pac. J. Cancer Prev. 2015, 16, 1591–1597. [Google Scholar] [CrossRef] [PubMed]
- Ahn, Y.; Kwon, E.; Shim, J.E.; Park, M.K.; Joo, Y.; Kimm, K.; Park, C.; Kim, D.H. Validation and reproducibility of food frequency questionnaire for Korean genome epidemiologic study. Eur. J. Clin. Nutr. 2007, 61, 1435–1441. [Google Scholar] [CrossRef] [PubMed]
- Kim, Y.; Kim, Y.M.; Shin, M.H.; Koh, S.B.; Chang Kim, H.; Kim, M.K. Empirically identified dietary patterns and metabolic syndrome risk in a prospective cohort study: The Cardiovascular Disease Association Study. Clin. Nutr. 2022, 41, 2156–2162. [Google Scholar] [CrossRef] [PubMed]
- Shin, W.K.; Lee, H.W.; Shin, A.; Lee, J.K.; Lee, S.A.; Lee, J.E.; Kang, D. Multi-Grain Rice Diet Decreases Risk of Breast Cancer in Korean Women: Results from the Health Examinees Study. Nutrients 2020, 12, 2273. [Google Scholar] [CrossRef]
- Lee, H.A.; An, H.; Park, H. Identification of Dietary Patterns Related to Metabolic Diseases and Their Association with Cardiovascular Disease: From the Korean Genome and Epidemiology Study. Nutrients 2019, 11, 2434. [Google Scholar] [CrossRef]
- Peterson, R.A. Finding Optimal Normalizing Transformations via bestNormalize. R J. 2021, 13, 310–329. [Google Scholar] [CrossRef]
- Epskamp, S.; Waldorp, L.J.; Mottus, R.; Borsboom, D. The Gaussian Graphical Model in Cross-Sectional and Time-Series Data. Multivar. Behav. Res. 2018, 53, 453–480. [Google Scholar] [CrossRef]
- Zhao, T.; Liu, H.; Roeder, K.; Lafferty, J.; Wasserman, L. The huge Package for High-dimensional Undirected Graph Estimation in R. J. Mach. Learn. Res. 2012, 13, 1059–1062. [Google Scholar]
- Liu, H.; Roeder, K.; Wasserman, L. Stability Approach to Regularization Selection (StARS) for High Dimensional Graphical Models. Adv. Neural Inf. Process Syst. 2010, 24, 1432–1440. [Google Scholar]
- Oza, P.; Agrawal, S.; Ravaliya, D.; Kakkar, R. Evaluating the Igraph Community Detection Algorithms on Different Real Networks. Scalable Comput.-Pract. Exp. 2023, 24, 173–180. [Google Scholar] [CrossRef]
- Larsson, S.C. Coffee, tea, and cocoa and risk of stroke. Stroke 2014, 45, 309–314. [Google Scholar] [CrossRef] [PubMed]
- Bernstein, A.M.; Pan, A.; Rexrode, K.M.; Stampfer, M.; Hu, F.B.; Mozaffarian, D.; Willett, W.C. Dietary protein sources and the risk of stroke in men and women. Stroke 2012, 43, 637–644. [Google Scholar] [CrossRef] [PubMed]
- Lopez-Ruiz, A.; Sartori-Valinotti, J.; Yanes, L.L.; Iliescu, R.; Reckelhoff, J.F. Sex differences in control of blood pressure: Role of oxidative stress in hypertension in females. Am. J. Physiol. Heart Circ. Physiol. 2008, 295, H466–H474. [Google Scholar] [CrossRef] [PubMed]
- Larsson, S.C.; Akesson, A.; Wolk, A. Sweetened beverage consumption is associated with increased risk of stroke in women and men. J. Nutr. 2014, 144, 856–860. [Google Scholar] [CrossRef]
- Pase, M.P.; Himali, J.J.; Beiser, A.S.; Aparicio, H.J.; Satizabal, C.L.; Vasan, R.S.; Seshadri, S.; Jacques, P.F. Sugar- and Artificially Sweetened Beverages and the Risks of Incident Stroke and Dementia: A Prospective Cohort Study. Stroke 2017, 48, 1139–1146. [Google Scholar] [CrossRef]
- Wu, D.; Guan, Y.; Lv, S.; Wang, H.; Li, J. No Evidence of Increased Risk of Stroke with Consumption of Refined Grains: A Meta-analysis of Prospective Cohort Studies. J. Stroke Cerebrovasc. Dis. 2015, 24, 2738–2746. [Google Scholar] [CrossRef]
- Hu, E.A.; Pan, A.; Malik, V.; Sun, Q. White rice consumption and risk of type 2 diabetes: Meta-analysis and systematic review. BMJ 2012, 344, e1454. [Google Scholar] [CrossRef]
- Lv, M.; Su, C.; Huang, F.; Wang, H.; Wang, Z.; Zhang, B.; Du, W. Association of Vegetable Consumption with Stroke in China: A Longitudinal Study. Nutrients 2023, 15, 1583. [Google Scholar] [CrossRef]
- Kwon, Y.S.; Ryu, J.; Yang, Y.; Park, Y.K.; Kim, S. Trends and Dietary Assessment According to Fruit and Vegetable Intake in Korean Elderly People: Analysis Based on the Korea National Health and Nutrition Examination Survey 1998, 2008, and 2018. Foods 2020, 9, 1712. [Google Scholar] [CrossRef]
- Strazzullo, P.; D’Elia, L.; Kandala, N.B.; Cappuccio, F.P. Salt intake, stroke, and cardiovascular disease: Meta-analysis of prospective studies. BMJ 2009, 339, b4567. [Google Scholar] [CrossRef]
- Park, J.; Kwock, C.K. Sodium intake and prevalence of hypertension, coronary heart disease, and stroke in Korean adults. J. Ethn. Foods 2015, 2, 92–96. [Google Scholar] [CrossRef]
- Spence, J.D. Nutrition and Risk of Stroke. Nutrients 2019, 11, 647. [Google Scholar] [CrossRef] [PubMed]
- Jiang, L.; Lee, Y.-K. Analysis of sodium content of representative Korean foods high in sodium from home meal, foodservice, and restaurants. J. Nutr. Health 2017, 50, 655. [Google Scholar] [CrossRef]
- Kim, J.-A.; Kim, Y.-H.; Ann, M.-Y.; Lee, Y.-K. Measurements of Salinity and Salt Content by Menu Types Served at Industry Foodservice Operations in Daegu. Korean J. Community Nutr. 2012, 17, 637–651. [Google Scholar] [CrossRef]
- Ko, J.; Timmerman, G.M.; Kim, K.B.; Kim, M.T. Food Sources of Sodium in Korean Americans with Type 2 Diabetes: Implications for Cardiovascular Disease. J. Transcult. Nurs. 2019, 30, 154–162. [Google Scholar] [CrossRef]
- Wright, A.C.; Fan, Y.; Baker, G.L. Nutritional Value and Food Safety of Bivalve Molluscan Shellfish. J. Shellfish. Res. 2018, 37, 695–708. [Google Scholar] [CrossRef]
- Williams, P.G. The benefits of breakfast cereal consumption: A systematic review of the evidence base. Adv. Nutr. 2014, 5, 636S–673S. [Google Scholar] [CrossRef]
- Cheng, T.; Shi, S.; Zhang, X.; Duan, C.; Yun, Z.; Hu, Y. Association Between Breakfast Cereals and Risk of Cardiovascular Diseases and Type 2 Diabetes: A Mendelian Randomization Study; Research Square Platform LLC: Durham, NC, USA, 2023. [Google Scholar] [CrossRef]
- Chen, J.; Huang, Q.; Shi, W.; Yang, L.; Chen, J.; Lan, Q. Meta-Analysis of the Association Between Whole and Refined Grain Consumption and Stroke Risk Based on Prospective Cohort Studies. Asia Pac. J. Public Health 2016, 28, 563–575. [Google Scholar] [CrossRef]
- Choe, S.; Lee, J.; Lee, J.; Kang, D.; Lee, J.K.; Shin, A. Validity of Self-reported Stroke and Myocardial Infarction in Korea: The Health Examinees (HEXA) Study. J. Prev. Med. Public Health 2019, 52, 377–383. [Google Scholar] [CrossRef]
- Woo, H.D.; Song, D.S.; Choi, S.H.; Park, J.K.; Lee, K.; Yun, H.Y.; Choi, D.R.; Koo, Y.S.; Park, H.Y. Integrated dataset of the Korean Genome and Epidemiology Study cohort with estimated air pollution data. Epidemiol. Health 2022, 44, e2022071. [Google Scholar] [CrossRef]
- Park, S.J.; Lyu, J.; Lee, K.; Lee, H.J.; Park, H.Y. Nutrition survey methods and food composition database update of the Korean Genome and Epidemiology Study. Epidemiol. Health 2024, 46, e2024042. [Google Scholar] [CrossRef] [PubMed]
- Caldwell, M.; Martinez, L.; Foster, J.G.; Sherling, D.; Hennekens, C.H. Prospects for the Primary Prevention of Myocardial Infarction and Stroke. J. Cardiovasc. Pharmacol. Ther. 2019, 24, 207–214. [Google Scholar] [CrossRef] [PubMed]
- Ridker, P.M. Inflammatory biomarkers and risks of myocardial infarction, stroke, diabetes, and total mortality: Implications for longevity. Nutr. Rev. 2007, 65, S253–S259. [Google Scholar] [CrossRef] [PubMed]
- Lachat, C.; Hawwash, D.; Ocké, M.C.; Berg, C.; Forsum, E.; Hörnell, A.; Larsson, C.L.; Sonestedt, E.; Wirfält, E.; Åkesson, A.; et al. Strengthening the Reporting of Observational studies in Epidemiology—Nutritional Epidemiology (STROBE-nut): An extension of the STROBE statement. PLoS Med. 2016, 13, e1002036. [Google Scholar] [CrossRef]


| Variable Category | Total Population (n = 84,729) | Male (n = 30,131) | Female (n = 54,598) | ||||||
|---|---|---|---|---|---|---|---|---|---|
| At Risk n (%) | No. of Events * n (%cases) | HR (95% CI) | At Risk n (%) | No. of Events * n (%cases) | HR (95% CI) | At Risk n (%) | No. of Events * n (%cases) | HR (95% CI) | |
| Age: median (IQR) | 54 (48–61) | 1.08 (1.07–1.08) | 55 (48–62) | 1.06 (1.06–1.07) | 53 (47–60) | 1.09 (1.08–1.09) | |||
| Education level | |||||||||
| ≤Middle school | 34,407 (40.61) | 1921 (62.03) | 1.89 (1.70–2.09) | 9489 (31.49) | 673 (45.41) | 1.60 (1.41–1.83) | 24,918 (45.64) | 1248 (77.28) | 3.60 (2.91–4.46) |
| High school graduate | 28,998 (34.22) | 746 (24.09) | 1.04 (0.92–1.17) | 9946 (33.01) | 470 (31.71) | 1.17 (1.02–1.35) | 19,052 (34.9) | 276 (17.09) | 1.34 (1.06–1.70) |
| College | 21,324 (25.17) | 430 (13.88) | 1.00 (ref) | 10,696 (35.5) | 339 (22.87) | 1.00 (ref) | 10,628 (19.47) | 91 (5.63) | 1.00 (ref) |
| Income (million KRW) | |||||||||
| <1 | 11,269 (13.30) | 816 (26.35) | 2.11 (1.84–2.42) | 3503 (11.63) | 290 (19.57) | 1.52 (1.26–1.84) | 7766 (14.22) | 526 (32.57) | 3.26 (2.62–4.06) |
| 1–1.99 | 15,387 (18.16) | 631 (20.37) | 1.47 (1.28–1.70) | 5613 (18.63) | 341 (23.01) | 1.30 (1.08–1.56) | 9774 (17.9) | 290 (17.96) | 1.85 (1.47–2.33) |
| 2–3.99 | 33,014 (38.96) | 786 (25.38) | 1.10 (0.96–1.26) | 11,816 (39.22) | 440 (29.69) | 1.02 (0.86–1.22) | 21,198 (38.83) | 346 (21.42) | 1.30 (1.04–1.63) |
| ≥4 | 15,533 (18.33) | 274 (8.85) | 1.00 (ref) | 6070 (20.15) | 177 (11.94) | 1.00 (ref) | 9463 (17.33) | 97 (6.01) | 1.00 (ref) |
| Unknown | 9526 (11.24) | 590 (19.05) | 2.37 (2.05–2.74) | 3129 (10.38) | 234 (15.79) | 1.92 (1.57–2.33) | 6397 (11.72) | 356 (22.04) | 3.43 (2.73–4.30) |
| Size of the city | |||||||||
| Metropolitan city | 39,578 (46.71) | 726 (23.44) | 1.00 (ref) | 12,568 (41.71) | 361 (24.36) | 1.00 (ref) | 27,010 (49.47) | 365 (22.60) | 1.00 (ref) |
| Middle-sized city | 25,622 (30.24) | 769 (24.83) | 0.98 (0.88–1.09) | 9873 (32.77) | 445 (30.03) | 0.85 (0.74–0.99) | 15,749 (28.85) | 324 (20.06) | 0.98 (0.84–1.15) |
| Rural | 19,529 (23.05) | 1602 (51.73) | 2.00 (1.82–2.19) | 9946 (33.01) | 676 (45.61) | 1.34 (1.17–1.53) | 11,839 (21.68) | 926 (57.34) | 2.63 (2.31–2.99) |
| Marriage status | |||||||||
| Married/living together | 76,274 (90.02) | 2732 (88.21) | 1.00 (ref) | 28,812 (95.62) | 1422 (95.95) | 1.00 (ref) | 47,462 (86.93) | 1310 (81.11) | 1.00 (ref) |
| Single/unmarried | 8455 (9.98) | 365 (11.79) | 1.37 (1.23–1.53) | 1319 (4.38) | 60 (4.05) | 1.16 (0.90–1.50) | 7136 (13.07) | 305 (18.89) | 1.66 (1.47–1.88) |
| Body mass index (BMI) | |||||||||
| <18.5 | 1443 (1.70) | 50 (1.61) | 1.45 (1.09–1.93) | 434 (1.44) | 29 (1.96) | 1.45 (0.99–2.11) | 1009 (1.85) | 21 (1.3) | 1.34 (0.86–2.07) |
| 18.5 to 22.9 | 30,703 (36.24) | 784 (25.31) | 1.00 (ref) | 8899 (29.53) | 391 (26.38) | 1.00 (ref) | 21,804 (39.94) | 393 (24.33) | 1.00 (ref) |
| 23.0 to 24.9 | 23,402 (27.62) | 856 (27.64) | 1.33 (1.21–1.47) | 8871 (29.44) | 415 (28.00) | 1.13 (0.98–1.29) | 14,531 (26.61) | 441 (27.31) | 1.48 (1.29–1.70) |
| ≥25.0 | 29,181 (34.44) | 1407 (45.43) | 1.60 (1.46–1.74) | 11,927 (39.58) | 647 (43.66) | 1.23 (1.09–1.40) | 17,254 (31.60) | 760 (47.06) | 1.90 (1.68–2.14) |
| Waist circumference | |||||||||
| Normal range ** | 50,916 (60.09) | 1505 (48.60) | 1.00 (ref) | 21,546 (71.51) | 980 (66.13) | 1.00 (ref) | 29,370 (53.79) | 525 (32.51) | 1.00 (ref) |
| Above normal *** | 33,813 (39.91) | 1592 (51.40) | 1.54 (1.44–1.65) | 8585 (28.49) | 502 (33.87) | 1.45 (1.30–1.61) | 25,228 (46.21) | 1090 (67.49) | 2.07 (1.86–2.29) |
| History of: | |||||||||
| Hypertension (Yes) | 16,458 (19.42) | 961 (31.03) | 2.24 (2.07–2.41) | 6559 (21.77) | 417 (28.14) | 1.86 (1.66–2.09) | 9899 (18.13) | 544 (33.68) | 2.57 (2.32–2.85) |
| Hyperlipidemia (Yes) | 7190 (8.49) | 251 (8.10) | 1.43 (1.25–1.62) | 2564 (8.51) | 113 (7.62) | 1.26 (1.04–1.52) | 4626 (8.47) | 138 (8.54) | 1.58 (1.32–1.88) |
| Diabetes mellitus (Yes) | 5701 (6.73) | 368 (11.88) | 2.12 (1.90–2.36) | 2699 (8.96) | 193 (13.02) | 1.82 (1.56–2.12) | 3002 (5.50) | 175 (10.84) | 2.31 (1.98–2.70) |
| Job | |||||||||
| Professional or administrative | 8516 (10.05) | 158 (5.10) | 1.00 (ref) | 4649 (15.43) | 137 (9.24) | 1.00 (ref) | 3867 (7.08) | 21 (1.30) | 1.00 (ref) |
| Office, sales, or service | 16,565 (19.55) | 320 (10.33) | 1.06 (0.88–1.29) | 7227 (23.99) | 195 (13.16) | 0.93 (0.75–1.16) | 9338 (17.10) | 125 (7.74) | 2.42 (1.53–3.85) |
| Laborer or agricultural | 20,875 (24.64) | 1266 (40.88) | 2.06 (1.74–2.43) | 11,765 (39.05) | 721 (48.65) | 1.50 (1.25–1.80) | 9110 (16.69) | 545 (33.75) | 5.84 (3.77–9.04) |
| Other, unemployed, or housekeeper | 38,773 (45.76) | 1353 (43.69) | 1.32 (1.12–1.56) | 6490 (21.54) | 429 (28.95) | 1.31 (1.08–1.59) | 32,283 (59.13) | 924 (57.21) | 3.51 (2.27–5.41) |
| Smoking status | |||||||||
| Non-smoker | 61,313 (72.36) | 1862 (60.12) | 1.00 (ref) | 8428 (27.97) | 338 (22.81) | 1.00 (ref) | 52,885 (96.86) | 1524 (94.37) | 1.00 (ref) |
| Past | 12,901 (15.23) | 596 (19.24) | 1.49 (1.36–1.63) | 12,258 (40.68) | 570 (38.46) | 1.18 (1.03–1.35) | 643 (1.18) | 26 (1.61) | 1.53 (1.04–2.26) |
| Current | 10,515 (12.41) | 639 (20.63) | 1.52 (1.39–1.67) | 9445 (31.35) | 574 (38.73) | 1.20 (1.04–1.37) | 1070 (1.96) | 65 (4.02) | 2.03 (1.59–2.61) |
| Drinking status | |||||||||
| Non-drinker | 43,950 (51.87) | 1539 (49.69) | 1.000 (ref) | 6181 (20.51) | 325 (21.93) | 1.00 (ref) | 37,769 (69.18) | 1214 (75.17) | 1.00 (ref) |
| Past | 3524 (4.16) | 208 (6.72) | 1.50 (1.30–1.73) | 2426 (8.05) | 154 (10.39) | 1.15 (0.95–1.39) | 1098 (2.01) | 54 (3.34) | 1.39 (1.06–1.82) |
| Current | 37,255 (43.97) | 1350 (43.59) | 0.99 (0.92–1.06) | 21,524 (71.43) | 1003 (67.68) | 0.86 (0.76–0.97) | 15,731 (28.81) | 347 (21.49) | 0.72 (0.64–0.81) |
| Exercise | |||||||||
| Yes | 41,473 (48.95) | 1122 (36.23) | 0.79 (0.74–0.85) | 15,381 (51.05) | 625 (42.17) | 0.97 (0.87–1.08) | 26,092 (47.79) | 497 (30.77) | 0.64 (0.58–0.71) |
| Network Scores: HR (95% CI) | Total Population (n = 84,729) | Males (n = 30,131) | Females (n = 54,598) | p for Interaction | |||||||||
|---|---|---|---|---|---|---|---|---|---|---|---|---|---|
| Cases | Model 1 | Model 2 | Model 3 | Cases | Model 1 | Model 2 | Model 3 | Cases | Model 1 | Model 2 | Model 3 | ||
| HCPF | 3097 | 0.98 (0.97–0.99) | 0.99 (0.98–1.00) | 1.00 (0.98–1.01) | 1482 | 0.99 (0.97–1.01) | 0.99 (0.98–1.01) | 0.99 (0.97–1.01) | 1615 | 0.97 (0.96–0.99) | 0.99 (0.98–1.01) | 1.01 (0.99–1.02) | 0.057 |
| Q1 | 903 | 1.00 (ref) | 1.00 (ref) | 1.00 (ref) | 386 | 1.00 (ref) | 1.00 (ref) | 1.00 (ref) | 517 | 1.00 (ref) | 1.00 (ref) | 1.00 (ref) | |
| Q2 | 665 | 0.97 (0.88–1.07) | 1.01 (0.91–1.12) | 1.03 (0.93–1.14) | 344 | 1.01 (0.87–1.16) | 1.00 (0.86–1.16) | 1.01 (0.87–1.17) | 321 | 0.96 (0.83–1.10) | 1.04 (0.90–1.20) | 1.07 (0.93–1.23) | |
| Q3 | 582 | 0.92 (0.82–1.02) | 0.97 (0.87–1.08) | 0.99 (0.89–1.10) | 273 | 0.92 (0.79–1.07) | 0.92 (0.79–1.08) | 0.93 (0.80–1.10) | 309 | 0.93 (0.81–1.08) | 1.04 (0.90–1.20) | 1.07 (0.93–1.24) | |
| Q4 | 514 | 0.90 (0.80–1.00) | 0.98 (0.87–1.09) | 1.01 (0.90–1.13) | 253 | 0.97 (0.83–1.14) | 0.98 (0.84–1.15) | 1.00 (0.84–1.18) | 261 | 0.86 (0.74–1.00) | 1.02 (0.87–1.19) | 1.07 (0.91–1.25) | |
| Q5 | 433 | 0.82 (0.73–0.92) | 0.92 (0.82–1.04) | 0.96 (0.84–1.09) | 226 | 0.94 (0.79–1.11) | 0.95 (0.80–1.12) | 0.96 (0.79–1.15) | 207 | 0.75 (0.63–0.88) | 0.95 (0.80–1.13) | 1.02 (0.84–1.23) | |
| FD | 3097 | 0.99 (0.99–1.00) | 1.00 (0.99–1.01) | 1.00 (1.00–1.01) | 1482 | 1.00 (0.99–1.01) | 1.00 (0.99–1.01) | 1.00 (0.99–1.01) | 1615 | 0.99 (0.98–1.00) | 1.00 (0.99–1.01) | 1.01 (1.00–1.02) | 0.694 |
| Q1 | 749 | 1.00 (ref) | 1.00 (ref) | 1.00 (ref) | 415 | 1.00 (ref) | 1.00 (ref) | 1.00 (ref) | 334 | 1.00 (ref) | 1.00 (ref) | 1.00 (ref) | |
| Q2 | 657 | 0.92 (0.83–1.03) | 0.95 (0.85–1.05) | 0.97 (0.87–1.08) | 314 | 0.86 (0.74–1.00) | 0.87 (0.75–1.00) | 0.88 (0.76–1.02) | 343 | 1.00 (0.86–1.16) | 1.04 (0.89–1.21) | 1.07 (0.92–1.25) | |
| Q3 | 609 | 0.94 (0.85–1.05) | 0.99 (0.89–1.10) | 1.02 (0.91–1.14) | 300 | 0.93 (0.80–1.08) | 0.95 (0.81–1.10) | 0.96 (0.83–1.12) | 309 | 0.97 (0.83–1.13) | 1.05 (0.90–1.23) | 1.09 (0.93–1.28) | |
| Q4 | 536 | 0.89 (0.80–1.00) | 0.94 (0.84–1.05) | 0.99 (0.88–1.11) | 222 | 0.80 (0.68–0.95) | 0.82 (0.69–0.96) | 0.84 (0.71–0.99) | 314 | 1.00 (0.85–1.16) | 1.10 (0.94–1.28) | 1.17 (1.00–1.38) | |
| Q5 | 546 | 0.94 (0.84–1.05) | 1.01 (0.90–1.13) | 1.08 (0.95–1.22) | 231 | 1.01 (0.86–1.19) | 1.03 (0.87–1.21) | 1.06 (0.88–1.26) | 315 | 0.93 (0.79–1.08) | 1.05 (0.90–1.23) | 1.16 (0.98–1.38) | |
| HPGT | 3097 | 0.96 (0.94–0.98) | 0.98 (0.96–0.99) | 0.98 (0.96–1.00) | 1482 | 0.98 (0.96–1.00) | 0.98 (0.95–1.00) | 0.97 (0.95–1.00) | 1615 | 0.94 (0.92–0.97) | 0.98 (0.96–1.01) | 0.99 (0.96–1.02) | 0.026 |
| Q1 | 820 | 1.00 (ref) | 1.00 (ref) | 1.00 (ref) | 221 | 1.00 (ref) | 1.00 (ref) | 1.00 (ref) | 599 | 1.00 (ref) | 1.00 (ref) | 1.00 (ref) | |
| Q2 | 634 | 0.87 (0.78–0.96) | 0.92 (0.83–1.02) | 0.93 (0.83–1.03) | 268 | 0.94 (0.79–1.12) | 0.95 (0.80–1.14) | 0.95 (0.80–1.14) | 366 | 0.87 (0.76–0.99) | 0.94 (0.82–1.08) | 0.96 (0.84–1.10) | |
| Q3 | 551 | 0.79 (0.71–0.88) | 0.85 (0.76–0.95) | 0.86 (0.76–0.96) | 294 | 0.94 (0.78–1.12) | 0.92 (0.77–1.11) | 0.92 (0.77–1.11) | 257 | 0.73 (0.63–0.84) | 0.84 (0.72–0.98) | 0.86 (0.73–1.00) | |
| Q4 | 554 | 0.79 (0.71–0.89) | 0.87 (0.77–0.98) | 0.88 (0.78–1.00) | 335 | 0.95 (0.80–1.13) | 0.95 (0.79–1.13) | 0.94 (0.78–1.13) | 219 | 0.70 (0.60–0.83) | 0.85 (0.72–1.01) | 0.88 (0.74–1.05) | |
| Q5 | 538 | 0.77 (0.68–0.87) | 0.86 (0.76–0.98) | 0.88 (0.77–1.01) | 364 | 0.87 (0.73–1.03) | 0.86 (0.72–1.04) | 0.85 (0.70–1.04) | 174 | 0.73 (0.61–0.87) | 0.94 (0.78–1.13) | 0.99 (0.81–1.21) | |
| RHCB | 3097 | 1.01 (0.99–1.02) | 1.00 (0.99–1.02) | 1.00 (0.99–1.02) | 1482 | 1.00 (0.99–1.02) | 1.01 (0.99–1.03) | 1.01 (0.99–1.03) | 1615 | 1.00 (0.98–1.02) | 1.00 (0.98–1.01) | 1.00 (0.98–1.02) | 0.936 |
| Q1 | 548 | 1.00 (ref) | 1.00 (ref) | 1.00 (ref) | 232 | 1.00 (ref) | 1.00 (ref) | 1.00 (ref) | 316 | 1.00 (ref) | 1.00 (ref) | 1.00 (ref) | |
| Q2 | 475 | 0.98 (0.87–1.11) | 1.01 (0.90–1.15) | 1.03 (0.91–1.17) | 200 | 0.96 (0.80–1.16) | 0.98 (0.81–1.18) | 0.99 (0.82–1.20) | 275 | 1.00 (0.85–1.18) | 1.05 (0.90–1.24) | 1.08 (0.92–1.27) | |
| Q3 | 491 | 1.05 (0.93–1.19) | 1.10 (0.97–1.24) | 1.11 (0.99–1.26) | 203 | 1.03 (0.86–1.25) | 1.07 (0.88–1.29) | 1.08 (0.90–1.31) | 288 | 1.07 (0.91–1.25) | 1.14 (0.97–1.34) | 1.15 (0.98–1.36) | |
| Q4 | 677 | 1.06 (0.95–1.19) | 1.08 (0.96–1.21) | 1.08 (0.96–1.21) | 318 | 0.96 (0.81–1.13) | 1.00 (0.84–1.18) | 0.99 (0.84–1.18) | 359 | 1.17 (1.00–1.36) | 1.16 (1.00–1.36) | 1.16 (0.99–1.35) | |
| Q5 | 906 | 1.04 (0.94–1.17) | 1.05 (0.94–1.17) | 1.05 (0.94–1.18) | 529 | 1.00 (0.85–1.17) | 1.04 (0.88–1.22) | 1.04 (0.88–1.22) | 377 | 1.05 (0.91–1.23) | 1.02 (0.88–1.20) | 1.05 (0.89–1.23) | |
| VEG | 3097 | 0.98 (0.97–0.99) | 0.99 (0.98–1.00) | 0.99 (0.98–1.01) | 1482 | 0.99 (0.97–1.00) | 0.98 (0.97–1.00) | 0.98 (0.96–1.00) | 1615 | 0.98 (0.96–1.00) | 1.00 (0.98–1.01) | 1.01 (0.99–1.02) | 0.484 |
| Q1 | 796 | 1.00 (ref) | 1.00 (ref) | 1.00 (ref) | 385 | 1.00 (ref) | 1.00 (ref) | 1.00 (ref) | 411 | 1.00 (ref) | 1.00 (ref) | 1.00 (ref) | |
| Q2 | 715 | 0.99 (0.90–1.10) | 1.02 (0.92–1.13) | 1.03 (0.93–1.15) | 325 | 0.94 (0.81–1.09) | 0.94 (0.81–1.09) | 0.94 (0.81–1.09) | 390 | 1.05 (0.91–1.21) | 1.10 (0.96–1.27) | 1.15 (1.00–1.32) | |
| Q3 | 624 | 0.98 (0.88–1.08) | 1.02 (0.91–1.13) | 1.04 (0.93–1.16) | 313 | 1.02 (0.88–1.19) | 1.02 (0.88–1.19) | 1.02 (0.87–1.19) | 311 | 0.94 (0.81–1.10) | 1.03 (0.89–1.20) | 1.08 (0.92–1.26) | |
| Q4 | 514 | 0.86 (0.77–0.96) | 0.92 (0.82–1.03) | 0.94 (0.84–1.06) | 251 | 0.89 (0.76–1.05) | 0.89 (0.76–1.05) | 0.88 (0.74–1.04) | 263 | 0.85 (0.73–0.99) | 0.97 (0.83–1.14) | 1.03 (0.87–1.22) | |
| Q5 | 448 | 0.86 (0.77–0.97) | 0.93 (0.82–1.05) | 0.96 (0.84–1.09) | 208 | 0.87 (0.74–1.04) | 0.87 (0.73–1.04) | 0.86 (0.71–1.04) | 240 | 0.87 (0.74–1.02) | 1.02 (0.86–1.21) | 1.10 (0.92–1.32) | |
| Network Scores: HR (95% CI) | Total Population (n = 84,729) | Males (n = 30,131) | Females (n = 54,598) | p for Interaction | |||||||||
|---|---|---|---|---|---|---|---|---|---|---|---|---|---|
| Cases | Model 1 | Model 2 | Model 3 | Cases | Model 1 | Model 2 | Model 3 | Cases | Model 1 | Model 2 | Model 3 | ||
| HCPF | 1040 | 0.97 (0.95–0.99) | 0.99 (0.97–1.01) | 0.99 (0.97–1.01) | 512 | 0.98 (0.95–1.01) | 0.99 (0.96–1.02) | 0.99 (0.96–1.02) | 528 | 0.96 (0.93–0.98) | 0.99 (0.96–1.02) | 0.99 (0.96–1.02) | 0.437 |
| Q1 | 325 | 1.00 (ref) | 1.00 (ref) | 1.00 (ref) | 149 | 1.00 (ref) | 1.00 (ref) | 1.00 (ref) | 176 | 1.00 (ref) | 1.00 (ref) | 1.00 (ref) | |
| Q2 | 224 | 0.91 (0.77–1.09) | 0.97 (0.82–1.15) | 0.98 (0.83–1.17) | 120 | 0.93 (0.73–1.18) | 0.95 (0.74–1.21) | 0.95 (0.75–1.22) | 104 | 0.90 (0.71–1.15) | 0.99 (0.77–1.27) | 1.01 (0.79–1.29) | |
| Q3 | 187 | 0.83 (0.69–0.99) | 0.91 (0.75–1.09) | 0.93 (0.77–1.11) | 82 | 0.73 (0.56–0.96) | 0.77 (0.58–1.01) | 0.78 (0.59–1.03) | 105 | 0.94 (0.73–1.20) | 1.07 (0.83–1.37) | 1.10 (0.85–1.41) | |
| Q4 | 161 | 0.79 (0.65–0.96) | 0.90 (0.74–1.09) | 0.92 (0.75–1.13) | 82 | 0.84 (0.64–1.10) | 0.89 (0.67–1.17) | 0.90 (0.68–1.20) | 79 | 0.76 (0.58–1.00) | 0.92 (0.70–1.21) | 0.95 (0.72–1.27) | |
| Q5 | 143 | 0.75 (0.62–0.92) | 0.89 (0.72–1.10) | 0.92 (0.73–1.15) | 79 | 0.87 (0.66–1.14) | 0.94 (0.71–1.25) | 0.94 (0.69–1.29) | 64 | 0.66 (0.49–0.88) | 0.86 (0.64–1.17) | 0.91 (0.65–1.27) | |
| FD | 1040 | 0.99 (0.98–1.00) | 1.00 (0.99–1.01) | 1.00 (0.99–1.02) | 512 | 0.99 (0.97–1.01) | 0.99 (0.98–1.01) | 1.00 (0.98–1.02) | 528 | 0.99 (0.98–1.01) | 1.01 (0.99–1.02) | 1.01 (0.99–1.03) | 0.617 |
| Q1 | 244 | 1.00 (ref) | 1.00 (ref) | 1.00 (ref) | 146 | 1.00 (ref) | 1.00 (ref) | 1.00 (ref) | 98 | 1.00 (ref) | 1.00 (ref) | 1.00 (ref) | |
| Q2 | 238 | 1.00 (0.84–1.20) | 1.04 (0.87–1.24) | 1.06 (0.88–1.27) | 118 | 0.91 (0.71–1.16) | 0.93 (0.73–1.19) | 0.94 (0.74–1.21) | 120 | 1.13 (0.86–1.47) | 1.19 (0.91–1.55) | 1.22 (0.93–1.60) | |
| Q3 | 204 | 0.95 (0.79–1.14) | 1.01 (0.83–1.22) | 1.04 (0.86–1.26) | 100 | 0.88 (0.68–1.13) | 0.91 (0.70–1.17) | 0.93 (0.71–1.21) | 104 | 1.06 (0.80–1.39) | 1.16 (0.88–1.53) | 1.20 (0.90–1.59) | |
| Q4 | 186 | 0.93 (0.77–1.13) | 1.01 (0.83–1.23) | 1.06 (0.87–1.30) | 75 | 0.76 (0.58–1.01) | 0.81 (0.61–1.08) | 0.84 (0.63–1.12) | 111 | 1.14 (0.87–1.50) | 1.28 (0.97–1.69) | 1.36 (1.02–1.81) | |
| Q5 | 168 | 0.87 (0.71–1.06) | 0.98 (0.80–1.20) | 1.04 (0.83–1.29) | 73 | 0.90 (0.68–1.19) | 0.97 (0.73–1.29) | 1.00 (0.73–1.36) | 95 | 0.89 (0.67–1.19) | 1.05 (0.79–1.41) | 1.15 (0.84–1.58) | |
| HPGT | 1040 | 0.95 (0.93–0.98) | 0.98 (0.95–1.01) | 0.98 (0.95–1.02) | 512 | 0.98 (0.94–1.02) | 0.99 (0.95–1.03) | 0.99 (0.94–1.04) | 528 | 0.93 (0.90–0.97) | 0.98 (0.93–1.02) | 0.98 (0.94–1.03) | 0.420 |
| Q1 | 284 | 1.00 (ref) | 1.00 (ref) | 1.00 (ref) | 79 | 1.00 (ref) | 1.00 (ref) | 1.00 (ref) | 205 | 1.00 (ref) | 1.00 (ref) | 1.00 (ref) | |
| Q2 | 190 | 0.73 (0.60–0.88) | 0.79 (0.65–0.95) | 0.80 (0.66–0.97) | 83 | 0.82 (0.60–1.12) | 0.87 (0.63–1.18) | 0.87 (0.64–1.19) | 107 | 0.70 (0.55–0.89) | 0.77 (0.60–0.98) | 0.78 (0.61–1.00) | |
| Q3 | 193 | 0.77 (0.64–0.93) | 0.86 (0.71–1.04) | 0.87 (0.72–1.06) | 114 | 1.03 (0.77–1.39) | 1.10 (0.82–1.47) | 1.10 (0.81–1.49) | 79 | 0.61 (0.47–0.80) | 0.71 (0.54–0.94) | 0.73 (0.56–0.97) | |
| Q4 | 186 | 0.73 (0.60–0.89) | 0.85 (0.69–1.04) | 0.87 (0.70–1.07) | 118 | 0.96 (0.71–1.28) | 1.05 (0.77–1.41) | 1.05 (0.77–1.43) | 68 | 0.59 (0.44–0.78) | 0.72 (0.54–0.97) | 0.75 (0.55–1.02) | |
| Q5 | 187 | 0.72 (0.59–0.89) | 0.87 (0.70–1.07) | 0.90 (0.71–1.14) | 118 | 0.81 (0.60–1.10) | 0.91 (0.66–1.25) | 0.91 (0.64–1.28) | 69 | 0.74 (0.55–0.99) | 0.97 (0.71–1.32) | 1.03 (0.74–1.45) | |
| RHCB | 1040 | 1.01 (0.99–1.03) | 1.00 (0.98–1.03) | 1.00 (0.98–1.03) | 512 | 1.03 (0.99–1.06) | 1.02 (0.99–1.05) | 1.02 (0.99–1.05) | 528 | 0.99 (0.96–1.03) | 0.99 (0.96–1.02) | 0.99 (0.96–1.02) | 0.593 |
| Q1 | 188 | 1.00 (ref) | 1.00 (ref) | 1.00 (ref) | 77 | 1.00 (ref) | 1.00 (ref) | 1.00 (ref) | 111 | 1.00 (ref) | 1.00 (ref) | 1.00 (ref) | |
| Q2 | 138 | 0.84 (0.67–1.04) | 0.89 (0.71–1.11) | 0.90 (0.72–1.12) | 64 | 0.94 (0.67–1.30) | 0.97 (0.70–1.35) | 0.99 (0.71–1.38) | 74 | 0.77 (0.58–1.04) | 0.83 (0.62–1.11) | 0.84 (0.63–1.13) | |
| Q3 | 139 | 0.87 (0.70–1.08) | 0.92 (0.74–1.15) | 0.94 (0.75–1.17) | 49 | 0.75 (0.53–1.08) | 0.79 (0.55–1.13) | 0.81 (0.56–1.15) | 90 | 0.95 (0.72–1.26) | 1.03 (0.78–1.36) | 1.04 (0.79–1.38) | |
| Q4 | 227 | 1.00 (0.82–1.21) | 0.99 (0.82–1.21) | 0.99 (0.81–1.20) | 114 | 1.02 (0.76–1.36) | 1.02 (0.76–1.37) | 1.01 (0.75–1.35) | 113 | 0.99 (0.77–1.29) | 0.98 (0.75–1.28) | 0.98 (0.75–1.27) | |
| Q5 | 348 | 1.05 (0.87–1.26) | 1.03 (0.86–1.24) | 1.03 (0.85–1.25) | 208 | 1.14 (0.87–1.49) | 1.14 (0.86–1.50) | 1.13 (0.86–1.49) | 140 | 0.97 (0.75–1.25) | 0.94 (0.72–1.22) | 0.95 (0.73–1.24) | |
| VEG | 1040 | 0.97 (0.95–0.99) | 0.99 (0.97–1.01) | 0.99 (0.97–1.01) | 512 | 0.99 (0.96–1.02) | 0.99 (0.97–1.02) | 1.00 (0.96–1.03) | 528 | 0.96 (0.93–0.99) | 0.98 (0.95–1.01) | 0.98 (0.95–1.01) | 0.241 |
| Q1 | 276 | 1.00 (ref) | 1.00 (ref) | 1.00 (ref) | 128 | 1.00 (ref) | 1.00 (ref) | 1.00 (ref) | 148 | 1.00 (ref) | 1.00 (ref) | 1.00 (ref) | |
| Q2 | 257 | 1.00 (0.85–1.19) | 1.04 (0.87–1.23) | 1.05 (0.89–1.25) | 127 | 1.09 (0.85–1.40) | 1.12 (0.87–1.43) | 1.12 (0.87–1.44) | 130 | 0.93 (0.73–1.18) | 0.98 (0.77–1.25) | 1.00 (0.79–1.28) | |
| Q3 | 202 | 0.89 (0.74–1.07) | 0.94 (0.78–1.13) | 0.96 (0.79–1.16) | 107 | 1.05 (0.81–1.36) | 1.08 (0.83–1.41) | 1.09 (0.83–1.42) | 95 | 0.76 (0.58–0.98) | 0.83 (0.63–1.08) | 0.85 (0.65–1.11) | |
| Q4 | 157 | 0.75 (0.61–0.91) | 0.81 (0.66–1.00) | 0.83 (0.67–1.02) | 75 | 0.80 (0.60–1.07) | 0.84 (0.62–1.12) | 0.84 (0.62–1.13) | 82 | 0.70 (0.53–0.92) | 0.80 (0.61–1.06) | 0.83 (0.62–1.11) | |
| Q5 | 148 | 0.82 (0.67–1.01) | 0.92 (0.75–1.14) | 0.95 (0.75–1.18) | 75 | 0.97 (0.73–1.29) | 1.03 (0.77–1.39) | 1.03 (0.75–1.43) | 73 | 0.71 (0.54–0.95) | 0.85 (0.63–1.14) | 0.88 (0.64–1.21) | |
| Network Scores: HR (95% CI) | Total Population (n = 84,729) | Males (n = 30,131) | Females (n = 54,598) | p for Interaction | |||||||||
|---|---|---|---|---|---|---|---|---|---|---|---|---|---|
| Cases | Model 1 | Model 2 | Model 3 | Cases | Model 1 | Model 2 | Model 3 | Cases | Model 1 | Model 2 | Model 3 | ||
| HCPF | 2001 | 0.98 (0.97–1.00) | 0.99 (0.98–1.01) | 1.00 (0.98–1.02) | 947 | 0.99 (0.98–1.02) | 0.99 (0.97–1.02) | 0.99 (0.97–1.02) | 1054 | 0.98 (0.96–1.00) | 1.00 (0.98–1.02) | 1.01 (0.99–1.04) | 0.072 |
| Q1 | 555 | 1.00 (ref) | 1.00 (ref) | 1.00 (ref) | 228 | 1.00 (ref) | 1.00 (ref) | 1.00 (ref) | 327 | 1.00 (ref) | 1.00 (ref) | 1.00 (ref) | |
| Q2 | 433 | 1.02 (0.90–1.16) | 1.05 (0.93–1.20) | 1.07 (0.94–1.22) | 221 | 1.08 (0.90–1.30) | 1.06 (0.88–1.28) | 1.07 (0.89–1.29) | 212 | 1.00 (0.84–1.19) | 1.08 (0.91–1.29) | 1.12 (0.93–1.33) | |
| Q3 | 385 | 0.98 (0.86–1.11) | 1.01 (0.89–1.16) | 1.04 (0.91–1.19) | 186 | 1.05 (0.86–1.27) | 1.02 (0.84–1.24) | 1.04 (0.85–1.27) | 199 | 0.95 (0.79–1.13) | 1.04 (0.87–1.25) | 1.08 (0.90–1.29) | |
| Q4 | 346 | 0.97 (0.85–1.12) | 1.04 (0.90–1.19) | 1.07 (0.92–1.23) | 169 | 1.09 (0.89–1.33) | 1.06 (0.87–1.30) | 1.07 (0.87–1.32) | 177 | 0.92 (0.76–1.11) | 1.08 (0.90–1.31) | 1.14 (0.94–1.39) | |
| Q5 | 282 | 0.86 (0.75–1.00) | 0.94 (0.81–1.10) | 0.98 (0.83–1.16) | 143 | 0.99 (0.80–1.22) | 0.96 (0.78–1.20) | 0.97 (0.76–1.23) | 139 | 0.80 (0.65–0.99) | 1.00 (0.81–1.24) | 1.08 (0.85–1.36) | |
| FD | 2001 | 1.00 (0.99–1.01) | 1.00 (0.99–1.01) | 1.00 (0.99–1.01) | 947 | 1.00 (0.99–1.01) | 1.00 (0.99–1.01) | 1.00 (0.99–1.02) | 1054 | 0.99 (0.98–1.01) | 1.00 (0.99–1.02) | 1.01 (1.00–1.02) | 0.341 |
| Q1 | 486 | 1.00 (ref) | 1.00 (ref) | 1.00 (ref) | 259 | 1.00 (ref) | 1.00 (ref) | 1.00 (ref) | 227 | 1.00 (ref) | 1.00 (ref) | 1.00 (ref) | |
| Q2 | 406 | 0.89 (0.78–1.02) | 0.91 (0.80–1.04) | 0.93 (0.81–1.06) | 190 | 0.84 (0.69–1.01) | 0.84 (0.69–1.01) | 0.85 (0.70–1.03) | 216 | 0.94 (0.78–1.14) | 0.98 (0.81–1.18) | 1.01 (0.84–1.22) | |
| Q3 | 401 | 0.97 (0.85–1.10) | 1.00 (0.88–1.15) | 1.04 (0.90–1.19) | 197 | 0.99 (0.82–1.19) | 0.99 (0.82–1.19) | 1.00 (0.83–1.21) | 204 | 0.96 (0.79–1.16) | 1.04 (0.86–1.25) | 1.08 (0.89–1.32) | |
| Q4 | 338 | 0.88 (0.76–1.01) | 0.91 (0.79–1.05) | 0.95 (0.82–1.10) | 146 | 0.85 (0.69–1.04) | 0.85 (0.69–1.04) | 0.87 (0.70–1.07) | 192 | 0.92 (0.76–1.11) | 0.99 (0.82–1.21) | 1.07 (0.88–1.31) | |
| Q5 | 370 | 0.99 (0.87–1.14) | 1.04 (0.90–1.19) | 1.11 (0.95–1.29) | 155 | 1.09 (0.90–1.34) | 1.07 (0.88–1.32) | 1.11 (0.89–1.38) | 215 | 0.96 (0.79–1.16) | 1.06 (0.87–1.29) | 1.18 (0.95–1.45) | |
| HPGT | 2001 | 0.96 (0.95–0.99) | 0.97 (0.95–1.00) | 0.98 (0.95–1.00) | 947 | 0.98 (0.95–1.01) | 0.97 (0.94–1.00) | 0.96 (0.93–1.00) | 1054 | 0.95 (0.92–0.98) | 0.99 (0.96–1.02) | 0.99 (0.96–1.03) | 0.033 |
| Q1 | 521 | 1.00 (ref) | 1.00 (ref) | 1.00 (ref) | 138 | 1.00 (ref) | 1.00 (ref) | 1.00 (ref) | 383 | 1.00 (ref) | 1.00 (ref) | 1.00 (ref) | |
| Q2 | 427 | 0.93 (0.82–1.06) | 0.97 (0.85–1.11) | 0.98 (0.86–1.12) | 180 | 1.01 (0.81–1.26) | 1.00 (0.80–1.25) | 0.99 (0.79–1.25) | 247 | 0.94 (0.80–1.11) | 1.01 (0.86–1.19) | 1.03 (0.87–1.21) | |
| Q3 | 347 | 0.80 (0.69–0.91) | 0.83 (0.72–0.96) | 0.84 (0.73–0.97) | 174 | 0.88 (0.70–1.10) | 0.84 (0.66–1.05) | 0.83 (0.66–1.05) | 173 | 0.79 (0.66–0.95) | 0.90 (0.75–1.08) | 0.92 (0.76–1.12) | |
| Q4 | 360 | 0.83 (0.72–0.95) | 0.88 (0.76–1.02) | 0.89 (0.77–1.04) | 213 | 0.96 (0.77–1.19) | 0.90 (0.72–1.13) | 0.89 (0.71–1.13) | 147 | 0.77 (0.63–0.94) | 0.92 (0.75–1.13) | 0.95 (0.77–1.18) | |
| Q5 | 346 | 0.80 (0.69–0.93) | 0.86 (0.74–1.01) | 0.87 (0.74–1.04) | 242 | 0.90 (0.72–1.13) | 0.84 (0.67–1.06) | 0.83 (0.64–1.06) | 104 | 0.72 (0.57–0.90) | 0.92 (0.72–1.16) | 0.96 (0.74–1.24) | |
| RHCB | 2001 | 1.00 (0.99–1.02) | 1.00 (0.99–1.02) | 1.00 (0.99–1.02) | 947 | 1.00 (0.97–1.02) | 1.00 (0.98–1.03) | 1.00 (0.98–1.03) | 1054 | 1.00 (0.98–1.03) | 1.00 (0.98–1.02) | 1.00 (0.98–1.03) | 0.840 |
| Q1 | 347 | 1.00 (ref) | 1.00 (ref) | 1.00 (ref) | 151 | 1.00 (ref) | 1.00 (ref) | 1.00 (ref) | 196 | 1.00 (ref) | 1.00 (ref) | 1.00 (ref) | |
| Q2 | 327 | 1.06 (0.91–1.23) | 1.08 (0.93–1.26) | 1.10 (0.95–1.28) | 129 | 0.95 (0.75–1.20) | 0.96 (0.76–1.21) | 0.97 (0.77–1.23) | 198 | 1.16 (0.95–1.42) | 1.21 (0.99–1.47) | 1.24 (1.02–1.51) | |
| Q3 | 344 | 1.16 (0.99–1.35) | 1.20 (1.03–1.39) | 1.22 (1.05–1.42) | 151 | 1.18 (0.94–1.48) | 1.20 (0.96–1.51) | 1.22 (0.97–1.53) | 193 | 1.15 (0.95–1.41) | 1.22 (0.99–1.49) | 1.23 (1.01–1.51) | |
| Q4 | 439 | 1.11 (0.96–1.28) | 1.13 (0.98–1.31) | 1.13 (0.98–1.31) | 199 | 0.93 (0.75–1.15) | 0.98 (0.79–1.22) | 0.98 (0.79–1.22) | 240 | 1.29 (1.07–1.56) | 1.29 (1.06–1.56) | 1.28 (1.06–1.55) | |
| Q5 | 544 | 1.05 (0.91–1.20) | 1.05 (0.92–1.21) | 1.07 (0.92–1.23) | 317 | 0.94 (0.77–1.14) | 1.00 (0.82–1.22) | 1.00 (0.81–1.23) | 227 | 1.10 (0.90–1.34) | 1.06 (0.87–1.30) | 1.09 (0.89–1.33) | |
| VEG | 2001 | 0.99 (0.97–1.00) | 0.99 (0.98–1.01) | 0.99 (0.98–1.01) | 947 | 0.98 (0.96–1.00) | 0.98 (0.96–1.00) | 0.98 (0.95–1.00) | 1054 | 0.99 (0.97–1.01) | 1.00 (0.99–1.02) | 1.02 (0.99–1.04) | 0.904 |
| Q1 | 504 | 1.00 (ref) | 1.00 (ref) | 1.00 (ref) | 250 | 1.00 (ref) | 1.00 (ref) | 1.00 (ref) | 254 | 1.00 (ref) | 1.00 (ref) | 1.00 (ref) | |
| Q2 | 445 | 0.99 (0.87–1.12) | 1.01 (0.88–1.14) | 1.02 (0.90–1.16) | 193 | 0.86 (0.72–1.04) | 0.86 (0.71–1.04) | 0.85 (0.70–1.03) | 252 | 1.12 (0.94–1.33) | 1.17 (0.98–1.40) | 1.22 (1.02–1.46) | |
| Q3 | 413 | 1.03 (0.90–1.17) | 1.07 (0.93–1.22) | 1.09 (0.95–1.24) | 201 | 1.01 (0.84–1.22) | 1.00 (0.83–1.21) | 0.98 (0.81–1.19) | 212 | 1.07 (0.89–1.29) | 1.16 (0.96–1.40) | 1.23 (1.01–1.49) | |
| Q4 | 348 | 0.93 (0.81–1.07) | 0.97 (0.85–1.12) | 1.00 (0.86–1.16) | 172 | 0.94 (0.78–1.15) | 0.92 (0.75–1.12) | 0.90 (0.73–1.11) | 176 | 0.94 (0.77–1.14) | 1.07 (0.87–1.30) | 1.15 (0.93–1.41) | |
| Q5 | 291 | 0.88 (0.76–1.02) | 0.93 (0.80–1.08) | 0.96 (0.81–1.13) | 131 | 0.84 (0.68–1.04) | 0.81 (0.65–1.01) | 0.79 (0.62–1.00) | 160 | 0.95 (0.78–1.16) | 1.10 (0.89–1.35) | 1.21 (0.96–1.51) | |
Disclaimer/Publisher’s Note: The statements, opinions and data contained in all publications are solely those of the individual author(s) and contributor(s) and not of MDPI and/or the editor(s). MDPI and/or the editor(s) disclaim responsibility for any injury to people or property resulting from any ideas, methods, instructions or products referred to in the content. |
© 2025 by the authors. Licensee MDPI, Basel, Switzerland. This article is an open access article distributed under the terms and conditions of the Creative Commons Attribution (CC BY) license (https://creativecommons.org/licenses/by/4.0/).
Share and Cite
Lailo, J.M.; Shin, J.; Menichetti, G.; Lee, S.-A. Network Approach to Evaluate the Effect of Diet on Stroke or Myocardial Infarction Using Gaussian Graphical Model. Nutrients 2025, 17, 1605. https://doi.org/10.3390/nu17101605
Lailo JM, Shin J, Menichetti G, Lee S-A. Network Approach to Evaluate the Effect of Diet on Stroke or Myocardial Infarction Using Gaussian Graphical Model. Nutrients. 2025; 17(10):1605. https://doi.org/10.3390/nu17101605
Chicago/Turabian StyleLailo, Jaca Maison, Jiae Shin, Giulia Menichetti, and Sang-Ah Lee. 2025. "Network Approach to Evaluate the Effect of Diet on Stroke or Myocardial Infarction Using Gaussian Graphical Model" Nutrients 17, no. 10: 1605. https://doi.org/10.3390/nu17101605
APA StyleLailo, J. M., Shin, J., Menichetti, G., & Lee, S.-A. (2025). Network Approach to Evaluate the Effect of Diet on Stroke or Myocardial Infarction Using Gaussian Graphical Model. Nutrients, 17(10), 1605. https://doi.org/10.3390/nu17101605