1. Introduction
Malnutrition remains a significant global public health challenge despite concerted global efforts to enhance child nutrition. As of 2022, the statistics reveal a distressing reality: globally, over one-fifth of children aged <5 years were stunted (amounting to 148.1 million children), and 45 million children were affected by wasting [
1]. Even more alarming is the fact that approximately 5.2 million children aged <5 years died due to malnutrition-related complications, with nearly half of these fatalities attributed to malnutrition [
1]. The prevalence of malnourished children is disproportionately concentrated in Asia and Africa, with these regions bearing the brunt of the crisis. For instance, by 2020, more than half of all stunted and more than two-thirds of all wasted children aged <5 years lived in Asia, and two of every five stunted and more than one-quarter of all wasted children aged <5 years lived in Africa [
2].
Echoing the global trend, child malnutrition remains a pressing public health issue in Ethiopia. The latest Ethiopian Demographic and Health Survey (EDHS) underscores this reality, revealing that 38% of children aged <5 years across Ethiopia are stunted, with an alarming 46% of children aged <5 years in the Amhara region being stunted. In addition, approximately 24% and 10% of these children are underweight and wasted, respectively [
3]. The ramifications of child malnutrition are profound, accounting for approximately 28% of child mortality, 16% of primary school repetition, an 8% reduction in the workforce, and an annual economic cost of ETB 55.5 billion, equivalent to approximately 16.5% of the country’s gross domestic product [
4].
Addressing the burden of child malnutrition requires a comprehensive understanding of its determinants within specific contexts, including at the individual, household, community, region, and environmental levels [
5]. The framework conceptualized by the United Nations International Children’s Emergency Fund (UNICEF) identifies three types of determinants of malnutrition: basic, underlying, and immediate [
6]. Empirical studies conducted globally confirm that a child’s dietary intake and disease experiences constitute immediate causes of malnutrition [
7,
8,
9,
10,
11]. Similarly, studies conducted in various developing countries, including Ethiopia, highlight the significant association between child malnutrition and underlying determinants such as food security, feeding and care practices, health services, and household environments (water, sanitation, and hygiene) [
7,
8,
10,
11,
12,
13,
14,
15,
16,
17,
18,
19,
20,
21,
22,
23,
24,
25,
26,
27]. In addition, these studies also highlight the significant role of basic factors, such as maternal education, media exposure, training, nutrition-sensitive agricultural practices, agroecosystem characteristics, and household wealth in child malnutrition.
The Ethiopian government has demonstrated a strong commitment to addressing child malnutrition, as evidenced by the formulation of numerous multisectoral programs, policies, and initiatives since 2008. These include the National Nutrition Program (NNP-I and NNP-II), Nutrition-Sensitive Agriculture (NSA) policy, Seqota Declaration, National Nutrition Policy and Strategy, and the recently developed Food-Based Dietary Guideline [
28,
29]. However, despite these efforts, child malnutrition persists in Ethiopia, particularly in the Amhara region, where nearly half of all children aged <5 years are reported to be stunted [
3]. This underscores the need for further research to provide us with a comprehensive understanding of the prevalence of child malnutrition and its determinants.
Although previous studies have provided valuable insights into child malnutrition, significant research gaps remain, particularly with regard to the effects of agriculture and agroecosystem characteristics on child malnutrition, which are often overlooked in the existing literature. In addition, methodological advances are warranted to better capture the complex and multifaceted nature of malnutrition determinants [
30]. To this end, we used structural equation modeling (SEM) techniques in the present study, leveraging the UNICEF conceptual framework, to analyze the hierarchical relationships between malnutrition and its determinants. Unlike conventional regression analysis, SEM offers a more nuanced understanding of these relationships by allowing for the measurement of latent variables and their direct and indirect effects on malnutrition. Furthermore, this study used the Composite Index of Anthropometric Failure (CIAF) to comprehensively assess the prevalence of child malnutrition, thereby mitigating the risk of underestimation associated with conventional single anthropometric indicators [
31].
The aims of the present study were to comprehensively examine the prevalence of malnutrition and to explore its determinants among children aged <5 years in northwest Ethiopia. The findings hold significant implications for stakeholders involved in nutrition-sensitive and nutrition-specific intervention programs, facilitating a nuanced understanding of spatial variations across agroecosystems. Therefore, targeting and working on <5 years children is a great window of opportunity to tackle the intergenerational impact of malnutrition.
Conceptual Framework
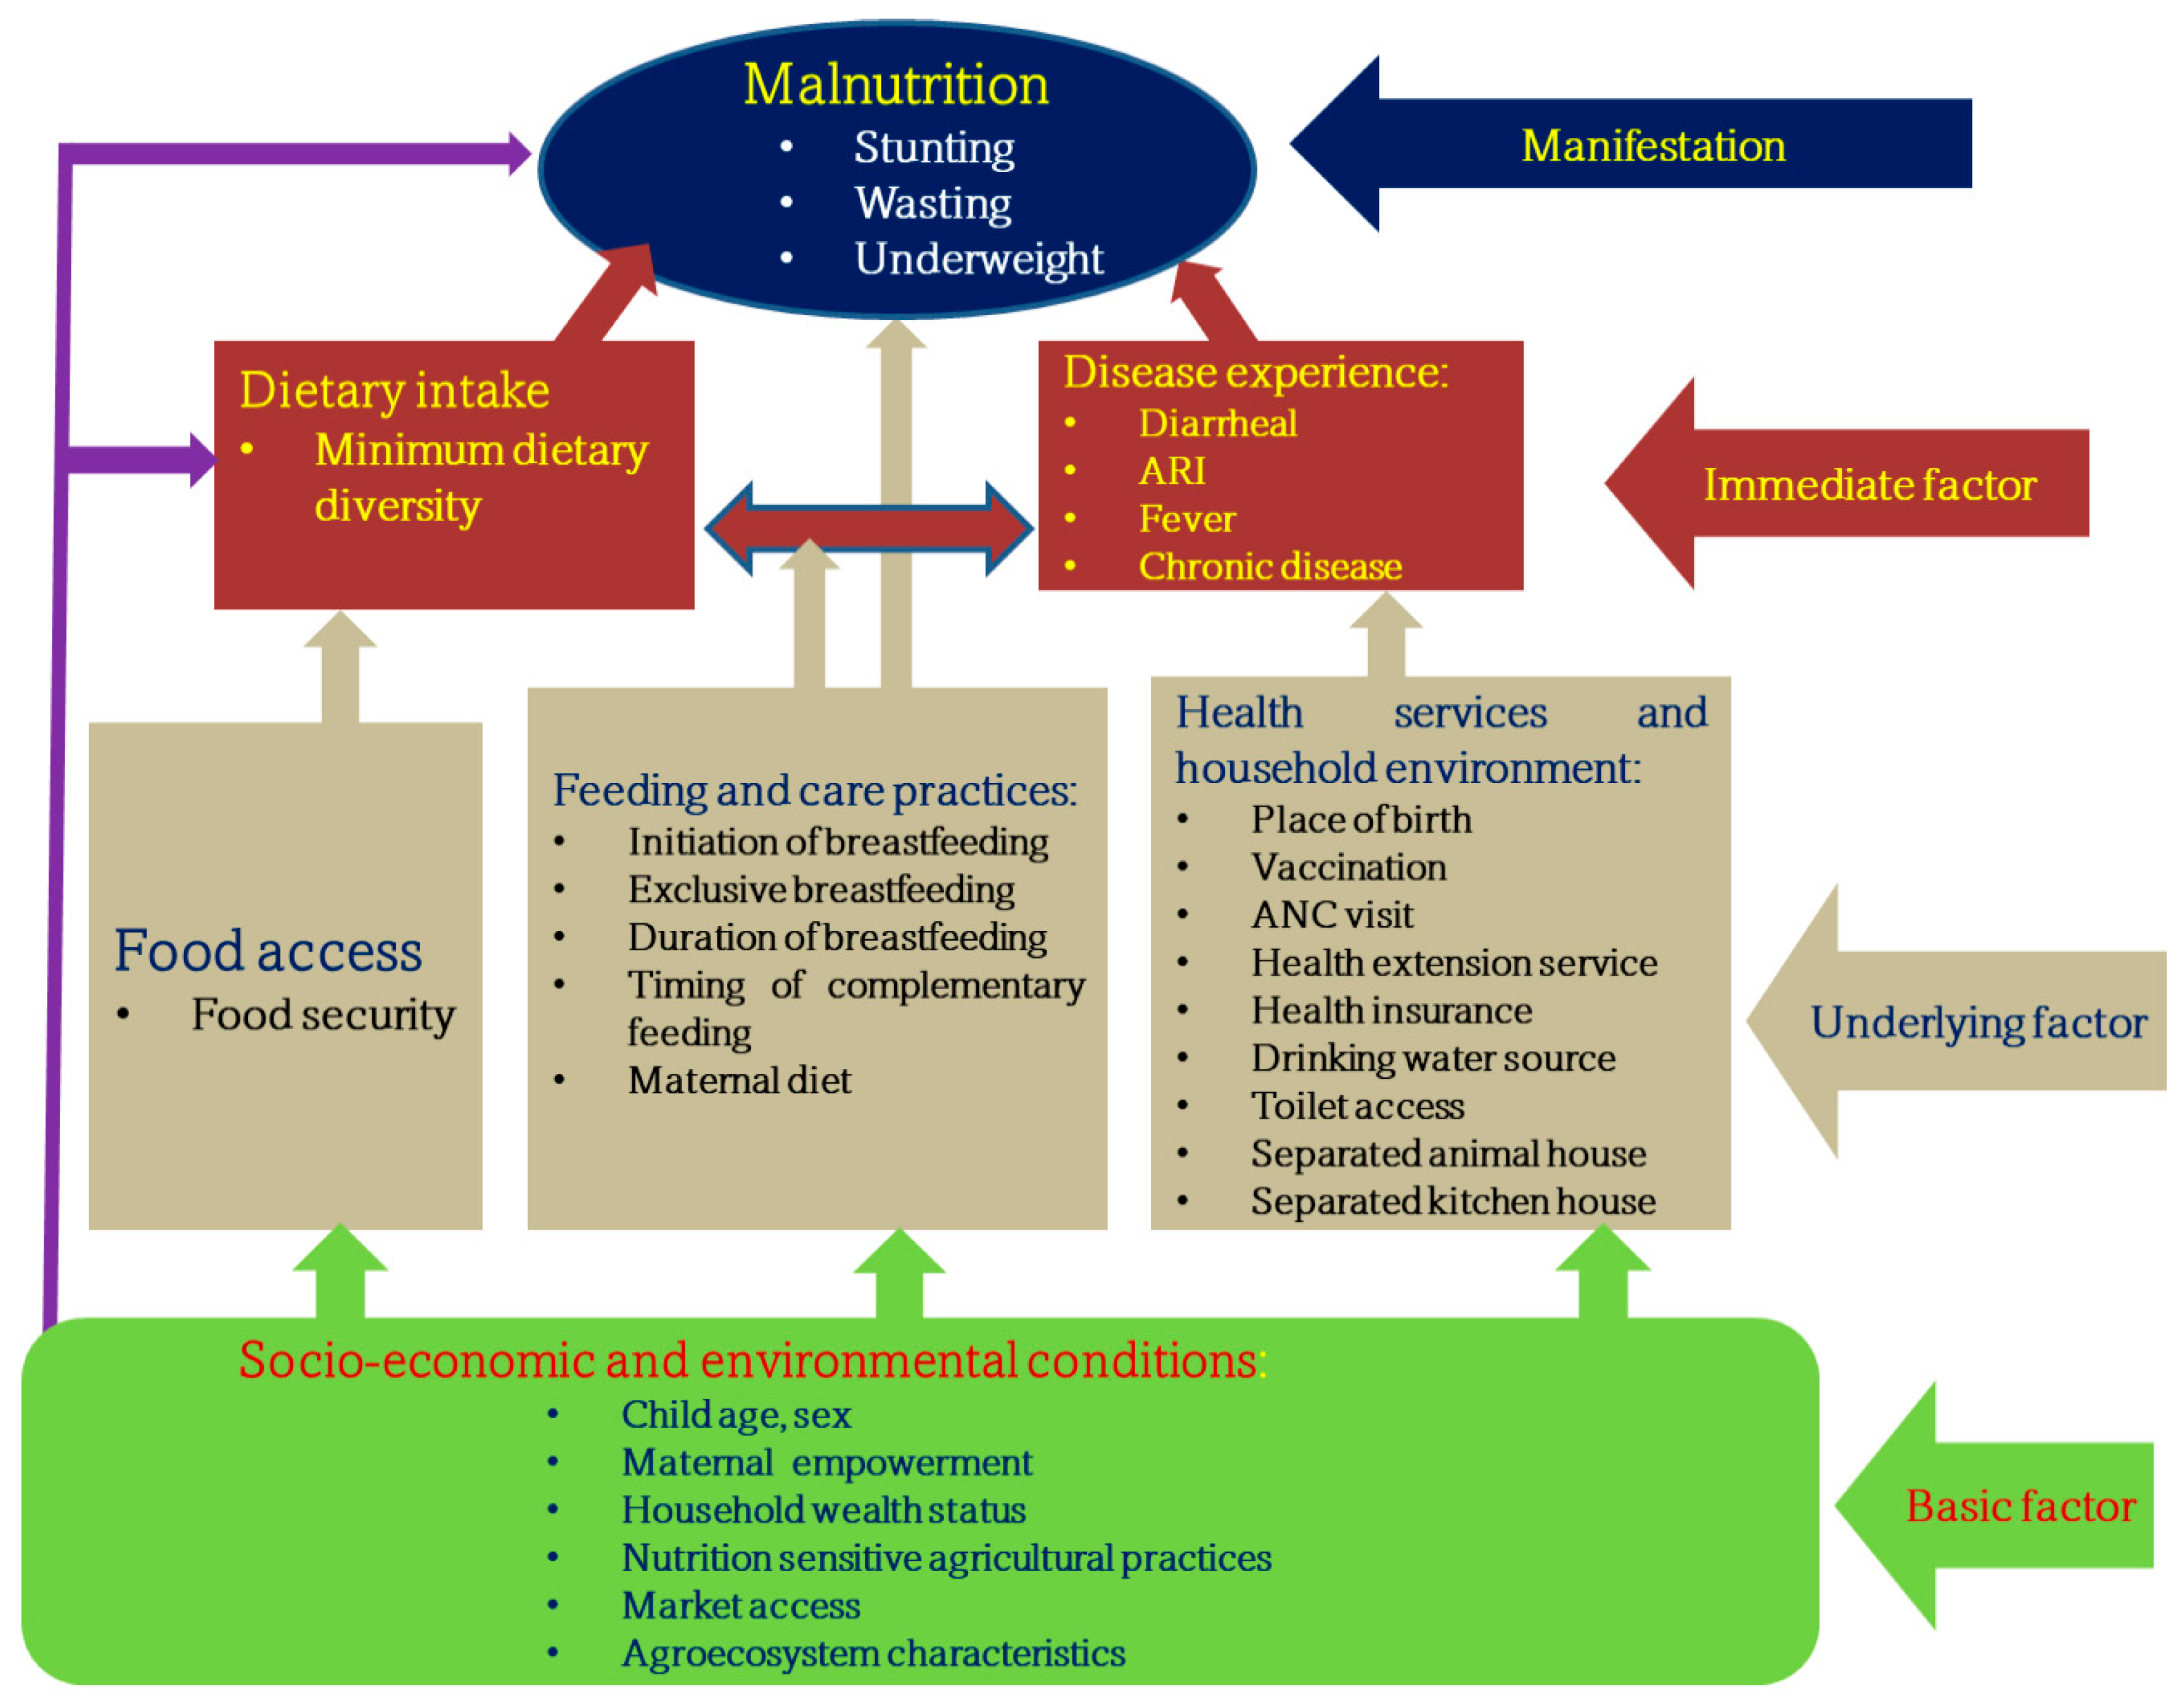
Drawing upon UNICEF’s conceptual framework and prior studies conducted in developing countries [
6,
32,
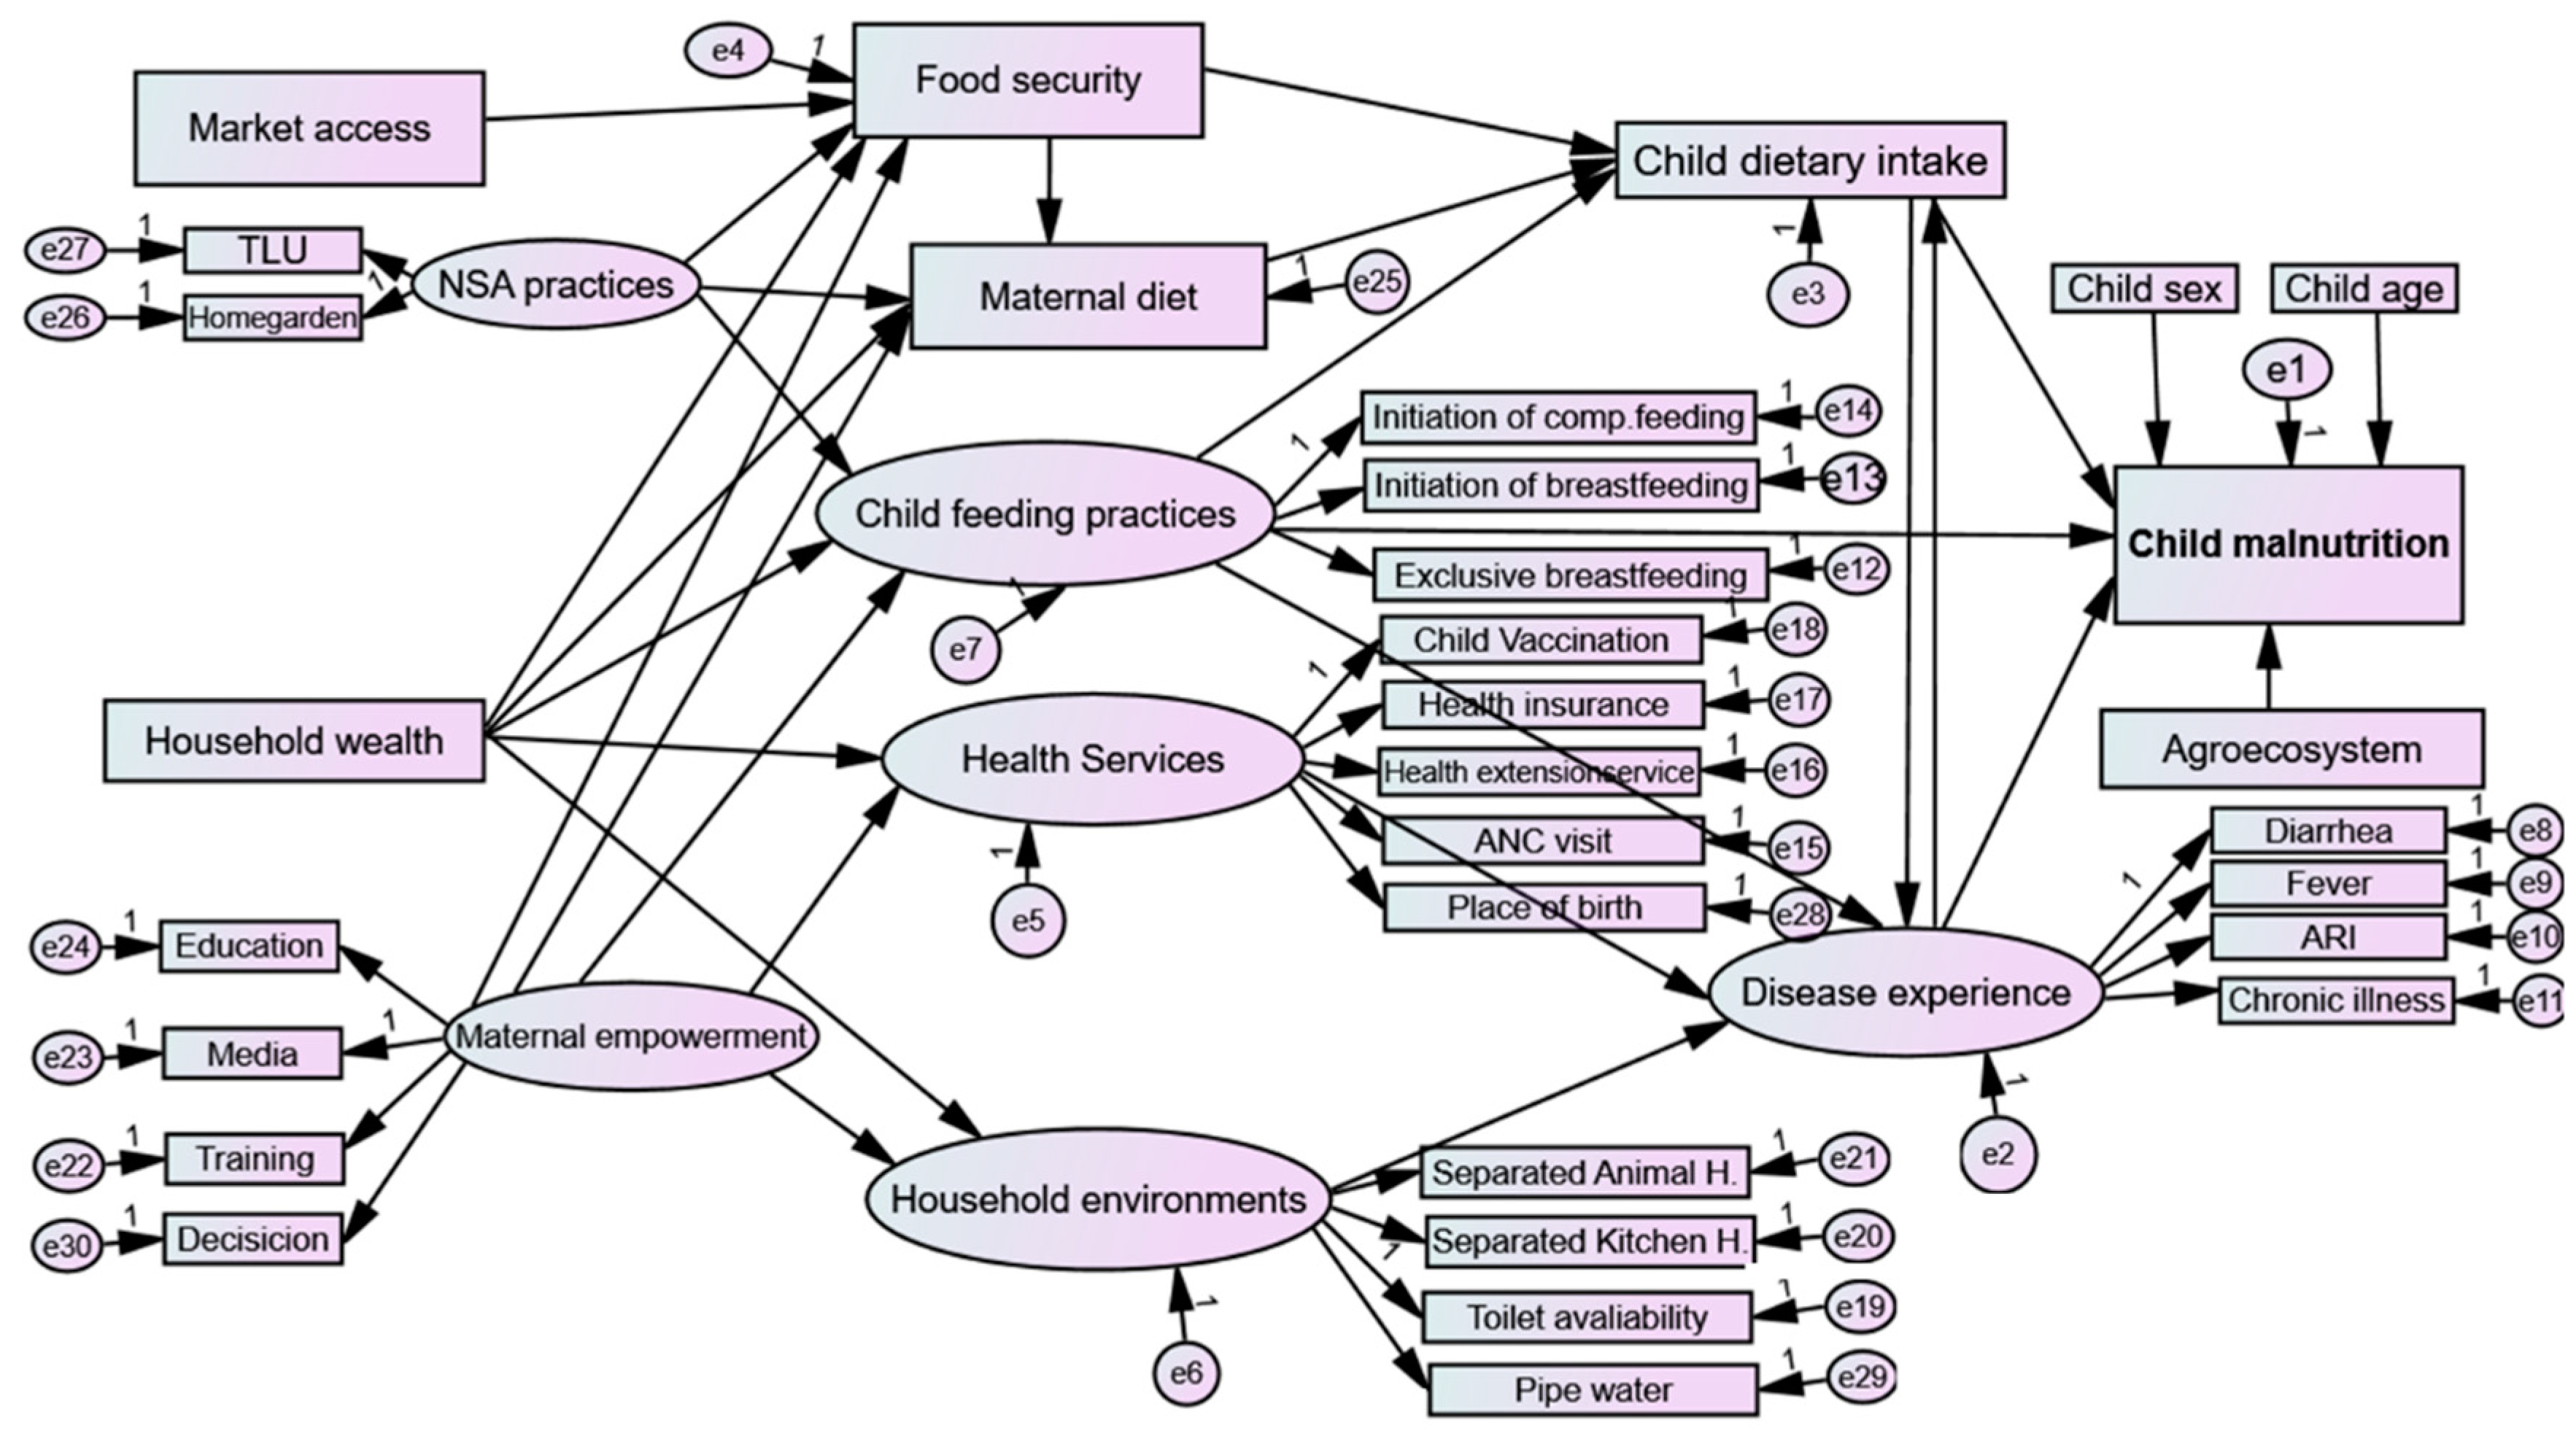
33], this study adapts a conceptual framework tailored towards the Ethiopian context. The framework delineates the determinants and consequences of child malnutrition, operating across multiple levels of causation, from broad socioeconomic and environmental factors to immediate child-level factors. At its core, the framework distinguishes between basic, underlying, and immediate factors hypothesized to impact child malnutrition directly and indirectly, as shown in
Figure 1. Immediate causes, such as exposure to disease and inadequate dietary intake, are identified as primary instigators of malnutrition in children. However, factors within each child’s household (e.g., insufficient access to food, poor maternal and child feeding practices, inadequate health services, and poor household environment encompassing issues like lack of safe water and sanitation) are recognized as proximal determinants significantly affecting the immediate causes of malnutrition. These household-level determinants represent proximal context indirectly affecting a child’s nutritional status. Beyond the household level, broader social factors encompassing socioeconomic status and environmental conditions are identified as distal causes, exerting their influence by shaping the quality and quantity of the resources available within households. Consequently, factors operating at the societal level are deemed as basic or root causes underlying child malnutrition.
2. Materials and Methods
2.1. Study Area
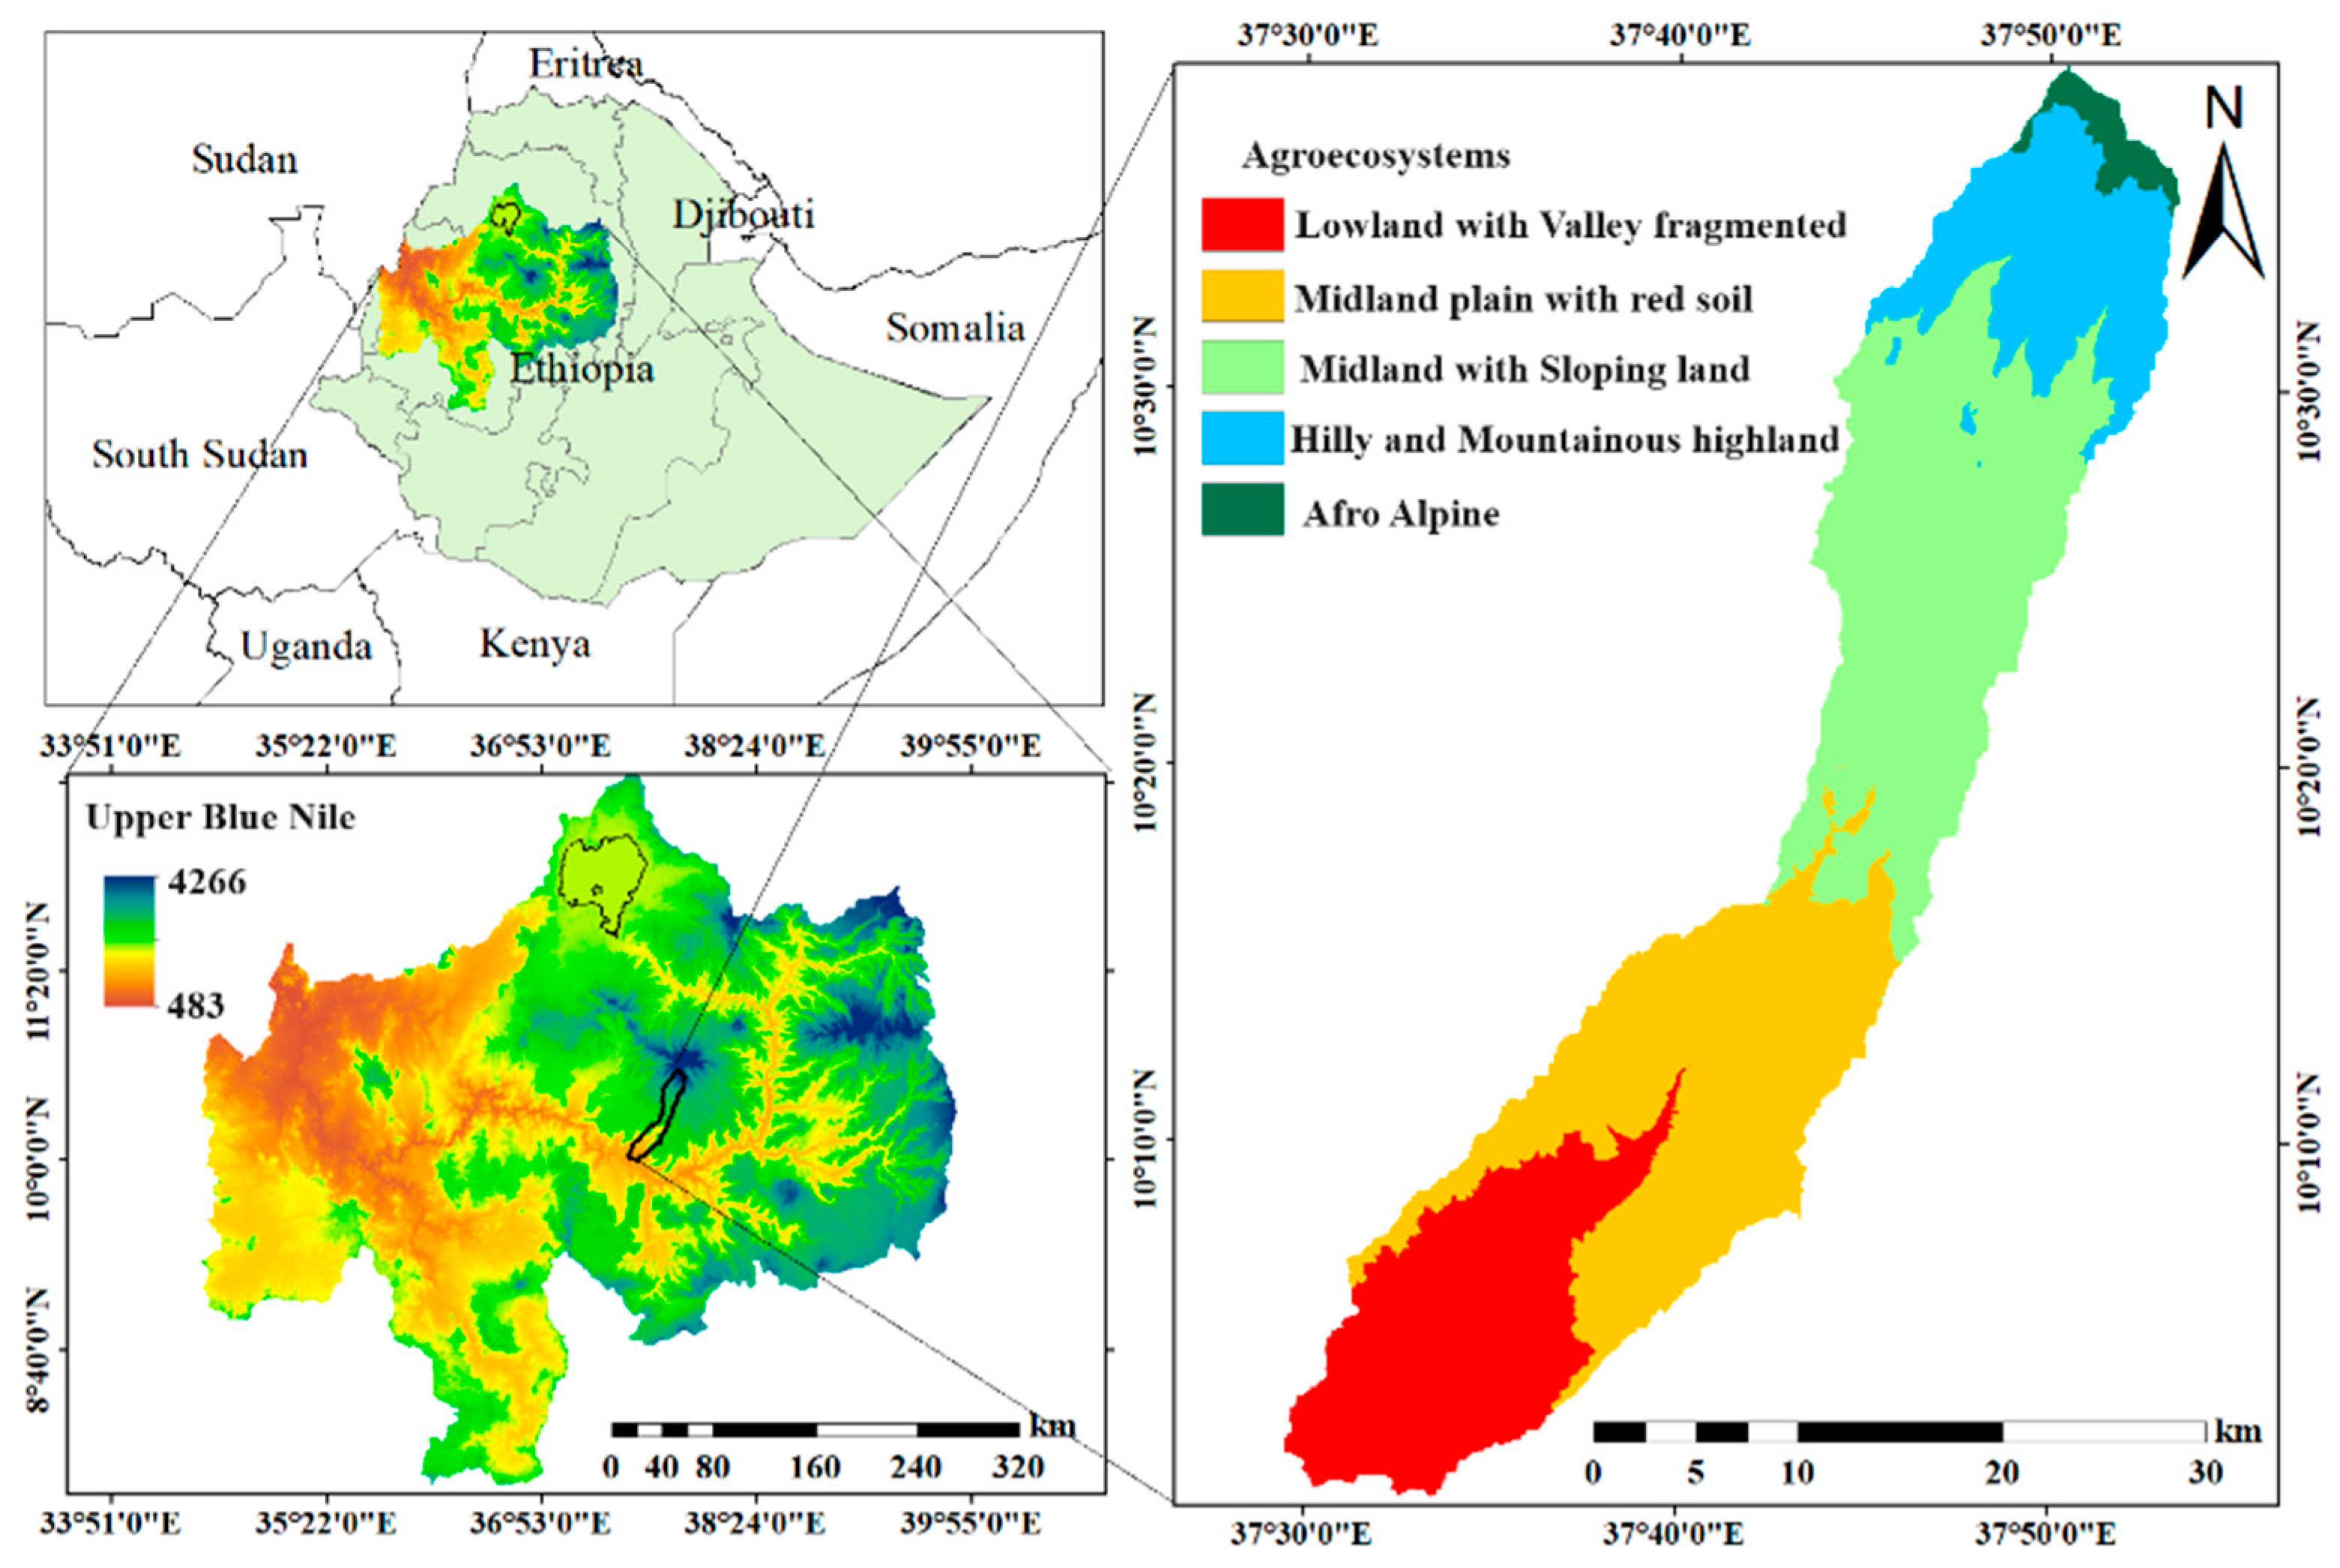
The Chemoga watershed in the northwest part of Ethiopia is located within the Upper Blue Nile Basin (
Figure 2), a region characterized by its diverse topography, ranging from highlands to lowlands. The Chemoga watershed is approximately 300 km northwest of Addis Ababa, the capital of Ethiopia, and covers a considerable land area with varying climatic and ecological conditions. The area is predominantly characterized by contrasting agroecosystems with diverse agricultural practices (
Table 1), with altitudes ranging from 800 m above sea level (asl) in the lowlands and valley fragmented to higher peaks in the hilly and mountainous highlands (4200 m asl). The Chemoga watershed plays a vital role in the hydrology of the region, ultimately contributing to the flow of the Blue Nile River. Human activities, such as crop cultivation, livestock grazing, and settlement, are prevalent throughout the watershed, including along steep slopes, exerting pressure on the natural environment and contributing to land degradation [
34]. Livelihoods in the area primarily rely on a mixed farming system integrating both crop cultivation and the rearing of livestock. Overall, the Chemoga watershed serves as an important ecological and hydrological component of the Upper Blue Nile Basin, playing a crucial role in sustaining local livelihoods and biodiversity.
2.2. Study Design and Sampling Procedures
The present study employed a cross-sectional study design and strategically used a multi-stage sampling method, with agroecosystem typology serving as a key stratification parameter. Initially, the Chemoga watershed was delineated with five distinct agroecosystems that covered three districts, namely Sinan, Gozamin, and Baso Liben. Subsequently, four representative kebeles (the smallest administrative units in Ethiopia, each classified according to their unique agroecosystem characteristics) were randomly chosen from four agroecosystems within three districts in the Chemoga watershed, namely Sinan (AEZ-3, AEZ-4), Gozamin (AEZ-1, AEZ-2), and Baso Liben (AEZ-1, AEZ-2). Since there are no human settlements within the afro-alpine agroecosystem (AEZ-5), it has been excluded from the sample selection process. In collaboration with local health extension workers, households with children aged <5 years were identified in the selected kebeles using the health post’s records as the sampling frame. Then, using a systematic random sampling approach, child–mother pairs were selected, with sample sizes allocated proportionately based on the number of children aged <5 years in each of the kebele. In cases where an individual mother had more than one child aged <5 years, one child was randomly selected for inclusion in the study.
The determination of the sample size adhered to the established formula for a single population proportion, ensuring appropriateness and rigor in the sampling process:
where
n is the required sample size,
Zα/2 is the upper point of α/2 (which has a value of 1.96 in the standard normal distribution with a 95% confidence level), p is the prevalence of the outcome of interest and was assumed to be 50% because there have been no previous studies in the area, q is calculated as (1−p), and d is the desired precision (5%). To achieve the desired precision level, a 5% non-response rate was considered. Finally, the study included 404 pairs of children aged <5 years along with their mothers.
2.3. Data Collection Methods
The study used a detailed household survey and anthropometric assessments involving 404 children aged <5 years with their mothers. The survey was conducted in June and July 2023. Data were collected through semi-structured questionnaires and anthropometric measurements. This was complemented with a focus group discussion and key informant interviews. The survey covered comprehensive information at various levels (child, maternal, household, and community), encompassing data on socioeconomic conditions, food security, dietary diversity, and relevant agricultural practices. The survey was administered by trained health and agricultural extension workers who were well acquainted with the sampled kebeles. The survey was closely supervised by the first author (BYW). To facilitate smooth administration, data collectors underwent a day-long training session. The survey was enriched with insights from key informant interviews, involving health and agricultural extension workers, alongside field observations.
2.4. Data Measurement
2.4.1. Food Security
Food security status was assessed using the Household Food Insecurity Access Scale (HFIAS), a validated tool used in various developing countries [
36]. This tool consists of nine standard generic questions addressing a household’s experiences over the past month across three domains of food insecurity: (i) anxiety and uncertainty regarding food availability, including worries about whether the household would have enough to eat; (ii) limitations in the variety and preferences of food accessed; and (iii) insufficient food intake in terms of meal sizes and their frequencies.
2.4.2. Dietary Diversity
Each child’s mother was asked about the foods that she and her child had eaten and the beverages they had consumed in the past 24 h. This study used the Food and Agriculture Organization of the United Nations (FAO) guideline, which measures dietary diversity across seven food groups for children and ten food groups for women (WDDS). Dietary diversity scores (DDSs) for children and women were calculated by summing the number of food groups consumed in the 24 h prior to the survey [
37,
38].
2.4.3. Anthropometric Measurements
Anthropometric data were obtained by measuring children’s weight and height. Weight measurements in children were obtained without footwear and with minimal clothing, using the recommended UNICEF weighing scale to the nearest 0.1 kg. In cases where children refused to be weighed, their mothers would carry them and stand on the scale; the child’s weight was then determined by subtracting the mother’s weight from the combined weight of the mother and child. Scales were calibrated before weighing each child using a fixed 2 kg mass. For children who could stand independently, height was measured, without footwear, to the nearest 0.1 cm using a standard calibrated standing height board. Children were positioned against the standing board, ensuring that five body parts (heels, bat, buttocks, shoulders, and back of the head) touched the board. A measuring tape was fixed to the board, and the child stood with their head comfortably erect, aligning the lower border of the eye’s orbit with the external canal of the ear. Measurements were taken using a horizontally held thin wooden board by touching the top of the head. For children who could not stand independently, length measurements were taken to the nearest 0.1 cm by using a length board fixed with measuring tape and equipped with a headpiece and elongated foot piece. During the measurement, the child’s head touched the headpiece, and their heels were in contact with the foot piece. The hands remained relaxed throughout the measuring process. For each child, three consecutive measurements of weight and height/length were obtained, with the average of the three measurements used in the final analysis. The age of the child, in months, was determined from the date of birth (as reported by the mother) to the day of data collection.
2.5. Data Quality Assurance
Data quality was ensured through a meticulous design of the questionnaire and data collection process. Data collectors and supervisors underwent training on both data collection procedures and ethical considerations. A pre-test survey was conducted on 5% of households with similar backgrounds outside the targeted watershed to validate and tailor the questionnaire to local conditions. This iterative process validated the questionnaire and allowed for the customization of instruments. Supervisors checked on a daily basis to ensure completeness and consistency. In addition, the principal investigator (BYW) monitored the overall quality of the data collection as well as thorough entry, and proper management of all the data before the final analysis.
2.6. Data Management and Analysis
Data were managed using SPSS version 28 (IBM Inc., Armonk, NY, USA). The data were then exported to Stata version 17 (Stata Corp, College Station, TX, USA) for further analysis by a combination of descriptive (percentage, mean, standard deviation [SD]) and inferential (chi-squared test,
t-test, one-way analysis of variance [ANOVA]) statistics. The study primarily used SEM to measure the direct and indirect effects of risk factors on child malnutrition using SPSS AMOS version 29. In addition, a logistic regression model was used to analyze the direct influence of immediate factors only on child malnutrition. A household’s wealth index was computed through principal component analysis based on the main assets owned by the households (as shown in the
Supplementary Materials). Standard deviation for the Z-score was computed for height-for-age, weight-for-age, and weight-for-height indices by comparison against the median of the World Health Organization (WHO) standards using the Emergency Nutrition Assessment (ENA) and WHO Anthro plus version 1.0.4 software.
2.7. Structural Equation Modeling
The hierarchical, complex, and interconnected nature of the determinants associated with child malnutrition requires a model that is capable of incorporating and estimating a set of equations simultaneously. This study used the SEM model, considering multiple levels (basic, underlying, immediate), with each level representing variables influencing one another that are treated as a dependent or response variable, as shown in the conceptual framework (
Figure 1). SEM combines the statistical elements of multiple regression, confirmatory factor analysis, and path analysis [
39]. This analysis was performed using AMOS version 29 software. It examines complex models with both measured and unmeasured variables (latent variables), allowing for the inclusion of endogenous, exogenous, and mediator variables. Unlike path analysis, SEM entertains latent variables alongside observed variables [
39]. Mediation analysis was performed to predict the indirect effect of determinants on child malnutrition. In the context of the SEM framework, mediation is categorized as either full or partial [
40]. Mediators can further be classified as single or multiple, single when only one variable lies in the causal pathway between exogenous and endogenous variables, and multiple when more than one mediator operates concurrently at the same stage in the structural model (termed “serial” or “sequential” mediation) [
40]. Multigroup SEM analysis was conducted to estimate the effects on the structural model across different groups, offering insights into possible variations in relationships among variables across these groups.
SEM has two parts: a measurement model and a structure model. In the present study, model fitness for both models was determined using the goodness-of-fit index (GFI), comparative fit index (CFI), root mean square error of approximation (RMSEA), and standardized root mean squared residual (SRMR) [
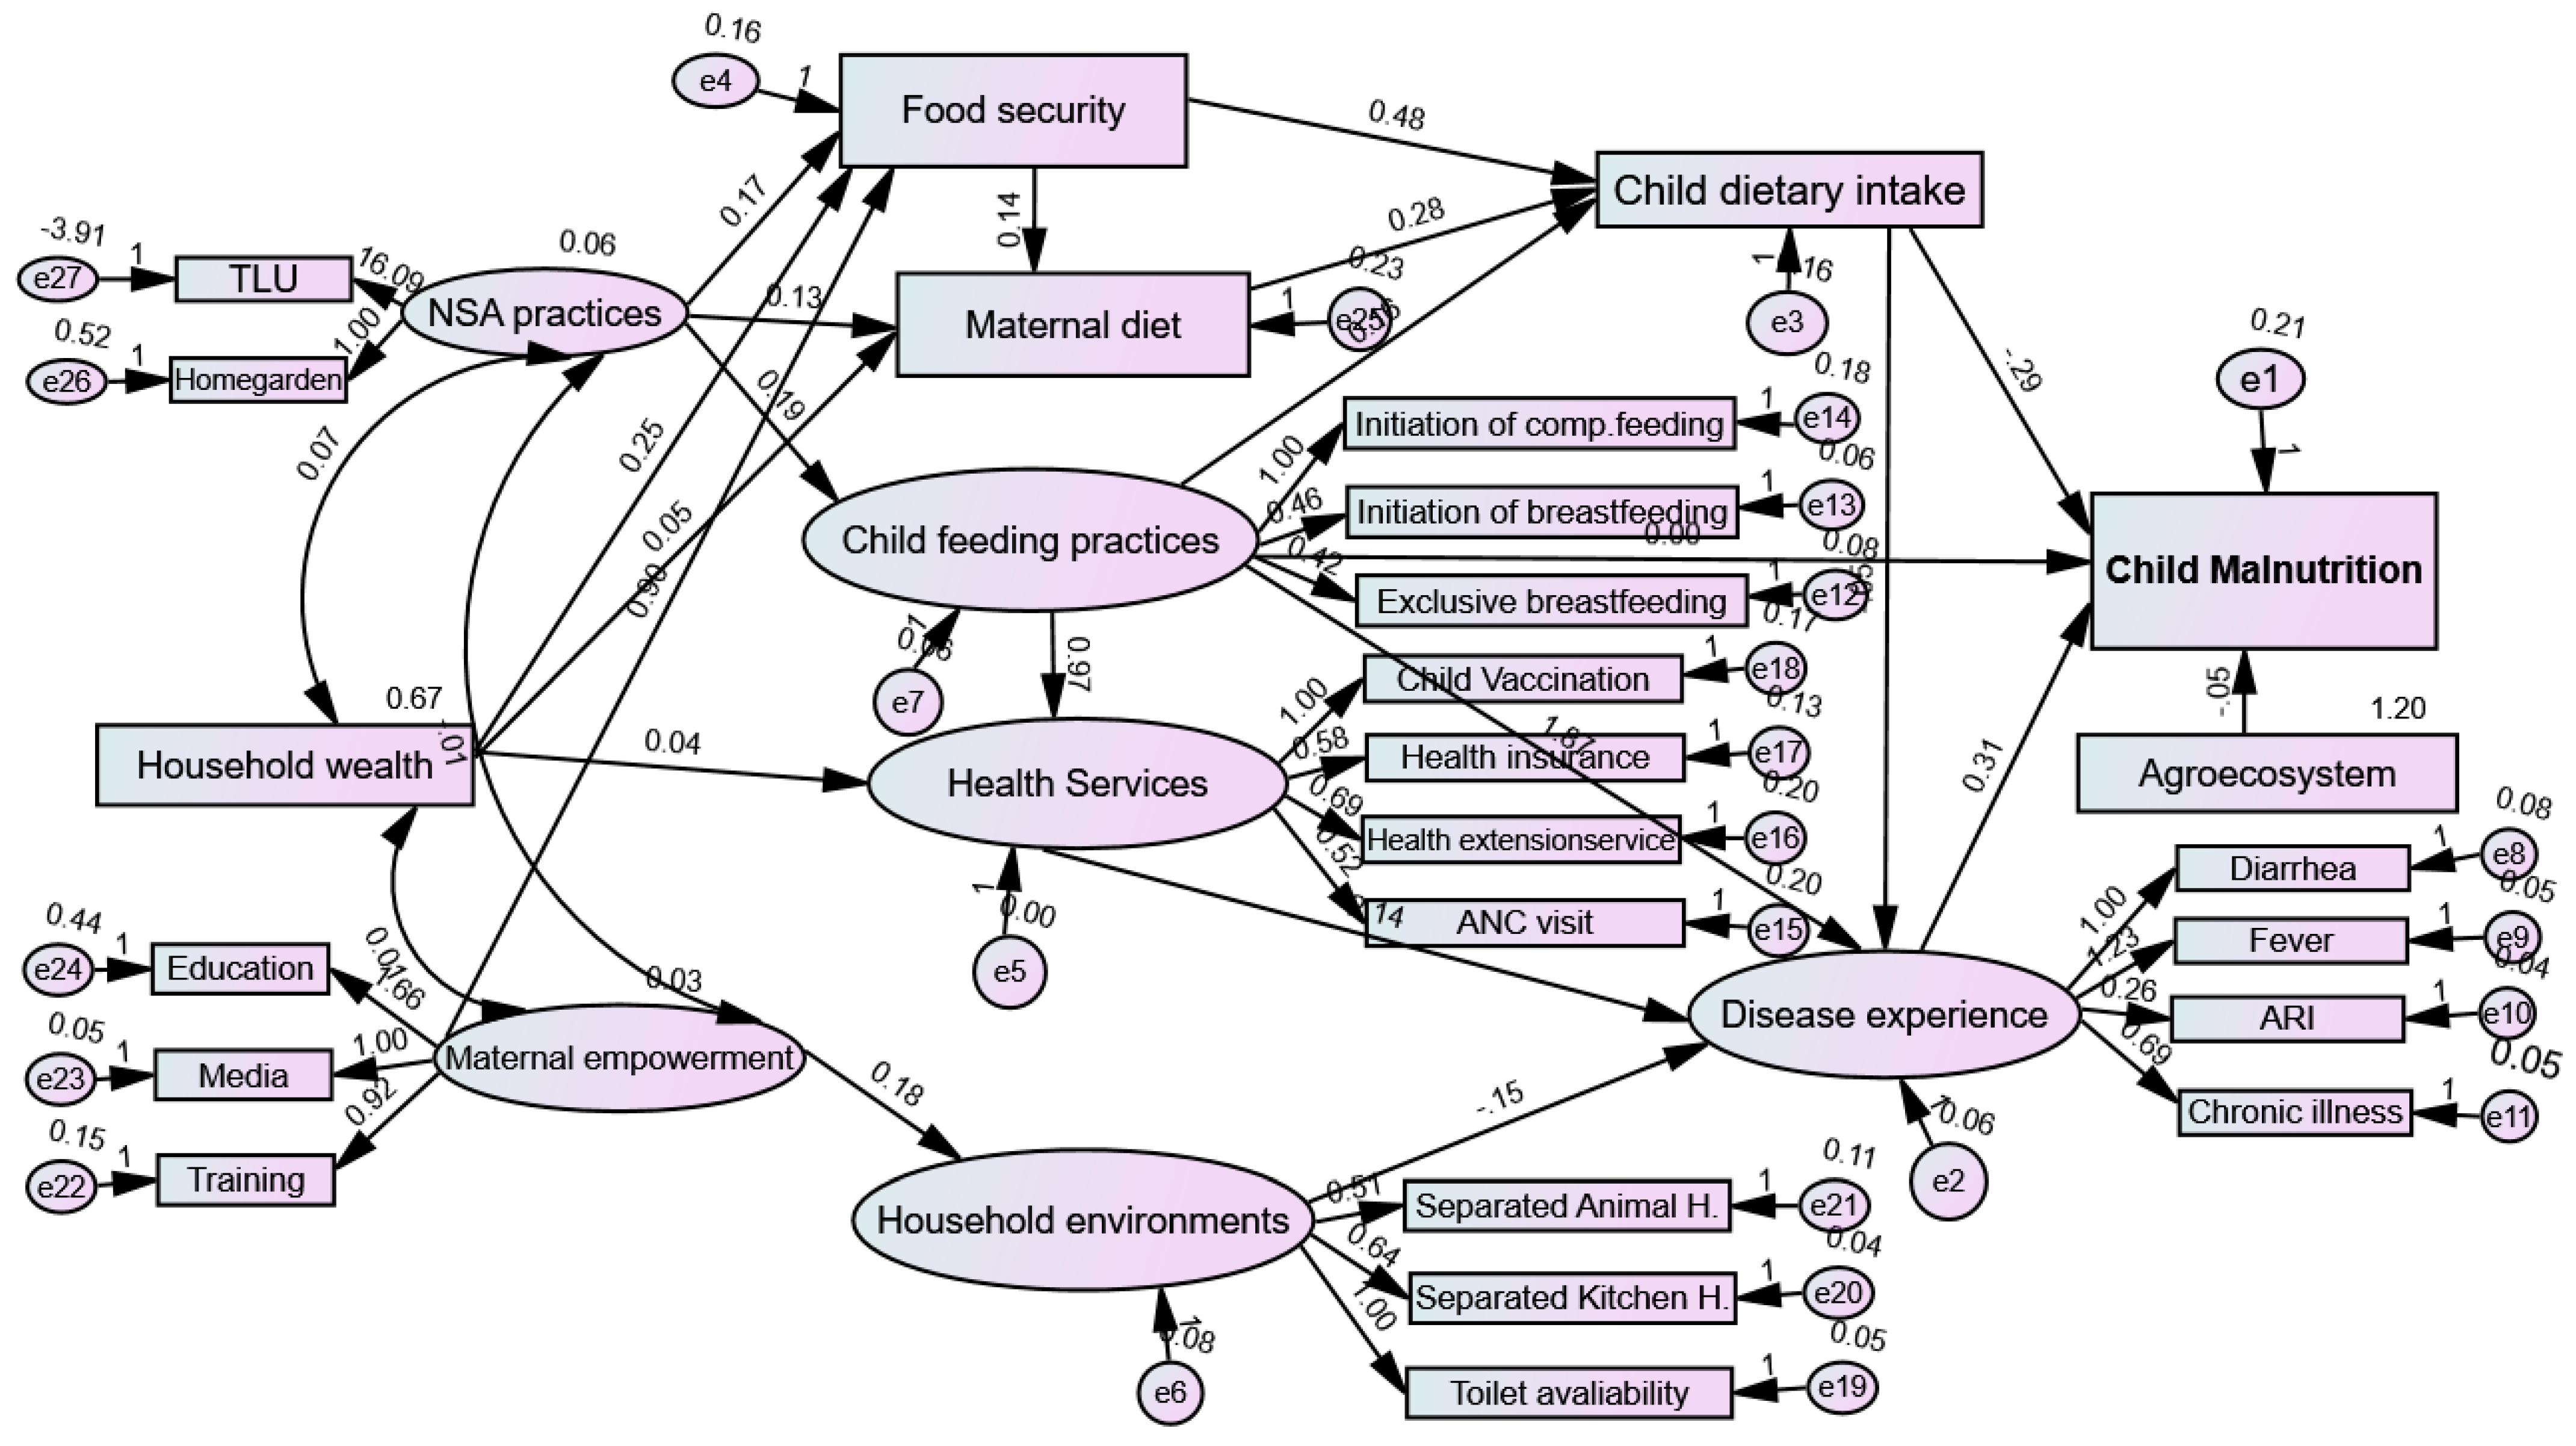
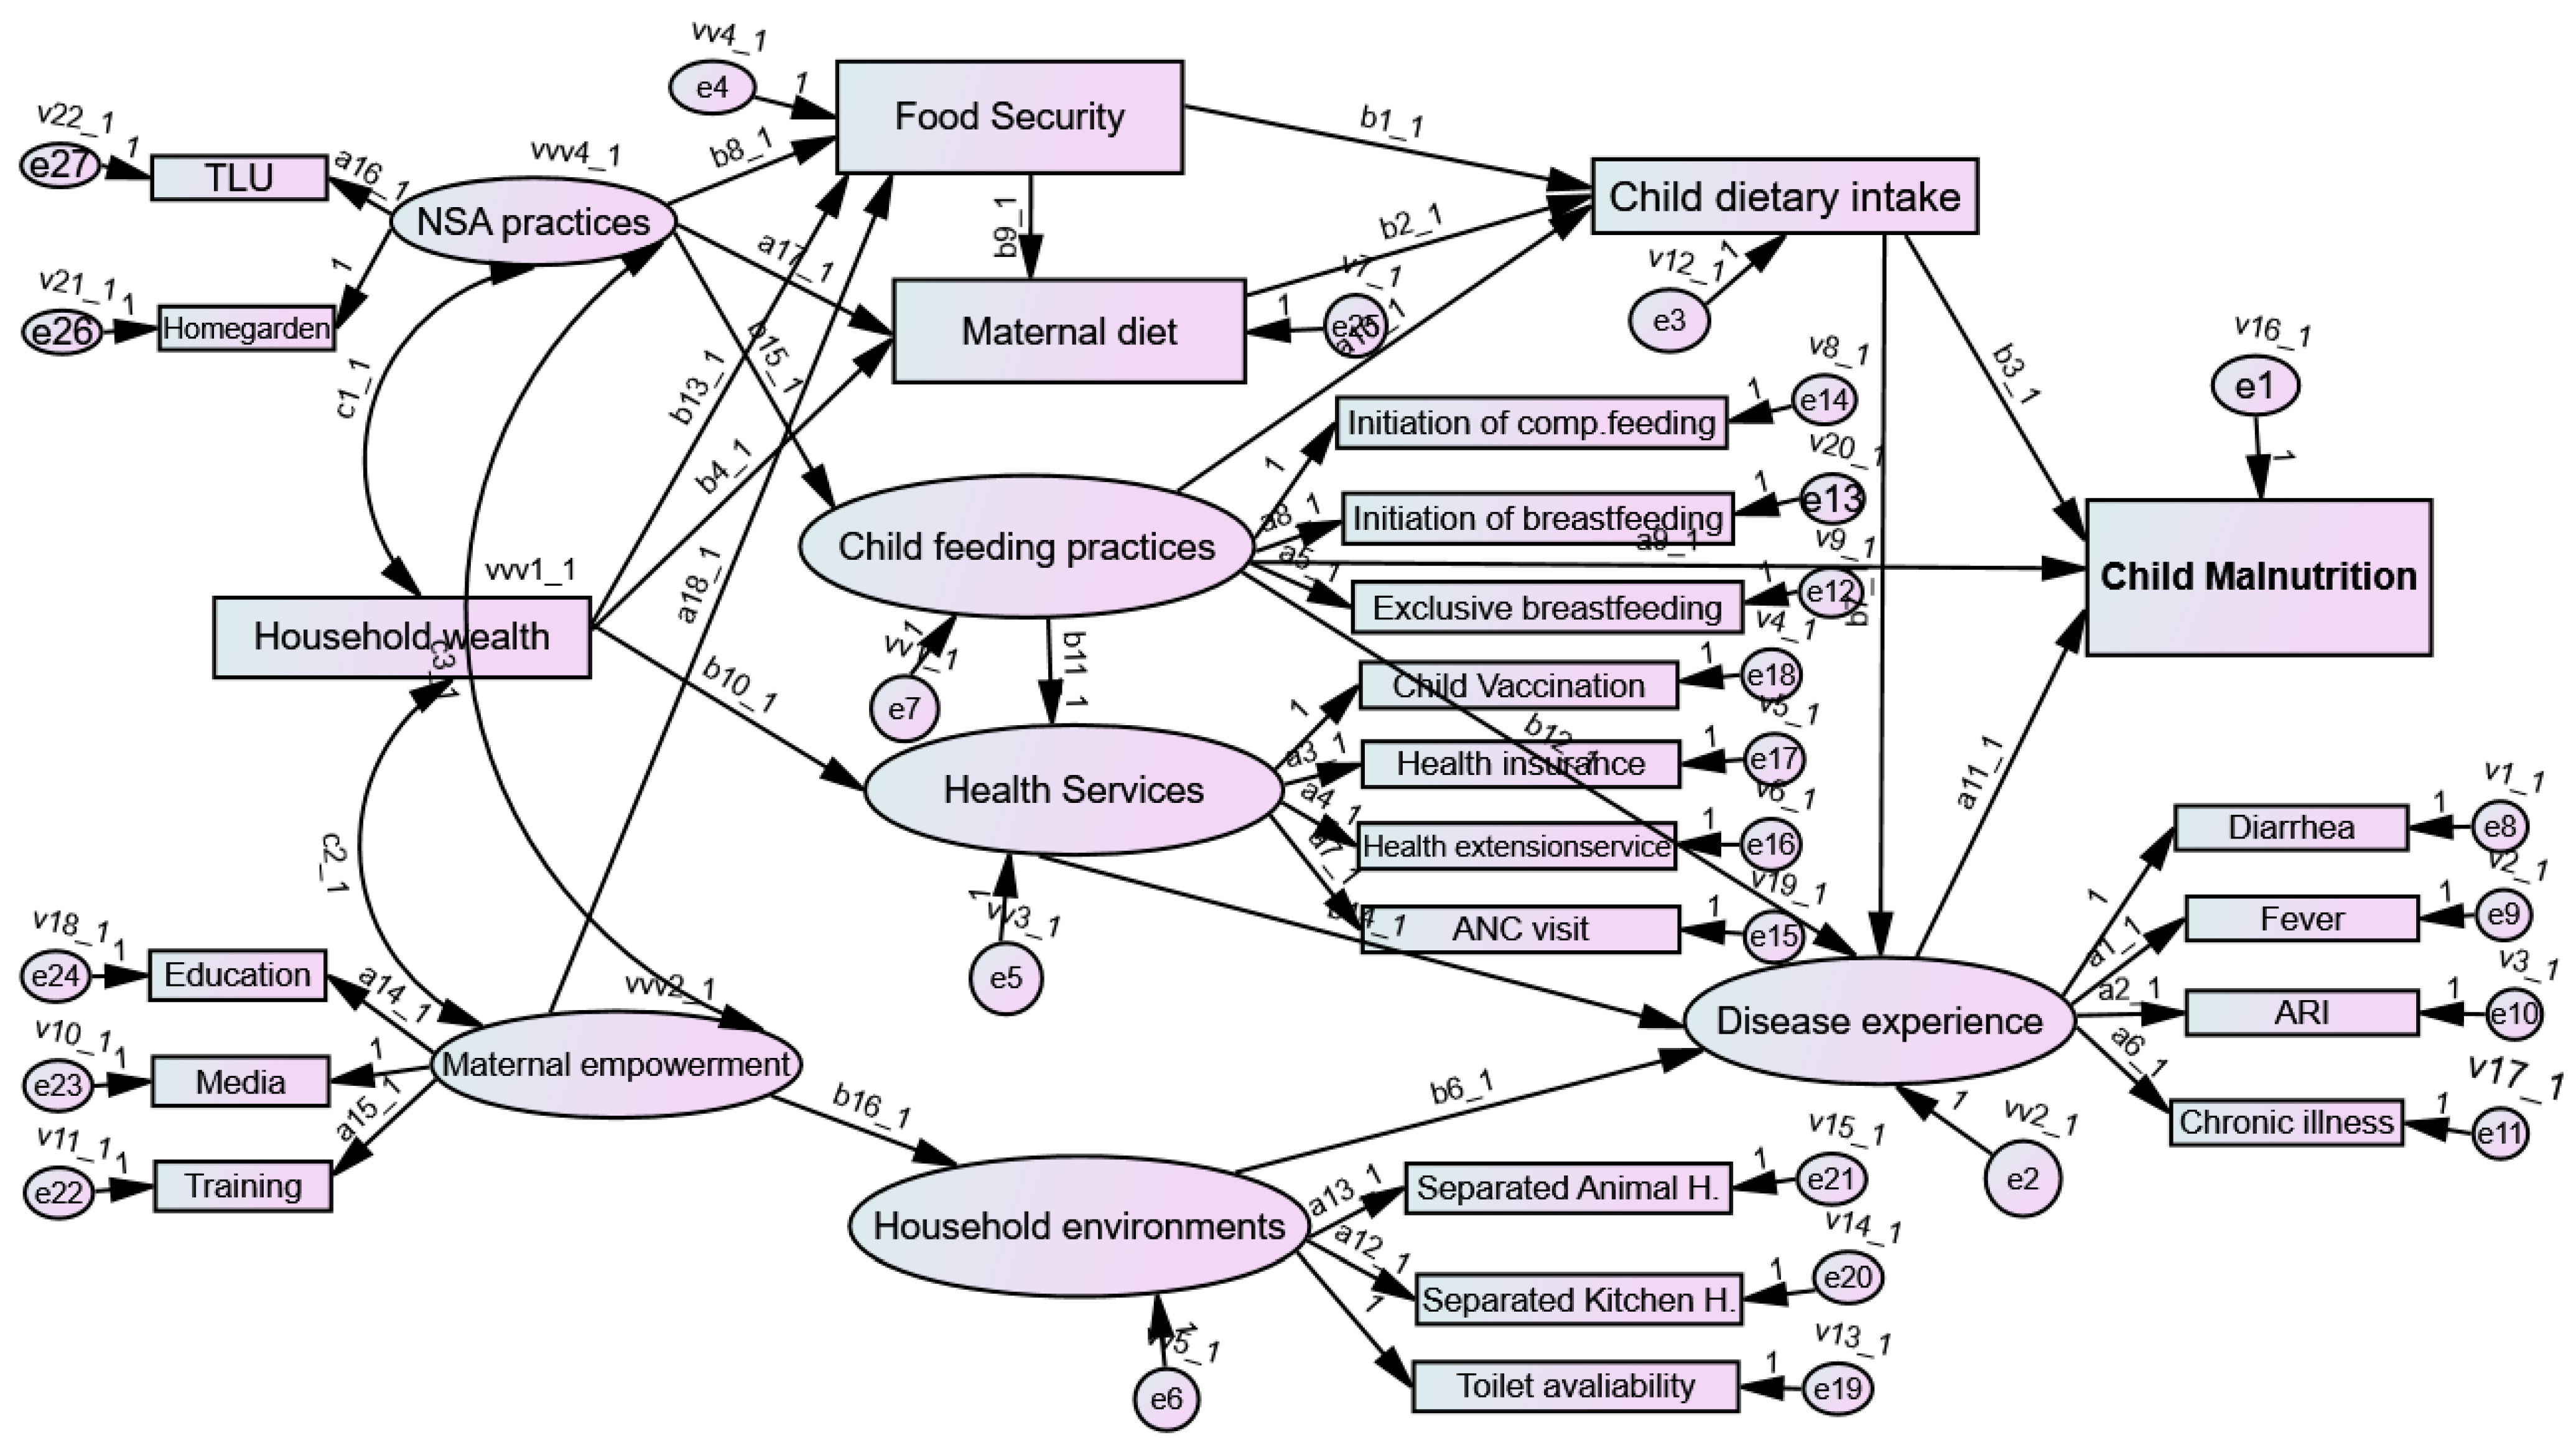
41]. Before running SEM, confirmatory factor analysis was performed to verify the model’s fit by excluding items with low factor loading. The measurement model was validated through reliability and validity assessments prior to the evaluation of causal relationships among variables in the structural model. The reliability test reflects the internal consistency of the observed variables through composite reliability, whereas validity examines the extent to which the indicator or a measure accurately reflects its constructs. Therefore, construct reliability and validity were determined using composite reliability (CR) and average variance extracted (AVE). The maximum likelihood estimation procedure was used in the model analysis. The estimation of the indirect effects used the product-of-coefficients test, whereas total effects were obtained by summing the direct and indirect effects, using bootstrap techniques to determine the level of significance. The Bayesian analysis method addressed missing data with the assumption of missing completely at random. Standardized and unstandardized coefficients, and their exponential (odds ratio), were used to estimate the direct, indirect, and total effects of predictors on child malnutrition. Ultimately, statistical significance was declared when
p< 0.05. Generally, SEM provided a comprehensive analysis of the complex relationships influencing child malnutrition.
2.8. Operational Definitions and Key Variables of The Study
Malnutrition, as conceptualized in this study, encompasses various manifestations of undernutrition, namely stunting, wasting, and underweight. These conditions collectively contribute to a state of malnutrition, which is assessed through the CIAF, categorizing individuals into malnourished and not malnourished groups.
The CIAF represents a comprehensive metric that evaluates malnutrition by combining multiple anthropometric failure indicators, including stunting, wasting, and underweight into a single index. It provides a more holistic measure of nutritional status than individual indicators alone.
The main variables in this study are derived from the UNICEF conceptual framework, with some modification by customization to the Ethiopian context. Therefore, by reviewing the related literature, the key basic, underlying, and immediate factors are identified and included in the final model. For the sake of SEM analysis and interpretation in AMOS software, some multiple categorical measured variables, such as education, vaccination, wealth index, and agroecosystems, were changed to dummy categories (
Table 2).
2.9. Ethical Considerations
Before data collection, ethical approval was obtained from the Department of Rural Development and Agricultural Extension, College of Agriculture and Environmental Sciences, Bahir Dar University. During the survey, an official letter was sent to all districts to obtain permission for data collection. Verbal consent was obtained from all study participants before the commencement of the data collection. The data obtained from each study participant was kept confidential.
4. Discussion
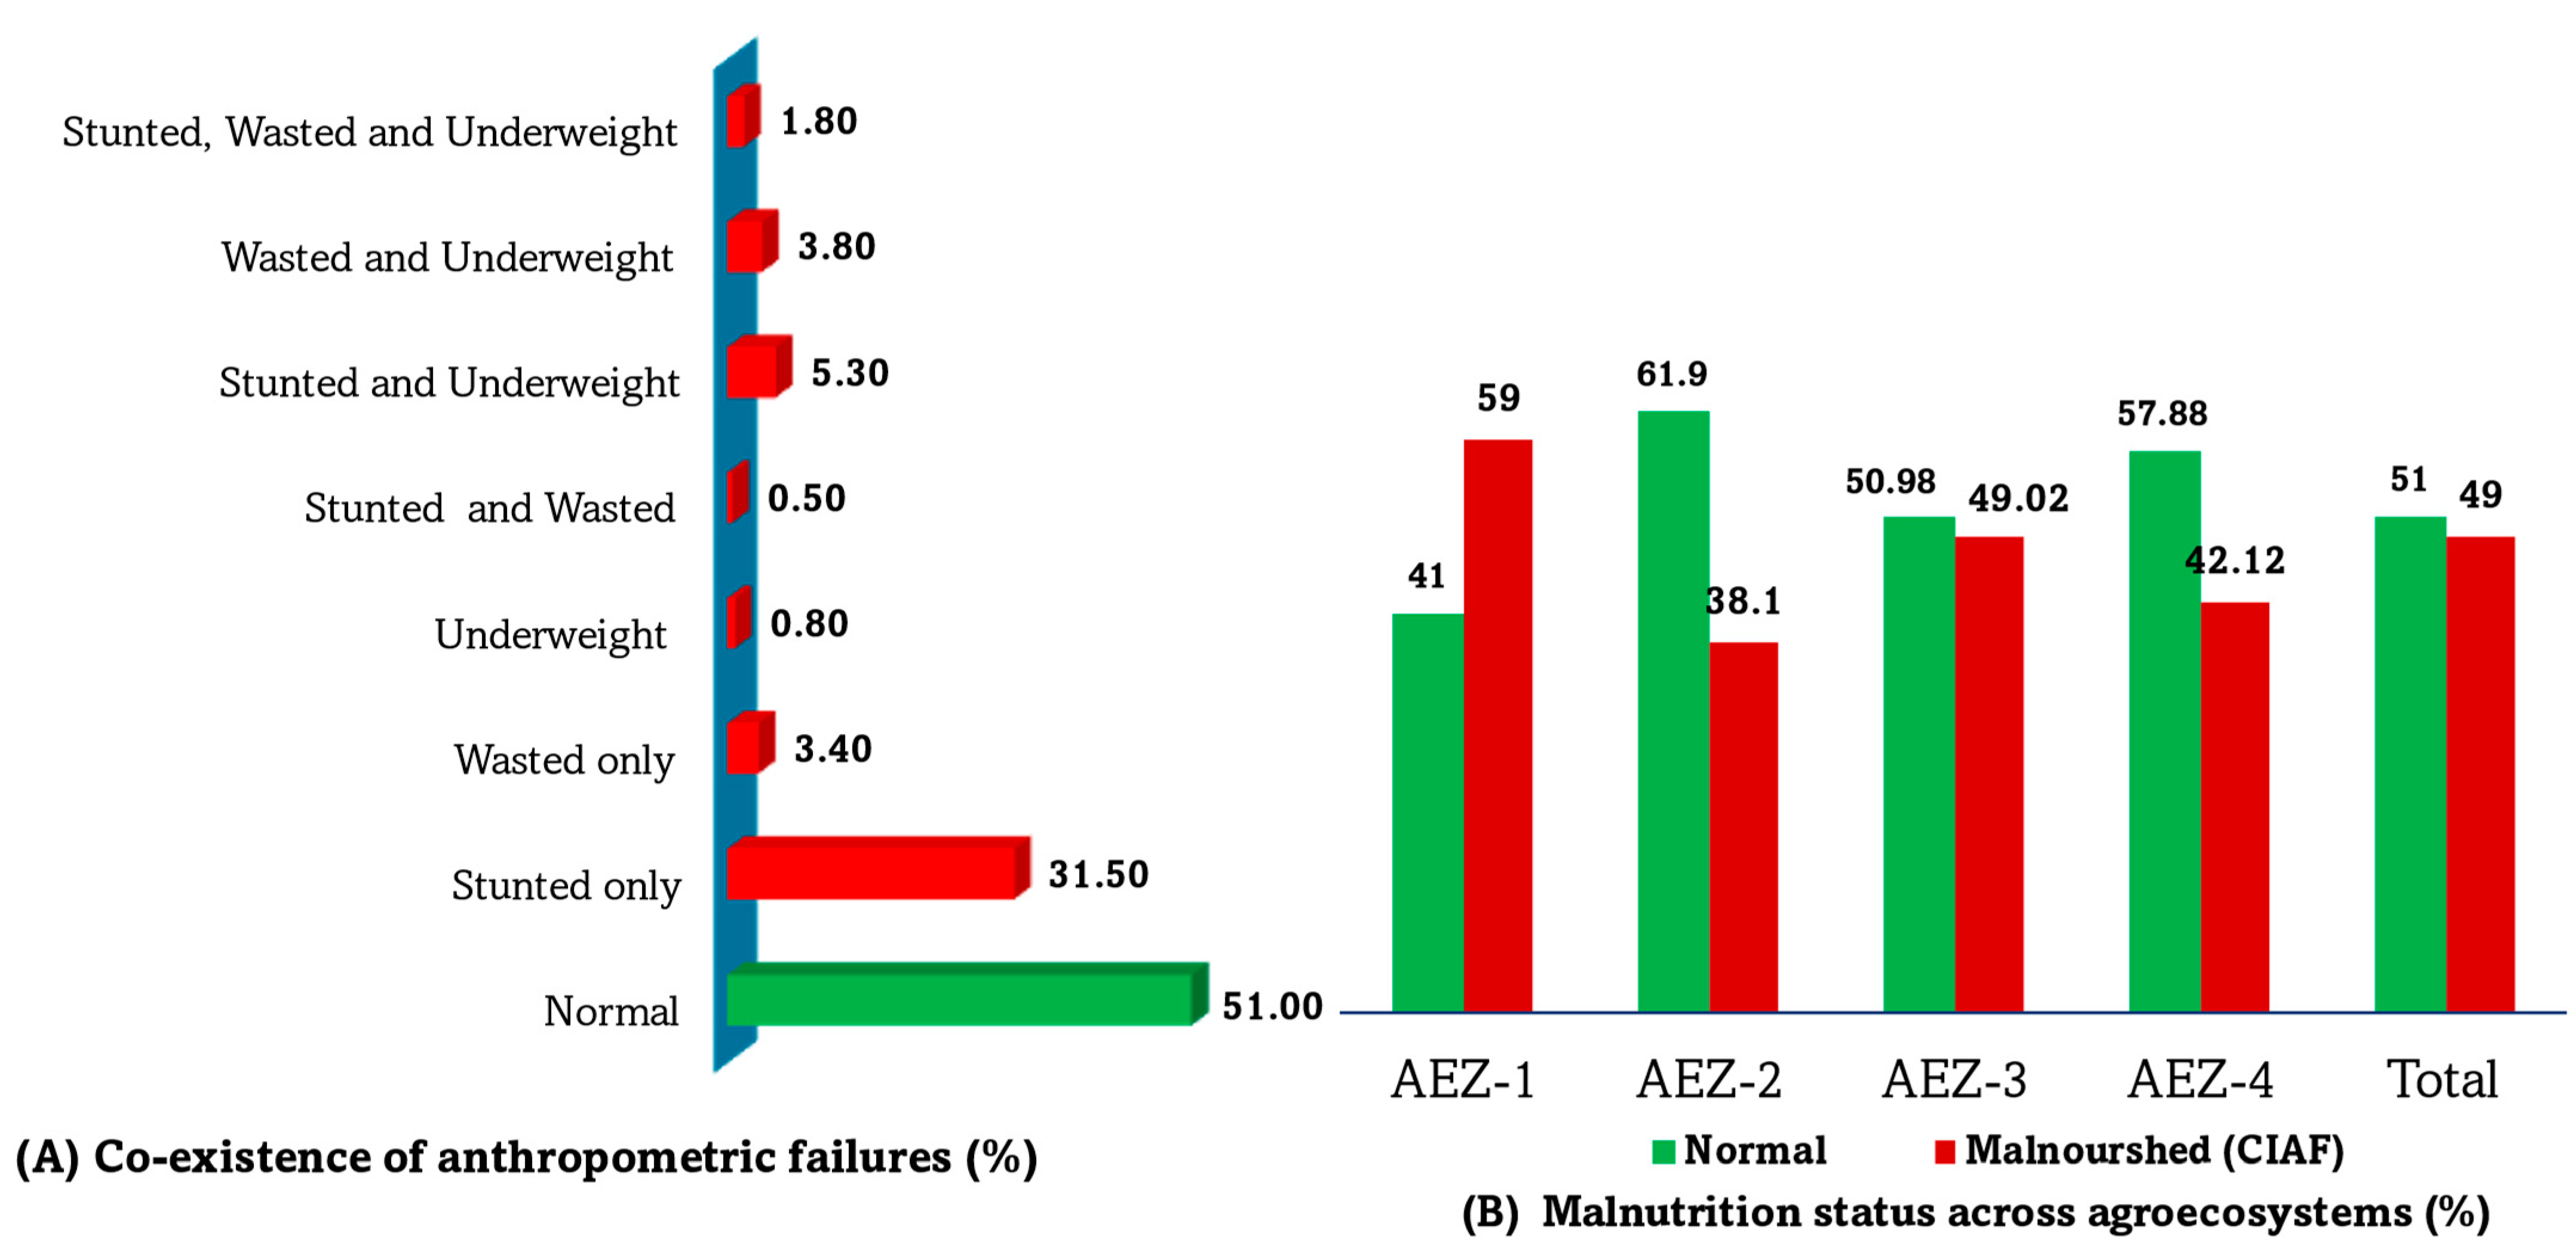
In this study, we investigated the prevalence of child malnutrition. Among children aged <5 years in this study, approximately 39% were stunted (i.e., short stature for their age). This figure aligns closely with the national prevalence of stunting reported in the latest EDHS of 38%. However, it is of note that the prevalence of stunting in this study was slightly lower than that reported specifically for the Amhara region of 46% [
3]. The difference between our findings and those for the Amhara region could be attributed to the wider geographical coverage of the latter, encompassing significant spatial variations in the environment and agricultural productivity. Such discrepancies in environmental conditions and agricultural productivity may give rise to diverse socioeconomic conditions, which, in turn, could influence the prevalence of child malnutrition. The prevalence of wasting and underweight in this study was lower than the national averages reported in the EDHS of 10% and 24%, respectively [
3], as well as lower than those reported for the Tigray region of northern Ethiopia [
42]. These findings suggest that stunting, representing a chronic form of malnutrition, is the predominant anthropometric failure affecting children in the Chemoga watershed.
In addition, we found a high prevalence of CIAF in this study, with approximately half the children experiencing some form of anthropometric failure. The prevalence of CIAF surpassed that of single conventional indices of anthropometric failure, such as stunting, wasting, and underweight. Significant variations in the prevalence of CIAF were observed across the four AEZs in the study. The highest prevalence of CIAF was reported in the lowland and valley fragmented agroecosystem (AEZ-1), whereas the lowest was recorded among children from AEZ-2 (midland with red soil). The higher prevalence of child malnutrition in AEZ-1 is consistent with findings reported previously [
9,
24,
43,
44,
45], and it may be due to unfavorable agroecosystem conditions, resulting in lower agricultural productivity and weak socio-economic status. Of note, a lower proportion of children from the hilly and mountainous highland agroecosystem (AEZ-4) were malnourished. This could be attributed to their dietary practices, characterized by the high consumption of potatoes, which are high in calories, as a staple food. Moreover, the environmental advantages of cold temperatures in AEZ-4 may contribute to the maintenance of better health conditions among children, as suggested by previous studies [
20,
46]. However, this stands in stark contrast to the lower prevalence reported in AEZ-4 in previous studies [
24,
44], underscoring the complex interplay among environmental factors, dietary practices, and nutritional outcomes across different AEZs. A possible reason for the apparent discrepancy could be differences in how children’s nutritional status was assessed: unlike the previous studies, which used a conventional single index of anthropometric failure, we used CIAF in the present study. This finding provides significant insights into specific geographic variations in child malnutrition, offering advantages in identifying the neediest subpopulations and allocating scare resources for further nutrition-sensitive and nutrition-specific interventions not only in the study area, but also in other similar environments [
8].
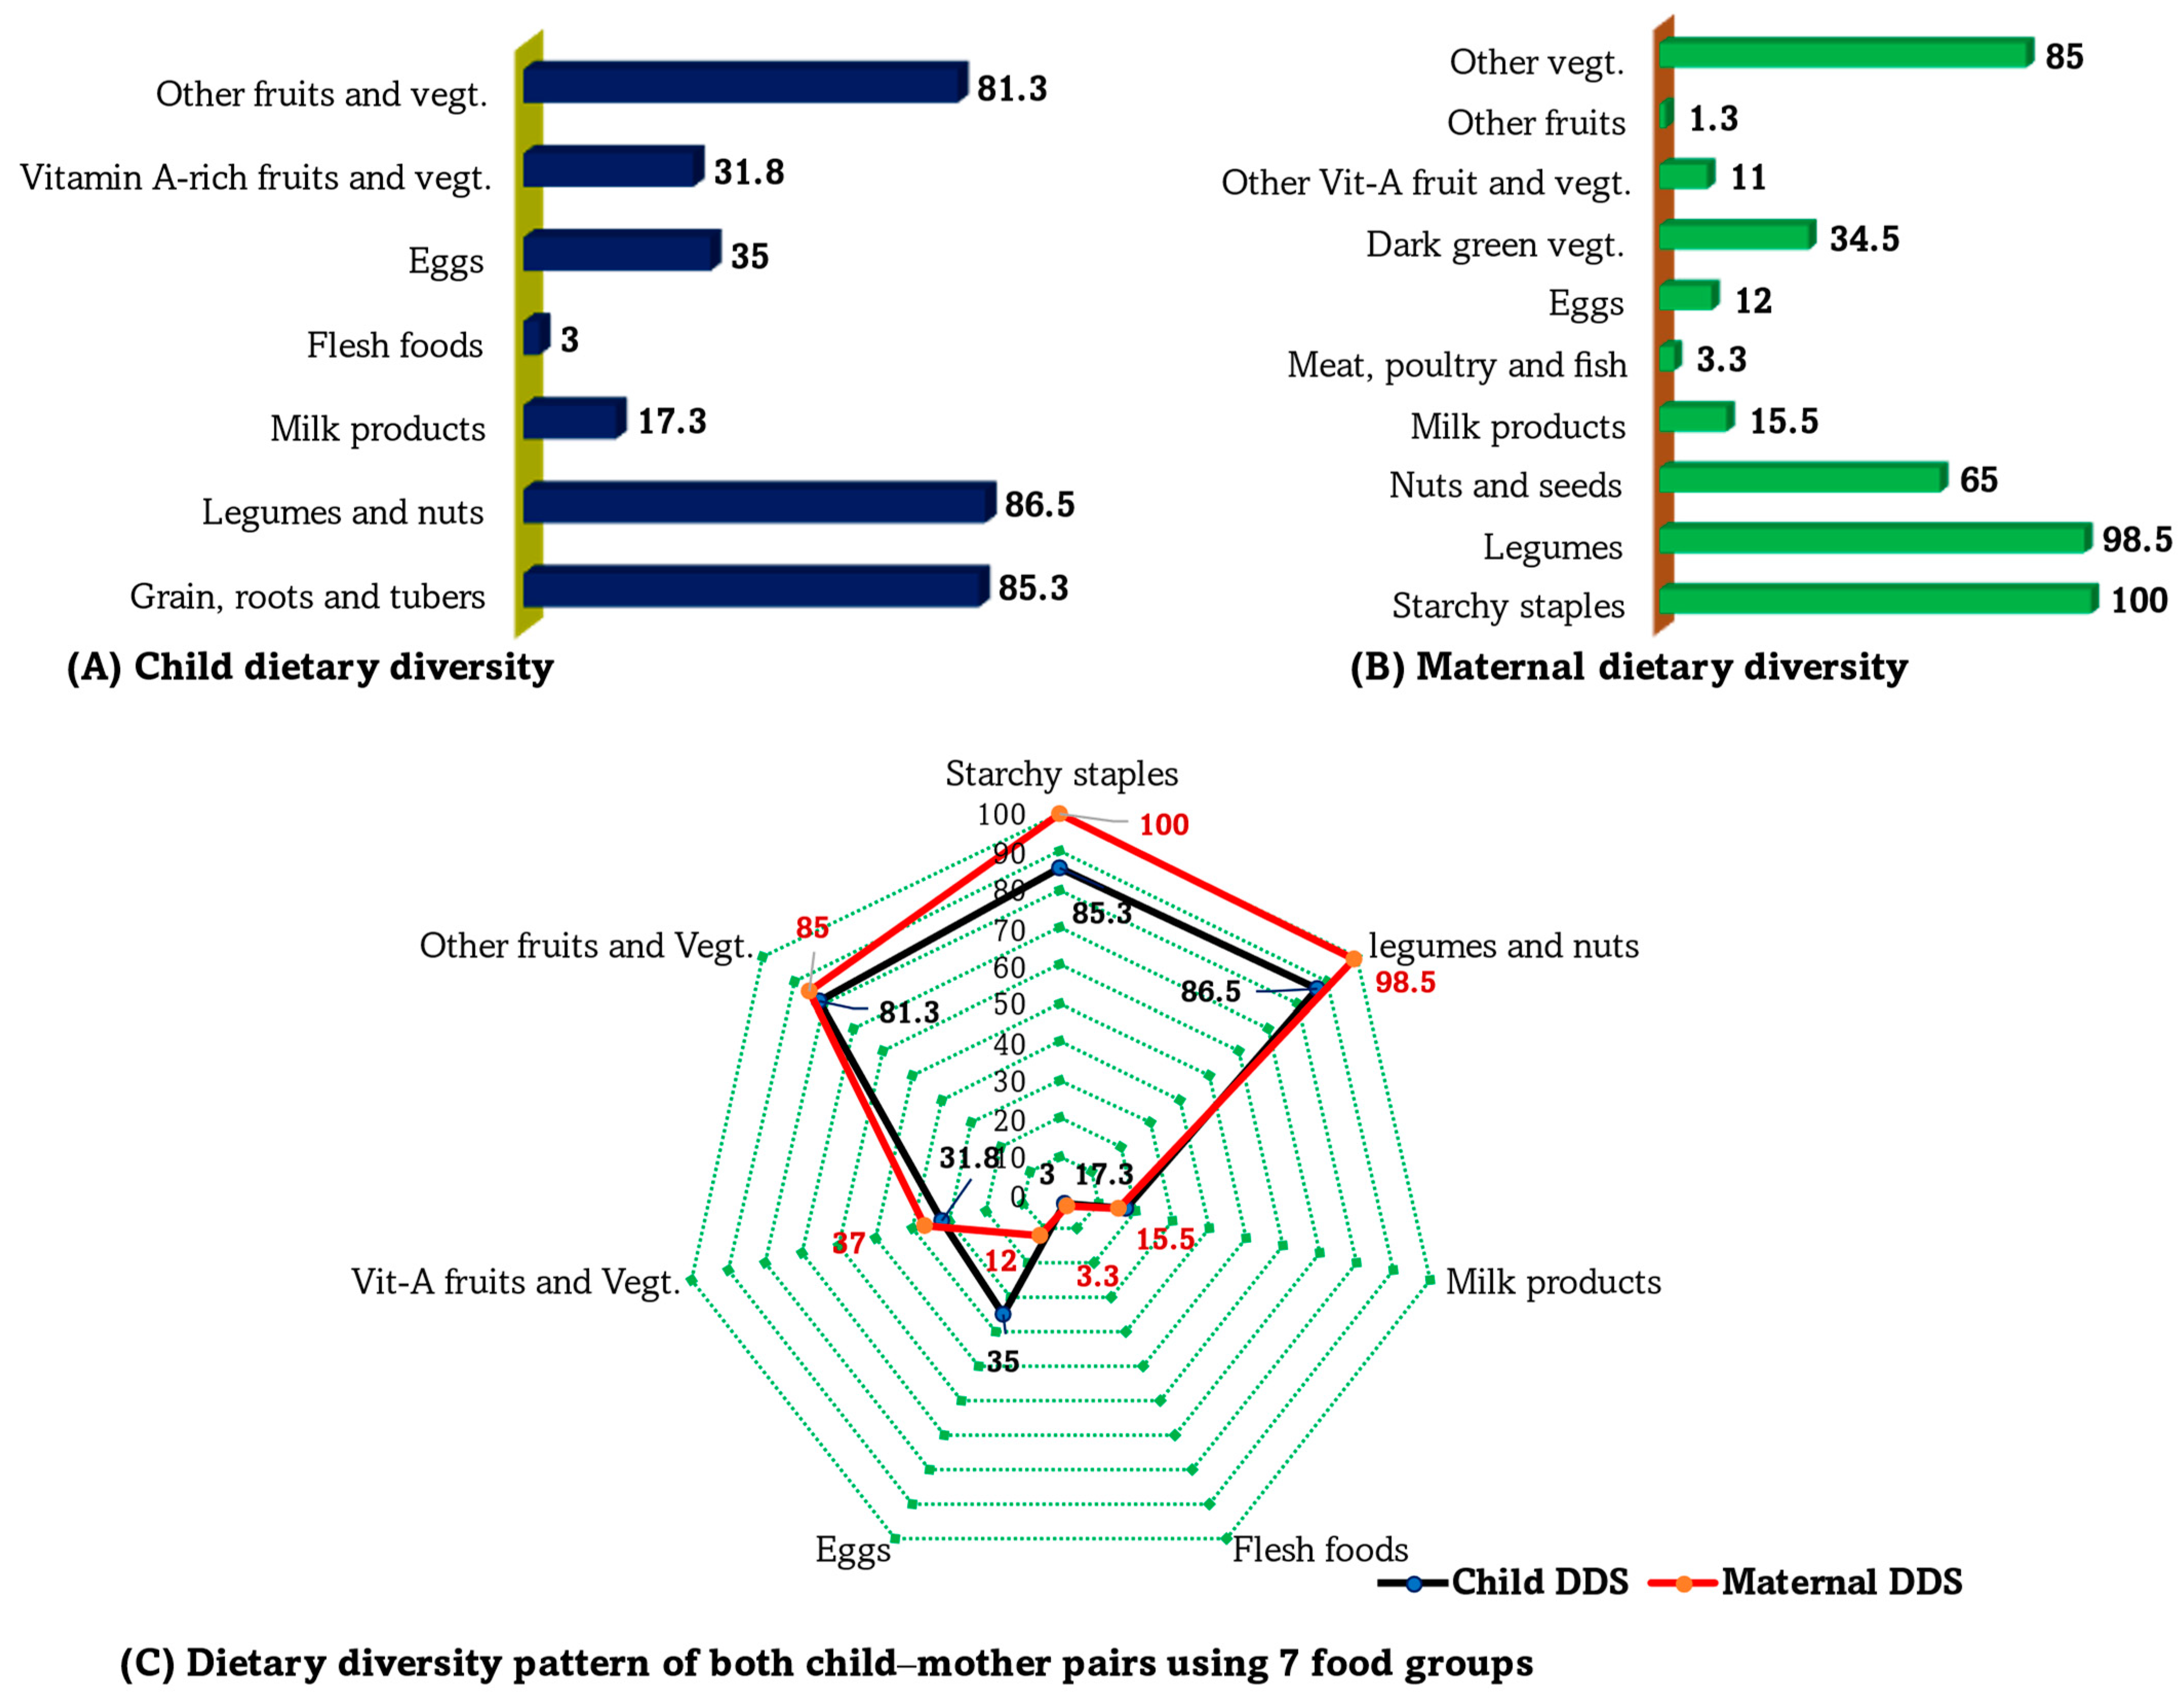
In this study, we used SEM to investigate causal relationship between various determinants (including basic, underlying, and immediate factors) and child malnutrition. Our analysis revealed negative and statistically significant direct and indirect effects of child dietary intake on malnutrition. Specifically, the odds ratio for the total effect (combining direct and indirect effects) of minimum dietary diversity on malnutrition was 0.75. This implies that with each unit increase in a child’s DDS, the odds of experiencing malnutrition decrease by 0.75 units. In simpler terms, achieving minimum dietary diversity is associated with a notable 25% reduction in the relative risk of malnutrition. This underscores the significance of dietary diversity in mitigating the likelihood of malnutrition among children. Furthermore, our analysis revealed that the effect of dietary diversity on malnutrition was partially mediated through the exposure of children to diseases. This suggests that adequate diversification in a child’s diet, encompassing foods from at least four of the seven food groups, as recommended by the FAO [
37], could enhance nutrient adequacy, subsequently lowering children’s susceptibility to diseases and thereby reducing the risk of malnutrition. However, it is concerning that more than half of the children in this study failed to meet the minimum DDS, particularly lacking in the consumption of animal-based foods and fruits and vegetables. This finding echoes the findings of prior studies conducted not only in Ethiopia [
8,
24,
47] but also across Sub-Saharan Africa [
12,
32] and in countries like South Africa [
48] and Ghana [
49], highlighting the challenge of improving nutritional status without ensuring adequate dietary diversity among children in the region.
Our analysis also revealed a direct and significant positive effect of disease experiences on malnutrition. Specifically, the unmediated effect of disease exposure on malnutrition was quantified with an odds ratio, indicating that for each unit increase in a child’s exposure to disease, the odds of being malnourished increase by 1.36 units. Consequently, children experiencing disease are more likely to suffer from malnutrition compared with their healthier counterparts. This finding aligns with prior research, including reports from the EDHS [
3] and UNICEF [
50], and studies conducted in northwest Ethiopia [
13]. It underscores the detrimental impact of various diseases on children’s nutritional status, which can be attributed to factors such as loss of appetite, the malabsorption of nutrients, and overall malfunctioning of metabolic processes.
In parallel with this descriptive result regarding child malnourishment, SEM and binary logistic regression analysis were conducted to measure the influence of agroecosystem characteristics on child malnutrition. The result of these analyses confirmed that agroecosystem is significantly associated with malnutrition based on logistic regression output, compared with a child from the lowland and valley fragmented agroecosystem (AEZ-1), where the risk of being malnourished was reduced by 42% and 27% for children from the midland with red soil (AEZ-2) and hilly and mountainous highland (AEZ-4) agroecosystems, respectively (
Supplementary Table S1). Studies from the Amhara region in Ethiopia [
24] and from Indonesia [
11] and Ecuador [
51] provide evidence of the effects of agroecosystem and agroecology on an individual’s nutritional status.
Based on logistic regression output, the risk of being malnourished was reduced by 42% and 27% for a child from midland with plain lands and from hilly and mountainous highland agroecosystems, respectively, compared with a child from the lowland and valley fragmented agroecosystem zone (
Supplementary Table S1). Evidence from Amhara region, Ethiopia [
24], Indonesia [
11], and Ecuador [
51] also indicated the influence of agroecosystem and agroecology on individual’s nutritional status. The higher risk of malnutrition in AEZ-1 could be related to higher climate change vulnerability and the resulting lower agricultural productivity and socioeconomic status compared with the midland with red soil agroecosystem (AEZ-2) [
35].
Similarly, when comparing children in AEZ-1 to those in AEZ-4, the observed variations in nutritional status could be due to differences in dietary habits. In AEZ-4, potatoes are a staple calorie-rich food consumed daily, potentially leading to additional weight gain and an increase in anthropometric indices. Another factor contributing to differences between AEZ-1 and AEZ-4 could be the environmental conditions. AEZ-4 is characterized by cold temperatures, which could provide an advantage for maintaining health compared with AEZ-1; in AEZ-1, children are exposed to higher temperatures and may be more susceptible to heat stress, which aggravates the burden of child malnutrition. This is supported by findings of studies conducted in Ethiopia [
20] and Uganda [
52]. Moreover, in multigroup SEM analysis used to investigate differences in path coefficients across AEZs in which agroecosystem was used as a moderator variable after being recategorized into four dichotomous groups, the Chi-squared test for the whole structural model across all groups was only significant for the first group (AEZ-1 vs. others [AEZ-2, -3, and -4]). Further analyses were performed for AEZ-1 vs. others to identify differences in specific path coefficients, in addition to the whole structural model. This analysis highlighted specific entry points for further nutrition-sensitive and -specific interventions to reduce the burden of childhood malnutrition.
In this study, childcare and feeding practices, treated as a latent variable, were hypothesized to have direct and indirect effects on child malnutrition. However, SEM analysis indicated insignificant direct effects of child feeding practices on malnutrition, thus not supporting our prior hypothesis. In contrast, previous studies conducted in Ethiopia [
7,
8,
13,
53], Nigeria [
54], and India [
55] demonstrated an effect of child feeding practices, particularly breastfeeding and complementary feeding, on child nutritional status using various regression analyses other than SEM. Despite the lack of a direct effect, the indirect effects of care and feeding practices on malnutrition in the present study were statistically significant and negative. These indirect effects were mediated through a child’s dietary intake and disease. Children who initiated breast feeding within 1 h of birth were exclusively breastfed up to 6 months of age and who were introduced to semisolid and solid complementary food in a timely manner were less likely to have a history of illness and inadequate dietary diversity. Consequently, this led to a reduced risk of childhood malnutrition.
Household food security is a key underlying determinant of malnutrition [
56,
57]. Mediation analysis in the present study revealed that household food security had a significant negative indirect effect on child malnutrition. Children from food-secure households were less likely to be malnourished than children from food-insecure households. When a child is from a food-secure household, the relative risk of being malnourished is decreased by 15% compared with a child from a food-insecure household. This finding is supported by the findings of a study in Indonesia that used SEM analysis [
11].
The household environment, particularly factors related to water, sanitation, and hygiene, plays a pivotal role in influencing child malnutrition. As per our prior hypothesis, the result of the SEM analysis confirmed a negative and statistically significant indirect effect of household environment on malnutrition through the mediator of disease experience. In this study, a child from a healthy household environment (i.e., with their own toilet, separated kitchen facilities, and housing animals separately) was less likely to be malnourished compared with children from less ideal household environments. This finding aligns with that of studies conducted in Ethiopia [
58] and Indonesia [
11] using SEM analysis, as well as other studies conducted in Ethiopia [
7,
59], Nigeria [
54], and India [
55]. A potential explanation for the role of the household environment in child malnutrition is that an unhealthy household environment could facilitate the rapid spread of infectious diseases. This result emphasizes the need to address not only direct determinants of nutrition but also broader household environmental determinants, through which their impact is indirectly manifested [
60].
In the SEM analysis, treating health services as a ‘latent variable’ provides a comprehensive understanding of their influence on child malnutrition. Considering child vaccination status, ANC visits, household health insurance, and health extension services as components to measure the latent construct ‘health services’ emerge as a vital strategy in the broader effort to combat child malnutrition. In the present study, the effect of health services on child malnutrition was negative and statistically significant and was fully mediated through disease experience. This aligns with previous studies conducted in Ethiopia [
59,
61] and Indonesia [
11] and suggests that ensuring adequate health services utilization can play a crucial role in improving child health and consequently reducing the prevalence of malnutrition.
The findings of this study underscore the crucial influence of maternal empowerment and maternal diet in the complex framework of child malnutrition. In addition to working on a child directly, it is important to ensure the empowerment of mothers alongside addressing their dietary needs. The path coefficient in the SEM analysis revealed that the indirect effect of maternal diet on child malnutrition was negative and statistically significant. A child’s mother who achieved the minimum of five of the ten food groups in a population can be used as a proxy indicator for better micronutrient adequacy [
62]. Other studies have also consistently shown an association between inadequate maternal dietary diversity and an increased likelihood of child malnutrition [
58,
60,
62,
63]. This may be due to the influence of a mother’s cultural preferences, adherence to food taboos, limitations regarding food access, and economic constraints, ultimately affecting a child’s dietary diversity and their nutritional outcome. This dual approach of targeting both children and their mothers are pivotal in devising a comprehensive strategy to improve child nutrition.
Similarly, SEM analysis revealed that maternal empowerment significantly influenced malnutrition at as far distance as the basic factors. When a mother’s empowerment was increased by one unit, the likelihood of her child being malnourished was reduced by 0.94 units, or their risk of malnutrition decreased by 6%. This may be attributed to empowered mothers being more likely to have high decision-making power in the household regarding child food and health care services. This finding aligns with the results of community-based cross-sectional studies conducted in Ethiopia [
24,
33] and Tanzania [
16], as well as the findings of a systematic review study [
64]; collectively, the results of these studies showed that maternal empowerment serves as a distant basic determinant of child nutrition, encompassing aspects such as education level, media exposure, and decision making power regarding a child’s health and nutrition.
Household wealth was found to have significant negative indirect effects on malnutrition. According to serial mediation analysis, when the wealth index increased by 1 unit, the odds of malnutrition among children decreased by 0.88 units. In this study, children from poor households were more likely to experience any forms of malnutrition than children from rich households. The effect of household wealth was fully mediated, and the hypothesis in the conceptual structural model is supported. This finding is supported by other studies [
11,
12,
22,
32,
33,
54,
65,
66,
67].
Most importantly, this study indicated that the probability of a child being malnourished was significantly lower among children from households who practiced better NSA, which was measured in this study as home gardening practices and livestock production. The effects of NSA practices on child malnutrition were indirect and fully mediated via underlying and immediate factors. These findings are consistent with some previous studies [
19,
68,
69]. The likely explanation for the finding is that NSA practices play a crucial role in addressing the problem of food insecurity (the physical and economic accessibility of food) at a household level, which is one of the key underlying determinants of child malnutrition. In subsistence rural families, NSA practices, particularly home gardening, allow families to cultivate a variety of fruits and vegetables, as well as animal-based foods, which promotes a diverse and nutritious diet for children. This diversity ensures that children receive the essential micronutrients necessary for their growth and development [
28].
