
Fish Intake in Relation to Fatal and Non-Fatal Cardiovascular Risk: A Systematic Review and Meta-Analysis of Cohort Studies

 ,
,  ,
,  ,
, 
Abstract
:1. Introduction
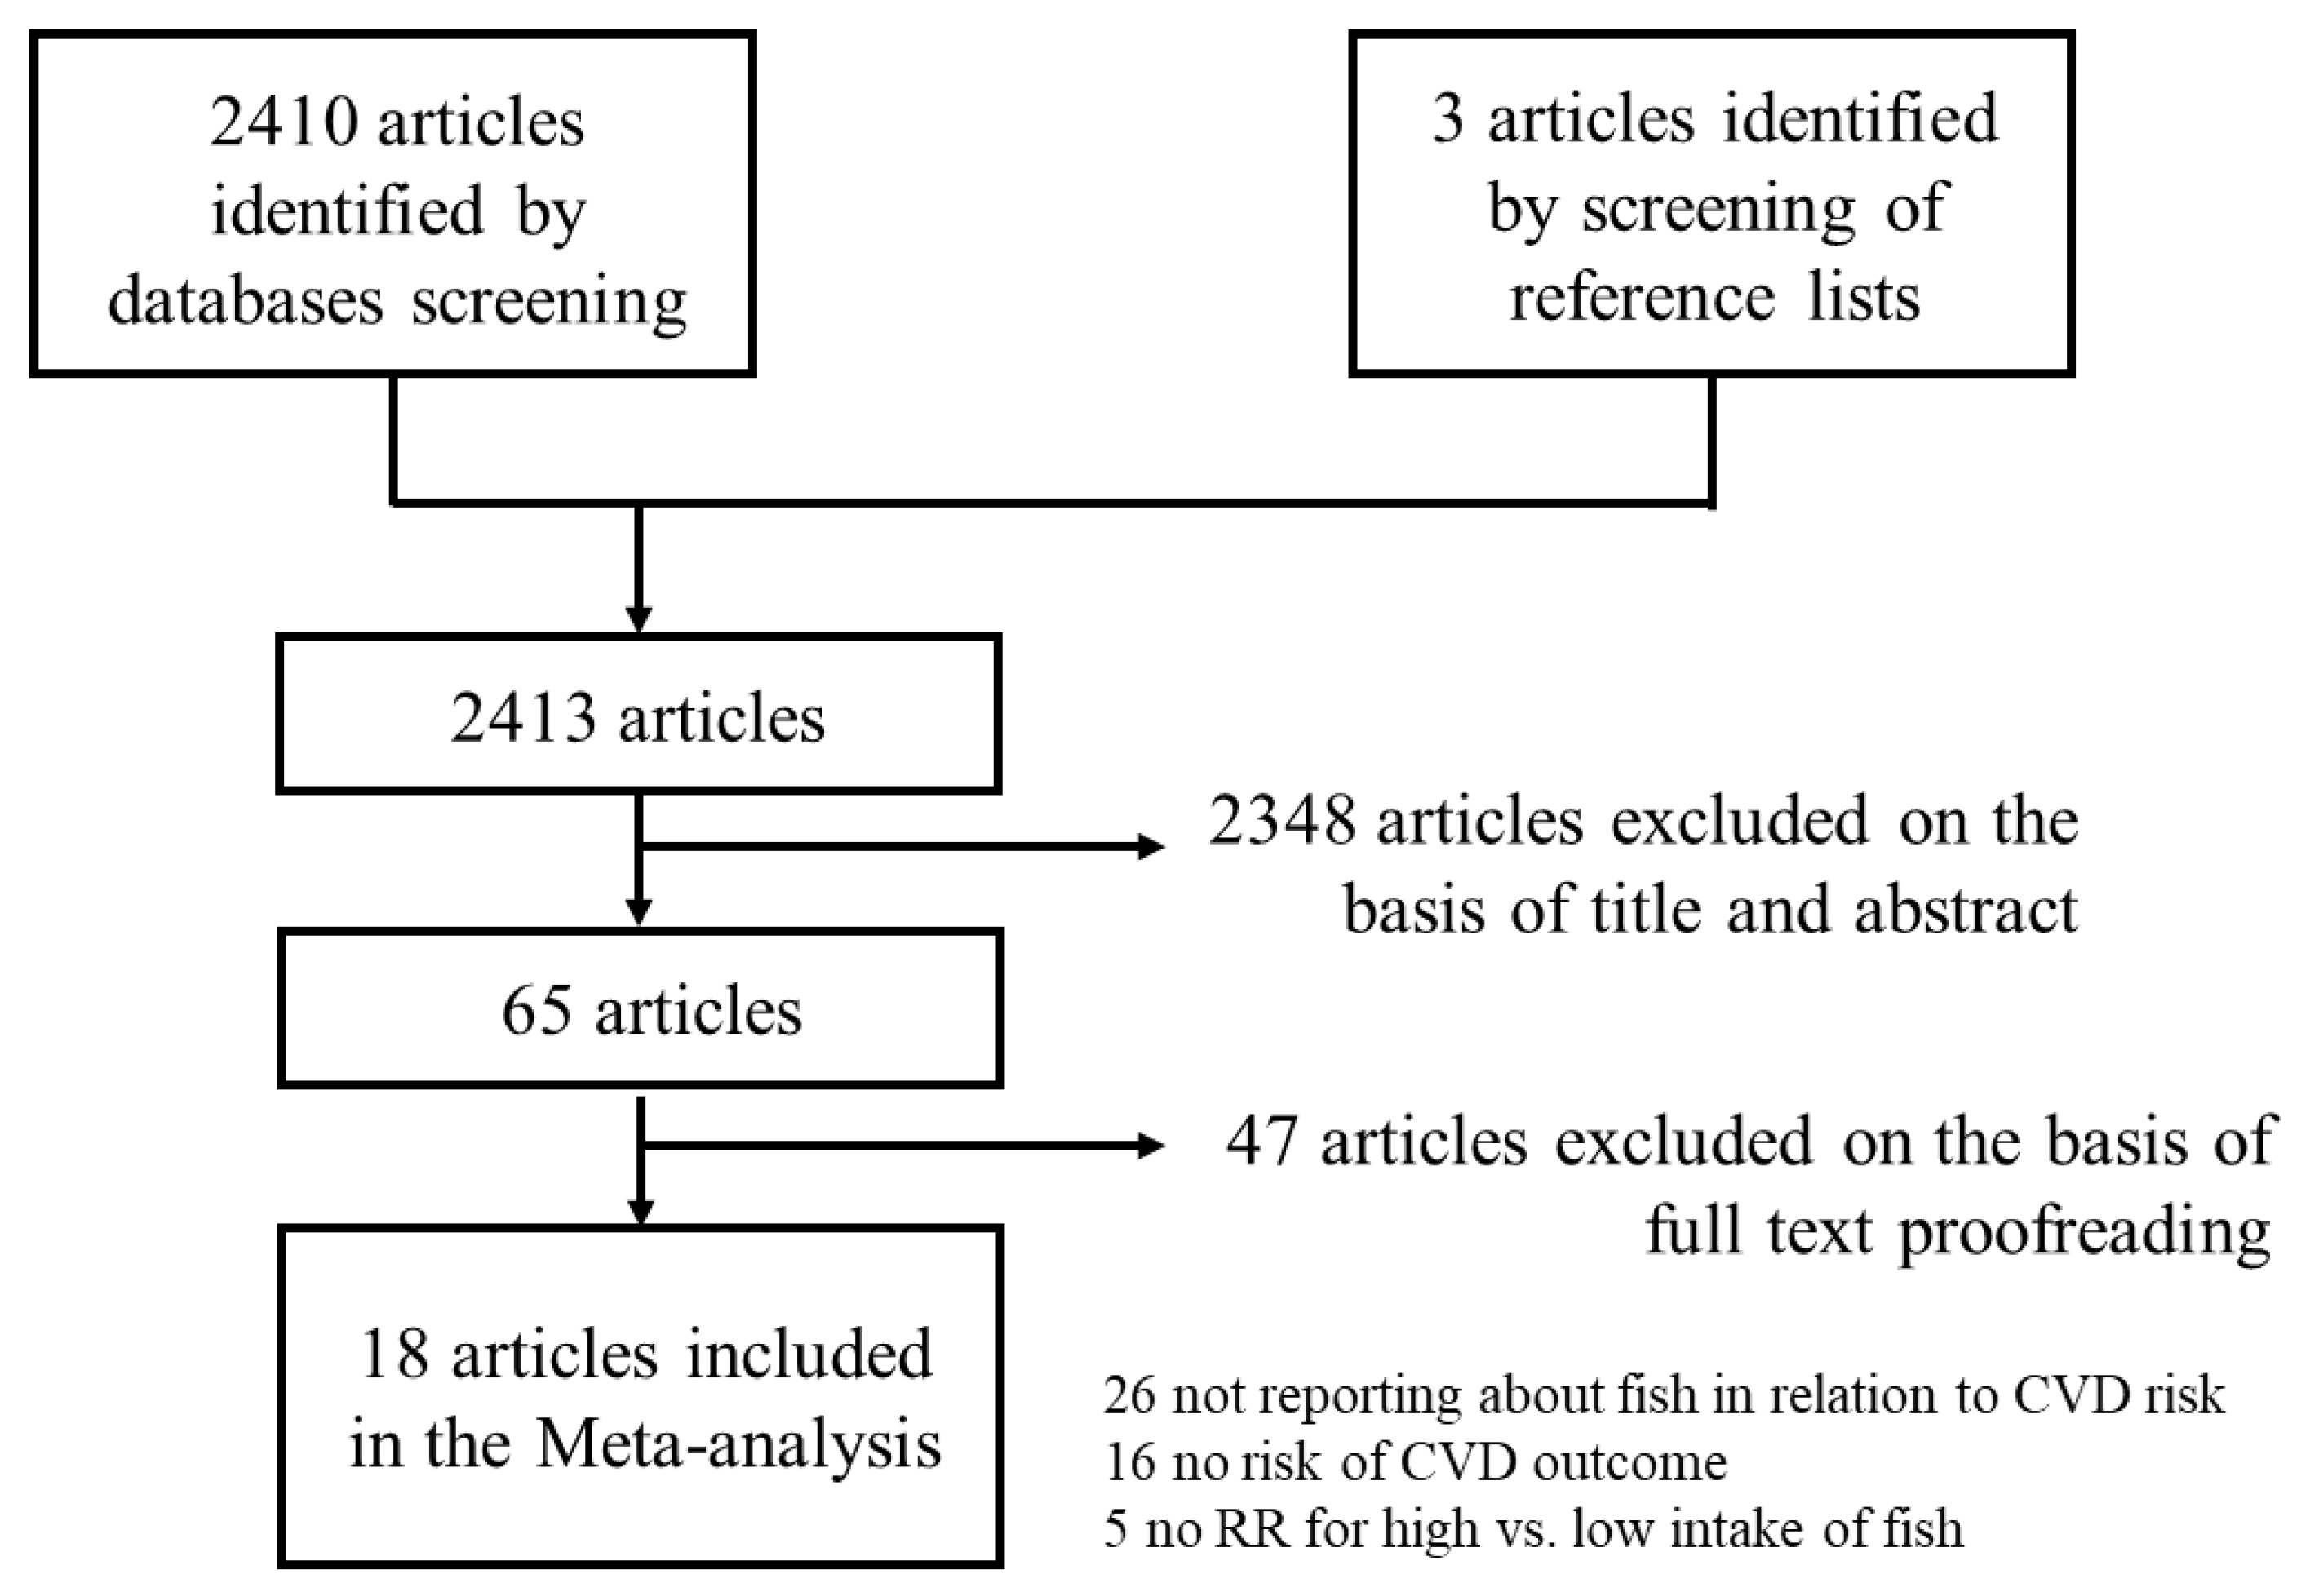
2. Methods
2.1. Information Sources
2.2. Assessment of Study Quality and Risk of Bias
2.3. Statistical Analyses
3. Results
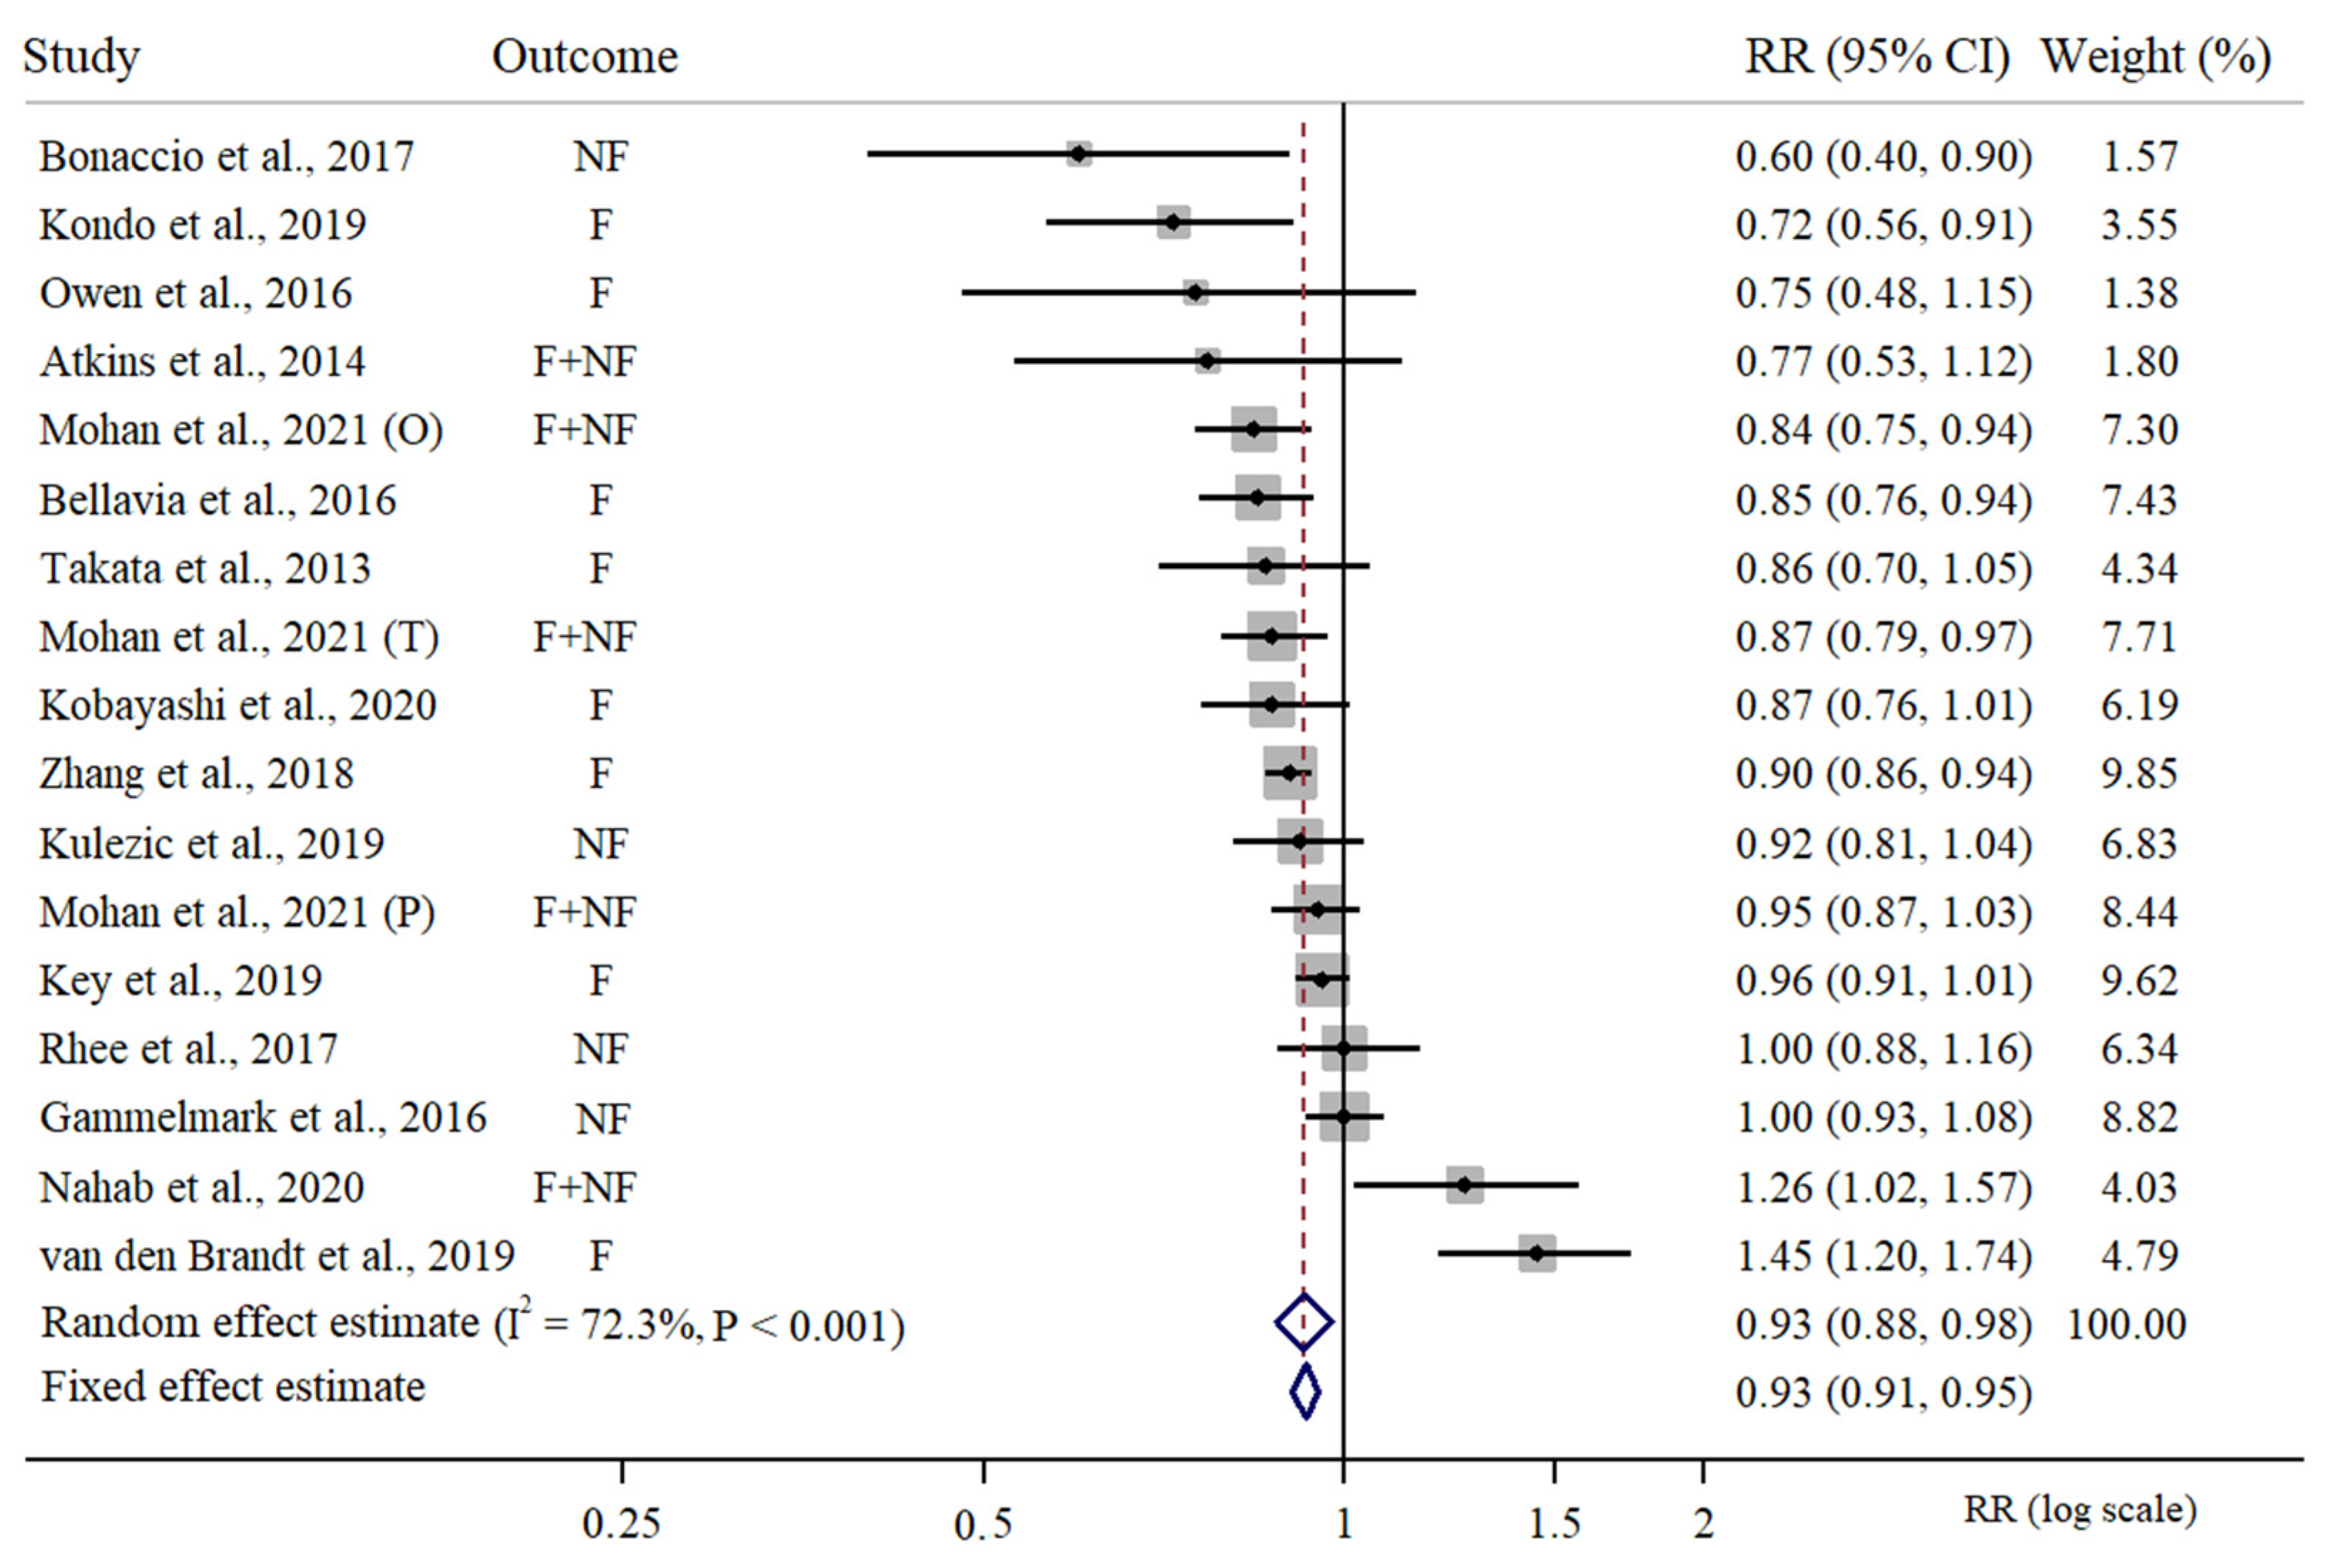
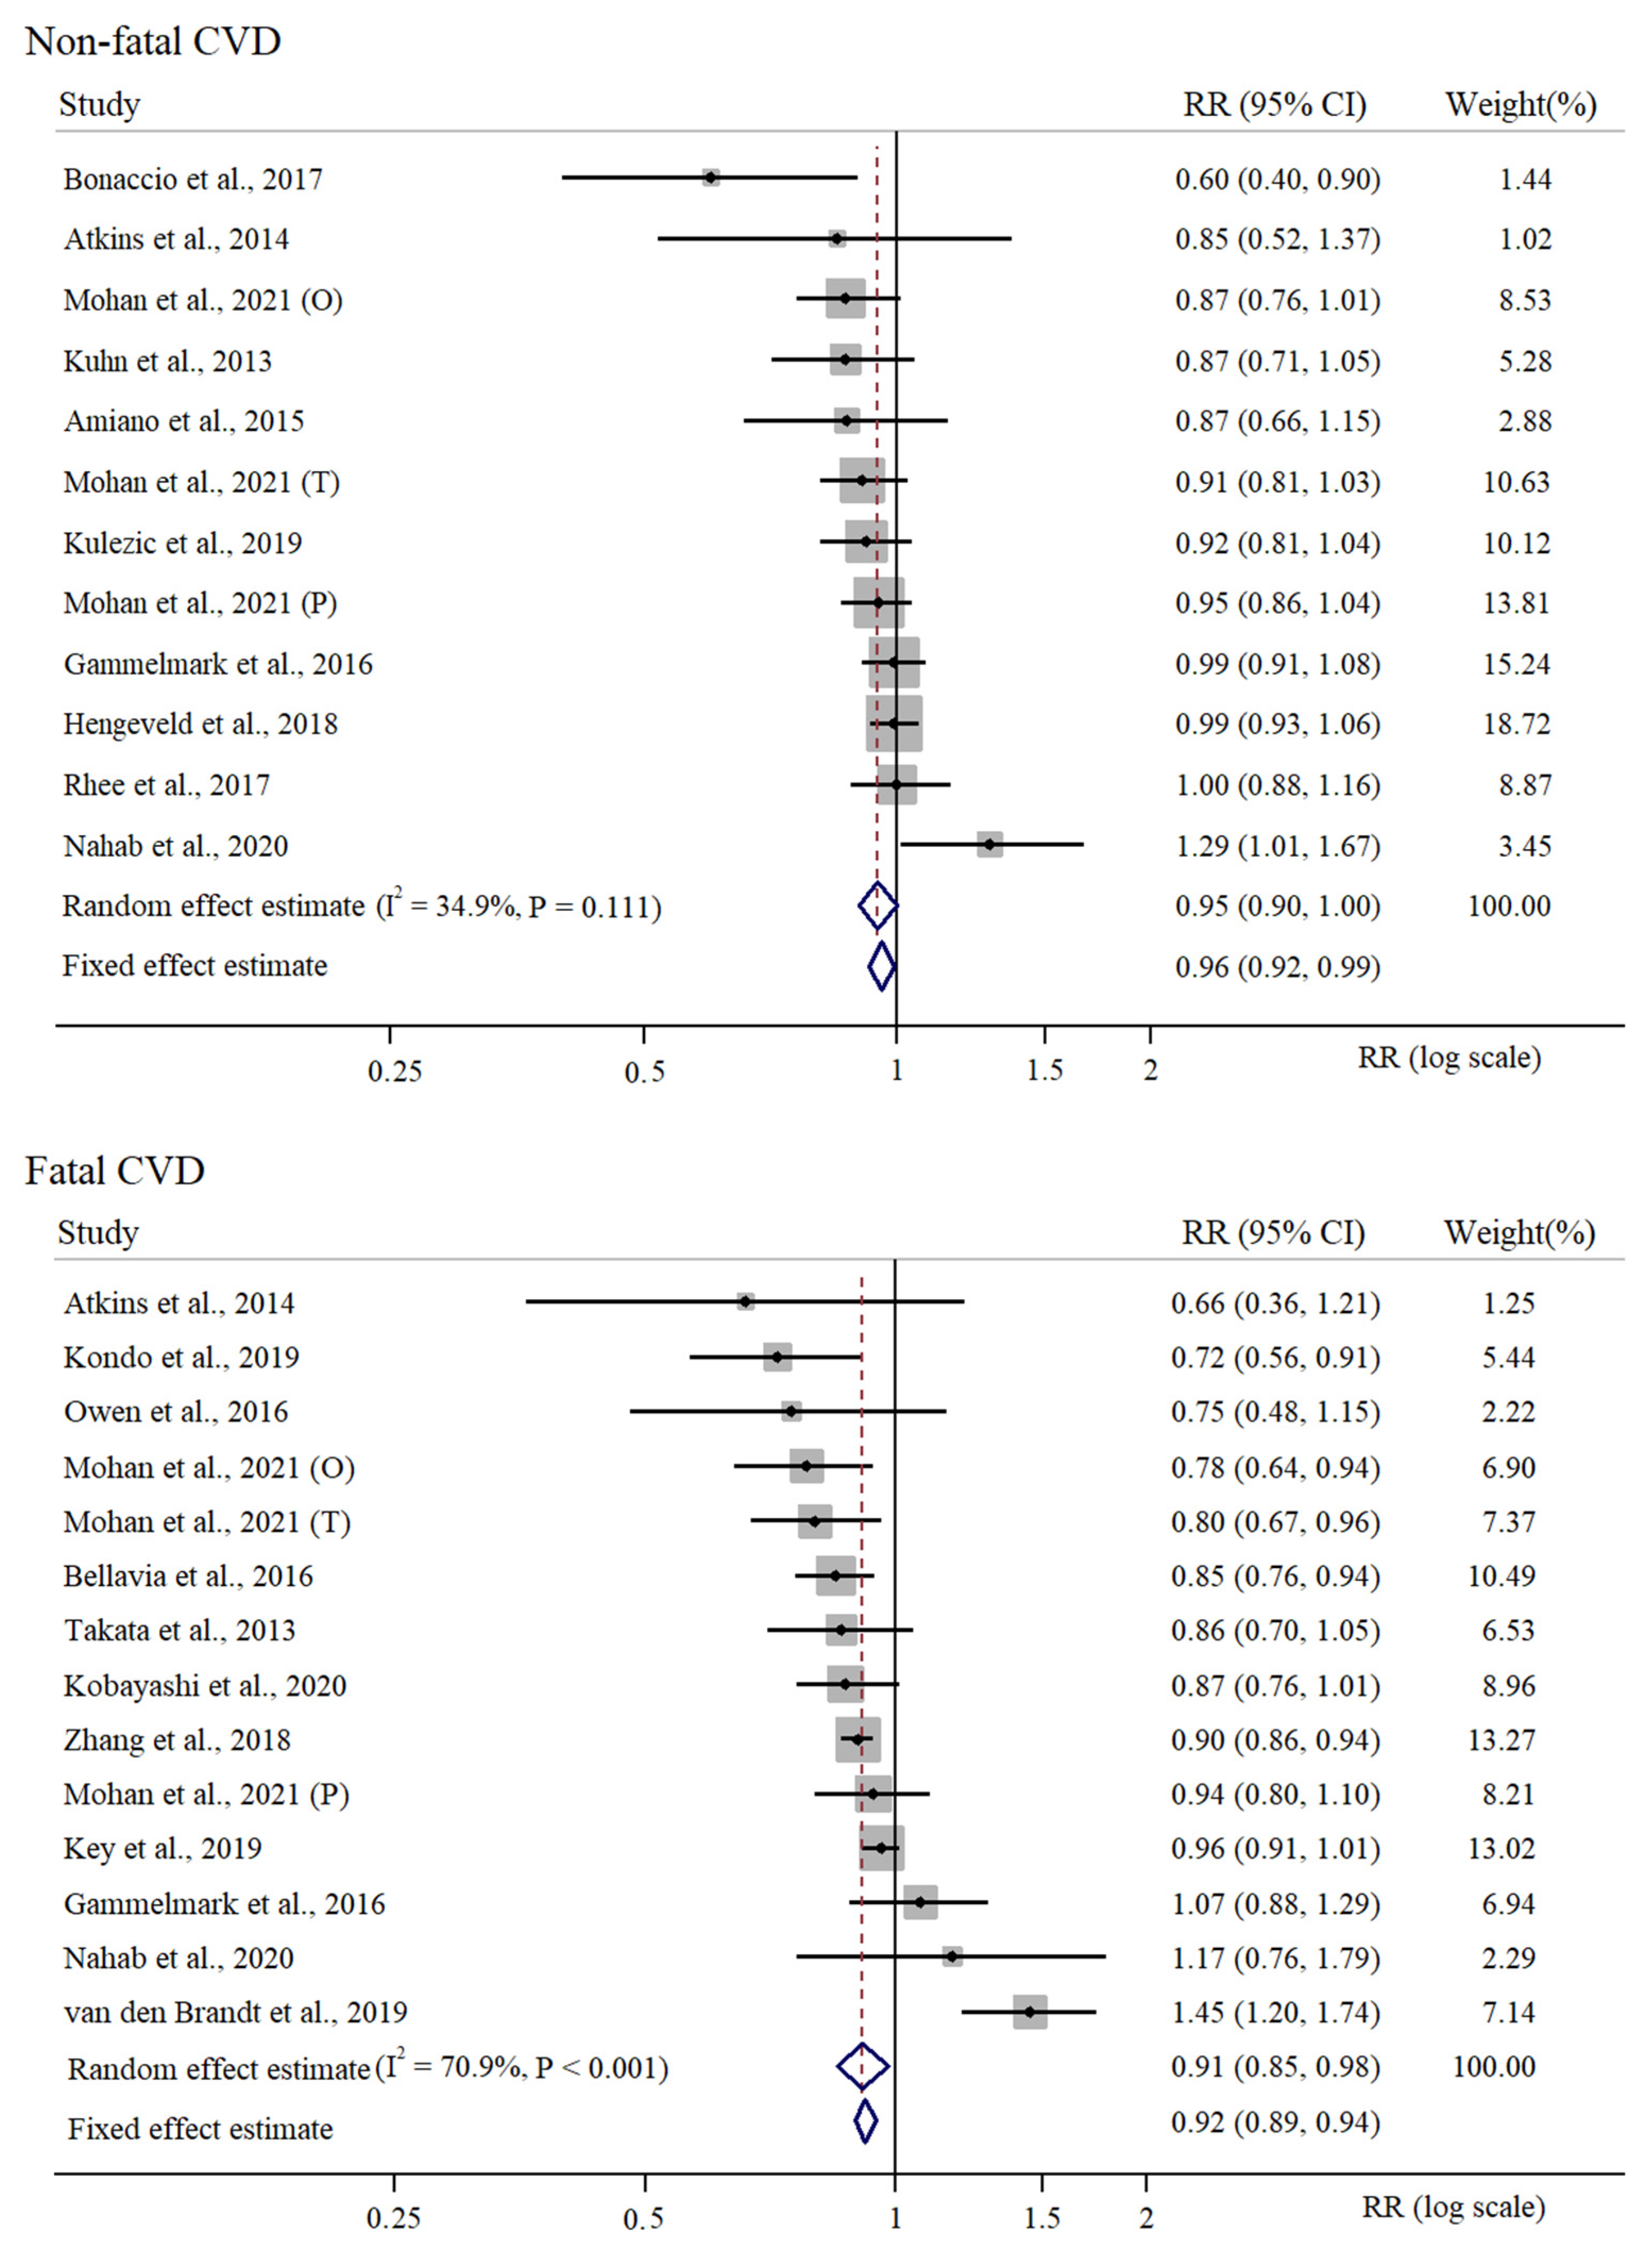
3.1. Meta-Analysis of High vs. Low Intake of Fish in Relation to CVD Risk
3.2. Supplementary Meta-Analysis of High vs. Low Intake of Fish in Relation to CVD Risk
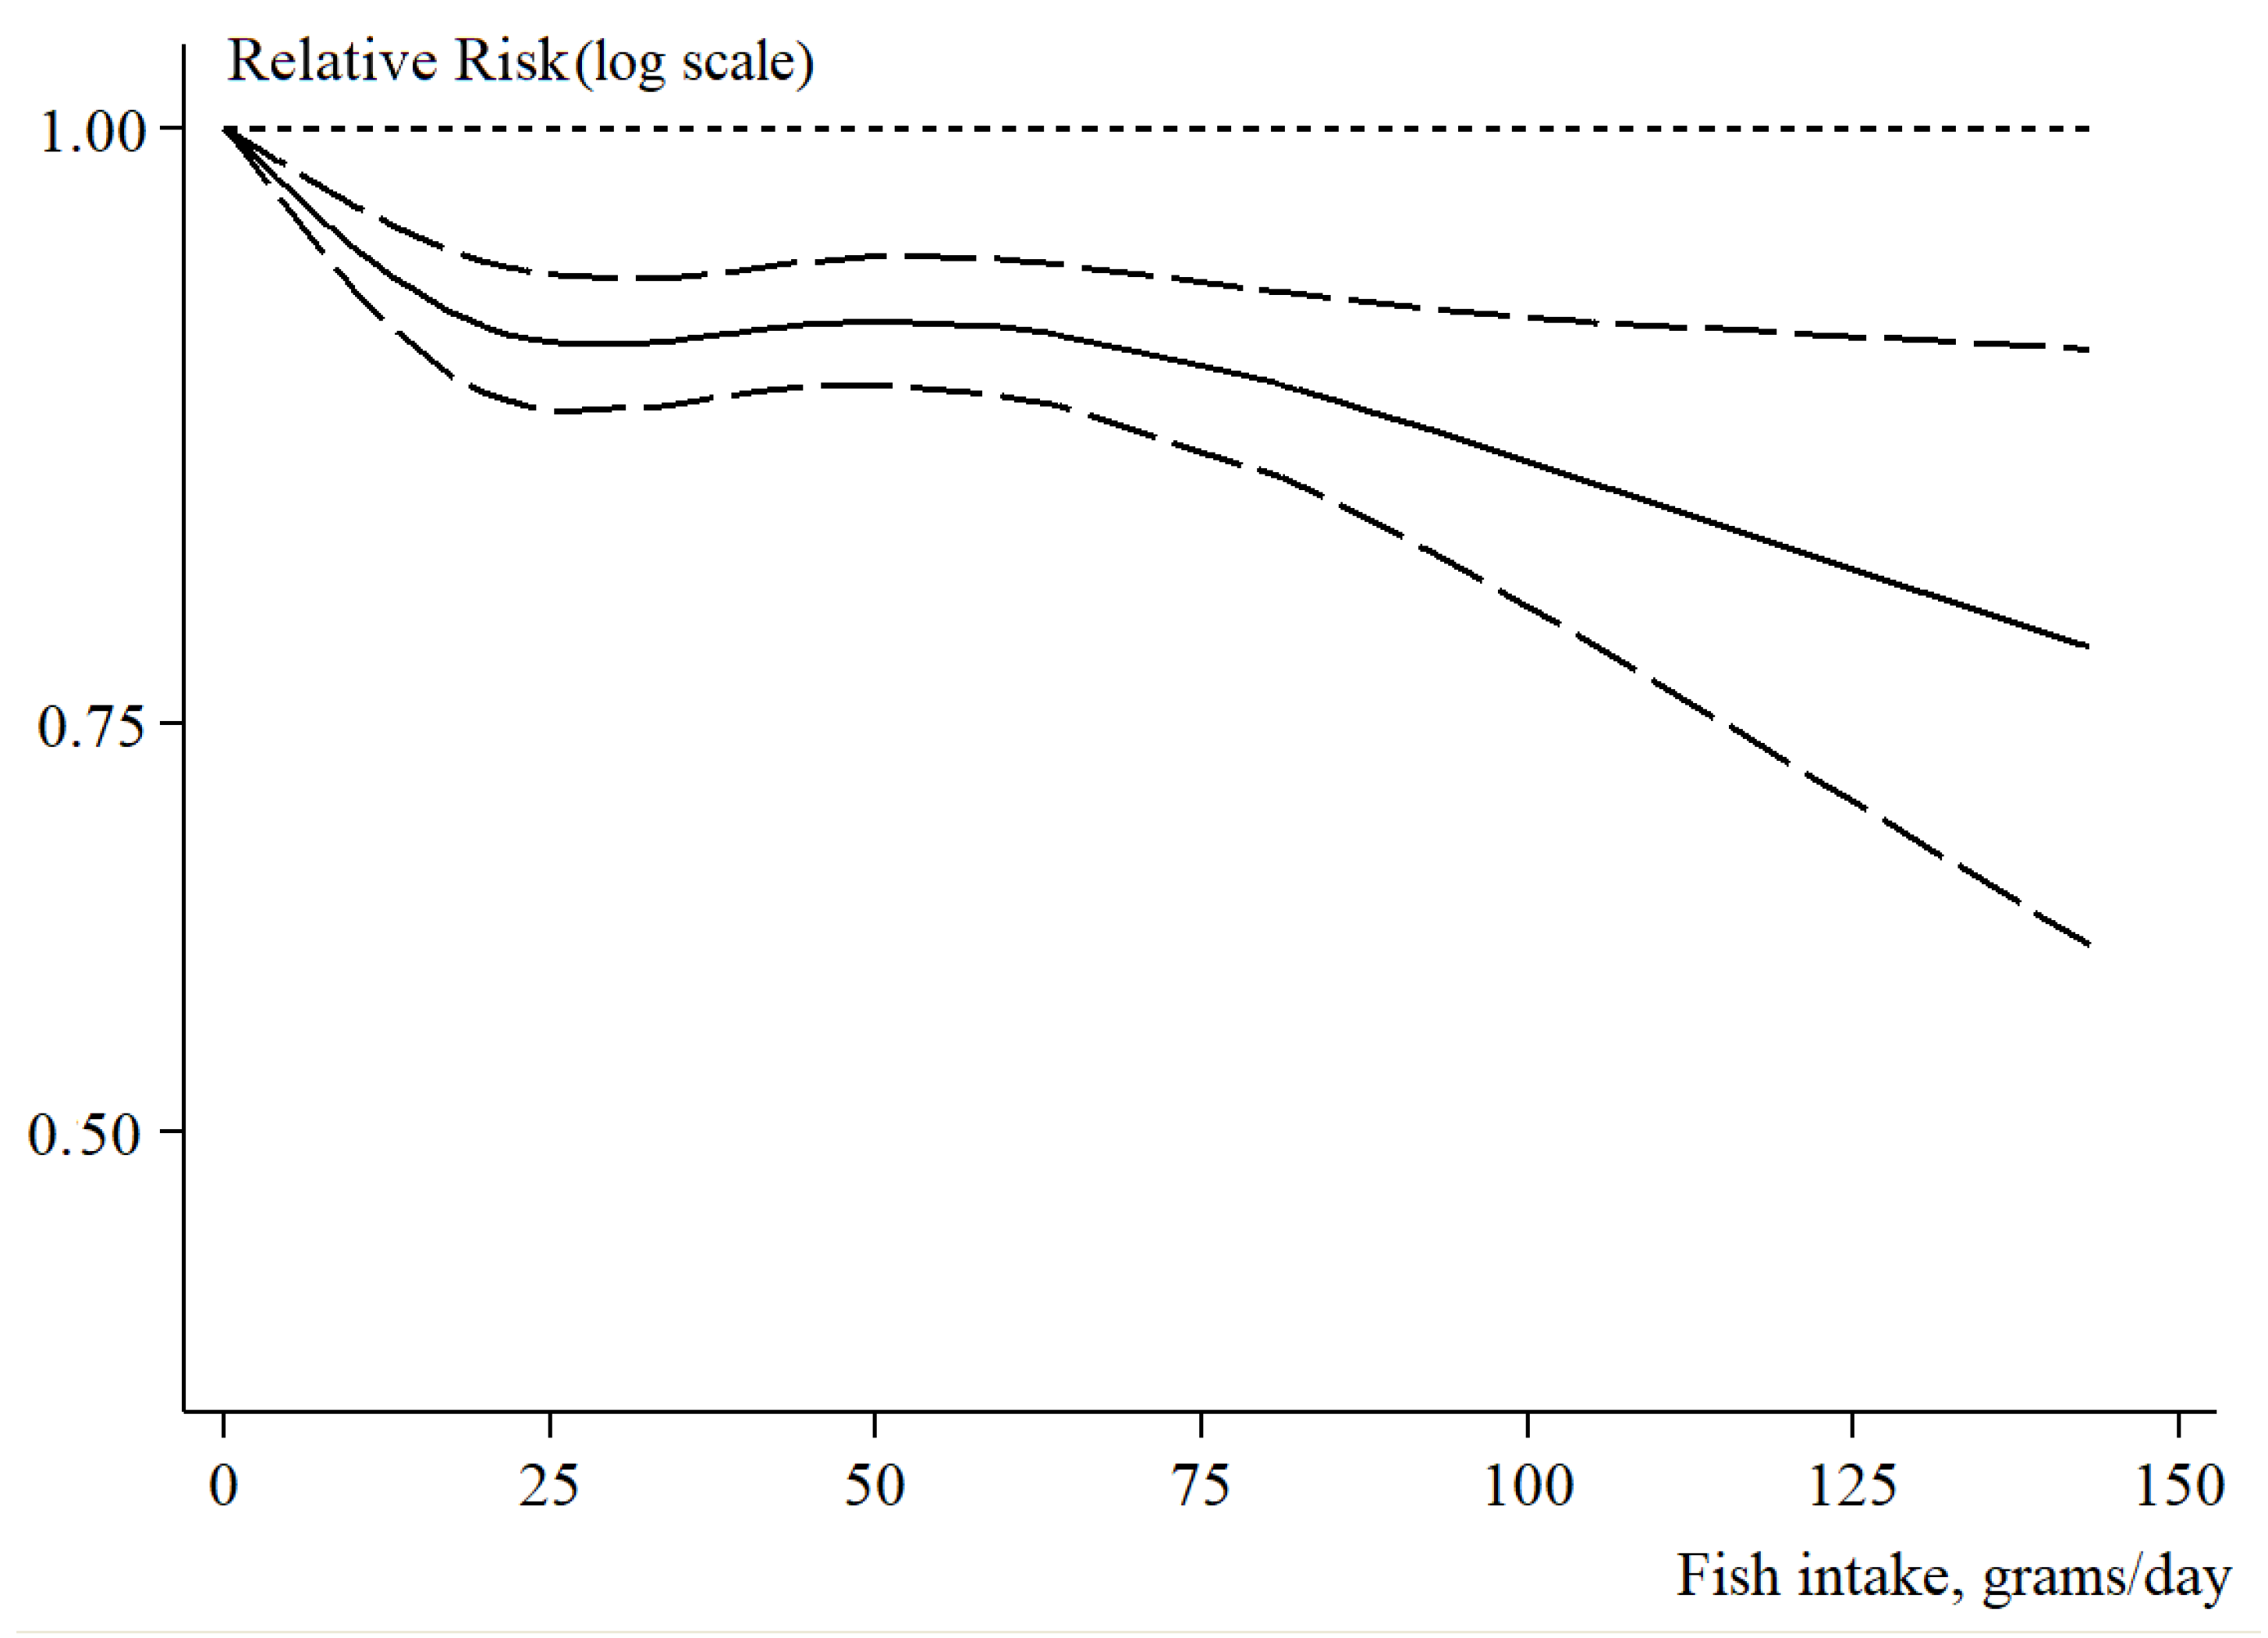
3.3. Dose–Response Analysis of Fish Intake in Relation to Fatal and Non-Fatal CVD Risk
3.4. Sensitivity Analyses, Assessment of Publication Bias and Determinants of Heterogeneity
4. Discussion
5. Conclusions
Supplementary Materials
Author Contributions
Funding
Institutional Review Board Statement
Informed Consent Statement
Data Availability Statement
Acknowledgments
Conflicts of Interest
Abbreviations
| CHD | Coronary heart disease |
| CVD | Cardiovascular disease |
| DALYs | Disability-adjusted life years |
| DHA | Docosahexaenoic acid |
| EPA | Eicosapentaenoic acid |
| FF | Fat fish |
| HD | Heart disease |
| LF | Lean fish |
| MeSH | Medical Subject Headings |
| MI | Myocardial infarction |
| NCD | Non-communicable disease |
| NOS | Newcastle-Ottawa Scale |
| NR | Not reported |
| PAD | Peripheral artery disease |
| PECO(ST) | P: Population E: Exposure C: Comparison O: Outcome S: Study type T: Time of publication |
| PRISMA | Preferred Reporting Items for Systematic Reviews and Meta-Analyses |
| PUFA | Polyunsaturated fatty acids |
| RIQ | Interquartile range |
| RR | Relative risk |
| CI | 95% confidence interval |
| SD | Standard deviation |
| STR | Stroke |
| hSTR | Haemorragic stroke |
| iSTR | Ischemic stroke |
References
- Global Burden of Disease Collaborative Network. Global Burden of Disease Study 2019 (GBD 2019) Results; Institute for Health Metrics and Evaluation—IHME: Washington, DC, USA, 2020. [Google Scholar]
- Roth, G.A.; Mensah, G.A.; Johnson, C.O.; Addolorato, G.; Ammirati, E.; Baddour, L.M.; Barengo, N.C.; Beaton, A.Z.; Benjamin, E.J.; Benziger, C.P.; et al. Global Burden of Cardiovascular Diseases and Risk Factors, 1990–2019: Update From the GBD 2019 Study. J. Am. Coll. Cardiol. 2020, 76, 2982–3021. [Google Scholar] [CrossRef] [PubMed]
- Mozaffarian, D.; Wilson, P.W.F.; Kannel, W.B. Beyond established and novel risk factors: Lifestyle risk factors for cardiovascular disease. Circulation 2008, 117, 3031–3038. [Google Scholar] [CrossRef]
- Tokgozoglu, L.; Hekimsoy, V.; Costabile, G.; Calabrese, I.; Riccardi, G. Diet, Lifestyle, Smoking. In Prevention and Treatment of Atherosclerosis: Improving State-of-the-Art Management and Search for Novel Targets; von Eckardstein, A., Binder, C.J., Eds.; Springer: Cham, Switzerland, 2022. [Google Scholar]
- Soppert, J.; Lehrke, M.; Marx, N.; Jankowski, J.; Noels, H. Lipoproteins and lipids in cardiovascular disease: From mechanistic insights to therapeutic targeting. Adv. Drug Deliv. Rev. 2020, 159, 4–33. [Google Scholar] [CrossRef] [PubMed]
- Zhao, H.; Wang, M.; Peng, X.; Zhong, L.; Liu, X.; Shi, Y.; Li, Y.; Chen, Y.; Tang, S. Fish consumption in multiple health outcomes: An umbrella review of meta-analyses of observational and clinical studies. Ann. Transl. Med. 2023, 11, 152. [Google Scholar] [CrossRef] [PubMed]
- Raatz, S.K.; Silverstein, J.T.; Jahns, L.; Picklo, M.J. Issues of fish consumption for cardiovascular disease risk reduction. Nutrients 2013, 5, 1081–1097. [Google Scholar] [CrossRef] [PubMed]
- Bechthold, A.; Boeing, H.; Schwedhelm, C.; Hoffmann, G.; Knüppel, S.; Iqbal, K.; De Henauw, S.; Michels, N.; Devleesschauwer, B.; Schlesinger, S.; et al. Food groups and risk of coronary heart disease, stroke and heart failure: A systematic review and dose-response meta-analysis of prospective studies. Crit. Rev. Food Sci. Nutr. 2019, 59, 1071–1090. [Google Scholar] [CrossRef] [PubMed]
- Giosuè, A.; Calabrese, I.; Lupoli, R.; Riccardi, G.; Vaccaro, O.; Vitale, M. Relations between the Consumption of Fatty or Lean Fish and Risk of Cardiovascular Disease and All-Cause Mortality: A Systematic Review and Meta-Analysis. Adv. Nutr. 2022, 13, 1554–1565. [Google Scholar] [CrossRef]
- Jiang, L.; Wang, J.; Xiong, K.; Xu, L.; Zhang, B.; Ma, A. Intake of Fish and Marine n-3 Polyunsaturated Fatty Acids and Risk of Cardiovascular Disease Mortality: A Meta-Analysis of Prospective Cohort Studies. Nutrients 2021, 13, 2342. [Google Scholar] [CrossRef]
- Zhang, B.; Xiong, K.; Cai, J.; Ma, A. Fish Consumption and Coronary Heart Disease: A Meta-Analysis. Nutrients 2020, 12, 2278. [Google Scholar] [CrossRef]
- Innes, J.K.; Calder, P.C. Marine Omega-3 (N-3) Fatty Acids for Cardiovascular Health: An Update for 2020. Int. J. Mol. Sci. 2020, 21, 1362. [Google Scholar] [CrossRef]
- Clifton, P.M.; Keogh, J.B. A systematic review of the effect of dietary saturated and polyunsaturated fat on heart disease. Nutr Metab. Cardiovasc. Dis. 2017, 27, 1060–1080. [Google Scholar] [CrossRef] [PubMed]
- Grimes, D.A.; Schulz, K.F. False alarms and pseudo-epidemics: The limitations of observational epidemiology. Obstet. Gynecol. 2012, 120, 920–927. [Google Scholar] [CrossRef] [PubMed]
- Choi, B.C.; Noseworthy, A.L. Classification, direction, and prevention of bias in epidemiologic research. J. Occup. Med. Off. Publ. Ind. Med. Assoc. 1992, 34, 265–271. [Google Scholar] [CrossRef] [PubMed]
- Kopec, J.A.; Esdaile, J.M. Bias in case-control studies. A review. J. Epidemiol. Community Health 1990, 44, 179–186. [Google Scholar] [CrossRef]
- Page, M.J.; McKenzie, J.E.; Bossuyt, P.M.; Boutron, I.; Hoffmann, T.C.; Mulrow, C.D.; Shamseer, L.; Tetzlaff, J.M.; Akl, E.A.; Brennan, S.E.; et al. The PRISMA 2020 statement: An updated guideline for reporting systematic reviews. BMJ 2021, 372, n71. [Google Scholar] [CrossRef]
- Mintzker, Y.; Blum, D.; Adler, L. Replacing PICO in non-interventional studies. BMJ Evid.-Based Med. 2023, 28, 284. [Google Scholar] [CrossRef]
- Peterson, J.; Welch, V.; Losos, M.; Tugwell, P. The Newcastle-Ottawa scale (NOS) for assessing the quality of nonrandomised studies in meta-analyses. Ott. Hosp. Res. Inst. 2011, 2, 1–12. [Google Scholar]
- Peters, J.L.; Sutton, A.J.; Jones, D.R.; Abrams, K.R.; Rushton, L. Comparison of two methods to detect publication bias in meta-analysis. JAMA 2006, 295, 676–680. [Google Scholar] [CrossRef]
- Orsini, N.; Bellocco, R.; Greenland, S. Generalized least squares for trend estimation of summarized dose–response data. Stata J. 2006, 6, 40–57. [Google Scholar] [CrossRef]
- Egger, M.; Davey Smith, G.; Schneider, M.; Minder, C. Bias in meta-analysis detected by a simple, graphical test. BMJ 1997, 315, 629–634. [Google Scholar] [CrossRef]
- Amiano, P.; Chamosa, S.; Etxezarreta, N.; Arriola, L.; Moreno-Iribas, C.; Huerta, J.-M.; Egües, N.; Guevara, M.; Navarro, C.; Chirlaque, M.-D.; et al. No association between fish consumption and risk of stroke in the Spanish cohort of the European Prospective Investigation into Cancer and Nutrition (EPIC-Spain): A 13·8-year follow-up study. Public Health Nutr. 2016, 19, 674–681. [Google Scholar] [CrossRef] [PubMed]
- Atkins, J.L.; Whincup, P.H.; Morris, R.W.; Lennon, L.T.; Papacosta, O.; Wannamethee, S.G. High diet quality is associated with a lower risk of cardiovascular disease and all-cause mortality in older men. J. Nutr. 2014, 144, 673–680. [Google Scholar] [CrossRef]
- Bellavia, A.; Larsson, S.C.; Wolk, A. Fish consumption and all-cause mortality in a cohort of Swedish men and women. J. Intern. Med. 2017, 281, 86–95. [Google Scholar] [CrossRef] [PubMed]
- Bonaccio, M.; Ruggiero, E.; Di Castelnuovo, A.; Costanzo, S.; Persichillo, M.; De Curtis, A.; Cerletti, C.; Donati, M.B.; de Gaetano, G.; Iacoviello, L.; et al. Fish intake is associated with lower cardiovascular risk in a Mediterranean population: Prospective results from the Moli-sani study. Nutr. Metab. Cardiovasc. Dis. 2017, 27, 865–873. [Google Scholar] [CrossRef]
- Gammelmark, A.; Nielsen, M.S.; Bork, C.S.; Lundbye-Christensen, S.; Tjønneland, A.; Overvad, K.; Schmidt, E.B. Association of fish consumption and dietary intake of marine n-3 PUFA with myocardial infarction in a prospective Danish cohort study. Br. J. Nutr. 2016, 116, 167–177. [Google Scholar] [CrossRef]
- Hengeveld, L.M.; Praagman, J.; Beulens, J.W.J.; Brouwer, I.A.; Schouw YT van der Sluijs, I. Fish consumption and risk of stroke, coronary heart disease, and cardiovascular mortality in a Dutch population with low fish intake. Eur. J. Clin. Nutr. 2018, 72, 942–950. [Google Scholar] [CrossRef] [PubMed]
- Key, T.J.; Appleby, P.N.; Bradbury, K.E.; Sweeting, M.; Wood, A.; Johansson, I.; Kühn, T.; Steur, M.; Weiderpass, E.; Wennberg, M.; et al. Consumption of Meat, Fish, Dairy Products, and Eggs and Risk of Ischemic Heart Disease. Circulation 2019, 139, 2835–2845. [Google Scholar] [CrossRef]
- Kobayashi, M.; Sasazuki, S.; Shimazu, T.; Sawada, N.; Yamaji, T.; Iwasaki, M.; Mizoue, T.; Tsugane, S. Association of dietary diversity with total mortality and major causes of mortality in the Japanese population: JPHC study. Eur. J. Clin. Nutr. 2020, 74, 54–66. [Google Scholar] [CrossRef]
- Kondo, K.; Miura, K.; Tanaka-Mizuno, S.; Kadota, A.; Arima, H.; Okuda, N.; Fujiyoshi, A.; Miyagawa, N.; Yoshita, K.; Okamura, T.; et al. Cardiovascular Risk Assessment Chart by Dietary Factors in Japan—NIPPON DATA80. Circ. J. Off. J. Jpn Circ. Soc. 2019, 83, 1254–1260. [Google Scholar] [CrossRef]
- Kühn, T.; Teucher, B.; Kaaks, R.; Boeing, H.; Weikert, C.; Buijsse, B. Fish consumption and the risk of myocardial infarction and stroke in the German arm of the European Prospective Investigation into Cancer and Nutrition (EPIC-Germany). Br. J. Nutr. 2013, 110, 1118–1125. [Google Scholar] [CrossRef]
- Kulezic, A.; Bergwall, S.; Fatemi, S.; Sonestedt, E.; Zarrouk, M.; Gottsäter, A.; Acosta, S. Healthy diet and fiber intake are associated with decreased risk of incident symptomatic peripheral artery disease—A prospective cohort study. Vasc. Med. 2019, 24, 511–518. [Google Scholar] [CrossRef] [PubMed]
- Mohan, D.; Mente, A.; Dehghan, M.; Rangarajan, S.; O’Donnell, M.; Hu, W.; Dagenais, G.; Wielgosz, A.; Lear, S.; Wei, L.; et al. Associations of Fish Consumption With Risk of Cardiovascular Disease and Mortality Among Individuals With or Without Vascular Disease From 58 Countries. JAMA Intern. Med. 2021, 181, 631–649. [Google Scholar] [CrossRef] [PubMed]
- Nahab, F.; Pearson, K.; Frankel, M.R.; Ard, J.; Safford, M.M.; Kleindorfer, D.; Howard, V.J.; Judd, S. Dietary fried fish intake increases risk of CVD: The REasons for Geographic And Racial Differences in Stroke (REGARDS) study. Public Health Nutr. 2016, 19, 3327–3336. [Google Scholar] [CrossRef] [PubMed]
- Owen, A.J.; Magliano, D.J.; O’Dea, K.; Barr, E.L.M.; Shaw, J.E. Polyunsaturated fatty acid intake and risk of cardiovascular mortality in a low fish-consuming population: A prospective cohort analysis. Eur. J. Nutr. 2016, 55, 1605–1613. [Google Scholar] [CrossRef]
- Rhee, J.J.; Kim, E.; Buring, J.E.; Kurth, T. Fish Consumption, Omega-3 Fatty Acids, and Risk of Cardiovascular Disease. Am. J. Prev. Med. 2017, 52, 10–19. [Google Scholar] [CrossRef]
- Takata, Y.; Zhang, X.; Li, H.; Gao, Y.-T.; Yang, G.; Gao, J.; Cai, H.; Xiang, Y.-B.; Zheng, W.; Shu, X.-O. Fish intake and risks of total and cause-specific mortality in 2 population-based cohort studies of 134,296 men and women. Am. J. Epidemiol. 2013, 178, 46–57. [Google Scholar] [CrossRef]
- van den Brandt, P.A. Red meat, processed meat, and other dietary protein sources and risk of overall and cause-specific mortality in The Netherlands Cohort Study. Eur. J. Epidemiol. 2019, 34, 351–369. [Google Scholar] [CrossRef]
- Zhang, Y.; Zhuang, P.; He, W.; Chen, J.N.; Wang, W.Q.; Freedman, N.D.; Abnet, C.C.; Wang, J.B.; Jiao, J.J. Association of fish and long-chain omega-3 fatty acids intakes with total and cause-specific mortality: Prospective analysis of 421 309 individuals. J. Intern. Med. 2018, 284, 399–417. [Google Scholar] [CrossRef]
- Jayedi, A.; Shab-Bidar, S.; Eimeri, S.; Djafarian, K. Fish consumption and risk of all-cause and cardiovascular mortality: A dose-response meta-analysis of prospective observational studies. Public Health Nutr. 2018, 21, 1297–1306. [Google Scholar] [CrossRef]
- Shirota, M.; Watanabe, N.; Suzuki, M.; Kobori, M. Japanese-Style Diet and Cardiovascular Disease Mortality: A Systematic Review and Meta-Analysis of Prospective Cohort Studies. Nutrients 2022, 14, 2008. [Google Scholar] [CrossRef]
- Abdelhamid, A.S.; Brown, T.J.; Brainard, J.S.; Biswas, P.; Thorpe, G.C.; Moore, H.J.; Deane, K.H.; AlAbdulghafoor, F.K.; Summerbell, C.D.; Worthington, H.V.; et al. Omega-3 fatty acids for the primary and secondary prevention of cardiovascular disease. Cochrane Database Syst. Rev. 2018, 11, CD003177. [Google Scholar] [PubMed]
- Bork, C.S.; Lasota, A.N.; Lundbye-Christensen, S.; Jakobsen, M.U.; Tjønneland, A.; Calder, P.C.; Schmidt, E.B.; Overvad, K. Intake of α-linolenic acid is not consistently associated with a lower risk of peripheral artery disease: Results from a Danish cohort study. Br. J. Nutr. 2019, 122, 86–92. [Google Scholar] [CrossRef] [PubMed]
- Sayon-Orea, C.; Carlos, S.; Martínez-Gonzalez, M.A. Does cooking with vegetable oils increase the risk of chronic diseases?: A systematic review. Br. J. Nutr. 2015, 113 (Suppl. S2), S36–S48. [Google Scholar] [CrossRef] [PubMed]
- Ismail, S.R.; Maarof, S.K.; Siedar Ali, S.; Ali, A. Systematic review of palm oil consumption and the risk of cardiovascular disease. PLoS ONE 2018, 13, e0193533. [Google Scholar] [CrossRef]
- Zhu, Y.; Bo, Y.; Liu, Y. Dietary total fat, fatty acids intake, and risk of cardiovascular disease: A dose-response meta-analysis of cohort studies. Lipids Health Dis. 2019, 18, 91. [Google Scholar] [CrossRef]
- He, K.; Rimm, E.B.; Merchant, A.; Rosner, B.A.; Stampfer, M.J.; Willett, W.C.; Ascherio, A. Fish consumption and risk of stroke in men. JAMA 2002, 288, 3130–3136. [Google Scholar] [CrossRef]
- Iso, H.; Rexrode, K.M.; Stampfer, M.J.; Manson, J.E.; Colditz, G.A.; Speizer, F.E.; Hennekens, C.H.; Willett, W.C. Intake of fish and omega-3 fatty acids and risk of stroke in women. JAMA 2001, 285, 304–312. [Google Scholar] [CrossRef]
- Venø, S.K.; Bork, C.S.; Jakobsen, M.U.; Lundbye-Christensen, S.; Bach, F.W.; McLennan, P.L.; Tjønneland, A.; Schmidt, E.B.; Overvad, K. Substitution of Fish for Red Meat or Poultry and Risk of Ischemic Stroke. Nutrients 2018, 10, 1648. [Google Scholar] [CrossRef]
- Rimm, E.B.; Appel, L.J.; Chiuve, S.E.; Djoussé, L.; Engler, M.B.; Kris-Etherton, P.M.; Mozaffarian, D.; Siscovick, D.S.; Lichtenstein, A.H.; American Heart Association Nutrition Committee of the Council on Lifestyle and Cardiometabolic Health; et al. Seafood Long-Chain n-3 Polyunsaturated Fatty Acids and Cardiovascular Disease: A Science Advisory From the American Heart Association. Circulation 2018, 138, e35–e47. [Google Scholar] [CrossRef]
- Calder, P.C. Very long-chain n-3 fatty acids and human health: Fact, fiction and the future. Proc. Nutr. Soc. 2018, 77, 52–72. [Google Scholar] [CrossRef]
- Kris-Etherton, P.M.; Harris, W.S.; Appel, L.J.; American Heart Association, Nutrition Committee. Fish consumption, fish oil, omega-3 fatty acids, and cardiovascular disease. Circulation 2002, 106, 2747–2757. [Google Scholar] [CrossRef] [PubMed]
- Calder, P.C. n-3 Fatty acids and cardiovascular disease: Evidence explained and mechanisms explored. Clin. Sci. 2004, 107, 1–11. [Google Scholar] [CrossRef] [PubMed]
- Saravanan, P.; Davidson, N.C.; Schmidt, E.B.; Calder, P.C. Cardiovascular effects of marine omega-3 fatty acids. Lancet 2010, 376, 540–550. [Google Scholar] [CrossRef] [PubMed]
- Ouellet, V.; Weisnagel, S.J.; Marois, J.; Bergeron, J.; Julien, P.; Gougeon, R.; Tchernof, A.; Holub, B.J.; Jacques, H. Dietary cod protein reduces plasma C-reactive protein in insulin-resistant men and women. J. Nutr. 2008, 138, 2386–2391. [Google Scholar] [CrossRef] [PubMed]
- Sun, Y.; Liu, B.; Rong, S.; Zhang, J.; Du, Y.; Xu, G.; Snetselaar, L.G.; Wallace, R.B.; Lehmler, H.-J.; Bao, W. Association of Seafood Consumption and Mercury Exposure With Cardiovascular and All-Cause Mortality Among US Adults. JAMA Netw. Open 2021, 4, e2136367. [Google Scholar] [CrossRef] [PubMed]
- Cusack, L.K.; Smit, E.; Kile, M.L.; Harding, A.K. Regional and temporal trends in blood mercury concentrations and fish consumption in women of child bearing Age in the united states using NHANES data from 1999–2010. Environ. Health 2017, 16, 10. [Google Scholar] [CrossRef] [PubMed]
- Landrigan, P.J.; Stegeman, J.J.; Fleming, L.E.; Allemand, D.; Anderson, D.M.; Backer, L.C.; Brucker-Davis, F.; Chevalier, N.; Corra, L.; Czerucka, D.; et al. Human Health and Ocean Pollution. Ann. Glob. Health 2020, 86, 151. [Google Scholar] [CrossRef]


| First Author, Year Country Cohort | AGE (Range) Men (%) | Sample Size Person-Years Follow-Up (Years) | Cardiovascular Events | Adjusting Factors | Sex: Outcome RR (95% CI) | NOS |
|---|---|---|---|---|---|---|
| Amiano et al., 2015 [23] Spain EPIC | 49.6 (20–69) 37.8% | 41,020 566,076 13.8 | STR: 674 | AGE, CNT, BMI, WST, SMK, PAC, EDU, ALC, NRG, FOD, DRG, HYP, HPL, CVD, MNP, HRT, OCT | M:STR 0.77 (0.57; 1.16) W:STR 1.07 (0.68; 1.69) M:iSTR 1.13 (0.68; 1.88) W:iSTR 1.31 (0.69; 2.47) | 8 |
| Atkins et al., 2014 [24] UK BRHS | 68.2 (60–79) 100% | 3328 37,606 11.3 | CVD *: 327 CVD: 582 CHD: 307 | AGE, NRG, SMK, ALC, PAC, SES, BMI, HDL, SBP, DIA, CRP, VWD | M+W:CVD * 0.66 (0.36; 1.21) M+W:CVD 0.85 (0.52; 1.37) M+W:CHD 0.67 (0.37; 1.21) | 7 |
| Bellavia et al., 2016 [25] Sweden SMC + CSM | 60.1 (45–83) 53.2% | 72,522 1,232,874 17.0 | CVD *: 4899 | AGE, BMI, PAC, SMK, ALC, EDU, NRG, FOD | M+W:CVD * 0.85 (0.76; 0.94) | 6 |
| Bonaccio et al., 2017 [26] Italy Moli-sani | 54.7 (SD 11) 46.0% | 20,969 90,886 4.3 | CVD: 353 CHD: 287 STR: 66 | AGE, SEX, NRG, EDU, SMK, DRG, DIS, GLU, LDL, INF | M+W:CVD 0.60 (0.40; 0.90) M+W:CHD 0.60 (0.38; 0.94) M+W:STR 0.62 (0.26; 1.51) | 8 |
| Gammelmark et al., 2016 [27] Denmark DDCHS | 56.2 (50–64) 49.2% | 57,053 969,901 17.0 | MI: 3028 | SMK, BMI, WST, PAC, ALC, EDU, MNP, DIA, HYP, HPL, NRG, FOD | M:MI:FF 0.93 (0.81; 1.07) M:MI:LF 1.12 (0.97; 1.29) W:MI:FF 0.86 (0.69; 1.08) W:MI:LF 0.99 (0.79; 1.24) | 7 |
| Hengeveld et al., 2018 [28] The Netherlands EPIC | 48.7 (20–70) 25.2% | 34,033 612,594 18.0 | STR: 753 hSTR: 220 iSTR: 413 CHD: 2134 MI: 693 CVD *: 540 | AGE, SEX, PAC, SMK, EDU, BMI, ALC, NRG, SFA, TFA, FOD, FIB | M+W:STR 0.91 (0.79; 1.05) M+W:hSTR 0.79 (0.60; 1.03) M+W:iSTR 0.87 (0.72; 1.05) M+W:CHD 1.03 (0.94; 1.12) M+W:MI 0.97 (0.83; 1.13) M+W:CVD * 0.94 (0.80; 1.10) | 8 |
| Key et al., 2019 [29] Europe EPIC | 57.1 (SD 8.3) 26.0% | 409,885 5,164,551 12.6 | CVD *: 7198 | AGE, SMK, DIA, HYP, HPL, PAC, WRK, EDU, BMI, ALC, NRG, FOD, FIB | M+W:CVD *:FF 0.92 (0.86; 0.99) M+W:CVD *:LF 1.02 (0.94; 1.11) | 8 |
| Kobayashi et al., 2020 [30] Japan JPHC | 56.3 (45–74) 46.6% | 79,904 1,190,570 14.9 | CVD *: 2942 | AGE, CNT, BMI, ALC, NRG, SMK, PAC, FOD, BEV, WRK | M:CVD * 0.83 (0.69; 1.00) W:CVD * 0.94 (0.75; 1.19) | 7 |
| Kondo et al., 2019 [31] Japan NNSJ | 50.0 (30–79) 43.9% | 9115 223,771 24.6 | CVD *: 1070 | AGE, SEX, SMK, NRG | M+W:CVD * 0.72 (0.56; 0.91) | 6 |
| Kuhn et al., 2013 [32] Germany EPIC | 50.6 (35–65) 42.0% | 48,315 393,556 8.1 | MI+MI *: 605 MI: 488 MI *: 117 STR: 525 iSTR: 407 hSTR: 95 | AGE, CNT, SEX, NRG, ALC, BMI, WST, PAC, EDU, SMK, DIA | M+W:MI+MI * 0.84 (0.66; 1.08) M+W:MI 0.78 (0.59; 1.03) M+W:MI * 1.18 (0.68; 2.06) M+W:STR 0.96 (0.73; 1.26) M+W:iSTR 0.87 (0.64; 1.19) M+W:hSTR 1.46 (0.77; 2.78) | 8 |
| Kulezic et al., 2019 [33] Sweden MDCS | 57.8 (SD 7.4) 37.7% | 26,010 781,417 21.7 | PAD: 1122 | AGE, SEX, NRG, DAM, SEA, ALC, PAC, SMK, BMI, EDU, FOD | M+W:PAD 0.92 (0.81; 1.04) | 7 |
| Mohan et al., 2021 [34] World PURE | 50.6 (SD 10.0) 41.7% | 147,541 1,342,623 9.1 | CVD: 8201 MI: 3806 STR: 3925 CVD *: 3102 | AGE, SEX, CNT, BMI, EDU, ALC, PAC, DIA, CNC, DRG, FOD, NRG | M+W:CVD 0.95 (0.86; 1.04) M+W:MI 0.90 (0.78; 1.04) M+W:STR 0.95 (0.83; 1.08) M+W:CVD * 0.94 (0.80; 1.10) | 6 |
| Mohan et al., 2021 [34] World OTT | 66.5 (SD 7.3) 70.3% | 31,491 141,710 4.5 | CVD: 5182 MI: 1552 STR: 1395 CVD *: 2265 | AGE, SEX, CNT, BMI, EDU, ALC, PAC, DIA, CNC, DRG, FOD, NRG, TRT | M+W:CVD 0.91 (0.81; 1.03) M+W:MI 0.86 (0.69; 1.06) M+W:STR 1.25 (1.00; 1.58) M+W:CVD * 0.80 (0.67; 0.96) | 6 |
| Mohan et al., 2021 [34] World ORIGIN | 63.6 (SD 7.8) 65.0% | 12,422 77,016 6.2 | CVD: 2020 MI: 591 STR: 533 CVD *: 1135 | AGE, SEX, CNT, BMI, EDU, ALC, PAC, DIA, CNC, DRG, FOD, NRG, TRT | M+W:CVD 0.87 (0.76; 1.01) M+W:MI 1.16 (0.90; 1.49) M+W:STR 0.82 (0.62; 1.09) M+W:CVD * 0.78 (0.64; 0.94) | 6 |
| Nahab et al., 2020 [35] USA REGARDS | 63.7 (NR) 41.0% | 16,479 83,431 5.1 | CVD: 700 MI: 440 iSTR: 265 CVD *: 291 | AGE, SEX, CNT, ETH, EDU, PAC, SMK, DIS, DRG, NRG, DIA, SBP, HPL | M+W:CVD 1.63 (1.11; 2.40) M+W:CVD 1.09 (0.78; 1.52) M+W:MI 1.48 (0.90; 2.43) M+W:MI 0.87 (0.56; 1.35) M+W:iSTR 1.83 (0.99; 3.39) M+W:iSTR 1.58 (0.95; 2.63) M+W:CVD * 0.74 (0.35; 1.55) M+W:CVD * 1.46 (0.87; 2.45) | 5 |
| Owen et al., 2016 [36] Australia AusDiab | 51.5 (SD 11.2) 44.8% | 11,207 141,208 12.6 | CVD *: 277 | AGE, SEX, CVD, SMK, NRG, PAC, EDU | M:CVD * 0.69 (0.40; 1.20) W:CVD * 0.85 (0.42; 1.73) | 6 |
| Rhee et al., 2017 [37] USA WHS | 54.6 (SD 7.1) 0% | 39,392 713,559 18.1 | CVD: 1941 | TRT, AGE, BMI, SMK, ALC, PAC, OCT, HRT, VIT, NRG, FCD, HYP, CHL, DIA | M+W:CVD 1.00 (0.88; 1.16) | 6 |
| Takata et al., 2013 [38] China SHS | 53.9 (SD 9.3) 45.5% | 80,578 656,662 8.2 | CVD *: 1789 iHD *: 476 iSTR *: 404 hSTR *: 460 | AGE, NRG, INC, WRK, EDU, COM, PAC, FOD, SMK, ALC | M+W:CVD * 0.86 (0.70; 1.05) M+W:iHD * 1.02 (0.74; 1.41) M+W:iSTR * 0.63 (0.41; 0.94) M+W:hSTR * 0.90 (0.43; 1.07) | 7 |
| Van den Brandt et al., 2019 [39] The Netherlands NCS | 61.4 (55–62) 47.9% | 3202 8701 2.2 | CVD *: 733 | AGE, SEX, SMK, HYP, DIA, HGT, BMI, PAC, EDU, ALC, FOD, HRT, VIT | M+W:CVD * 1.45 (1.20; 1.74) | 5 |
| Zhang et al., 2018 [40] USA NIH-AARP | 62.1 (RIQ 57–66) 57.1% | 421,309 6,070,000 14.4 | CVD *: 29,648 | AGE, BMI, ETH, EDU, MAR, SMK, ALC, NRG, FOD, PAC, VIT, DRG, DIA, HYP, CHL | M:CVD * 0.90 (0.85; 0.94) W:CVD * 0.90 (0.83; 0.97) | 7 |
| #RRs | RR (95% CI) | I2 (%) | I2Res. (%) | * p-Value | |
|---|---|---|---|---|---|
| Age | |||||
| <55 years | 11 | 0.95 (0.89; 1.01) | 78.3 | 74.0 | 0.241 |
| ≥55 years | 6 | 0.86 (0.76; 0.98) | 56.8 | ||
| Sex | |||||
| Men | 7 | 0.91 (0.89; 1.01) | 43.5 | 19.60 | 0.888 |
| Women | 7 | 0.86 (0.76; 0.98) | 0.0 | ||
| Geographical area | |||||
| Europe | 7 | 0.96 (0.86; 1.06) | 81.2 | 74.6 | 0.807 |
| Asia-Pacific | 4 | 0.95 (0.78; 1.14) | 78.3 | ||
| USA | 3 | 0.98 (0.75; 1.27) | 79.5 | ||
| World | 3 | 0.89 (0.83; 0.96) | 41.5 | ||
| Publication year | |||||
| <2019 | 8 | 0.90 (0.84; 0.97) | 55.0 | 73.4 | 0.340 |
| ≥2019 | 9 | 0.95 (0.87; 1.04) | 80.4 | ||
| Sample size | |||||
| <30,000 | 8 | 0.91 (0.75; 1.09) | 83.9 | 74.0 | 0.918 |
| ≥30,000 | 9 | 0.93 (0.89; 0.96) | 43.6 | ||
| Adjusting factors | |||||
| <8 factors | 4 | 0.84 (0.77; 0.91) | 0.0 | 70.3 | 0.134 |
| ≥8 factors | 13 | 0.95 (0.90; 1.01) | 75.2 | ||
| With NRG | 15 | 0.91 (0.87; 0.95) | 59.3 | 64.2 | 0.031 |
| Without NRG | 2 | 1.08 (0.57; 2.05) | 86.5 | ||
| With FOD | 11 | 0.93 (0.88; 0.98) | 73.9 | 74.0 | 0.547 |
| Without FOD | 6 | 0.86 (0.69; 1.06) | 74.4 | ||
| With CVD | 11 | 0.97 (0.91; 1.03) | 77.2 | 70.1 | 0.075 |
| Without CVD | 6 | 0.85 (0.79; 0.92) | 21.4 | ||
| NOS score | |||||
| <6 | 2 | 1.37 (1.19; 1.57) | 0.0 | 46.5% | <0.001 |
| ≥6 | 15 | 0.90 (0.87; 0.94) | 48.3 | ||
| <7 | 9 | 0.95 (0.85; 1.06) | 81.7 | 74.1 | 0.469 |
| ≥7 | 8 | 0.92 (0.88; 0.97) | 50.1 |
Disclaimer/Publisher’s Note: The statements, opinions and data contained in all publications are solely those of the individual author(s) and contributor(s) and not of MDPI and/or the editor(s). MDPI and/or the editor(s) disclaim responsibility for any injury to people or property resulting from any ideas, methods, instructions or products referred to in the content. |
© 2023 by the authors. Licensee MDPI, Basel, Switzerland. This article is an open access article distributed under the terms and conditions of the Creative Commons Attribution (CC BY) license (https://creativecommons.org/licenses/by/4.0/).
Share and Cite
Ricci, H.; Gaeta, M.; Franchi, C.; Poli, A.; Battino, M.; Dolci, A.; Schmid, D.; Ricci, C. Fish Intake in Relation to Fatal and Non-Fatal Cardiovascular Risk: A Systematic Review and Meta-Analysis of Cohort Studies. Nutrients 2023, 15, 4539. https://doi.org/10.3390/nu15214539
Ricci H, Gaeta M, Franchi C, Poli A, Battino M, Dolci A, Schmid D, Ricci C. Fish Intake in Relation to Fatal and Non-Fatal Cardiovascular Risk: A Systematic Review and Meta-Analysis of Cohort Studies. Nutrients. 2023; 15(21):4539. https://doi.org/10.3390/nu15214539
Chicago/Turabian StyleRicci, Hannah, Maddalena Gaeta, Carlotta Franchi, Andrea Poli, Maurizio Battino, Alberto Dolci, Daniela Schmid, and Cristian Ricci. 2023. "Fish Intake in Relation to Fatal and Non-Fatal Cardiovascular Risk: A Systematic Review and Meta-Analysis of Cohort Studies" Nutrients 15, no. 21: 4539. https://doi.org/10.3390/nu15214539
APA StyleRicci, H., Gaeta, M., Franchi, C., Poli, A., Battino, M., Dolci, A., Schmid, D., & Ricci, C. (2023). Fish Intake in Relation to Fatal and Non-Fatal Cardiovascular Risk: A Systematic Review and Meta-Analysis of Cohort Studies. Nutrients, 15(21), 4539. https://doi.org/10.3390/nu15214539