
A Randomized Controlled Pilot Study of the Food Order Behavioral Intervention in Prediabetes

 ,
,
Abstract
1. Introduction
2. Materials and Methods
2.1. Study Design
2.2. Participants and Recruitment
2.3. Intervention Overview
2.3.1. Standard Counseling
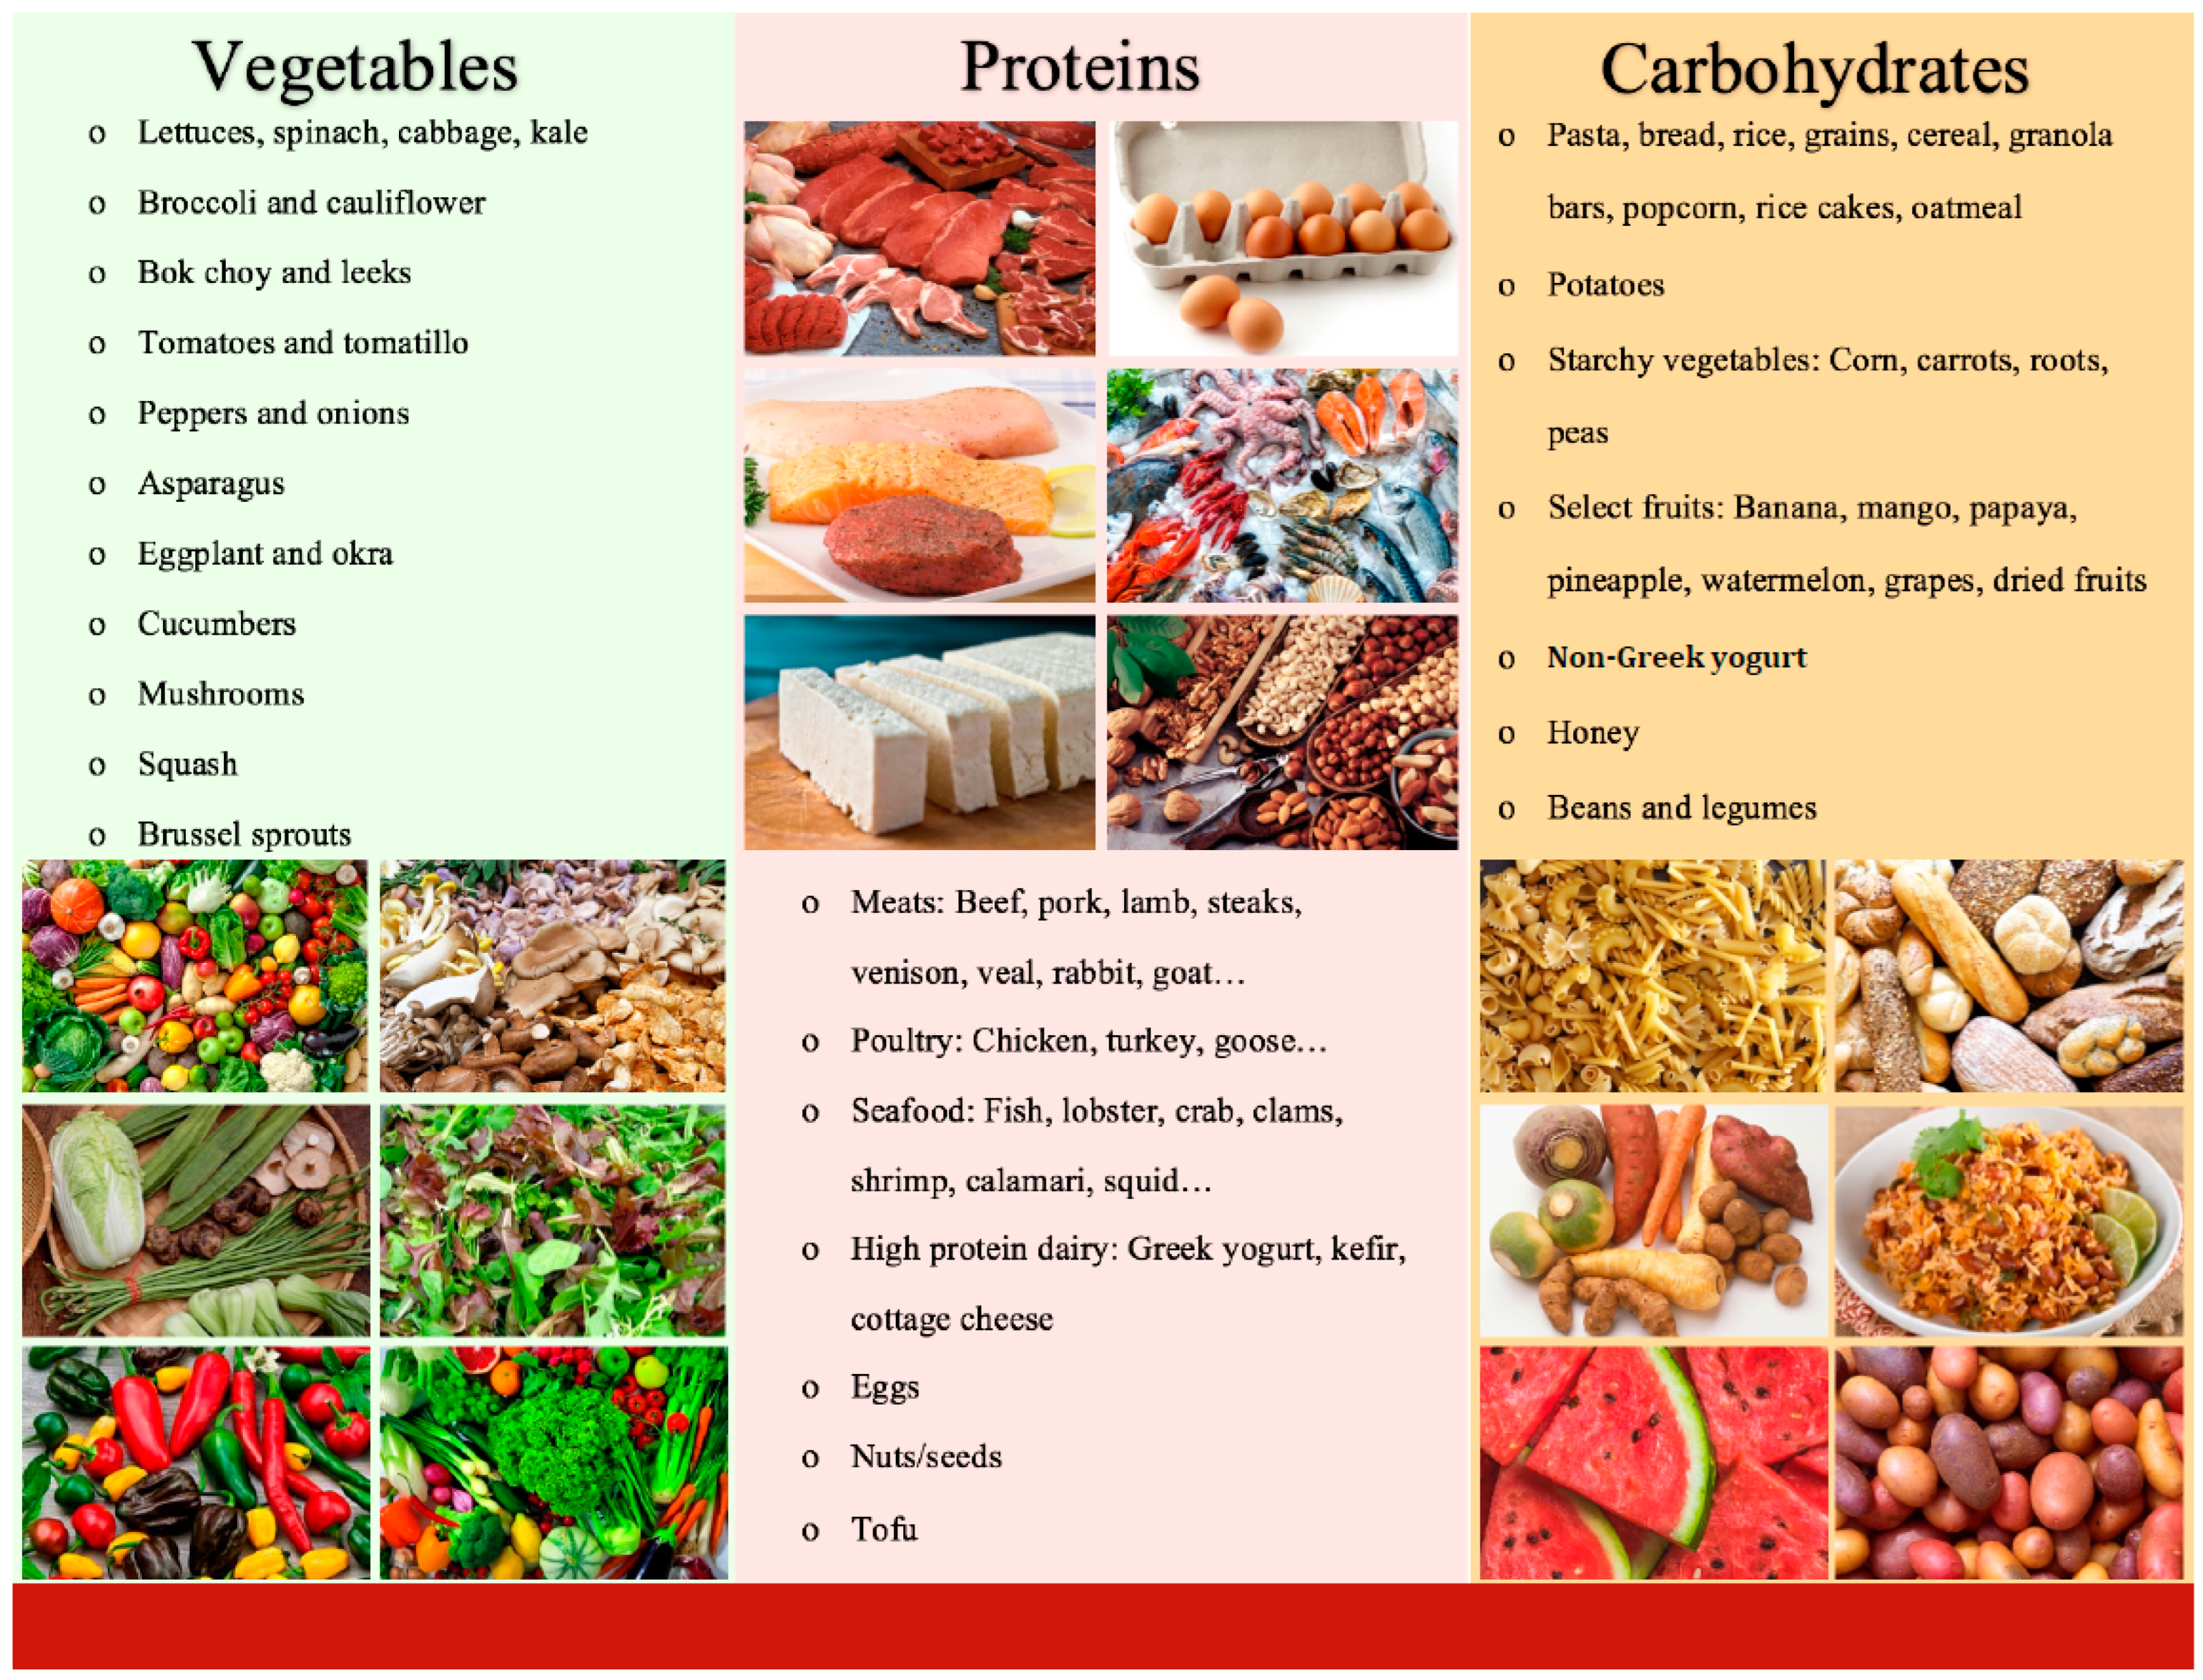
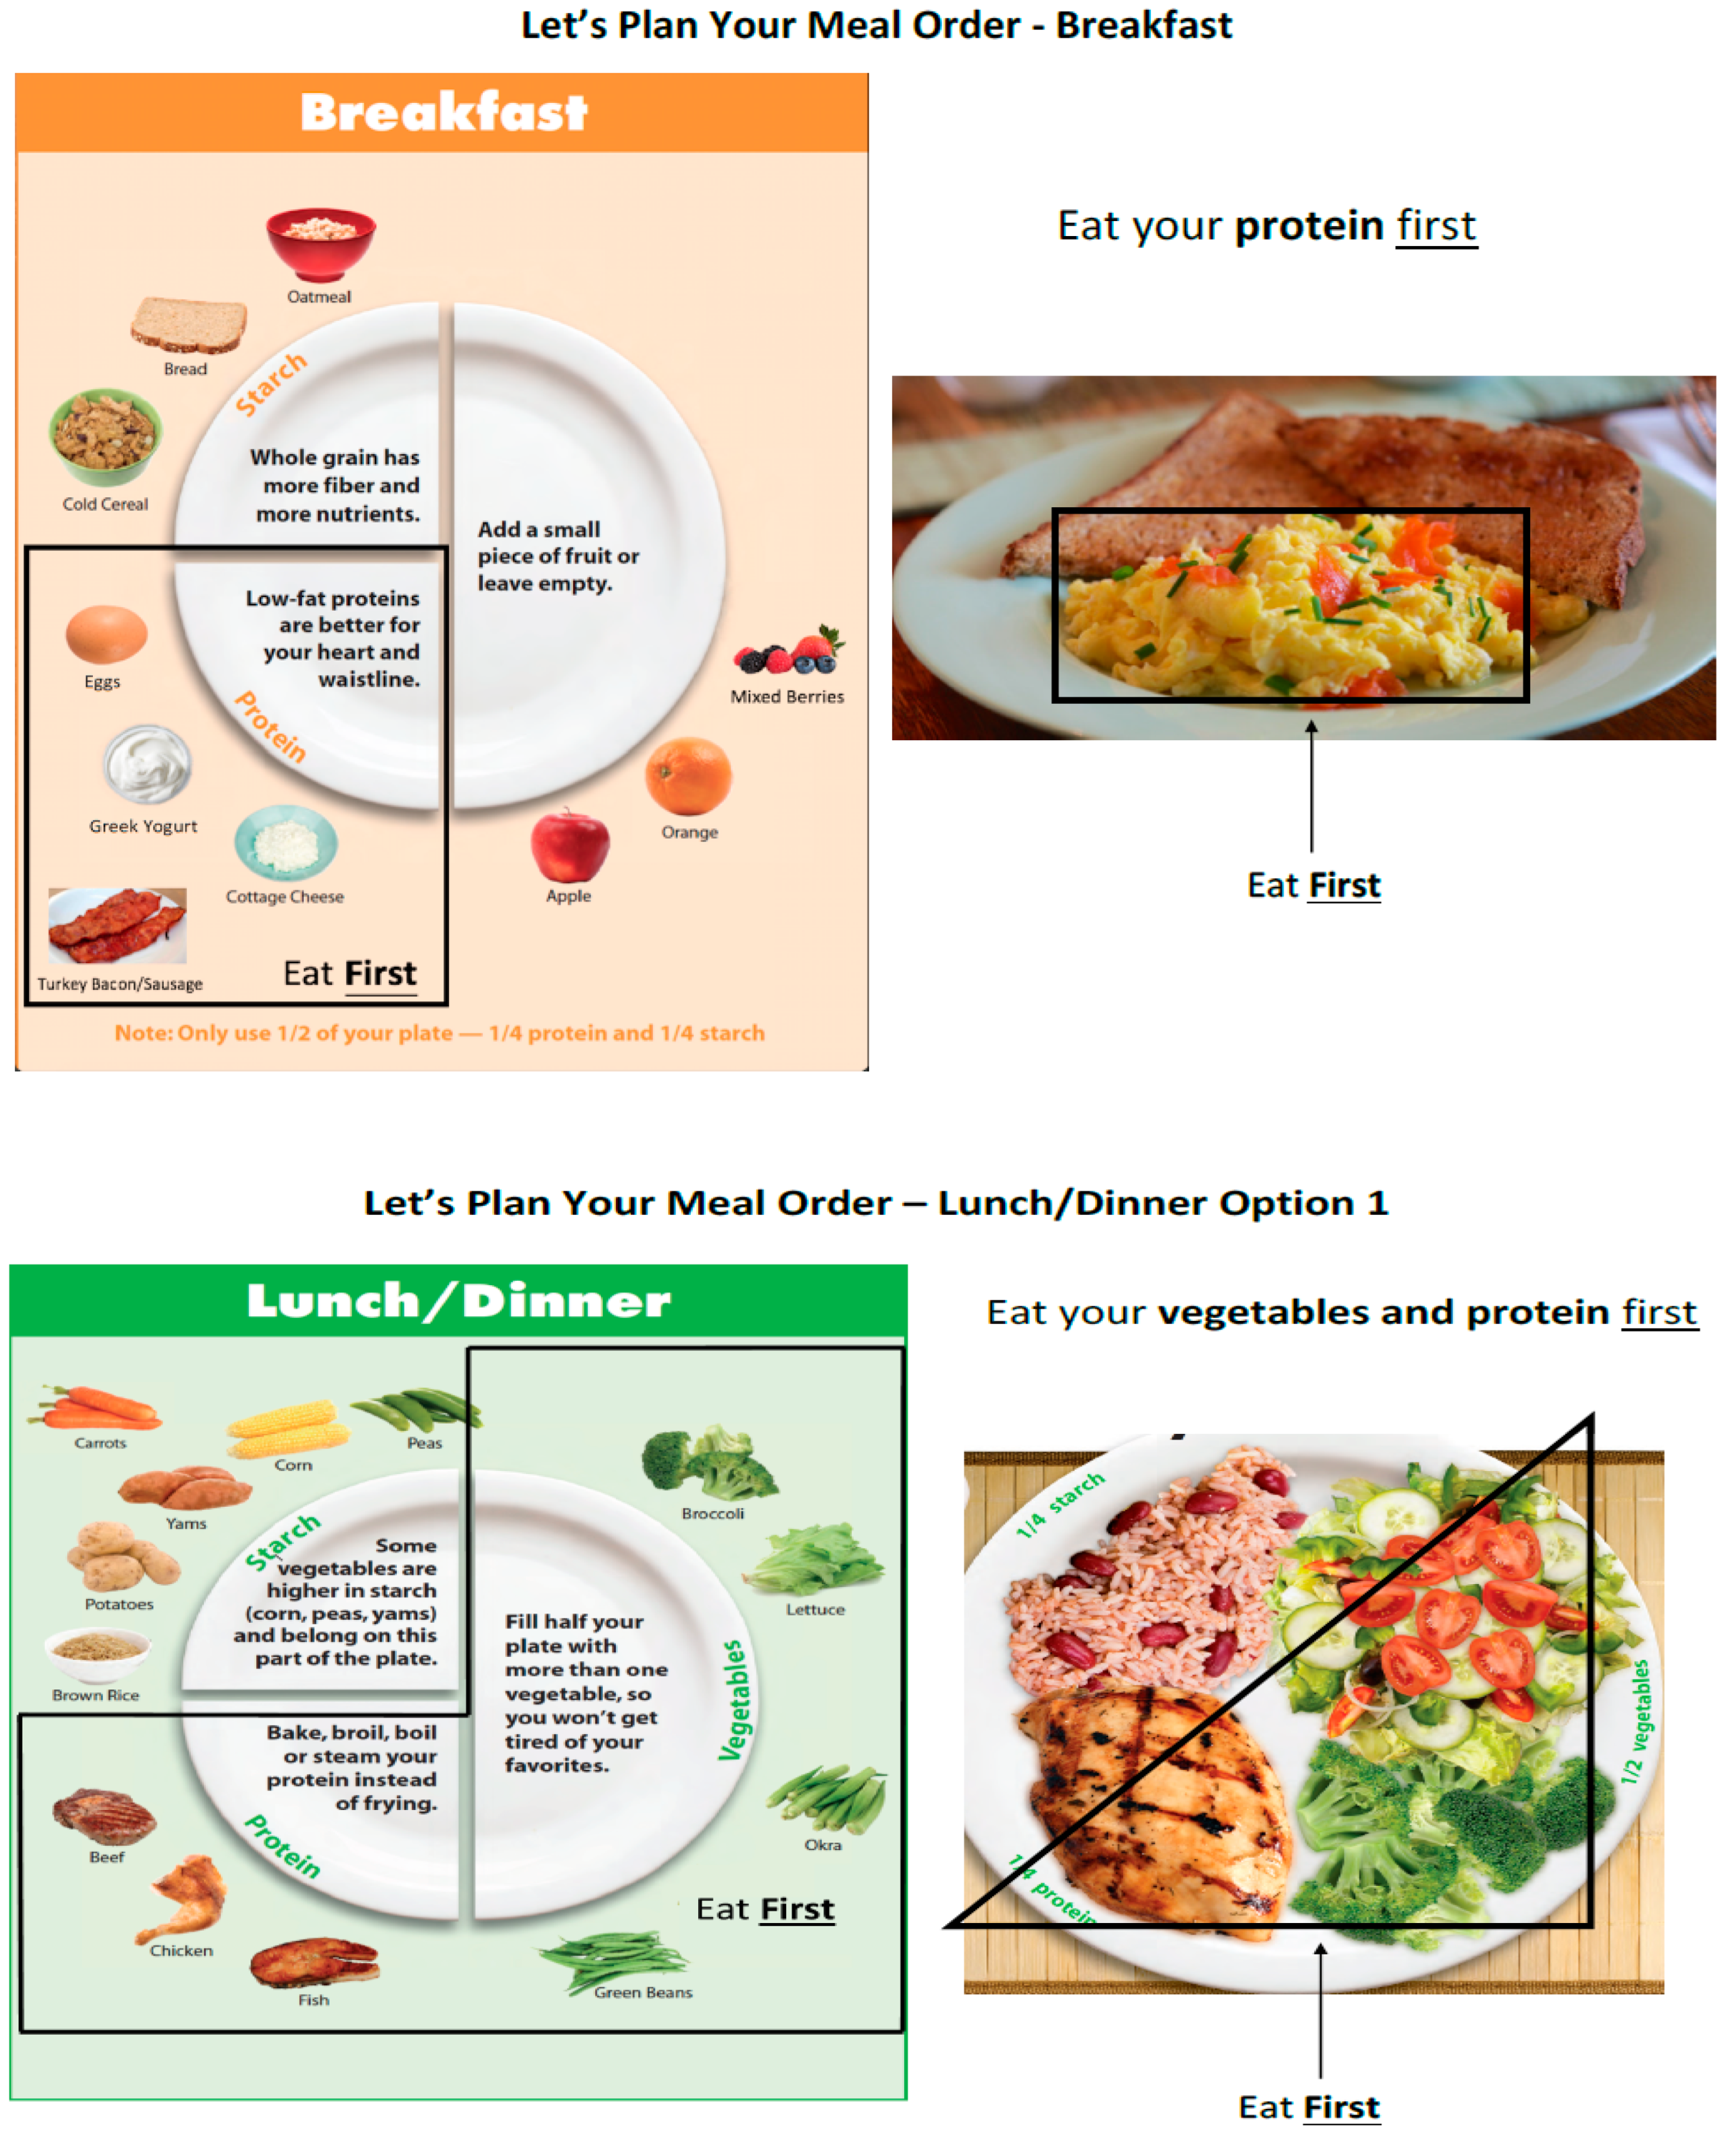
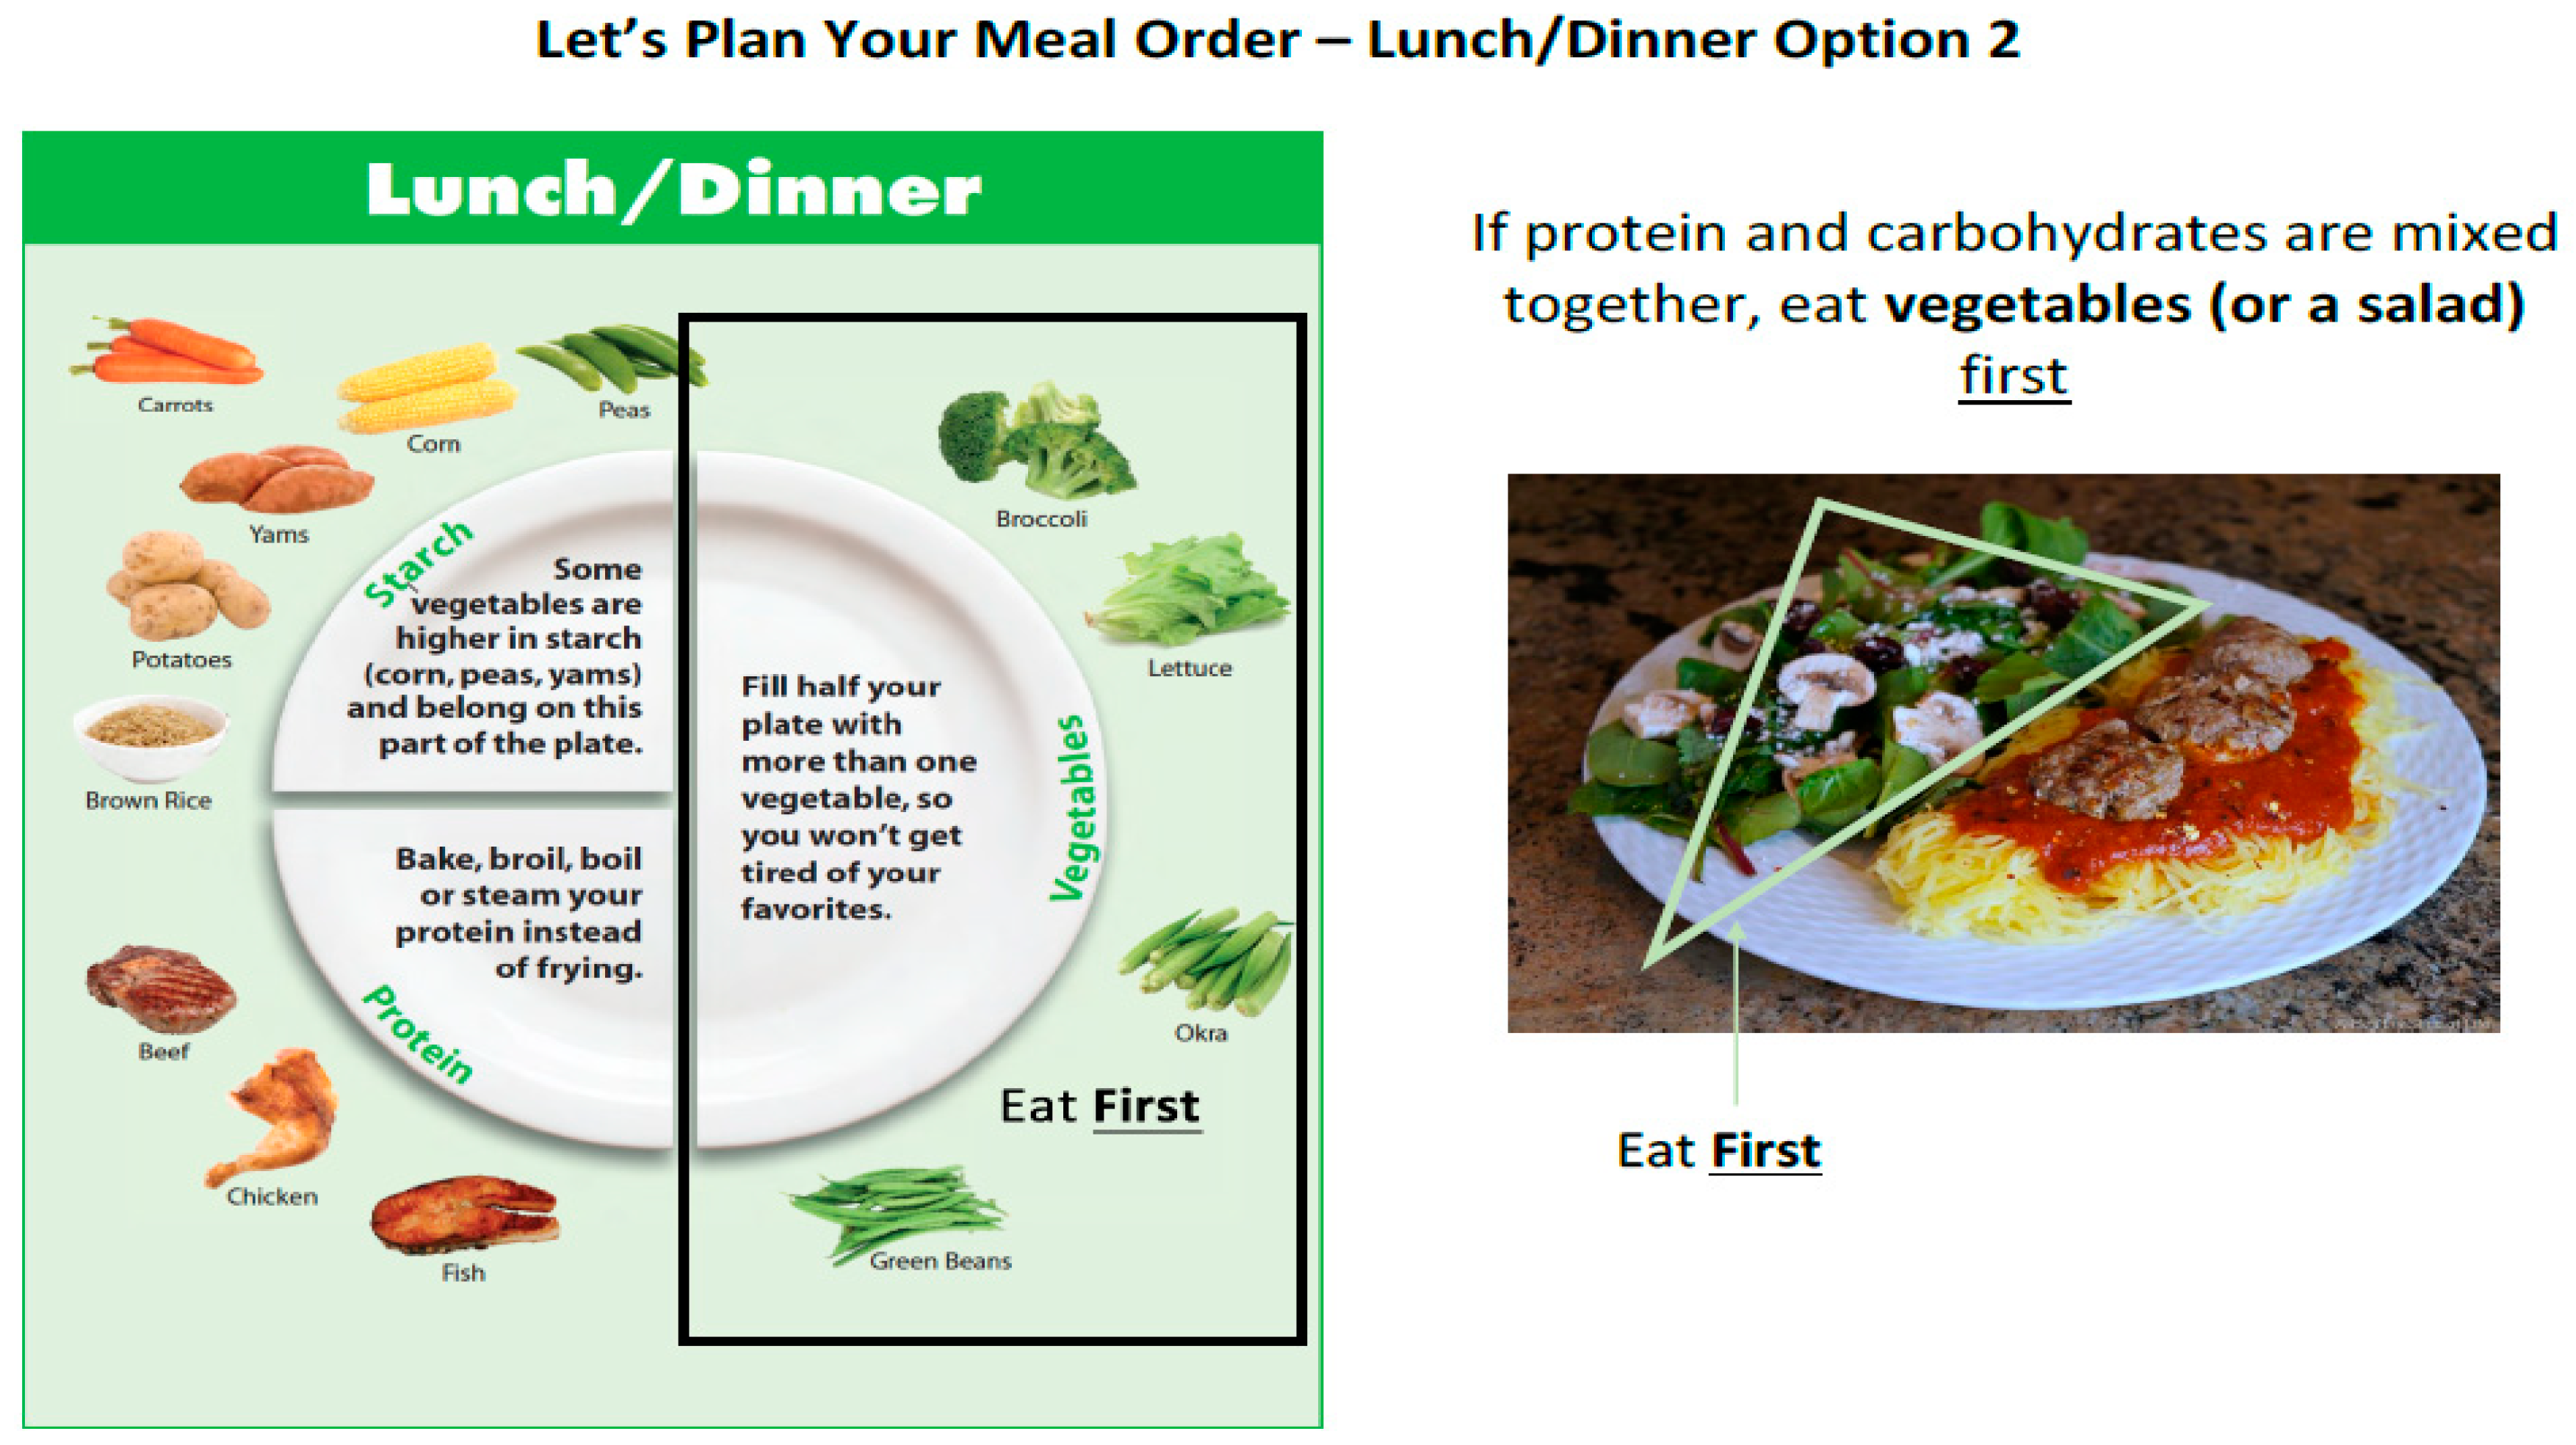
2.3.2. Food Order Counseling
2.4. Measures
2.4.1. Oral Glucose Tolerance Test
2.4.2. Dietary Intake Records
2.4.3. Physical Activity
2.4.4. Statistical Analysis
3. Results
4. Discussion
5. Conclusions
Supplementary Materials
Author Contributions
Funding
Institutional Review Board Statement
Informed Consent Statement
Data Availability Statement
Acknowledgments
Conflicts of Interest
References
- Prevalence of Prediabetes Among Adults. Available online: https://www.cdc.gov/diabetes/data/statistics-report/prevalence-of-prediabetes.html (accessed on 18 October 2023).
- Blond, M.B.; Færch, K.; Herder, C.; Ziegler, D.; Stehouwer, C.D.A. The prediabetes conundrum: Striking the balance between risk and resources. Diabetologia 2023. ahead of print. [Google Scholar] [CrossRef] [PubMed]
- Ligthart, S.; van Herpt, T.T.; Leening, M.J.; Kavousi, M.; Hofman, A.; Stricker, B.H.; van Hoek, M.; Sijbrands, E.J.; Franco, O.H.; Dehghan, A. Lifetime risk of developing impaired glucose metabolism and eventual progression from prediabetes to type 2 diabetes: A prospective cohort study. Lancet Diabetes Endocrinol. 2016, 4, 44–51. [Google Scholar] [CrossRef] [PubMed]
- Schlesinger, S.; Neuenschwander, M.; Barbaresko, J.; Lang, A.; Maalmi, H.; Rathmann, W.; Roden, M.; Herder, C. Prediabetes and risk of mortality, diabetes-related complications and comorbidities: Umbrella review of meta-analyses of prospective studies. Diabetologia 2022, 65, 275–285. [Google Scholar] [CrossRef] [PubMed]
- Stefan, N.; Fritsche, A.; Schick, F.; Häring, H.U. Phenotypes of prediabetes and stratification of cardiometabolic risk. Lancet Diabetes Endocrinol. 2016, 4, 789–798. [Google Scholar] [CrossRef]
- Knowler, W.C.; Barrett-Connor, E.; Fowler, S.E.; Hamman, R.F.; Lachin, J.M.; Walker, E.A.; Nathan, D.M. Diabetes Prevention Program Research Group. Reduction in the incidence of type 2 diabetes with lifestyle intervention or metformin. N. Engl. J. Med. 2002, 346, 393–403. [Google Scholar] [PubMed]
- Li, G.; Zhang, P.; Wang, J.; Gregg, E.W.; Yang, W.; Gong, Q.; Li, H.; Li, H.; Jiang, Y.; An, Y.; et al. The long-term effect of lifestyle interventions to prevent diabetes in the China Da Qing diabetes prevention study: A 20-year follow-up study. Lancet 2008, 371, 1783–1789. [Google Scholar] [CrossRef] [PubMed]
- Tabák, A.G.; Herder, C.; Rathmann, W.; Brunner, E.J.; Kivimäki, M. Prediabetes: A high-risk state for diabetes development. Lancet 2012, 379, 2279–2290. [Google Scholar] [CrossRef]
- Lindström, J.; Ilanne-Parikka, P.; Peltonen, M.; Aunola, S.; Eriksson, J.G.; Hemiö, K.; Hämäläinen, H.; Härkönen, P.; Keinänen-Kiukaanniemi, S.; Laakso, M.; et al. Sustained reduction in the incidence of type 2 diabetes by lifestyle intervention: Follow-up of the Finnish diabetes prevention study. Lancet 2006, 368, 1673–1679. [Google Scholar] [CrossRef]
- ElSayed, N.A.; Aleppo, G.; Aroda, V.R.; Bannuru, R.R.; Brown, F.M.; Bruemmer, D.; Collins, B.S.; Hilliard, M.E.; Isaacs, D.; Johnson, E.L.; et al. Facilitating Positive Health Behaviors and Well-being to Improve Health Outcomes: Standards of Care in Diabetes-2023. Diabetes Care 2023, 46 (Suppl. S1), S68–S96. [Google Scholar] [CrossRef]
- Kumar, N.K.; Merrill, J.D.; Carlson, S.; German, J.; Yancy, W.S., Jr. Adherence to Low-Carbohydrate Diets in Patients with Diabetes: A Narrative Review. Diabetes Metab. Syndr. Obes. 2022, 15, 477–498. [Google Scholar] [CrossRef]
- Small, D.M.; Jones-Gotman, M.; Dagher, A. Feeding-induced dopamine release in dorsal striatum correlates with meal pleasantness ratings in healthy human volunteers. Neuroimage 2003, 19, 1709–1715. [Google Scholar] [CrossRef] [PubMed]
- Imai, S.; Fukui, M.; Kajiyama, S. Effect of eating vegetables before carbohydrates on glucose excursions in patients with type 2 diabetes. J. Clin. Biochem. Nutr. 2014, 54, 7–11. [Google Scholar] [CrossRef] [PubMed][Green Version]
- Shukla, A.P.; Iliescu, R.G.; Thomas, C.E.; Aronne, L.J. Food order has a significant impact on postprandial glucose and insulin levels. Diabetes Care. 2015, 38, e98–e99. [Google Scholar] [CrossRef] [PubMed]
- Shukla, A.P.; Andono, J.; Touhamy, S.H.; Casper, A.; Iliescu, R.G.; Mauer, E.; Zhu, Y.S.; Ludwig, D.S.; Aronne, L.J. Carbohydrate-last meal pattern lowers postprandial glucose and insulin excursions in type 2 diabetes. BMJ Open Diabetes Res. Care 2017, 5, e000440. [Google Scholar] [CrossRef]
- Ferguson, B.K.; Wilson, P.B. Ordered Eating and Its Effects on Various Postprandial Health Markers: A Systematic Review. J. Am. Nutr. Assoc. 2022. ahead of print. [Google Scholar] [CrossRef]
- Shukla, A.P.; Mauer, E.; Igel, L.I.; Truong, W.; Casper, A.; Kumar, R.B.; Saunders, K.H.; Aronne, L.J. Effect of Food Order on Ghrelin Suppression. Diabetes Care 2018, 41, e76–e77. [Google Scholar] [CrossRef]
- Shukla, A.P.; Dickison, M.; Coughlin, N.; Karan, A.; Mauer, E.; Truong, W.; Casper, A.; Emiliano, A.B.; Kumar, R.B.; Saunders, K.H.; et al. The impact of food order on postprandial glycaemic excursions in prediabetes. Diabetes Obes. Metab. 2019, 21, 377–381. [Google Scholar] [CrossRef]
- Available online: choosemyplate.gov (accessed on 18 October 2023).
- Patarrao, R.; Lautt, W.; Macedo, M. Assessment of methods and indexes of insulin sensitivity. Rev. Port. Endocrinol. Diabetes Metab. 2014, 9, 65–73. [Google Scholar] [CrossRef]
- Utzschneider, K.M.; Prigeon, R.L.; Faulenbach, M.V.; Tong, J.; Carr, D.B.; Boyko, E.J.; Leonetti, D.L.; McNeely, M.J.; Fujimoto, W.Y.; Kahn, S.E. Oral disposition index predicts the development of future diabetes above and beyond fasting and 2-h glucose levels. Diabetes Care 2009, 32, 335–341, Erratum in Diabetes Care 2009, 32, 1355. [Google Scholar] [CrossRef]
- Available online: esha.com/wp-content/uploads/2018/02/MyPlate.pdf (accessed on 18 October 2023).
- Godin, G. The Godin-Shephard leisure-time physical activity questionnaire. Health Fit. J. Can. 2011, 4, 18–22. [Google Scholar]
- He, F.J.; Nowson, C.A.; Lucas, M.; MacGregor, G.A. Increased consumption of fruit and vegetables is related to a reduced risk of coronary heart disease: Meta-analysis of cohort studies. J. Human Hypertens. 2007, 21, 717–728. [Google Scholar] [CrossRef] [PubMed]
- He, F.J.; Nowson, C.A.; MacGregor, G.A. Fruit and vegetable consumption and stroke: Meta-analysis of cohort studies. Lancet 2006, 367, 320–326. [Google Scholar] [CrossRef] [PubMed]
- World Cancer Research Fund; American Insitute for Cancer Research. Food, Nutrition, Physical Activity and the Prevention of Cancer: A Global Perspective; AICR: Washington, DC, USA, 2007. [Google Scholar]
- Aune, D.; Giovannucci, E.; Boffetta, P.; Fadnes, L.T.; Keum, N.; Norat, T.; Greenwood, D.C.; Riboli, E.; Vatten, L.J.; Tonstad, S. Fruit and vegetable intake and the risk of cardiovascular disease, total cancer and all-cause mortality-a systematic review and dose-response meta-analysis of prospective studies. Int. J. Epidemiol. 2017, 46, 1029–1056. [Google Scholar] [CrossRef] [PubMed]
- Lee-Kwan, S.H.; Moore, L.V.; Blanck, H.M.; Harris, D.M.; Galuska, D. Disparities in State-Specific Adult Fruit and Vegetable Consumption—United States, 2015. MMWR Morb. Mortal. Wkly. Rep. 2017, 66, 1241–1247. [Google Scholar] [CrossRef] [PubMed]
- Bersoux, S.; Asbury, K.L.; Cook, C.B.; Verheijde, J.L.; Larson, M.H.; Aponte-Furlow, R.T.; Flatten, S.S.; Hooley, S.A.; LaRosa, C.S.; Seifert, K.M.; et al. An outpatient-based clinical program for type 2 diabetes prevention. Endocr. Pract. 2010, 16, 21–29. [Google Scholar] [CrossRef]
- Tricò, D.; Filice, E.; Trifirò, S.; Natali, A. Manipulating the sequence of food ingestion improves glycemic control in type 2 diabetic patients under free-living conditions. Nutr. Diabetes 2016, 6, e226. [Google Scholar] [CrossRef]
- González-Monroy, C.; Gómez-Gómez, I.; Olarte-Sánchez, C.M.; Motrico, E. Eating Behaviour Changes during the COVID-19 Pandemic: A Systematic Review of Longitudinal Studies. Int. J. Environ. Res. Public Health 2021, 18, 11130. [Google Scholar] [CrossRef]
- Bennett, G.; Young, E.; Butler, I.; Coe, S. The Impact of Lockdown During the COVID-19 Outbreak on Dietary Habits in Various Population Groups: A Scoping Review. Front. Nutr. 2021, 8, 626432. [Google Scholar] [CrossRef]


| Outcome | Group | p-Values | |
|---|---|---|---|
| Food Order (N = 18) | Control (N = 21) | ||
| Mean (SD) or Freq. (%) | Mean (SD) or Freq. (%) | ||
| Age (Years) | 60.2 (14.4) | 60.4 (10.3) | 0.959 |
| Female | 12 (66.7%) | 10 (47.6%) | 0.232 |
| Hispanic/Latino | 0 (0%) | 2 (9.5%) | 0.344 |
| Race | 0.690 | ||
| Asian | 0 (0%) | 2 (9.5%) | |
| Black/African American | 3 (16.7%) | 4 (19.1%) | |
| White | 13 (72.2%) | 14 (66.7%) | |
| Other | 2 (11.1%) | 1 (4.8%) | |
| Weight (pounds) | 190.8 (25.9) | 191.1 (31.1) | 0.974 |
| HbA1c | 6.0 (0.2) | 6.0 (0.2) | 0.917 |
| Calories (kcal) | 1972.2 (646.6) | 2131.8 (548.7) | 0.409 |
| Fat (g) | 89.7 (33.2) | 89.0 (28.4) | 0.945 |
| Protein (g) | 94.8 (33.9) | 94.2 (30.8) | 0.954 |
| Carbohydrates (g) | 190.3 (83.4) | 234.8 (65.9) | 0.071 |
| Dietary Fiber (g) | 18.3 (6.4) | 24.9 (10.6) | 0.023 |
| Food Group Intake b | |||
| Grains (oz) | 5.1 (3.5) | 5.9 (3.1) | 0.427 |
| Vegetables (cup) | 1.9 (1.0) | 2.4 (1.6) | 0.281 |
| Fruits (cup) | 1.0 (1.1) | 1.5 (1.1) | 0.126 |
| Dairy (cup) | 1.2 (0.8) | 1.6 (1.1) | 0.297 |
| Protein Foods (oz) | 8.7 (4.6) | 7.2 (4.3) | 0.322 |
| Physical Activity Score c | 36.4 (24.1) | 29.5 (19.2) a | 0.345 |
| All Participants | Pre-COVID Participants Only | |||||||||
|---|---|---|---|---|---|---|---|---|---|---|
| Outcome | Group | p-Values | Group | p-Values | ||||||
| Food Order (N = 18) | Control (N = 21) | Food Order (N = 12) | Control (N = 12) | |||||||
| Mean (SD) or Freq. (%) | Mean (SD) or Freq. (%) | Food Order vs. Control | Within Food Order | Within Control | Mean (SD) or Freq. (%) | Mean (SD) or Freq. (%) | Food Order vs. Control | Within Food Order | Within Control | |
| Weight (lbs.) | −3.6 (5.7) | −2.6 (6.8) | 0.625 | 0.017 | 0.102 | −5.9 (5.3) | −1.0 (6.8) | 0.065 | 0.003 | 0.608 |
| Weight (%) | −1.8 (2.8) | −1.6 (3.5) | 0.839 | 0.012 | 0.048 | −3.0 (2.5) | −0.9 (3.4) | 0.097 | 0.001 | 0.366 |
| Total Cholesterol (mg/dL) | 6.1 (28.0) a | −1.7 (24.2) | 0.364 | 0.382 | 0.756 | 2.3 (29.4) a | −0.4 (22.0) | 0.805 | 0.803 | 0.949 |
| Total Cholesterol (%) | 5.0 (16.9) a | 0.8 (14.2) | 0.410 | 0.237 | 0.790 | 3.7 (18.3) a | 1.0 (14.6) | 0.691 | 0.513 | 0.822 |
| HDL (mg/dL) | 2.9 (13.5) | 1.6 (7.2) | 0.713 | 0.375 | 0.327 | 5.6 (14.3) | 2.0 (6.8) | 0.446 | 0.205 | 0.331 |
| HDL (%) | 9.6 (29.6) | 4.6 (16.5) | 0.532 | 0.186 | 0.211 | 16.4 (31.1) | 7.1 (16.3) | 0.369 | 0.095 | 0.160 |
| LDL (mg/dL) | 1.1 (25.7) b | −0.5 (15.9) c | 0.823 | 0.863 | 0.898 | −8.3 (23.9) b | −3.7 (17.2) | 0.603 | 0.301 | 0.475 |
| LDL (%) | 3.0 (23.8) b | 1.8 (16.6) c | 0.867 | 0.623 | 0.638 | −3.8 (24.5) b | −2.2 (16.9) | 0.864 | 0.639 | 0.658 |
| Triglycerides (mg/dL) | −4.9 (41.2) b | −2.3 (28.5) c | 0.823 | 0.639 | 0.734 | −5.5 (18.7) b | 5.6 (24.8) | 0.258 | 0.376 | 0.452 |
| Triglycerides (%) | −1.0 (31.2) b | 0.3 (28.0) c | 0.894 | 0.896 | 0.963 | −5.7 (22.5) b | 8.4 (27.2) | 0.205 | 0.442 | 0.308 |
| HbA1c | −0.1 (0.2) | −0.03 (0.3) | 0.364 | 0.054 | 0.605 | −0.1 (0.2) | 0.03 (0.3) | 0.176 | 0.091 | 0.720 |
| HbA1c (%) | −1.8 (3.8) | −0.5 (4.9) | 0.363 | 0.056 | 0.627 | −2.1 (3.9) | 0.6 (5.3) | 0.177 | 0.091 | 0.722 |
| 2−Hour Glucose (mg/dL) | 2.5 (27.5) d | 1.3 (31.7) | 0.911 | 0.739 | 0.849 | −0.7 (25.0) a | 3.9 (39.9) | 0.744 | 0.925 | 0.740 |
| 2−Hour Glucose (%) | 4.0 (22.7) d | 0.9 (20.8) | 0.681 | 0.522 | 0.844 | 1.5 (20.2) a | 2.8 (25.3) | 0.891 | 0.814 | 0.709 |
| Glucose AUC 0-120 (mg/dL) | −1073.4 (4236.0) b | −200.7 (2819.5) | 0.457 | 0.327 | 0.748 | −178.6 (2429.7) a | 120.0 (3205.8) | 0.805 | 0.812 | 0.899 |
| Glucose AUC (%) | −5.9 (25.5) b | −1.4 (14.8) | 0.535 | 0.367 | 0.661 | −0.3 (15.4) a | 0.2 (16.4) | 0.940 | 0.942 | 0.974 |
| HOMA-IR | 0.3 (1.4) b | 0.5 (2.4) | 0.746 | 0.396 | 0.341 | 0.1 (1.0) a | 1.2 (2.2) | 0.119 | 0.804 | 0.080 |
| HOMA-IR (%) | 18.2 (58.9) b | 26.0 (60.6) | 0.695 | 0.237 | 0.063 | 10.7 (27.6) a | 43.4 (61.6) | 0.117 | 0.226 | 0.033 |
| Matsuda Index | −0.2 (1.2) d | −0.2 (1.0) e | 0.975 | 0.531 | 0.312 | −0.03 (0.9) a | −0.4 (1.0) | 0.384 | 0.906 | 0.213 |
| Matsuda Index (%) | 2.3 (32.4) d | −4.1 (25.8) e | 0.523 | 0.792 | 0.484 | 5.9 (28.4) a | −9.4 (22.7) | 0.169 | 0.510 | 0.181 |
| Insulinogenic Index | 0.2 (1.1) d | 0.2 (0.7) e | 0.985 | 0.424 | 0.136 | 0.4 (1.0) a | 0.3 (0.6) | 0.744 | 0.242 | 0.140 |
| Insulinogenic Index (%) | 49.5 (106.0) d | −1.0 (135.0) e | 0.251 | 0.104 | 0.974 | 37.8 (82.3) a | 20.8 (50.4) | 0.552 | 0.159 | 0.181 |
| Disposition Index | 0.9 (3.0) d | 0.7 (2.5) e | 0.825 | 0.277 | 0.227 | 1.1 (3.3) a | 0.4 (1.8) | 0.567 | 0.316 | 0.455 |
| Disposition Index (%) | 38.4 (75.6) d | −3.9 (142.7) e | 0.272 | 0.080 | 0.905 | 44.4 (81.6) a | 12.5 (60.1) | 0.295 | 0.101 | 0.486 |
| Godin Score | −2.7 (15.6) | −1.0 (19.1) c | 0.766 | 0.469 | 0.822 | −3.8 (16.8) | 3.3 (22.3) | 0.386 | 0.445 | 0.620 |
| Godin Score (%) | 25.8 (98.2) | 11.8 (110.8) a | 0.695 | 0.280 | 0.666 | 34.6 (118.7) | 37.5 (128.1) a | 0.956 | 0.334 | 0.355 |
| All Participants | Pre-COVID Participants Only | |||||||||
|---|---|---|---|---|---|---|---|---|---|---|
| Outcome | Group | p-Values | Group | p-Values | ||||||
| Food Order (N = 18) | Control (N = 21) | Food Order (N = 12) | Control (N = 12) | |||||||
| Mean (SD) or Freq. (%) | Mean (SD) or Freq. (%) | Food Order vs. Control | Within Food Order | Within Control | Mean (SD) or Freq. (%) | Mean (SD) or Freq. (%) | Food Order vs. Control | Within Food Order | Within Control | |
| Calories (kcal) | −64.8 (593.8) | −292.2 (505.9) | 0.205 | 0.649 | 0.016 | −62.4 (516.5) | −344.2 (478.3) | 0.180 | 0.684 | 0.030 |
| Fat (g) | −0.6 (36.8) | −13.0 (25.4) | 0.219 | 0.950 | 0.029 | 12.5 (29.8) | −18.8 (26.5) | 0.013 | 0.173 | 0.032 |
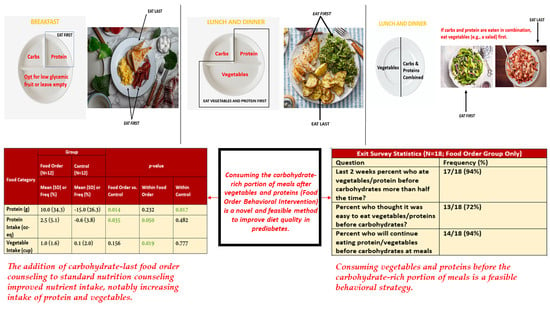
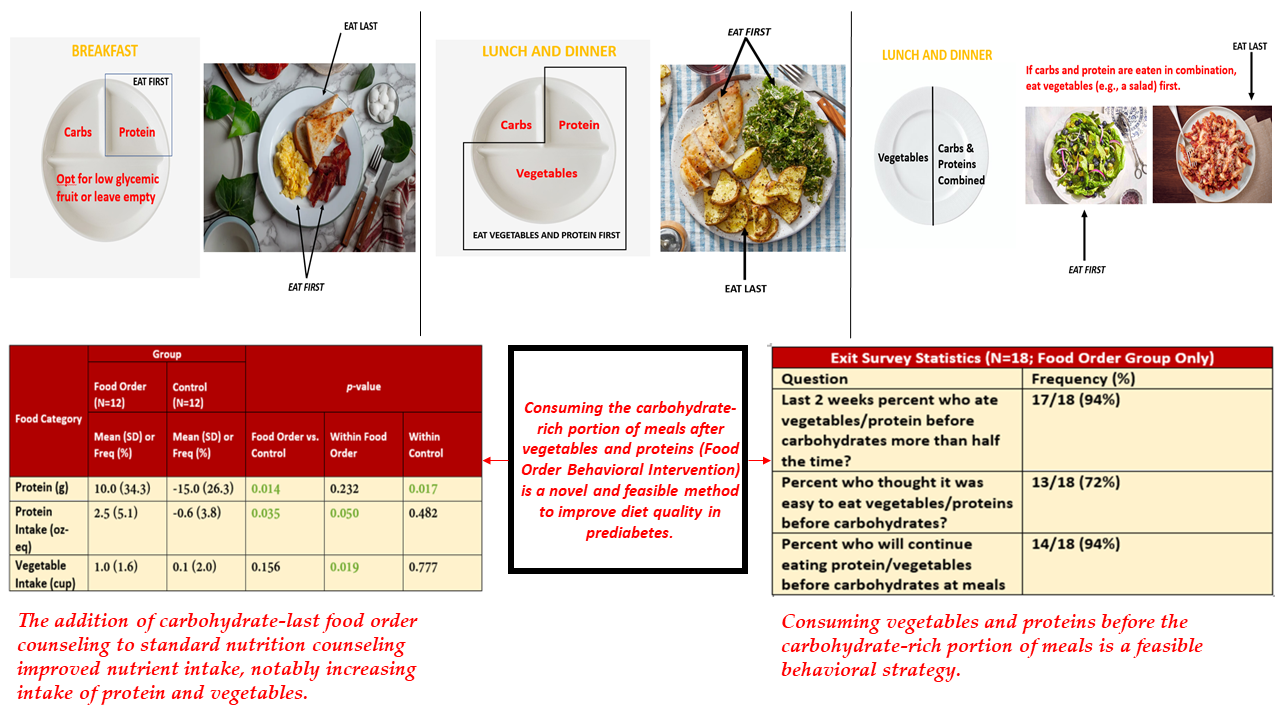
| Protein (g) | 10.0 (34.3) | −15.0 (26.3) | 0.014 | 0.232 | 0.017 | 8.5 (37.8) | −16.5 (28.7) | 0.082 | 0.452 | 0.072 |
| Carbohydrates (g) | −25.1 (81.4) | −29.7 (76.7) | 0.856 | 0.208 | 0.091 | −45.2 (56.8) | −35.4 (73.2) | 0.717 | 0.019 | 0.122 |
| Dietary Fiber (g) | 0.5 (8.3) | −1.6 (10.2) | 0.474 | 0.786 | 0.469 | 0.5 (6.1) | −4.3 (8.8) | 0.134 | 0.794 | 0.115 |
| Grain Intake (oz) | −1.1 (4.1) | −1.0 (1.9) | 0.927 | 0.275 | 0.027 | −1.8 (2.8) | −1.1 (2.2) | 0.469 | 0.045 | 0.123 |
| Vegetable Intake (cup) | 1.0 (1.6) | 0.1 (2.0) | 0.156 | 0.019 | 0.777 | 1.0 (1.5) | −0.4 (1.4) | 0.024 | 0.041 | 0.301 |
| Fruit Intake (cup) | −0.1 (1.3) | 0.2 (1.1) | 0.523 | 0.804 | 0.480 | −0.3 (1.5) | 0.4 (1.2) | 0.257 | 0.521 | 0.319 |
| Dairy Intake (cup) | −0.2 (0.7) | −0.4 (0.9) | 0.456 | 0.257 | 0.051 | −0.2 (0.7) | −0.5 (1.1) | 0.326 | 0.467 | 0.116 |
| Protein Intake (oz) | 2.5 (5.1) | −0.6 (3.8) | 0.035 | 0.050 | 0.482 | 2.5 (5.3) | −0.1 (3.7) | 0.258 | 0.138 | 0.944 |
| Question | Freq. (%) |
|---|---|
| Q1 Approximately how often did you eat vegetables/protein before carbohydrates in the past 2 weeks? | |
| Half the time | 1 (5.6) |
| More than half the time | 11 (61.1) |
| Nearly all the time | 6 (33.3) |
| Q2 Rate the following statement: It is easy to eat vegetables before carbohydrates? | |
| Strongly Disagree | 0 (0) |
| Disagree | 2 (11.1) |
| Neutral | 3 (16.7) |
| Agree | 10 (55.6) |
| Strongly Agree | 3 (16.7) |
| Q3 How easy or difficult is it to eat vegetables/protein before carbohydrates for breakfast? | |
| Very Difficult | 4 (22.2) |
| Difficult | 3 (16.7) |
| Neutral | 1 (5.6) |
| Easy | 4 (22.2) |
| Very Easy | 6 (33.3) |
| Q4 How easy or difficult is it to eat vegetables/protein before carbohydrates for lunch? | |
| Very Difficult | 0 (0) |
| Difficult | 3 (16.7) |
| Neutral | 5 (27.8) |
| Easy | 4 (22.2) |
| Very Easy | 6 (33.3) |
| Q5 How easy or difficult is it to eat vegetables/protein before carbohydrates for dinner? | |
| Very Difficult | 0 (0) |
| Difficult | 4 (22.2) |
| Neutral | 3 (16.7) |
| Easy | 6 (33.3) |
| Very Easy | 5 (27.8) |
| Q6 How easy or difficult is it to eat vegetables/protein before carbohydrates when eating at home during weekdays? | |
| Very Difficult | 0 (0) |
| Difficult | 1 (5.6) |
| Neutral | 7 (38.9) |
| Easy | 3 (16.7) |
| Very Easy | 7 (38.9) |
| Q7 How easy or difficult is it to eat vegetables/protein before carbohydrates when eating at home during the weekends? | |
| Very Difficult | 0 (0) |
| Difficult | 6 (33.3) |
| Neutral | 2 (11.1) |
| Easy | 4 (22.2) |
| Very Easy | 6 (33.3) |
| Q8 How often do you eat out? (i.e. take-out, restaurants, at work, at social events) | |
| Never | 3 (16.7) |
| Few times a week | 12 (66.7) |
| Daily | 2 (11.1) |
| More than once daily | 1 (5.6) |
| Q9 How easy or difficult is it to eat vegetables/protein before carbohydrates when eating out? a | |
| Very Difficult | 1 (5.9) |
| Difficult | 5 (29.4) |
| Neutral | 6 (35.3) |
| Easy | 4 (23.5) |
| Very Easy | 1 (5.9) |
| Q10 Which of these best describes your meal experience? Eating vegetables/protein before carbohydrates: | |
| Reduces my meal enjoyment | 8 (44.4) |
| Does not affect my enjoyment | 9 (50.0) |
| Increases my meal enjoyment | 1 (5.6) |
| Q11 How likely are you to continue eating protein/vegetables before concentrated carbohydrates at meals? (N = 17 responses) | |
| Unsure | 1 (5.9) |
| Somewhat likely to continue | 2 (11.8) |
| Very likely to continue | 11 (64.7) |
| Certainly will continue | 3 (17.7) |
| Q12 How would you rate the frequency of the study visits? a | |
| Not Sure | 1 (5.9) |
| Too Little | 2 (11.8) |
| Just Right | 14 (82.4) |
Disclaimer/Publisher’s Note: The statements, opinions and data contained in all publications are solely those of the individual author(s) and contributor(s) and not of MDPI and/or the editor(s). MDPI and/or the editor(s) disclaim responsibility for any injury to people or property resulting from any ideas, methods, instructions or products referred to in the content. |
© 2023 by the authors. Licensee MDPI, Basel, Switzerland. This article is an open access article distributed under the terms and conditions of the Creative Commons Attribution (CC BY) license (https://creativecommons.org/licenses/by/4.0/).
Share and Cite
Shukla, A.P.; Karan, A.; Hootman, K.C.; Graves, M.; Steller, I.; Abel, B.; Giannita, A.; Tils, J.; Hayashi, L.; O’Connor, M.; et al. A Randomized Controlled Pilot Study of the Food Order Behavioral Intervention in Prediabetes. Nutrients 2023, 15, 4452. https://doi.org/10.3390/nu15204452
Shukla AP, Karan A, Hootman KC, Graves M, Steller I, Abel B, Giannita A, Tils J, Hayashi L, O’Connor M, et al. A Randomized Controlled Pilot Study of the Food Order Behavioral Intervention in Prediabetes. Nutrients. 2023; 15(20):4452. https://doi.org/10.3390/nu15204452
Chicago/Turabian StyleShukla, Alpana P., Ampadi Karan, Katie C. Hootman, Maya Graves, Ian Steller, Brittany Abel, Ashley Giannita, Jamie Tils, Lauren Hayashi, Madlen O’Connor, and et al. 2023. "A Randomized Controlled Pilot Study of the Food Order Behavioral Intervention in Prediabetes" Nutrients 15, no. 20: 4452. https://doi.org/10.3390/nu15204452
APA StyleShukla, A. P., Karan, A., Hootman, K. C., Graves, M., Steller, I., Abel, B., Giannita, A., Tils, J., Hayashi, L., O’Connor, M., Casper, A. J., D’Angelo, D., & Aronne, L. J. (2023). A Randomized Controlled Pilot Study of the Food Order Behavioral Intervention in Prediabetes. Nutrients, 15(20), 4452. https://doi.org/10.3390/nu15204452