Article

Lower Intakes of Key Nutrients Are Associated with More School and Workplace Absenteeism in US Children and Adults: A Cross-Sectional Study of NHANES 2003–2008

1
Science & Technology, Pharmavite LLC, West Hills, CA 91304, USA
2
Food Components and Health Laboratory, Beltsville Human Nutrition Research Center, Agricultural Research Service, US Department of Agriculture, Beltsville, MD 20705, USA
*
Author to whom correspondence should be addressed.
Nutrients 2023, 15(20), 4356; https://doi.org/10.3390/nu15204356
Submission received: 22 July 2023 / Revised: 26 September 2023 / Accepted: 5 October 2023 / Published: 13 October 2023
(This article belongs to the Section Nutritional Epidemiology)

Abstract

:
The influence of individual macro- and micronutrients on absenteeism in the United States is largely unknown. The objective of this study was to determine whether nutritional status or nutrient intake were associated with absenteeism from school and work due to illness or injury. Data from NHANES 2003–2008 were used to assess nutrient intake from food and food plus supplements, nutritional biomarker levels, and school and work absenteeism per year in children and adults. Negative binomial regression models were used to predict mean days of missed work per year and to estimate incidence rate ratios (IRRs) of absenteeism by nutrient biomarker status. Of 7429 children, 77% reported missing school days (mean 4.0 days). Of 8252 adults, 51% reported missing work days (mean 4.9 days). Children and adults who reported more absent days had a significantly lower intake of protein and several essential micronutrients from the diet. When nutrients from supplements were included, this negative association was retained for protein, selenium, choline, and DHA in children and for protein, selenium, vitamin K, choline, potassium, fiber, octadecatrienoic acid, and lycopene in adults. Future studies are needed to ascertain whether dietary interventions, such as access to healthier food options and/or dietary supplements, can reduce absenteeism.

1. Introduction

Absenteeism from school and work can have long-term negative consequences. School absenteeism in children can lead to reduced academic achievement and poor socioemotional outcomes [1,2,3]. School absenteeism in earlier years is linked to more absenteeism in later school years [3]. Workplace absenteeism in adults can result in productivity loss, which leads to substantial costs to employers [4,5]. Absenteeism is an outcome we should pay attention to as it is linked to higher dropout rates, lower rates of high school graduation and college enrollment, lower earned income, and poorer health [6]. Contributors to absenteeism in children and adults include poor physical health [7,8,9] and illness [6]. Physical health, such as lack of participation in physical activity [10,11] and elevated body mass index (BMI) [12,13], have also been independently linked to missed days of school and work.
Physical health is heavily influenced by nutritional status. However, the relationships between diet, particularly individual nutrients, and absenteeism are largely unknown. Studies monitoring nutritional status and absenteeism focus mostly on the implementation of school feeding programs or workplace wellness programs [14,15,16,17,18]. But these studies usually combined dietary programs with other interventions [18], and absenteeism, if measured at all, was often a secondary outcome [16,17,18]. Workplace programs were usually limited to educational sessions [16], which means they only encourage a portion of healthy food to be added to the total diet, but do not impose long-term dietary change.
Very few studies have assessed the association between individual nutrients on school and work absenteeism in the US. Previous studies with children have shown an association between increased absenteeism and food insecurity [19]. Assessment of macronutrient composition is limited to protein intake among children in resource-limited countries; in these studies, school feeding programs resulted in higher protein intake and lower absenteeism rates among participants living in Kenya [20] and Peru [21]. In a sample of schoolchildren in Colombia, those with vitamin B12 deficiency had a higher adjusted absenteeism rate [22]. Among adults, decreased absenteeism from work has been linked to a self-reported “healthy” diet [8] and adherence to a higher-quality diet (i.e., Dietary Approaches to Stop Hypertension [DASH] diet) [23]; however, macro- and micronutrient intakes were not assessed in these studies. High fruit and vegetable consumption, which is associated with high micronutrient intake [as reviewed by Fulton 2016 [24]], has been associated with reduced absenteeism from work [8].
While the literature supports the importance of nutrition in physical health, the role of nutritional status, on school and work absenteeism in children and adults in the US is largely unknown. Additionally, combining self-report assessments of dietary intake with objective measurements of nutrient biomarkers can strengthen the validity of study results. Given the popular use of supplements in the US, which are consumed by approximately 30% of US children [25] and 80% of US adults [26], it is important to consider the contribution of supplements when examining the role of micronutrients in school and work absenteeism. Therefore, the objective of this study was to determine whether nutritional status or nutrient intake (including food and supplement intake), as assessed with 24 h dietary recalls and nutrient biomarkers, are associated with absenteeism in school and work using cross-sectional data that is nationally representative of the US population.

2. Materials and Methods

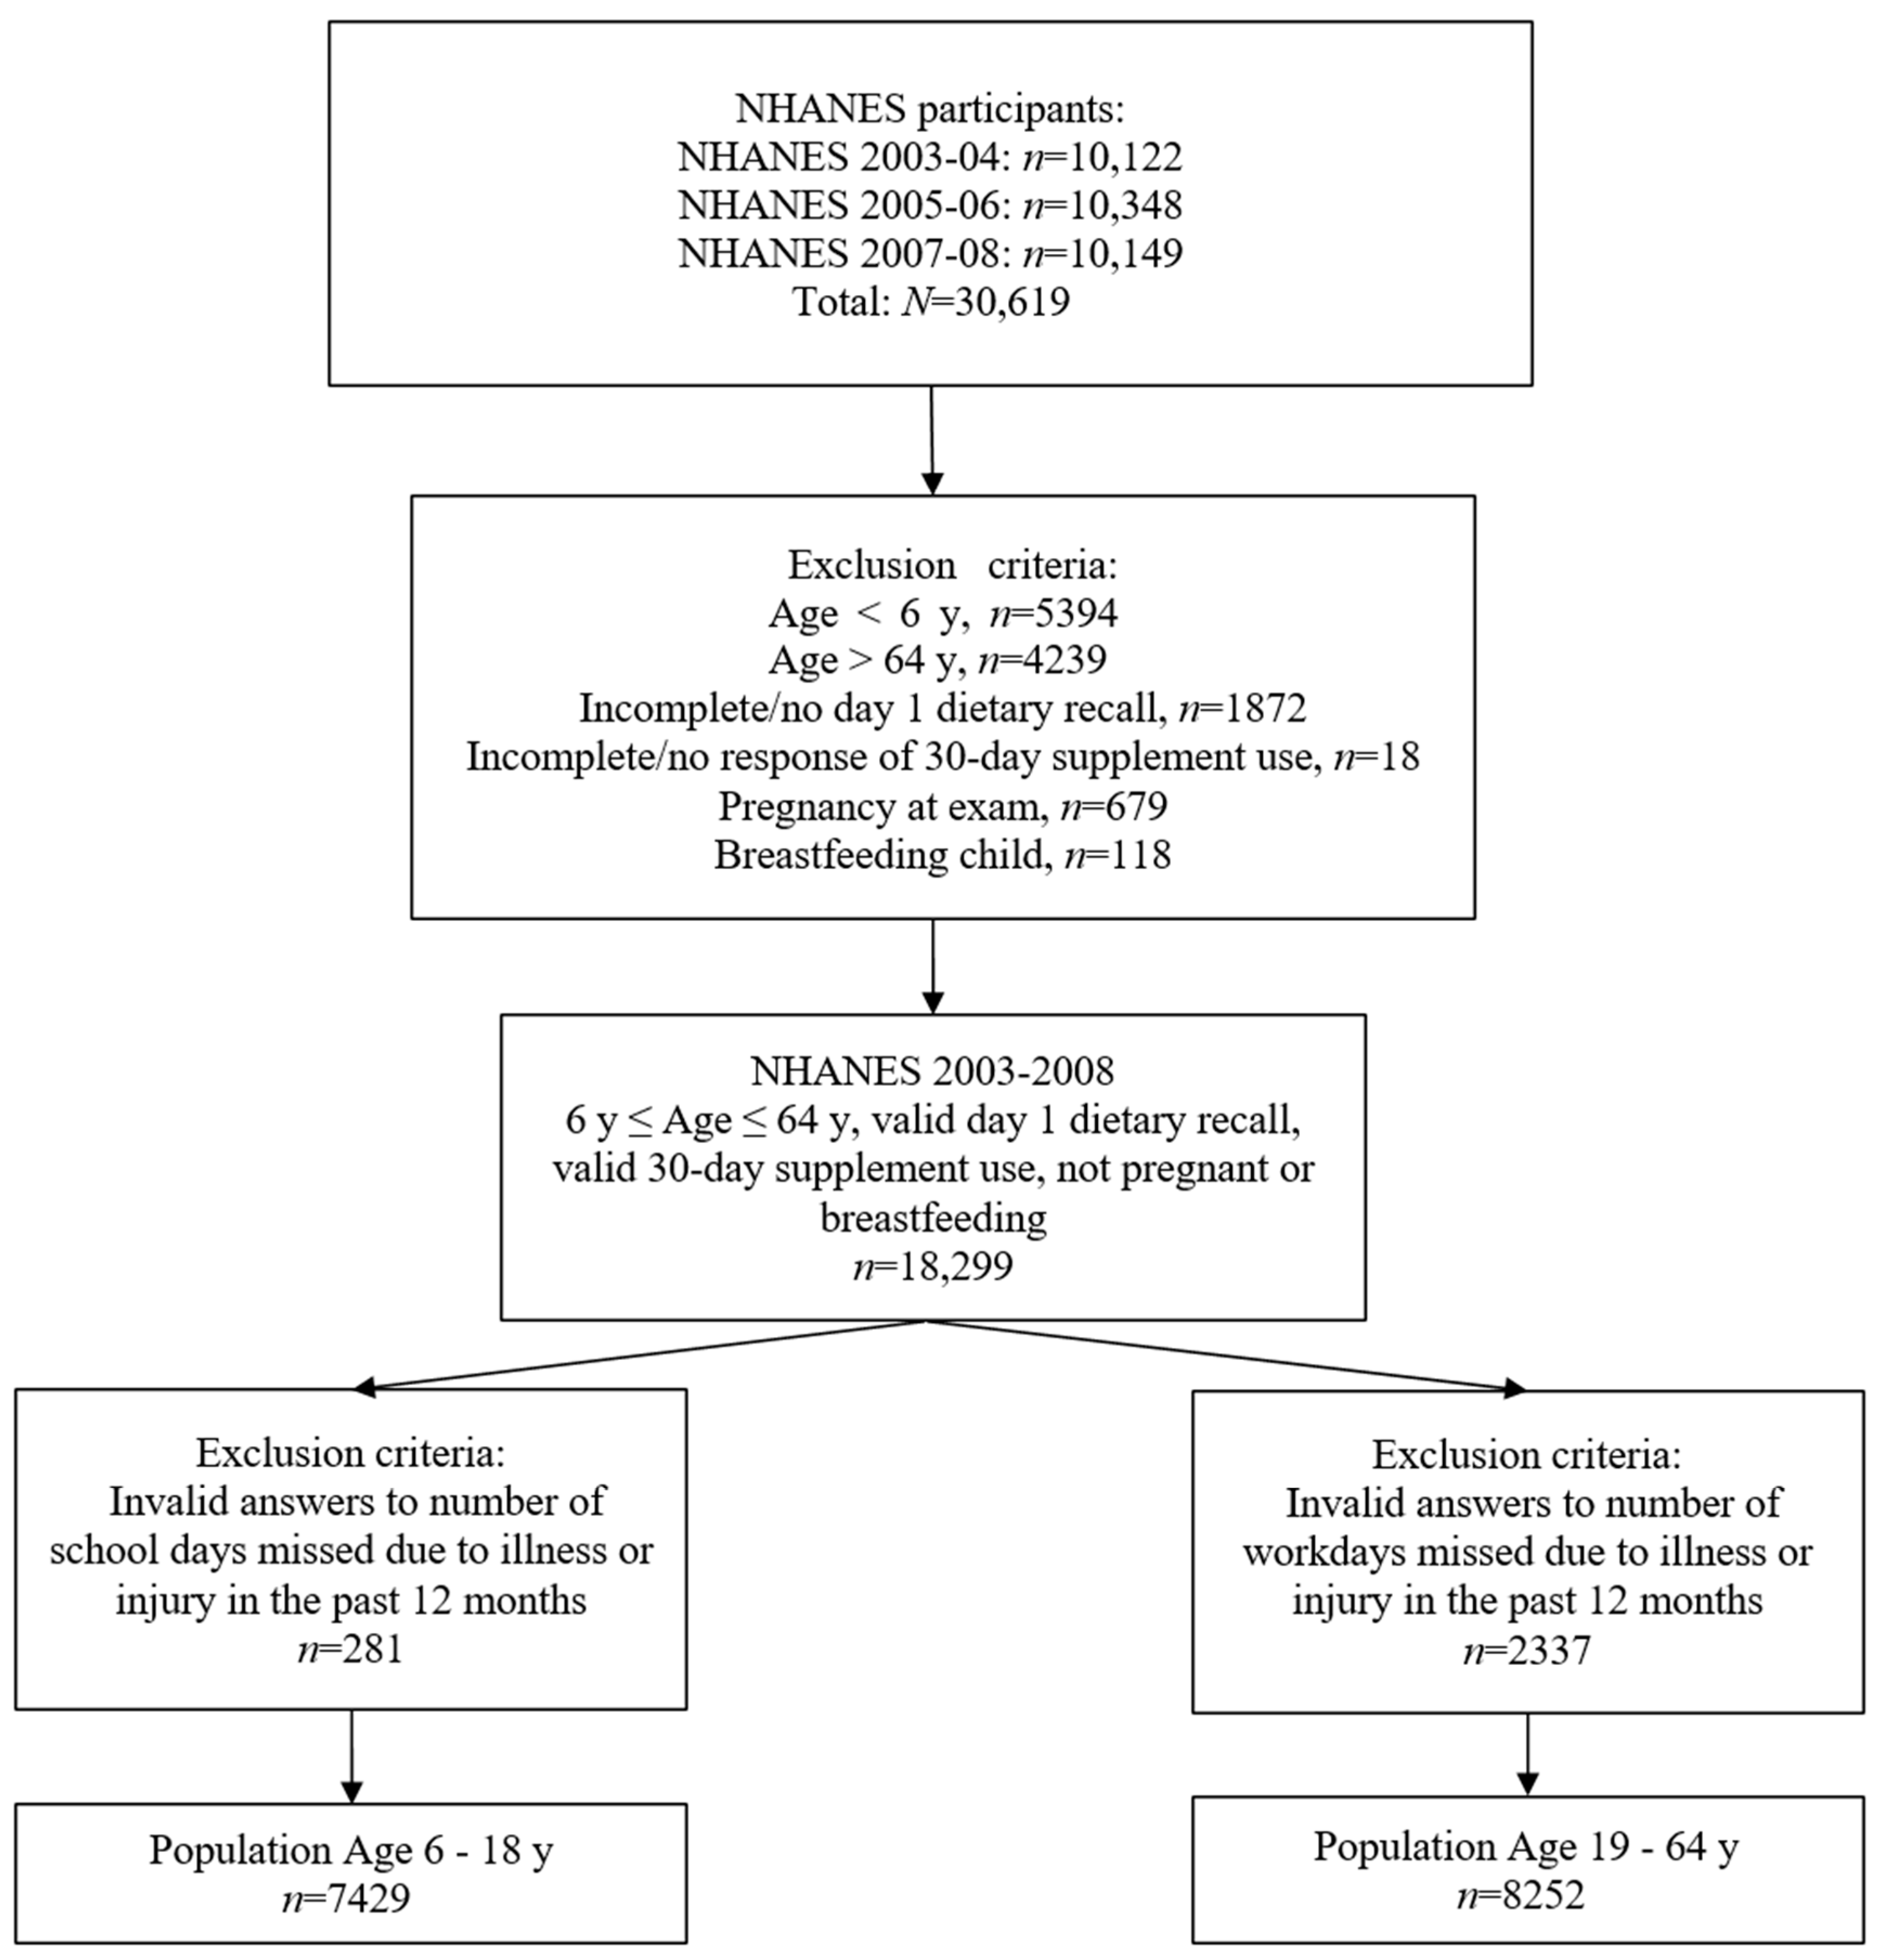
2.1. Database and Study Population

Data were used from 3 cycles of the National Health and Nutrition Examination Survey (NHANES), 2003–2004 [27], 2005–2006 [28], and 2007–2008 [29], a cross-sectional examination of a nationally representative sample of children and adults in the US. NHANES uses a multistage probability sampling design to continuously survey a sample representative of the civilian, noninstitutionalized household population in the US. Multiple sample persons could be sampled from the same household (on average 2 sample persons per household) [30]. NHANES data collection includes a household interview, an interview and health examination at a mobile examination center (MEC), and post-MEC follow-up data collection over the phone. The most recent cycles of NHANES do not collect absenteeism data; therefore, the analysis as restricted to NHANES 2003–2008, the most recent cycles of the survey that capture information on work and school absenteeism. All NHANES protocols were approved by the National Center for Health Statistics (NCHS) Research Ethics Review Board and underwent annual review [31]. All sample persons were informed of the study procedures and provided consent to complete the home interview and the health examination. Sample persons at age of maturity provided consent to participate in the survey. Parents or guardians of sample persons ≤ 17 years (y) of age gave permission for minors to participate in the survey; sample persons 7–17 y of age also provided assent to participate.
The target populations for this analysis consisted of children 6 to 18 y of age for absenteeism in school, and adults 19 to 64 y of age for absenteeism in the workplace. The population was restricted to individuals with valid day 1 dietary recalls, 30-day supplement questionnaires, and answers to the number of school or work days missed; pregnant and lactating women were excluded (Figure 1).

2.2. Absenteeism Data

Data on absenteeism from school and work were collected as part of the Medical Conditions Questionnaire (MCQ) during the 2003–2008 NHANES cycles using the Computer-Assisted Personal Interviewing-CAPI (interviewer administered) system. For the 6 to 18 y subpopulation, the number of school days missed from injury/illness was obtained from item MCQ150Q, which stated, “During the past 12 months, about how many days did you miss school because of an illness or injury?”. For the 19 to 64 y subpopulation, the number of work days missed was obtained from item MCQ245B, which stated, “During the past 12 months, about how many days did you miss work at a job or business because of an illness or injury (do not include maternity leave)?”. Sample persons ≥ 16 y provided responses to the MCQ while a responsible adult provided responses for sample persons < 16 y [32,33,34]. A responsible adult also provided responses for sample persons who could not self-report [32,33,34].

2.3. Dietary Intake Data

Dietary intake data were collected during the MEC interview as part of the What We Eat in America (WWEIA) component of NHANES. Trained dietary interviewers completed a dietary recall to collect detailed information on all food and beverages consumed by respondents in the previous 24 h time period (midnight to midnight) using the United States Department of Agriculture (USDA) Automated Multiple-Pass Method in either English or Spanish [35]. A second dietary recall was collected by telephone 3 to 10 days after the first dietary interview, but not on the same day of the week as the first interview. Dietary data was self-reported among participants ≥ 12 y and was self-reported with assistance from an adult household member among participants 6–11 y [36,37,38,39,40,41]. In select circumstances when the sample person and the proxy cannot provide sufficient dietary data, NHANES implemented data retrieval procedures to obtain dietary data from someone outside of the household [36,38,40].
Estimated nutrient intakes from the diet were calculated using survey-specific USDA Food and Nutrient Database for Dietary Studies. Estimated nutrient intake from supplements was based on the 30-day supplement intake data that were collected during the household interview. NHANES had not processed the intake from food for total choline (for 2003–2004) or vitamin D (for 2003–2004 and 2005–2006); therefore, the dietary intake analyses were restricted to the NHANES 2005–2006 and 2007–2008 cycles for total choline and to the NHANES 2007–2008 cycle for vitamin D. Also, the total nutrient intake from the 30-day supplement use questionnaire was processed only for the 2007–2008 cycle. Therefore, the unprocessed 30-day supplement use data and the Dietary Supplement Product Information and Dietary Supplement Ingredient Information databases were used to estimate nutrient intake from supplement use for NHANES 2003–2004 and 2005–2006 participants prior to running the analyses. The same process was used to process intake of vitamin A, alpha-carotene, beta-carotene, beta-cryptoxanthin, vitamin E, octadecatrienoic acid (polyunsaturated fatty acid [PUFA] 18:3), eicosapentaenoic acid (EPA; PUFA 20:5), and docosahexaenoic acid (DHA; PUFA 22:6) for all cycles, which were not provided in NHANES.

2.4. Nutrient Biomarkers

Blood and urine specimens were collected at the MEC and assessed for analyte levels. Clinically relevant cutoffs have been established for vitamin A [42,43], vitamin C [43], vitamin D [44], vitamin E [43], vitamin B6 (pyridoxal-5′-phosphate [PLP] and 4-pyridoxic acid [4-PA] [45], vitamin B12 (based on the combined analysis of serum B12 and methylmalonic acid; [43,46,47]), folate (serum and red blood cell [RBC]; [45]), iron (serum ferritin and soluble transferrin receptor [sTfR]; [48,49,50]), and urinary iodine [51,52]. Serum ferritin was only measured among females aged 12 to 49 y; therefore, serum ferritin was evaluated in these subgroups only (12–18 y, 19–49 y) [53]. As a joint analysis of serum vitamin B12 and MMA may be a more sensitive and specific tool to determine vitamin B12 deficiency at the population level, joint vitamin B12 and MMA levels were used to assess vitamin B12 status, as demonstrated in Bailey et al. [47].
Recognized cutoffs were used to categorize participants by nutrient status if the number of participants per category was 100 or more; participants in each group were classified by tertiles of biomarker distribution levels if the number of participants in a given category was less than 100 or recognized biomarker cutoffs were not available.

2.5. Statistical Analysis

All statistical analyses were performed using STATA® (Version 12.1, StataCorp LLC, College Station, TX, USA) and SAS® software (Version 9.4, SAS Institute Inc., Cary, NC, USA). All analyses used the statistical weights provided by NCHS, and standard errors and statistical tests were adjusted for survey design. Statistical significance was set at p ≤ 0.05 for all analyses.
Negative binomial regression models were used to predict number of missed school and work days per year for each age group (6 to 18 y and 19 to 64 y). Participants were classified into 2 subcategories: lower absenteeism and higher absenteeism. Participants were classified as lower absenteeism if the number of missed school or work days was less than or equal to the predicted mean number of days missed. Participants were classified as higher absenteeism if the number of missed school or work days was more than the predicted mean number of days missed.
Mean intakes were estimated from micro- and macronutrient intake data from food and supplements for both age groups. For each nutrient of interest, usual intakes from food only and from food + supplements were derived using the National Cancer Institute (NCI) method and the SAS® macros developed by NCI for the modeling of a single dietary component [54]. Usual nutrient intake analyses were adjusted for day of recall, recall day of the week (weekday/weekend), dietary reference intake (DRI) age group, gender, and dietary supplement use.
Usual intake estimates from food alone and food + supplements for lower absenteeism and higher absenteeism groups were generated to determine the association between nutrient intake and absenteeism. Models were adjusted for day of recall, recall day of the week (weekday/weekend), DRI age group, BMI, gender, race/ethnicity, household income, education (for workplace absenteeism) or head of household (HH) education (for school absenteeism), marital status (for workplace absenteeism) or HH marital status (for school absenteeism), and dietary supplement use. Unadjusted models are available upon request. Mean usual nutrient intake from food alone and food + supplements for the lower absenteeism and higher absenteeism groups were compared by biomarker category using a z test. Methods similar to those used by Andreyeva et al. [12] were used to analyze the association between absenteeism and nutrient biomarkers. Specifically, participants were classified into biomarker categories based on clinically relevant cutpoints (i.e., nutrient sufficient, deficient based on recognized biomarker cutoffs) or tertiles of biomarker distribution levels. Negative binomial regression models were used to estimate the incidence rate ratios (IRRs) of absenteeism and missed school and work days by biomarker status category, adjusting for the aforementioned covariates. Analyses were run separately for the two age groups.

3. Results

3.1. Population Characteristics

Most participants in the 6 to 18 y group were non-Hispanic white (62.5%), with a normal BMI (63.1%), and did not use dietary supplements (70.6%; Table 1). Most participants in the 19 to 64 y group were non-Hispanic white (70.9%; Table 1). The distribution of BMI categories was relatively equal between normal weight (32.7%), overweight (33.1%), and obese (32.6%) among adults. Dietary supplements were consumed by relatively half of the adult population (48.4%).
In the 6 to 18 y age group, 77% reported missing school days due to illness/injury, with an average of 5.20 days missed (Table 2). The predicted mean number of school days missed was 3.99 days; most participants (64%) missed less than or equal to this predicted number of days. In the 19 to 64 y age group, 51% reported missing work days due to illness/injury, with an average of 9.60 days missed. The predicted mean number of work days missed was 4.79 days; most participants (84%) missed less than or equal to this predicted number of days. The predicted mean missed school or work days and absolute mean missed school or work days were similar among both age groups.

3.2. Nutrient Intake

Usual intake levels from food alone and food + supplements for children 6 to 18 y are provided in the supplementary material (Table S1). Children ages 6 to 18 y in the higher absenteeism group (i.e., missed school days more than the predicted mean number of days) consumed lower levels of protein, vitamin B6, folate, vitamin B12, iron, zinc, selenium, total choline, beta-cryptoxanthin, and DHA (PUFA 22:6) from food alone than those in the lower absenteeism group (i.e., missed school days less than or equal to the predicted mean number of days; Table 3).
When nutrients from supplements were included, children ages 6 to 18 y who reported more absent days consumed less protein, selenium, total choline, beta-cryptoxanthin, and DHA from food + supplements than those who reported less absenteeism (Table 3).
Usual intake levels from food alone and food + supplements for adults 19 to 64 y are provided in the supplementary material (Table S2). Adults ages 19 to 64 y in the higher absenteeism group consumed less protein, vitamin E, vitamin B1 (thiamin), vitamin B3 (niacin), vitamin B6, folate, vitamin C, selenium, vitamin K, total choline, potassium, dietary fiber, octadecatrienoic acid (PUFA 18:3), alpha-carotene, and lycopene from food alone than those in the lower absenteeism group (Table 4). When nutrients from supplements were included, adults ages 19 to 64 y in the higher absenteeism group consumed less protein, selenium, vitamin K, total choline, potassium, dietary fiber, octadecatrienoic acid (PUFA 18:3), alpha-carotene, beta-carotene, lycopene, lutein + zeaxanthin, total PUFAs, EPA (PUFA 20:5), and DHA (PUFA 22:6) than those who reported less absenteeism (Table 4).

3.3. Nutrient Biomarkers

Distribution of the study population based on clinically relevant biomarker cutpoints and by tertiles are provided in the supplementary material (Tables S3 and S4). For female children ages 12 to 18 y, higher IRRs of absenteeism and more school absent days per year were observed for females with depleted iron stores (i.e., serum ferritin levels < 15 μg) compared to females with serum ferritin levels in the normal range (15 to 150 μg/L) (IRR = 1.36, p = 0.02; mean additional absent days = 1.13, p = 0.03) (Table S5). However, no effect was observed for other biomarkers of iron status. Higher IRRs of absenteeism and more school absent days per year were observed for the lowest tertile of serum total folate compared to the highest tertile (IRR = 1.16, p = 0.05; mean additional absent days = 0.57, p = 0.04). Compared with the highest tertile of B12, higher IRRs of absenteeism and more school absent days per year were observed for the lowest tertile of B12 (IRR = 1.29, p = 0.01; mean additional absent days = 0.94, p = 0.01) and middle tertile of B12 (IRR = 1.2, p = 0.02; mean additional absent days = 0.65, p = 0.02). However, this effect was not observed in the joint B12 and MMA analysis. No other associations were observed between the other biomarkers and absenteeism.
In adults ages 19 to 64 y, a higher IRR of absenteeism and more work absent days per year were observed for the group deficient or potentially deficient in B12, based on B12 and MMA levels compared with the group that was adequate or normal B12 (IRR = 2.32, p = 0.003; mean additional days absent = 6.7, p = 0.01) (Table S6). Additionally, a higher IRR of absenteeism and more work absent days per year were observed for the lowest tertile of B12 compared to the highest tertile group (IRR = 1.41, p = 0.01; mean additional days absent = 1.6, p = 0.01). A lower IRR and less absenteeism days per year were observed for the middle tertile group of B6 (4-PA) compared to the highest tertile group (IRR = 0.77, p = 0.03; mean additional days absent = −1.11, p = 0.03), but the difference between the lowest and the highest tertile was not statistically significant. In females 19 to 49 y (the only adult population in which iron biomarkers were collected), a lower IRR and less absenteeism days per year were observed in participants with depleted iron stores compared to participants in the non-depleted category (IRR = 0.59, p = 0.02; mean additional days absent = −1.99, p = 0.01). No other associations were observed between the other biomarkers and absenteeism.

4. Discussion

The purpose of this study was to determine if nutritional status or nutrient intake were associated with absenteeism in school and work. Our findings suggest that an intake of protein and several micronutrients and levels of several nutrient biomarkers were associated with increased absenteeism in children and adults.

4.1. Absenteeism and Macronutrient Status

In the current study, less protein intake was associated with increased absenteeism in children, and less protein and dietary fiber intake were associated with increased absenteeism in adults. While participation in school feeding programs has been associated with increased protein intake and reduced absenteeism in resource-limited countries [20,21], the relationship between protein intake and absenteeism from school and work has not been examined in the US. Similarly, only one study has directly assessed fiber and absenteeism: in 219 children ages 3 to 6 y, there was no effect of fiber supplementation on absence from kindergarten [55]. No studies have directly examined fiber intake and absenteeism from work in adults. Future studies are needed to determine the role of protein, fiber, and other macronutrients in absenteeism in US populations.

4.2. Absenteeism and Micronutrient Status

Intake of several B vitamins, including vitamins B1 (thiamin), B3 (niacin), B6, B12, and folate and choline, were significantly associated with absenteeism in children and/or adults in this study. B vitamins, in particular folate and B12, are critical to one-carbon (1C) metabolism, a set of biochemical pathways that regulate methylation reactions involved in DNA synthesis, amino acid homeostasis, antioxidant generation, and epigenetic regulation [56,57]. As such, B vitamins may influence absenteeism through their role in physical health and disease pathology. Although B vitamin deficiencies were not observed for the majority of individuals in this study, their intake of B vitamins may not be sufficient for “optimal” functioning. This could affect their health through minor illnesses or infections that could increase absenteeism. Indeed, vitamin B12 specifically may contribute to the immune response by increasing the number of CD8+ T cells and natural killer T-cell activity, thus improving immune function [58]. Folate has also been implicated in numerous immune functions [59], and deficiencies can result in decreased resistance to infections [60]. B vitamins have also been implicated in mental health and may contribute to attitudes or feelings about school and work. Negative associations between depression severity and vitamin B12 [61,62], B6 [63], and choline [64] levels have been reported, which may affect an individual’s ability or desire to attend school or work. Furthermore, higher serum folate concentrations were associated with higher cognitive test scores in children in a previous analysis of NHANES data [65]. Children who perform better in school may be more likely to attend and miss less days (and vice versa). More studies are needed to determine potential mediators of the relationship between B vitamins and absenteeism.
In this study, an intake of select vitamins (vitamin C and vitamin E) and minerals (zinc, selenium) that provide antioxidant support were significantly associated with absenteeism in children and/or adults. Antioxidants are essential for an effective immune response against infectious pathogens, and dietary deficiencies can impair immunity and lead to increased infections (as reviewed by Puertollano et al. [66]). Although the effects of vitamin C and zinc on preventing the common cold and/or an upper respiratory tract infection were mixed, it has been consistently shown that vitamin C [67,68] and zinc [68,69,70,71] supplementation can help to shorten the duration of illness. This may explain why a higher intake of these nutrients is associated with lower absenteeism. More research is needed to determine if antioxidant supplementation, either alone or in combination with other vitamins (e.g., B vitamins), reduces absenteeism in children and adults living in the US.
For children, there were three nutrients that were significantly inversely associated with absenteeism in both dietary intake (food alone) and biomarker status in this study: vitamin B12, serum total folate, and iron (serum ferritin). However, associations were not observed for all markers of vitamin B12 (joint vitamin B12 and MMA), folate (RBC folate), and iron status (serum transferrin receptor, transferrin saturation, and total body iron). Serum folate is a better measure of short-term folate status, whereas erythrocyte folate is a better indicator of long-term folate status [72]. The lack of association between RBC folate and absenteeism is consistent with results from previous results among Colombian children [22]. Consistent with the current analysis, Colombian children with plasma vitamin B12 levels < 148 pmol/L had a 1.89-times higher adjusted rate of school absenteeism compared with participants with levels ≥ 148 pmol/L [22]. However, the Duong et al. study did not observe an association between serum ferritin and absenteeism. The children included in the study were younger (5 to 12 y), included both males and females, and were Colombian. These factors may have influenced the differences observed in the results between the two studies.
For adults, vitamin B12 deficiency or potential deficiency (as assessed by joint vitamin B12 and MMA levels) were associated with more absenteeism from work in our study. This relationship has not been studied previously, and more studies are needed to confirm these results. Interestingly, among females aged 19 to 49 y, lower absenteeism was observed in this study for individuals with depleted iron stores compared to individuals in the non-depleted category. This is contradictory to our hypothesis that nutrient-deficient populations would have higher absenteeism. Serum ferritin is a biomarker sensitive to iron deficiency, but this biomarker does not indicate the level of severity of deficiency [73]. Furthermore, this relationship may be confounded by inflammation. Ferritin is a positive acute-phase protein that increases during inflammation in addition to its role in iron storage [50]. There are currently no recognized methods to account for inflammation when interpreting ferritin levels. Given the lack of significant associations between absenteeism and the other markers for iron status, the association with ferritin should be interpreted with caution.
In adults, lower IRR and less absenteeism days were observed in this study for the middle tertile of 4-PA compared to the highest tertile. While 4-PA is a metabolite of vitamin B6, 4-PA values are a poor indicator of vitamin B6 status because levels are heavily influenced by recent intake and renal function status [47,74]. While a combination of functional and direct biomarkers to assess vitamin B6 status is recommended [74], these biomarkers were not measured in NHANES. Serum PLP, the active coenzyme form of vitamin B6, is generally viewed as the best single indicator of vitamin B6 status because it reflects both dietary intake and tissue stores, and PLP changes slowly in response to changes in dietary intake [75]. In our study, adults with lower PLP values had a higher IRR with a trending p-value of 0.09 and 2 more absent days (p = 0.13) compared with adults with higher PLP values. The lack of significant association with absenteeism in this study may be due to the use of a single biomarker instead of a combination, as is recommended.

4.3. Absenteeism and Supplement Intake

Lower usual nutrient intakes were significantly associated with higher absenteeism for certain nutrients when analyses were conducted based on food only, but not food + supplements. These nutrients, including vitamins C, E, B1 (thiamine), B3 (niacin), B6, and folate in adults, and vitamins B6, B12, folate, iron, and zinc in children, can be commonly found in supplements. A possible explanation for this relationship is that individuals with higher absenteeism may seek out the use of dietary supplements as a means to improve their health [76,77]. Interestingly, lower usual intakes of beta-carotene, lutein + zeaxanthin, total PUFAs, EPA, and DHA were significantly associated with higher workplace absenteeism in adults in the food + supplements analyses. This may indicate that among supplement consumers, a negative association exists. The data need to be interpreted with caution because (1) the percentages of participants that consumed these nutrients from supplements was low (2.6% to 27.2% of adults, depending on the nutrient; data available upon request); and (2) intakes from supplements may not contribute substantially to the total usual nutrient intake because the mean intakes of these nutrients were very similar from food alone and food + supplements. To fully understand the association of supplemental intake of beta-carotene, lutein + zeaxanthin, total PUFAs, EPA, and DHA and absenteeism, oversampling of people who take supplements with these nutrients may be needed. However, whether the use of dietary supplements causally improves absenteeism cannot be determined with this cross-sectional data. Future studies are needed to ascertain whether higher nutrient intake from food and supplements, particularly for nutrients not commonly found in the typical American diet, is an effective intervention to reduce absenteeism.

4.4. Limitations

Limitations of the current study include the cross-sectional study design, which cannot establish any cause-and-effect relationships between nutritional status and absenteeism. Analysis on more recent data was not possible because absenteeism data was not collected in later cycles of NHANES. Dietary intake, supplement use, and diet quality have changed over time [78,79,80], which could result in altered incidence, severity, and causes of absenteeism, highlighting the importance of capturing this data in future cycles of NHANES. In addition, the reasons for absenteeism measured in NHANES include both illness and injury, and injury may be caused by non-health related issues (e.g., motor vehicle accidents). Furthermore, the absenteeism and dietary and supplement intake data were self-reported outcomes, which may be subject to recall bias and not accurately reflect actual days missed or nutrients consumed. The USDA Automated Multi-Pass Method is a validated method to measure energy and nutrient intake among adults [35,81], but limited research has been conducted to assess the method’s validity among children. There are challenges when collecting self-reported dietary data among children due to limited literacy and writing skills, food recognition skills, memory, and concentration [82]; in addition, children often play a limited or no role in preparing the foods they consume. While an adult household member assisted in providing dietary data among participants 6–11 y in this survey, these adults may be limited in their ability to provide detailed information on the foods prepared by other care givers or at school. In select circumstances when the sample person and the proxy cannot provide sufficient data, NHANES implemented data retrieval procedures to obtain dietary data from someone outside of the household [36,38,40]. Despite the limitations of self-reported dietary data, it still provides valuable information about dietary intake among both adults, adolescents, and children [83].
Biomarker assessment of nutrient levels was included to provide a more objective measure of nutrient consumption. However, limitations also exist for biomarker measures: recognized cutoffs may not exist for certain biomarkers, and biomarkers can be affected by other biological processes and nutrient interactions that could confound the interpretation of nutritional status results [43,84]. Both dietary recall and biomarker data were included in this study to provide a more complete picture of intake and nutritional status. While attempts were made to adjust results for other factors that may influence the association between nutrient status and absenteeism, including demographic characteristics, there may be additional confounding factors that could introduce bias that were not adjusted for in this analysis. An investigation of the interaction between select demographic characteristics, including gender and nutrient status on absenteeism, could provide additional hypothesis-generating results.

5. Conclusions

A lower nutritional status of protein and several essential micronutrients, including B vitamins and antioxidants measured by dietary intake and biomarkers, are associated with more days absent from school and work due to illness/injury. The negative association may be corrected by improving dietary habits, which may include access to healthier food options, more fortified food, and dietary supplements. Results from this study highlight the importance of considering micronutrient intake from diet and supplements when assessing work and school absenteeism and developing effective interventions. The significant associations between nutritional status and absenteeism highlights the importance of surveillance of absenteeism and causes of absenteeism in future NHANES cycles. Future studies are needed to ascertain whether increasing nutrient intake in a targeted and personalized manner, particularly for nutrients not commonly found in the typical American diet or supplements, is an effective intervention to reduce absenteeism.

Supplementary Materials

The following supporting information can be downloaded at: https://www.mdpi.com/article/10.3390/nu15204356/s1, Table S1: Usual Nutrient Intake from Food Alone and Food + Supplements Among Individuals 6 to 18 Years; Table S2: Usual Nutrient Intake from Food Alone and Food + Supplements Among Individuals 19 to 64 Years; Table S3: Distribution of the Study Population Based on Clinically Relevant Biomarker Cutpoint Levels; Table S4: Distribution of the Study Population Based on Biomarker Tertiles; Table S5: School Absenteeism and Nutrient Adequacy as Evaluated by Biomarker Levels—Adjusted Models; Table S6: Work Absenteeism and Nutrient Adequacy as Evaluated by Biomarker Levels—Adjusted Models.

Author Contributions

The authors’ contributions were as follows: P.P.D. and R.W.G. conceptualized the study, developed the methodology, and performed data acquisition. Q.Y., P.P.D., R.W.G. and K.A.H. performed data analyses and interpretation. All authors (Q.Y., P.P.D., R.W.G., K.A.H. and S.H.M.) wrote, reviewed, and revised the manuscript. P.P.D. provided overall study supervision. All authors have read and agreed to the published version of the manuscript.

Funding

This research was funded by Pharmavite LLC.

Institutional Review Board Statement

This study is an analysis of the publicly available NHANES data. All NHANES protocols were approved by the NCHS Research Ethics Review Board and underwent annual review [31]. Use of the public use data sets requires neither additional institutional review board review nor an exempt determination.

Informed Consent Statement

Informed consent was obtained from NHANES participants by NCHS.

Data Availability Statement

The datasets analyzed during the current study are available in the NHANES repository at the following links: NHANES 2003–2004: https://wwwn.cdc.gov/nchs/nhanes/continuousnhanes/default.aspx?BeginYear=2003. NHANES 2005–2006: https://wwwn.cdc.gov/nchs/nhanes/continuousnhanes/default.aspx?BeginYear=2005. NHANES 2007–2008: https://wwwn.cdc.gov/nchs/nhanes/continuousnhanes/default.aspx?BeginYear=2007.

Acknowledgments

The authors thank Leila Barraj, Xiaoyu Bi, and Benjamin Davis of Exponent, Inc. for providing data analysis support. The authors also thank Katie Henley of Whitsell Innovations, Inc., Chapel Hill, NC for providing medical writing support in accordance with Good Publication Practice (GPP3) guidelines.

Conflicts of Interest

Pharmavite, LLC sponsored the study. Q.Y., P.P.D., R.W.G. and S.H.M. are employees of Pharmavite, LLC. K.A.H was an employee of Exponent, Inc. when the analysis was completed.

References

  1. Gottfried, M.A. Chronic absenteeism and its effects on students’ academic and socioemotional outcomes. J. Educ. Stud. Placed Risk 2014, 19, 53–75. [Google Scholar] [CrossRef]
  2. Ansari, A.; Gottfried, M.A. The grade-level and cumulative outcomes of absenteeism. Child Dev. 2021, 92, e548–e564. [Google Scholar] [CrossRef] [PubMed]
  3. Ansari, A.; Pianta, R.C. School absenteeism in the first decade of education and outcomes in adolescence. J. Sch. Psychol. 2019, 76, 48–61. [Google Scholar] [CrossRef]
  4. Mitchell, R.J.; Bates, P. Measuring health-related productivity loss. Popul. Health Manag. 2011, 14, 93–98. [Google Scholar] [CrossRef]
  5. Loeppke, R.; Taitel, M.; Haufle, V.; Parry, T.; Kessler, R.C.; Jinnett, K. Health and productivity as a business strategy: A multiemployer study. J. Occup. Environ. Med. 2009, 51, 411–428. [Google Scholar] [CrossRef] [PubMed]
  6. Allen, C.W.; Diamond-Myrsten, S.; Rollins, L.K. School absenteeism in children and adolescents. Am. Fam. Physician 2018, 98, 738–744. [Google Scholar]
  7. Gubbels, J.; van der Put, C.E.; Assink, M. Risk factors for school absenteeism and dropout: A meta-analytic review. J. Youth Adolesc. 2019, 48, 1637–1667. [Google Scholar] [CrossRef] [PubMed]
  8. Merrill, R.M.; Aldana, S.G.; Pope, J.E.; Anderson, D.R.; Coberley, C.R.; Grossmeier, J.J.; Whitmer, R.W. Self-rated job performance and absenteeism according to employee engagement, health behaviors, and physical health. J. Occup. Environ. Med. 2013, 55, 10–18. [Google Scholar] [CrossRef]
  9. Gohar, B.; Lariviere, M.; Lightfoot, N.; Lariviere, C.; Wenghofer, E.; Nowrouzi-Kia, B. Demographic, Lifestyle, and Physical Health Predictors of Sickness Absenteeism in Nursing: A Meta-Analysis. Saf. Health Work 2021, 12, 536–543. [Google Scholar] [CrossRef]
  10. Loprinzi, P.D.; Frith, E. Accelerometer-assessed physical activity and school absenteeism due to illness or injury among children and adolescents: NHANES 2003 to 2006. Am. J. Health Promot. 2018, 32, 571–577. [Google Scholar] [CrossRef]
  11. Losina, E.; Yang, H.Y.; Deshpande, B.R.; Katz, J.N.; Collins, J.E. Physical activity and unplanned illness-related work absenteeism: Data from an employee wellness program. PLoS ONE 2017, 12, e0176872. [Google Scholar] [CrossRef] [PubMed]
  12. Andreyeva, T.; Luedicke, J.; Wang, Y.C. State-level estimates of obesity-attributable costs of absenteeism. J. Occup. Environ. Med./Am. Coll. Occup. Environ. Med. 2014, 56, 1120. [Google Scholar] [CrossRef] [PubMed]
  13. Li, Y.; Raychowdhury, S.; Tedders, S.H.; Lyn, R.; Fede, L.-D.; Zhang, J. Association between increased BMI and severe school absenteeism among US children and adolescents: Findings from a national survey, 2005–2008. Int. J. Obes. 2012, 36, 517–523. [Google Scholar] [CrossRef]
  14. Kristjansson, B.; Petticrew, M.; MacDonald, B.; Krasevec, J.; Janzen, L.; Greenhalgh, T.; Wells, G.A.; MacGowan, J.; Farmer, A.P.; Shea, B. School feeding for improving the physical and psychosocial health of disadvantaged students. Cochrane Database Syst. Rev. 2007, 2, 1–189. [Google Scholar] [CrossRef]
  15. Kirksey, J.J.; Gottfried, M.A. The effect of serving “breakfast after-the-Bell” meals on school absenteeism: Comparing results from regression discontinuity designs. Educ. Eval. Policy Anal. 2021, 43, 305–328. [Google Scholar] [CrossRef]
  16. Drewnowski, A. Impact of nutrition interventions and dietary nutrient density on productivity in the workplace. Nutr. Rev. 2020, 78, 215–224. [Google Scholar] [CrossRef]
  17. Rongen, A.; Robroek, S.J.; van Lenthe, F.J.; Burdorf, A. Workplace health promotion: A meta-analysis of effectiveness. Am. J. Prev. Med. 2013, 44, 406–415. [Google Scholar] [CrossRef]
  18. Jensen, J.D. Can worksite nutritional interventions improve productivity and firm profitability? A literature review. Perspect. Public Health 2011, 131, 184–192. [Google Scholar] [CrossRef]
  19. Peltz, A.; Garg, A. Food insecurity and health care use. Pediatrics 2019, 144, e20190347. [Google Scholar] [CrossRef]
  20. Walingo, M.K.; Musamali, B. Nutrient intake and nutritional status indicators of participant and nonparticipant pupils of a parent-supported school lunch program in Kenya. J. Nutr. Educ. Behav. 2008, 40, 298–304. [Google Scholar] [CrossRef]
  21. Jacoby, E.R.; Cueto, S.; Pollitt, E. When science and politics listen to each other: Good prospects from a new school breakfast program in Peru. Am. J. Clin. Nutr. 1998, 67, 795S–797S. [Google Scholar] [CrossRef]
  22. Duong, M.-C.; Mora-Plazas, M.; Marín, C.; Villamor, E. Vitamin B-12 deficiency in children is associated with grade repetition and school absenteeism, independent of folate, iron, zinc, or vitamin a status biomarkers. J. Nutr. 2015, 145, 1541–1548. [Google Scholar] [CrossRef]
  23. Fitzgerald, S.; Kirby, A.; Murphy, A.; Geaney, F. Obesity, diet quality and absenteeism in a working population. Public Health Nutr. 2016, 19, 3287–3295. [Google Scholar] [CrossRef] [PubMed]
  24. Fulton, S.L.; McKinley, M.C.; Young, I.S.; Cardwell, C.R.; Woodside, J.V. The effect of increasing fruit and vegetable consumption on overall diet: A systematic review and meta-analysis. Crit. Rev. Food Sci. Nutr. 2016, 56, 802–816. [Google Scholar] [CrossRef]
  25. Panjwani, A.A.; Cowan, A.E.; Jun, S.; Bailey, R.L. Trends in Nutrient-and Non-Nutrient–Containing Dietary Supplement Use among US Children from 1999 to 2016. J. Pediatr. 2021, 231, 131–140. [Google Scholar] [CrossRef]
  26. Council for Responsible Nutrition. CRN Reveals Initial Data from 2021 Consumer Survey on Dietary Supplements. Available online: https://www.crnusa.org/newsroom/crn-reveals-initial-data-2021-consumer-survey-dietary-supplements (accessed on 24 February 2023).
  27. National Center for Health Statistics. National Health and Nutrition Examination Survey, NHANES 2003–2004; Centers for Disease Control and Prevention: Atlanta, GA, USA. Available online: https://wwwn.cdc.gov/nchs/nhanes/continuousnhanes/default.aspx?BeginYear=2003 (accessed on 29 April 2022).
  28. National Center for Health Statistics. National Health and Nutrition Examination Survey, NHANES 2005-2006; Centers for Disease Control and Prevention: Atlanta, GA, USA. Available online: https://wwwn.cdc.gov/nchs/nhanes/continuousnhanes/default.aspx?BeginYear=2005 (accessed on 29 April 2022).
  29. National Center for Health Statistics. National Health and Nutrition Examination Survey, NHANES 2007–2008; Centers for Disease Control and Prevention: Atlanta, GA, USA. Available online: https://wwwn.cdc.gov/nchs/nhanes/continuousnhanes/default.aspx?BeginYear=2007 (accessed on 29 April 2022).
  30. Curtin, L.R.; Mohadjer, L.K.; Dohrmann, S.M.; Kruszon-Moran, D.; Mirel, L.B.; Carroll, M.D.; Hirsch, R.; Burt, V.L.; Johnson, C.L. National Health and Nutrition Examination Survey: Sample design, 2007–2010. Vital Health Stat. 2013, 160, 1–23. [Google Scholar]
  31. Zipf, G.; Chiappa, M.; Porter, K.S.; Ostchega, Y.; Lewis, B.G.; Dostal, J. National health and nutrition examination survey: Plan and operations, 1999–2010. Vital. Health Stat. 2013, 1, 1–37. [Google Scholar]
  32. National Center for Health Statistics. NHANES 2003-2004 Questionnaire Data Overview; Centers for Disease Control and Prevention: Atlanta, GA, USA. Available online: https://wwwn.cdc.gov/nchs/nhanes/continuousnhanes/overviewquex.aspx?BeginYear=2003 (accessed on 6 September 2023).
  33. National Center for Health Statistics. NHANES 2005-2006 Questionnaire Data Overview; Centers for Disease Control and Prevention: Atlanta, GA, USA. Available online: https://wwwn.cdc.gov/nchs/nhanes/continuousnhanes/overviewquex.aspx?BeginYear=2005 (accessed on 6 September 2023).
  34. National Center for Health Statistics. NHANES 2007-2008 Questionnaire Data Overview; Centers for Disease Control and Prevention: Atlanta, GA, USA. Available online: https://wwwn.cdc.gov/nchs/nhanes/continuousnhanes/overviewquex.aspx?BeginYear=2007 (accessed on 6 September 2023).
  35. Blanton, C.A.; Moshfegh, A.J.; Baer, D.J.; Kretsch, M.J. The USDA Automated Multiple-Pass Method accurately estimates group total energy and nutrient intake. J. Nutr. 2006, 136, 2594–2599. [Google Scholar] [CrossRef] [PubMed]
  36. Centers for Disease Control and Prevention; National Center for Health Statistics. National Health and Nutrition Examination Survey (NHANES): MEC In-Person Dietary Interviewers Procedures Manual. Available online: https://wwwn.cdc.gov/nchs/data/nhanes/2007-2008/manuals/manual_dietarymec.pdf (accessed on 5 September 2023).
  37. Centers for Disease Control and Prevention; National Center for Health Statistics. National Health and Nutrition Examination Survey (NHANES): Phone Follow-up Dietary Interviewer Procedures Manual. Available online: https://wwwn.cdc.gov/nchs/data/nhanes/2007-2008/manuals/manual_dietarypfu.pdf (accessed on 5 September 2023).
  38. Centers for Disease Control and Prevention; National Center for Health Statistics. National Health and Nutrition Examination Survey (NHANES): MEC In-Person Dietary Interviewers Procedures Manual. Available online: https://wwwn.cdc.gov/nchs/data/nhanes/2005-2006/manuals/DIETARY_MEC.pdf (accessed on 5 September 2023).
  39. Centers for Disease Control and Prevention; National Center for Health Statistics. National Health and Nutrition Examination Survey (NHANES): Phone Follow-up Dietary Interviewer Procedures Manual. Available online: https://wwwn.cdc.gov/nchs/data/nhanes/2005-2006/manuals/DIETARY_PFU.pdf (accessed on 5 September 2023).
  40. Centers for Disease Control and Prevention; National Center for Health Statistics. National Health and Nutrition Examination Survey (NHANES): MEC In-Person Dietary Interviewers Procedures Manual. Available online: https://wwwn.cdc.gov/nchs/data/nhanes/2003-2004/manuals/DIETARY_MEC.pdf (accessed on 5 September 2023).
  41. Centers for Disease Control and Prevention; National Center for Health Statistics. National Health and Nutrition Examination Survey (NHANES): Phone Follow-up Dietary Interviewer Procedures Manual. Available online: https://wwwn.cdc.gov/nchs/data/nhanes/2003-2004/manuals/DIETARY_PFU.pdf (accessed on 5 September 2023).
  42. World Health Organization. Global Prevalence of Vitamin A Deficiency in Populations at Risk 1995–2005: WHO Global Database on Vitamin A Deficiency; World Health Organization: Geneva, Switzerland, 2009. [Google Scholar]
  43. Pfeiffer, C.M.; Lacher, D.A.; Schleicher, R.L.; Johnson, C.L.; Yetley, E.A. Challenges and lessons learned in generating and interpreting NHANES nutritional biomarker data. Adv. Nutr. 2017, 8, 290–307. [Google Scholar] [CrossRef]
  44. Holick, M.F.; Binkley, N.C.; Bischoff-Ferrari, H.A.; Gordon, C.M.; Hanley, D.A.; Heaney, R.P.; Murad, M.H.; Weaver, C.M. Evaluation, treatment, and prevention of vitamin D deficiency: An Endocrine Society clinical practice guideline. J. Clin. Endocrinol. Metab. 2011, 96, 1911–1930. [Google Scholar] [CrossRef] [PubMed]
  45. Institute of Medicine (US). Standing Committee on the Scientific Evaluation of Dietary Reference Intakes and its Panel on Folate, Other B Vitamins, and Choline. In Dietary Reference Intakes for Thiamin, Riboflavin, Niacin, Vitamin B(6), Folate, Vitamin B(12), Pantothenic Acid, Biotin, and Choline; National Academies Press (US), National Academy of Sciences: Washington, DC, USA, 1998. [Google Scholar]
  46. Allen, L.H.; Miller, J.W.; De Groot, L.; Rosenberg, I.H.; Smith, A.D.; Refsum, H.; Raiten, D.J. Biomarkers of Nutrition for Development (BOND): Vitamin B-12 review. J. Nutr. 2018, 148, 1995S–2027S. [Google Scholar] [CrossRef] [PubMed]
  47. Bailey, R.L.; Carmel, R.; Green, R.; Pfeiffer, C.M.; Cogswell, M.E.; Osterloh, J.D.; Sempos, C.T.; Yetley, E.A. Monitoring of vitamin B-12 nutritional status in the United States by using plasma methylmalonic acid and serum vitamin B-12. Am. J. Clin. Nutr. 2011, 94, 552–561. [Google Scholar] [CrossRef]
  48. Lynch, S.; Pfeiffer, C.M.; Georgieff, M.K.; Brittenham, G.; Fairweather-Tait, S.; Hurrell, R.F.; McArdle, H.J.; Raiten, D.J. Biomarkers of Nutrition for Development (BOND)—Iron Review. J. Nutr. 2018, 148, 1001S–1067S. [Google Scholar] [CrossRef] [PubMed]
  49. World Health Organization. Serum Ferritin Concentrations for the Assessment of Iron Status and Iron Deficiency in Populations; World Health Organization: Geneva, Switzerland, 2011. [Google Scholar]
  50. Pfeiffer, C.M.; Looker, A.C. Laboratory methodologies for indicators of iron status: Strengths, limitations, and analytical challenges. Am. J. Clin. Nutr. 2017, 106, 1606S–1614S. [Google Scholar] [CrossRef]
  51. World Health Organization. Assessment of Iodine Deficiency Disorders and Monitoring Their Elimination: A Guide for Programme Managers; World Health Organization: Geneva, Switzerland, 2007. [Google Scholar]
  52. Rohner, F.; Zimmermann, M.; Jooste, P.; Pandav, C.; Caldwell, K.; Raghavan, R.; Raiten, D.J. Biomarkers of nutrition for development—Iodine review. J. Nutr. 2014, 144, 1322S–1342S. [Google Scholar] [CrossRef]
  53. National Center for Health Statistics. NHANES 2007-2008: Ferritin Data Documentation, Codebook, and Frequencies. Available online: https://wwwn.cdc.gov/Nchs/Nhanes/2007-2008/FERTIN_E.htm (accessed on 25 July 2022).
  54. Tooze, J.A.; Kipnis, V.; Buckman, D.W.; Carroll, R.J.; Freedman, L.S.; Guenther, P.M.; Krebs-Smith, S.M.; Subar, A.F.; Dodd, K.W. A mixed-effects model approach for estimating the distribution of usual intake of nutrients: The NCI method. Stat. Med. 2010, 29, 2857–2868. [Google Scholar] [CrossRef]
  55. Lohner, S.; Jakobik, V.; Mihályi, K.; Soldi, S.; Vasileiadis, S.; Theis, S.; Sailer, M.; Sieland, C.; Berényi, K.; Boehm, G.; et al. Inulin-Type Fructan Supplementation of 3- to 6-Year-Old Children Is Associated with Higher Fecal Bifidobacterium Concentrations and Fewer Febrile Episodes Requiring Medical Attention. J. Nutr. 2018, 148, 1300–1308. [Google Scholar] [CrossRef]
  56. Lyon, P.; Strippoli, V.; Fang, B.; Cimmino, L. B vitamins and one-carbon metabolism: Implications in human health and disease. Nutrients 2020, 12, 2867. [Google Scholar] [CrossRef] [PubMed]
  57. Ducker, G.S.; Rabinowitz, J.D. One-carbon metabolism in health and disease. Cell Metab. 2017, 25, 27–42. [Google Scholar] [CrossRef]
  58. Tamura, J.; Kubota, K.; Murakami, H.; Sawamura, M.; Matsushima, T.; Tamura, T.; Saitoh, T.; Kurabayshi, H.; Naruse, T. Immunomodulation by vitamin B12: Augmentation of CD8+ T lymphocytes and natural killer (NK) cell activity in vitamin B12-deficient patients by methyl-B12 treatment. Clin. Exp. Immunol. 1999, 116, 28–32. [Google Scholar] [CrossRef] [PubMed]
  59. Gombart, A.F.; Pierre, A.; Maggini, S. A review of micronutrients and the immune system–working in harmony to reduce the risk of infection. Nutrients 2020, 12, 236. [Google Scholar] [CrossRef]
  60. Maggini, S.; Beveridge, S.; Sorbara, P.; Senatore, G. Feeding the immune system: The role of micronutrients in restoring resistance to infections. CAB Rev. Perspect. Agric. Vet. Sci. Nutr. Nat. Resour. 2008, 3, 1–21. [Google Scholar] [CrossRef]
  61. Wu, Y.; Li, S.; Wang, W.; Zhang, D. Associations of dietary B vitamins intakes with depression in adults. Int. J. Vitam. Nutr. Res. 2023, 93, 142–153. [Google Scholar] [CrossRef] [PubMed]
  62. Esnafoglu, E.; Ozturan, D.D. The relationship of severity of depression with homocysteine, folate, vitamin B12, and vitamin D levels in children and adolescents. Child Adolesc. Ment. Health 2020, 25, 249–255. [Google Scholar] [CrossRef] [PubMed]
  63. Kafeshani, M.; Feizi, A.; Esmaillzadeh, A.; Keshteli, A.H.; Afshar, H.; Roohafza, H.; Adibi, P. Higher vitamin B6 intake is associated with lower depression and anxiety risk in women but not in men: A large cross-sectional study. Int. J. Vitam. Nutr. Res. 2019, 90, 484–492. [Google Scholar] [CrossRef]
  64. Li, J.; Kang, X.; Zhang, L.; Luo, J.; Zhang, D. Dietary choline is inversely associated with depressive symptoms: A cross-sectional study of the National Health and Nutrition Examination Survey (NHANES) 2011 to 2018. J. Affect. Disord. 2022, 301, 23–29. [Google Scholar] [CrossRef]
  65. Nguyen, C.T.; Gracely, E.J.; Lee, B.K. Serum folate but not vitamin B-12 concentrations are positively associated with cognitive test scores in children aged 6–16 years. J. Nutr. 2013, 143, 500–504. [Google Scholar] [CrossRef]
  66. Puertollano, M.; Puertollano, E.; Alvarez de Cienfuegos, G.; de Pablo, A. Dietary antioxidants: Immunity and host defense. Curr. Top. Med. Chem. 2011, 11, 1752–1766. [Google Scholar] [CrossRef] [PubMed]
  67. Keya, T.A.; Leela, A.; Fernandez, K.; Habib, N.; Rashid, M. Effect of Vitamin C Supplements on Respiratory Tract Infections: A Systematic Review and Meta-Analysis. Curr. Rev. Clin. Exp. Pharmacol. Former. Curr. Clin. Pharmacol. 2022, 17, 205–215. [Google Scholar] [CrossRef]
  68. Abioye, A.I.; Bromage, S.; Fawzi, W. Effect of micronutrient supplements on influenza and other respiratory tract infections among adults: A systematic review and meta-analysis. BMJ Glob. Health 2021, 6, e003176. [Google Scholar] [CrossRef] [PubMed]
  69. Hunter, J.; Arentz, S.; Goldenberg, J.; Yang, G.; Beardsley, J.; Myers, S.P.; Mertz, D.; Leeder, S. Zinc for the prevention or treatment of acute viral respiratory tract infections in adults: A rapid systematic review and meta-analysis of randomised controlled trials. BMJ Open 2021, 11, e047474. [Google Scholar] [CrossRef]
  70. Wang, M.X.; Win, S.S.; Pang, J. Zinc supplementation reduces common cold duration among healthy adults: A systematic review of randomized controlled trials with micronutrients supplementation. Am. J. Trop. Med. Hyg. 2020, 103, 86. [Google Scholar] [CrossRef] [PubMed]
  71. Singh, M.; Das, R.R. Zinc for the common cold. Cochrane Database Syst. Rev. 2013. [Google Scholar] [CrossRef]
  72. Bailey, L.B.; Stover, P.J.; McNulty, H.; Fenech, M.F.; Gregory III, J.F.; Mills, J.L.; Pfeiffer, C.M.; Fazili, Z.; Zhang, M.; Ueland, P.M. Biomarkers of nutrition for development—Folate review. J. Nutr. 2015, 145, 1636S–1680S. [Google Scholar] [CrossRef] [PubMed]
  73. National Center for Environmental Health, Division of Laboratory Sciences. Second National Report on Biochemical Indicators of Diet and Nutrition in the U.S; Population. Centers for Disease Control and Prevention: Atlanta, GA, USA, 2012. Available online: https://www.cdc.gov/nutritionreport/pdf/Nutrition_Book_complete508_final.pdf (accessed on 29 April 2022).
  74. Ueland, P.M.; Ulvik, A.; Rios-Avila, L.; Midttun, Ø.; Gregory, J.F. Direct and functional biomarkers of vitamin B6 status. Annu. Rev. Nutr. 2015, 35, 33–70. [Google Scholar] [CrossRef] [PubMed]
  75. Pfeiffer, C.M.; Schleicher, R.L.; Caldwell, K.L. Biochemical indices. In Encyclopedia of Human Nutrition, 3rd ed.; Caballero, B., Ed.; Academic Press: Amsterdam, The Netherlands, 2013; pp. 156–174. [Google Scholar]
  76. Bailey, R.L.; Gahche, J.J.; Miller, P.E.; Thomas, P.R.; Dwyer, J.T. Why US adults use dietary supplements. JAMA Intern. Med. 2013, 173, 355–361. [Google Scholar] [CrossRef]
  77. Bailey, R.L.; Gahche, J.J.; Thomas, P.R.; Dwyer, J.T. Why US children use dietary supplements. Pediatr. Res. 2013, 74, 737–741. [Google Scholar] [CrossRef]
  78. Shan, Z.; Rehm, C.D.; Rogers, G.; Ruan, M.; Wang, D.D.; Hu, F.B.; Mozaffarian, D.; Zhang, F.F.; Bhupathiraju, S.N. Trends in Dietary Carbohydrate, Protein, and Fat Intake and Diet Quality Among US Adults, 1999–2016. JAMA 2019, 322, 1178–1187. [Google Scholar] [CrossRef]
  79. Cowan, A.E.; Tooze, J.A.; Gahche, J.J.; Eicher-Miller, H.A.; Guenther, P.M.; Dwyer, J.T.; Potischman, N.; Bhadra, A.; Carroll, R.J.; Bailey, R.L. Trends in Overall and Micronutrient-Containing Dietary Supplement Use in US Adults and Children, NHANES 2007–2018. J. Nutr. 2023, 152, 2789–2801. [Google Scholar] [CrossRef]
  80. Liu, J.; Micha, R.; Li, Y.; Mozaffarian, D. Trends in Food Sources and Diet Quality Among US Children and Adults, 2003-2018. JAMA Netw Open 2021, 4, e215262. [Google Scholar] [CrossRef]
  81. Moshfegh, A.J.; Rhodes, D.G.; Baer, D.J.; Murayi, T.; Clemens, J.C.; Rumpler, W.V.; Paul, D.R.; Sebastian, R.S.; Kuczynski, K.J.; Ingwersen, L.A.; et al. The US Department of Agriculture Automated Multiple-Pass Method reduces bias in the collection of energy intakes. Am. J. Clin. Nutr. 2008, 88, 324–332. [Google Scholar] [CrossRef] [PubMed]
  82. Foster, E.; Bradley, J. Methodological considerations and future insights for 24-h dietary recall assessment in children. Nutr. Res. 2018, 51, 1–11. [Google Scholar] [CrossRef] [PubMed]
  83. Subar, A.F.; Freedman, L.S.; Tooze, J.A.; Kirkpatrick, S.I.; Boushey, C.; Neuhouser, M.L.; Thompson, F.E.; Potischman, N.; Guenther, P.M.; Tarasuk, V.; et al. Addressing Current Criticism Regarding the Value of Self-Report Dietary Data. J. Nutr. 2015, 145, 2639–2645. [Google Scholar] [CrossRef] [PubMed]
  84. Potischman, N.; Freudenheim, J.L. Biomarkers of nutritional exposure and nutritional status: An overview. J. Nutr. 2003, 133, 873S–874S. [Google Scholar] [CrossRef]
Figure 1. Population included in analysis, NHANES 2003–2008. NHANES, National Health and Nutrition Examination Survey; y, year(s).
Nutrients 15 04356 g001
Table 1. Population Characteristics, NHANES 2003–2008 a.
Age Group
6 to 18 Years19 to 64 Years
Demographic CharacteristicnMean Standard ErrornMeanStandard Error
Age (years)742912.0 0.10825239.7 0.24
Gender (%)7429 8252
 Males372451.1 0.95455253.80.72
 Females370548.9 0.95370046.2 0.72
Race/ethnicity (%)7429 8252
 Mexican American215412.2 1.1616858.6 0.86
 Other Hispanic4224.3 0.835303.7 0.50
 Non-Hispanic white209162.52.20376470.9 1.92
 Non-Hispanic black239914.8 1.37189611.3 1.14
 Other race (including
multiracial)
3636.2 0.823775.6 0.54
HH income (%)7066 7793
 ≤1.35 of PIR290730.1 1.45194816.8 0.85
 >1.35 to <1.85 of PIR8329.4 0.758187.9 0.41
 ≥1.85 of PIR332760.5 1.69502775.3 1.01
Education (%) b7154 7770
 <High school217318.1 1.13165113.2 0.72
 High school179126.0 1.23187524.2 0.96
 >High school319055.9 1.41424462.6 1.27
Marital status (%) c7116 8141
 Never been married440369.9 1.10413554.1 1.21
 Divorced/Widowed145618.4 1.06116814.0 0.63
 Currently married125711.7 0.84283831.9 1.22
BMI (%) d7370 8202
 Underweight2223.3 0.301311.6 0.19
 Normal440463.1 1.41256932.7 0.87
 Overweight122616.7 0.89272033.1 0.75
 Obese151816.9 1.03278232.6 1.08
Dietary supplement use (%)7429 8252
 Yes166329.4 1.26347048.4 0.98
 No576670.6 1.26478251.6 0.98
BMI, body mass index; CDC, Centers for Disease Control and Prevention; HH, head of household; NHANES, National Health and Nutrition Examination Survey; PIR, ratio of family income to poverty. a Total number of non-pregnant or breastfeeding participants ages 6 to 18 y and 19 to 64 y with valid day 1 dietary recall, valid 30-day dietary supplement use, and valid answers to number of school or work days missed due to illness or injury. b HH education level for age 6 to 18 y. c HH marital status for age 6 to 18 y. d BMI category based on percentile as specified by CDC for individuals 6 to 19 y and based on BMI cutoffs for individuals ≥ 20 y.
Table 2. Summary of Absenteeism Data.
Age Group
Age 6 to 18 YearsAge 19 to 64 Years
n a74298252
Reported missing school or work days due to illness/injury, n (%) b5131 (77)3919 (51)
Number of days missed, mean (SE) c4.00 (0.13)4.90 (0.33)
Predicted number of missed school or work days, mean d3.994.79
Participants with lower absenteeism (missing days ≤ the predicted mean number of days missed), n (%)5162 (64)6930 (84)
Participants with higher absenteeism (missing days > the predicted mean number of days missed), n (%)2267 (36)1322 (16)
a Total number of non-pregnant or breastfeeding participants ages 6 to 18 y and 19 to 64 y with valid day 1 dietary recall, 30-day dietary supplement use, and answers to number of school or work days missed due to illness or injury. b Refers to school days missed among 6 to 18 y and work days missed among 19 to 64 y. c Days missed (>0) over the last 12 months, including NHANES participants who did not miss any school or work days. d Based on negative binomial regression modeling.
Table 3. Usual Nutrient Intake from Food Alone and Food + Supplements by School Absenteeism Category a.
Food AloneFood + Supplements
NutrientLower Absenteeism
n = 4534
Higher Absenteeism
n = 2002
Lower Absenteeism
n = 4534
Higher Absenteeism
n = 2002
MeanSEMeanSEMeanSEMeanSE
Protein (g)76.30.972.1 *1.376.40.972.3 *1.3
Carbohydrate (g)2863286428632864
Vitamin E as alpha-tocopherol (mg)6.30.16.20.19.90.910.50.8
Vitamin A, RAE (μg)59812588167652083364
Thiamin (Vitamin B1) (mg)1.670.021.620.031.990.052.310.2
Riboflavin (Vitamin B2) (mg)2.240.032.20.042.590.072.790.16
Niacin (mg)23.10.422.30.425.60.425.80.9
Vitamin B6 (mg)1.840.031.75 *0.042.280.072.430.19
Folate, DFE (μg)5739544 *126671267227
Vitamin B12 (μg)5.530.15.13 *0.146.810.196.860.34
Vitamin D (D2 + D3) (μg)5.20.150.36.70.36.30.5
Vitamin C (mg)82.4277.63.1107.63105.54.9
Calcium (mg)104016101224106817104025
Iron (mg)15.80.215.1 *0.317.60.317.10.4
Magnesium (mg)2413236424632414
Phosphorus (mg)131715128123132515128924
Zinc (mg)11.80.211.1 *0.213.20.212.60.3
Copper (mg)1.10.011.10.021.30.031.30.03
Selenium (μg)101196 *2102198 *2
Vitamin K (μg)58.71.555.71.759.81.557.41.8
Total choline (mg)2665248 *62685249 *6
Potassium (mg)229733222943230133223243
Sodium (mg)337044327556337244327656
Dietary fiber (g)13.50.213.20.213.60.213.20.2
PUFA 18:3 (Octadecatrienoic) (g)1.300.021.240.031.300.021.240.03
Alpha-carotene (μg)35040315383504031538
Beta-carotene (μg)119861110979126064120984
Beta-cryptoxanthin (μg)19914160 *1519914160 *15
Lycopene (μg)8324425777646583314257781465
Lutein + zeaxanthin (μg)76529719337702972332
Total fat (g)80.71.179.11.180.71.179.21.1
Total saturated fatty acids (g)28.30.427.70.528.30.427.70.5
Total monounsaturated fatty acids (g)29.80.429.30.429.80.429.30.4
Total polyunsaturated fatty acids (g)160.315.60.3160.315.60.3
PUFA 20:5 (Eicosapentaenoic) (g)0.010.0010.010.0010.010.0010.010.002
PUFA 22:6 (Docosahexaenoic) (g)0.050.0030.04 *0.0040.050.0030.04 *0.004
BMI, body mass index; DFE, dietary folate equivalents; DRI, dietary reference intake; HH, head of household; NCI, National Cancer Institute; PUFA, polyunsaturated fatty acid; RAE, retinol activity equivalent. Lower absenteeism: with missing days ≤ the predicted mean. Higher absenteeism: with missing days > the predicted mean. * Indicates a significantly lower nutritional status associated with higher school absenteeism. a Dietary intake not available for survey 2003–2004 for total choline and 2003–2006 for vitamin D; estimated users of supplements with the specific component based on survey 2005–2008 and 2007–2008 for total choline and vitamin D, respectively. Usual intake was derived using the NCI method and the SAS® macros developed by NCI for modeling of a single dietary component, and adjusting for day of recall, recall day of week (weekday/weekday), DRI, age group, gender, dietary supplement use, BMI, race/ethnicity, household income, HH education, and HH marital status.
Table 4. Usual Nutrient Intake from Food Alone and Food + Supplements by Work Absenteeism Category a.
Food AloneFood + Supplements
NutrientLower Absenteeism
n = 6086
Higher Absenteeism
n = 1213
Lower Absenteeism
n = 6086
Higher Absenteeism
n = 1213
MeanSEMeanSEMeanSEMeanSE
Protein (g)89.80.986.3 *1.589.9 0.986.4 *1.5
Carbohydrate (g)2802278 5280 2278 5
Vitamin E as alpha-tocopherol (mg)7.80.17.4 *0.232.72.234.33.7
Vitamin A, RAE (μg)6181159618124423594642
Thiamin (Vitamin B1) (mg)1.760.021.69 *0.035.270.295.420.63
Riboflavin (Vitamin B2) (mg)2.360.022.30.045.370.265.950.62
Niacin (mg)27.10.325.7 *0.4381.435.21.5
Vitamin B6 (mg)2.080.021.95 *0.046.160.416.390.64
Folate, DFE (μg)570 8539 *97991677025
Vitamin B12 (μg)5.580.15.300.1427.912.5334.610.56
Vitamin D (D2 + D3) (μg)4.60.24.20.38.50.38.91.4
Vitamin C (mg)88.0 277.2 *3192.111178.813
Calcium (mg)9751395422112617112830
Iron (mg)16.50.215.90.319.70.320.00.5
Magnesium (mg)310 4301 5343 4341 8
Phosphorus (mg)143414138925145015140326
Zinc (mg)13.10.212.50.317.90.417.10.5
Copper (mg)1.40.021.40.031.90.041.80.08
Selenium (μg)119 1113 *2134 2126 *3
Vitamin K (μg)103.23.193.2 *3.2109.83.199.1 *3.3
Total choline (mg)351 4328 *9353 4329 *9
Potassium (mg)2824272715 *412842272730 *41
Sodium (mg)377038373362377238373562
Dietary fiber (g)16.50.315.5 *0.316.50.315.6 *0.3
PUFA 18:3 (Octadecatrienoic) (g)1.620.031.53 *0.041.640.031.54 *0.04
Alpha-carotene (μg)78846629 *6178947629 *61
Beta-carotene (μg)1991701815952283732049 *111
Beta-cryptoxanthin (μg)18711158151871115815
Lycopene (μg)96003718335 *45096833718393 *450
Lutein + zeaxanthin (μg)1369451255571453461301 *58
Total fat (g)89.21.188.21.889.41.188.31.7
Total saturated fatty acids (g)29.60.429.60.629.60.429.70.6
Total monounsaturated fatty acids (g)33.20.432.90.733.20.432.90.7
Total polyunsaturated fatty acids (g)18.9 0.318.10.4190.318.1 *0.4
PUFA 20:5 (Eicosapentaenoic) (g)0.040.0030.040.0030.050.0030.04 *0.003
PUFA 22:6 (Docosahexaenoic) (g)0.10.0050.090.0080.110.0050.09 *0.008
BMI, body mass index; DFE, dietary folate equivalents; DRI, dietary reference intake; NCI, National Cancer Institute; PUFA, polyunsaturated fatty acid; RAE, retinol activity equivalent. Lower absenteeism: with missing days ≤ the predicted mean. Higher absenteeism: with missing days > the predicted mean. * Indicates a significantly lower nutritional status associated with higher workplace absenteeism. a Dietary intake not available for survey 2003–2004 for total choline and 2003–2006 for vitamin D; estimated users of supplements with the specific component based on survey 2005–2008 and 2007–2008 for total choline and vitamin D, respectively. Usual intake was derived using the NCI method and the SAS® macros developed by NCI for modeling of a single dietary component, and adjusting for day of recall, recall day of week (weekday/weekday), DRI, age group, dietary supplement use, BMI, age, gender, race/ethnicity, household income, education, and marital status.
Disclaimer/Publisher’s Note: The statements, opinions and data contained in all publications are solely those of the individual author(s) and contributor(s) and not of MDPI and/or the editor(s). MDPI and/or the editor(s) disclaim responsibility for any injury to people or property resulting from any ideas, methods, instructions or products referred to in the content.

