
Using Crowdsourced Food Image Data for Assessing Restaurant Nutrition Environment: A Validation Study


Abstract
:1. Introduction
2. Materials and Methods
2.1. Sample and Data
2.2. Measures
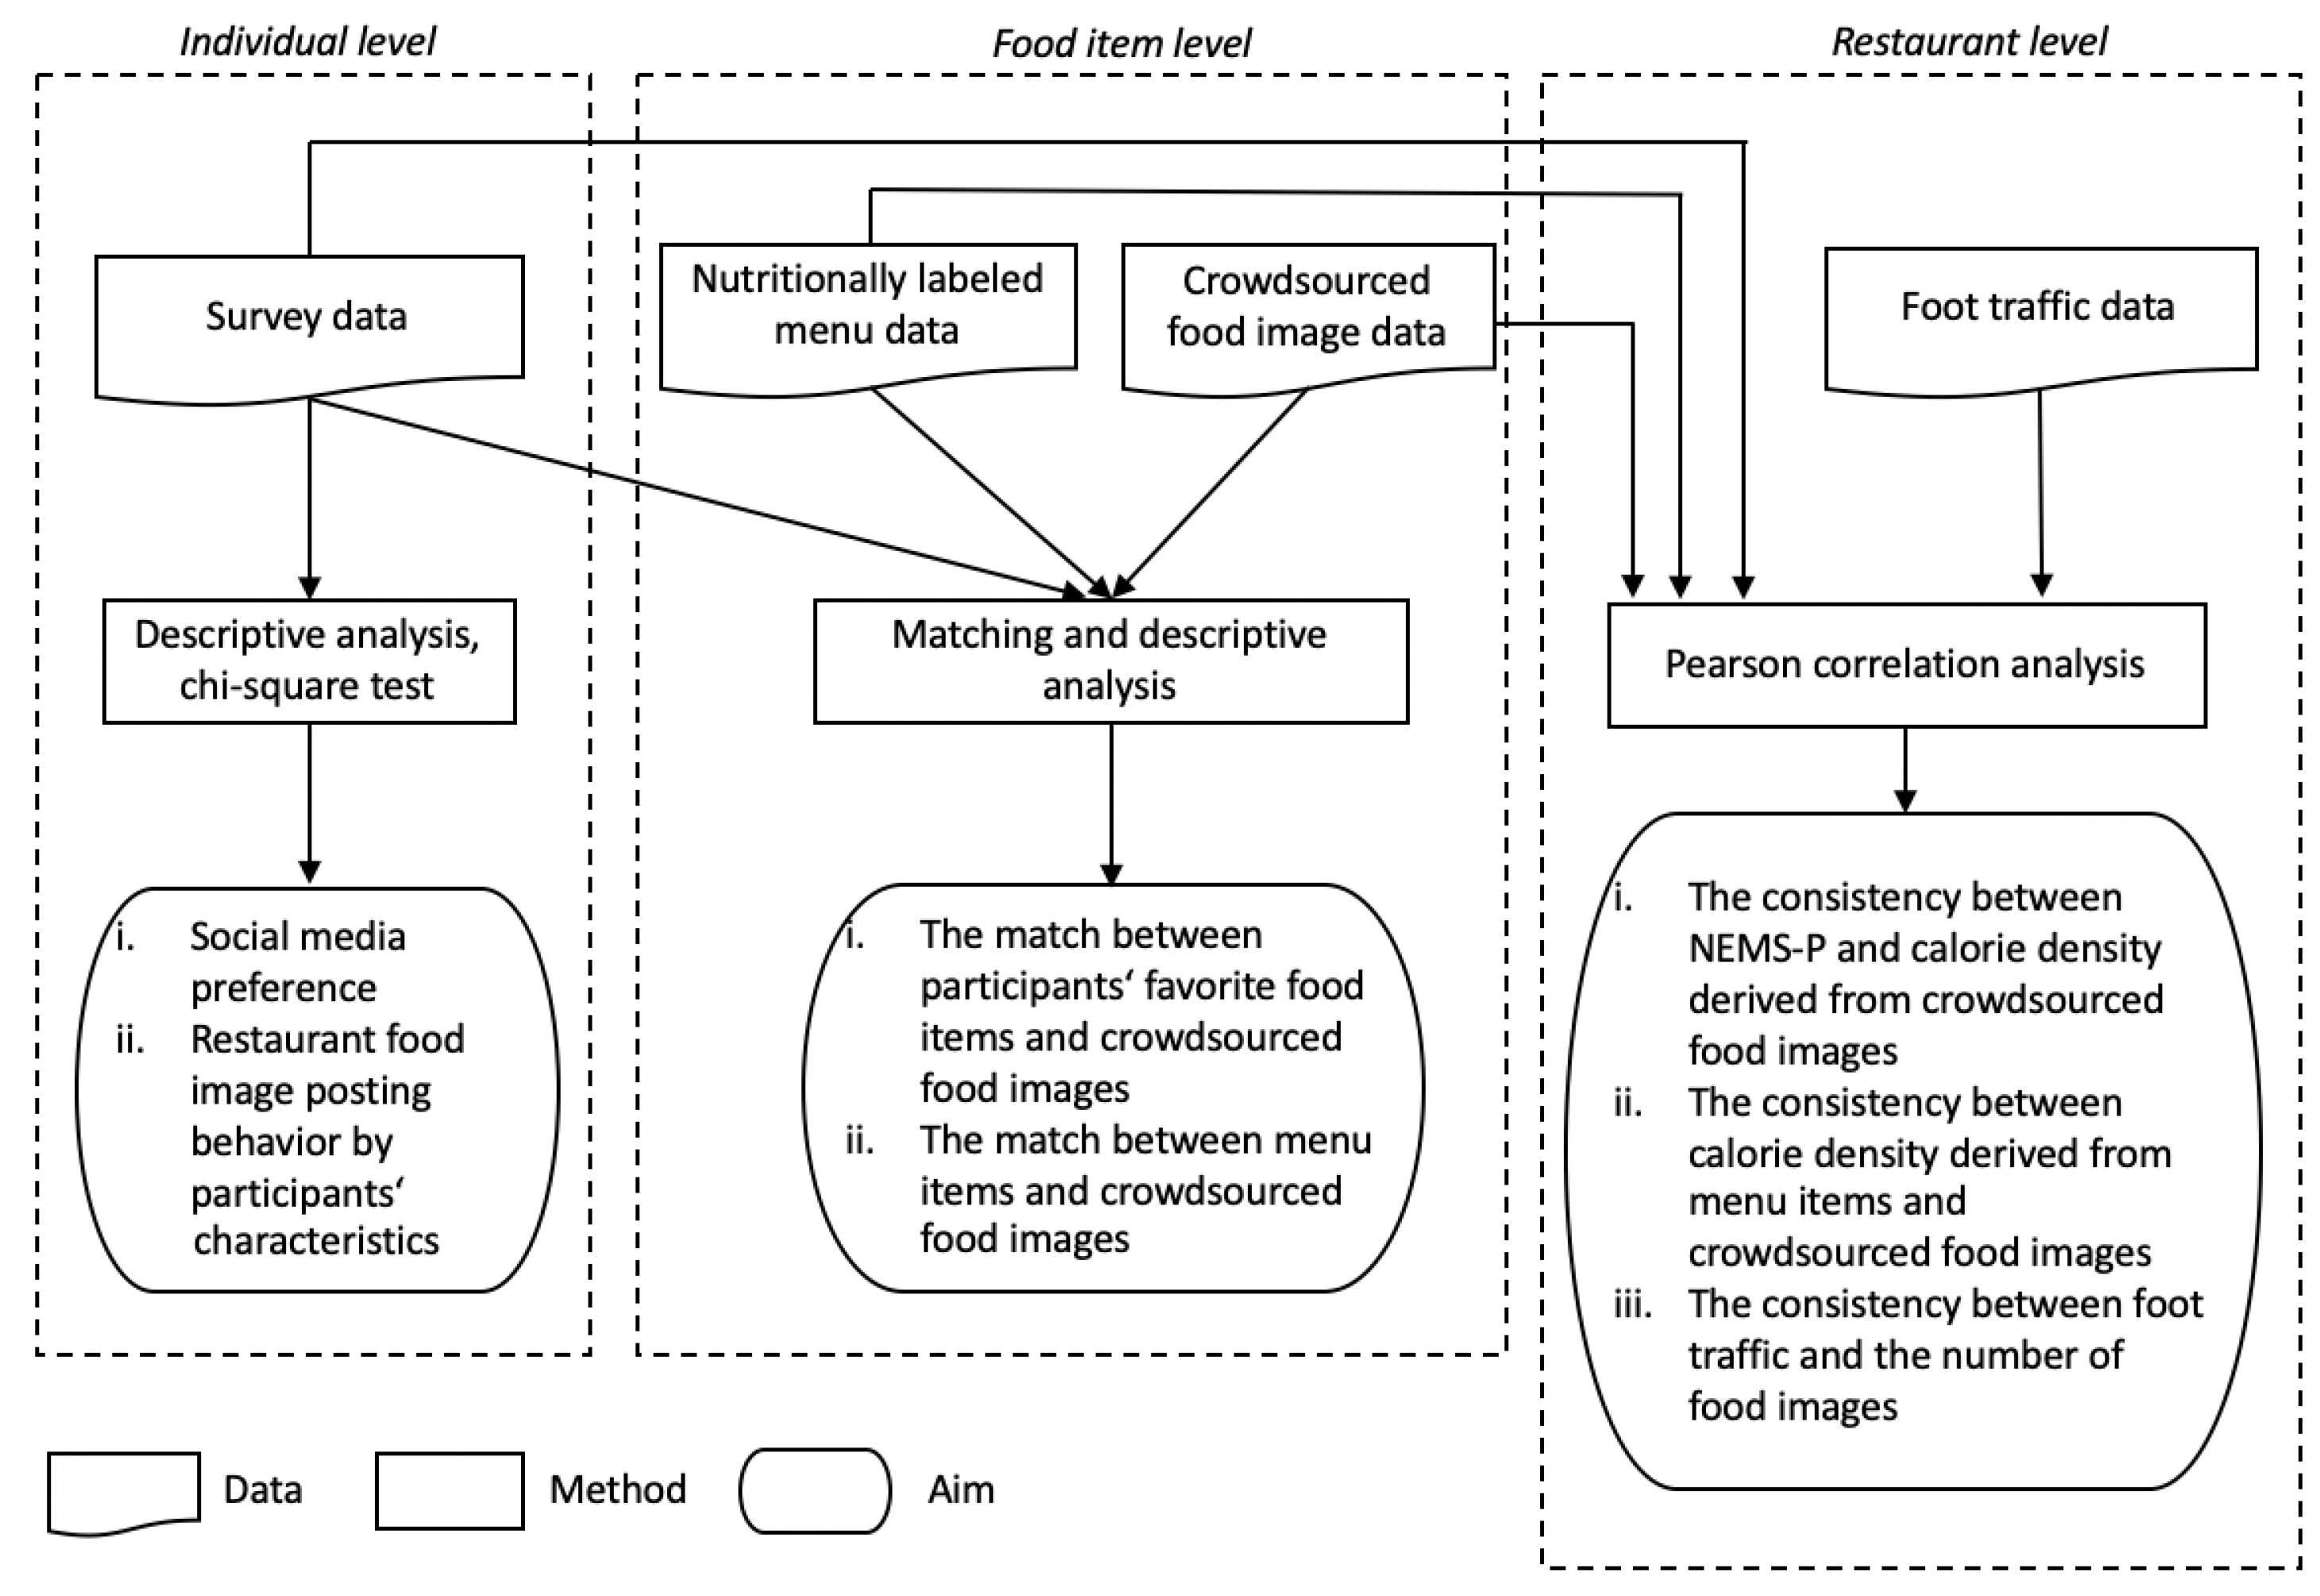
2.3. Analysis
3. Results
3.1. Participant Level
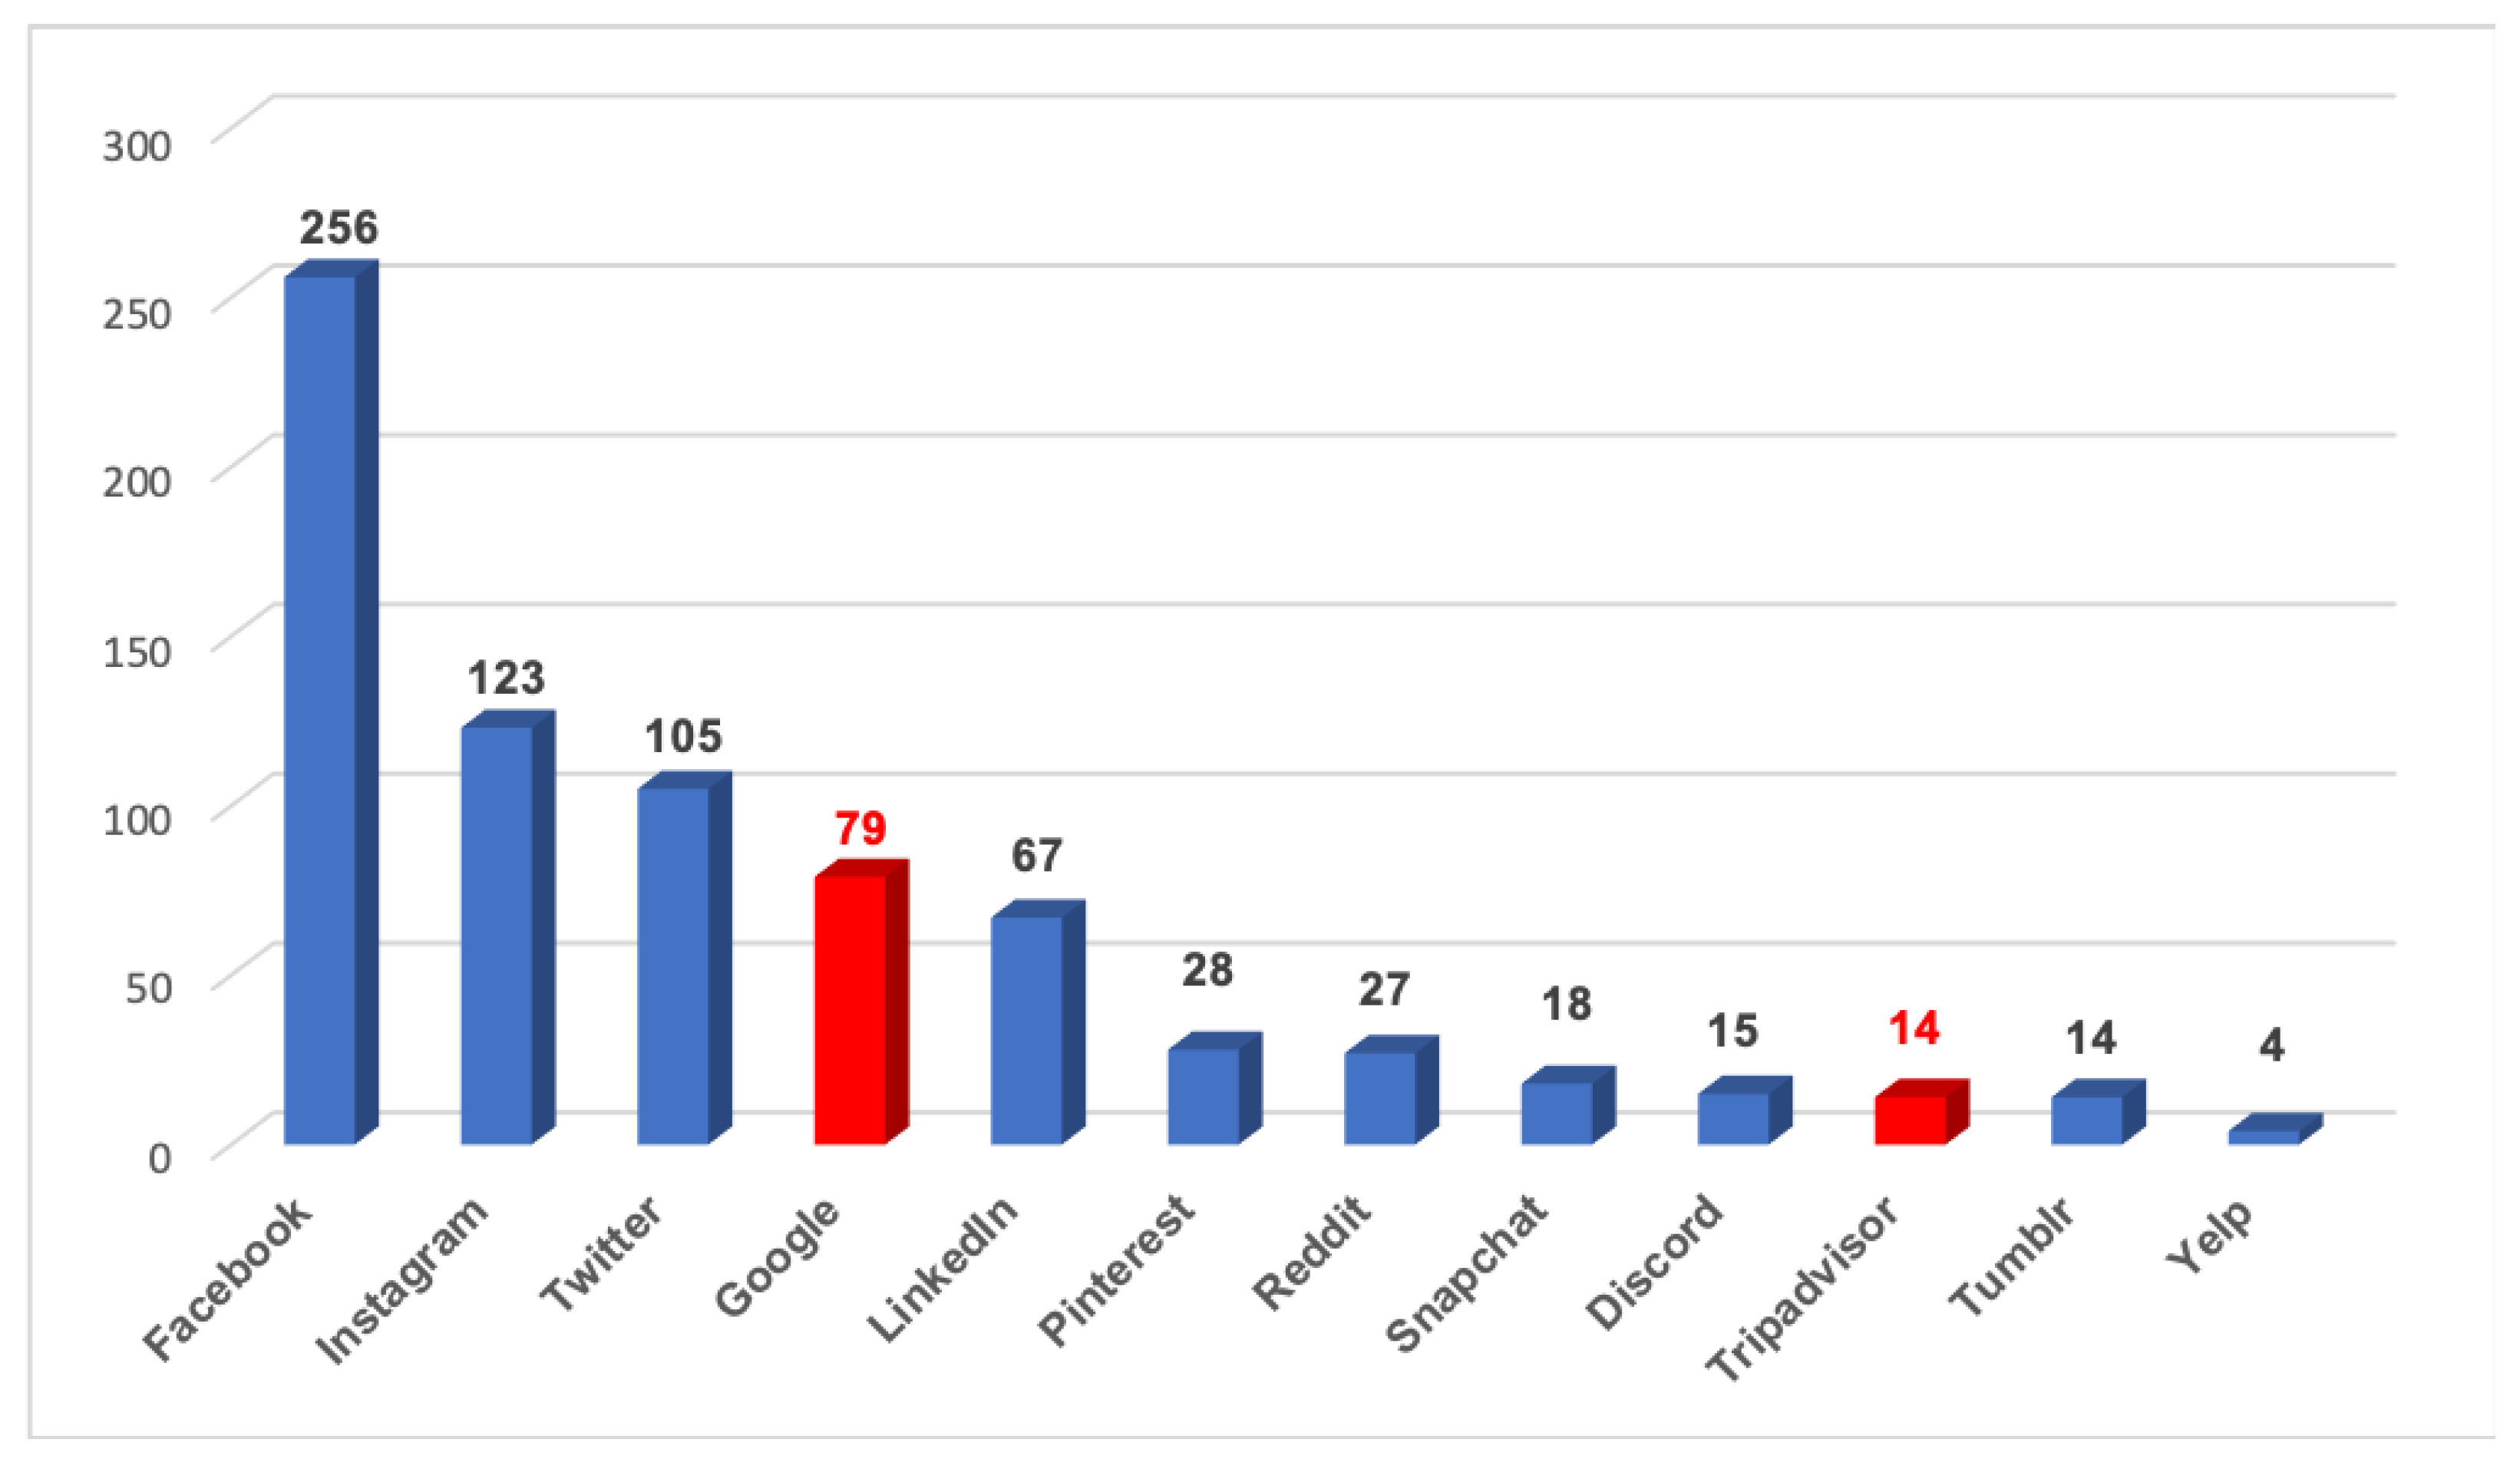
3.1.1. Participant Characteristics and Social Media Preference
3.1.2. Restaurant Food Image Posting Behavior by Participants’ Characteristics
3.2. Food Item Level
3.2.1. Participants’ Favorite Food Items and Crowdsourced Food Images
3.2.2. Menu Items and Crowdsourced Food Images
3.3. Restaurant Level
3.3.1. NEMS-P Scores and Average Calorie Density
3.3.2. Calories Derived from Menu Items and Food Image Recognition
3.3.3. Foot Traffic and Number of Food Images
4. Discussion
5. Conclusions
Author Contributions
Funding
Institutional Review Board Statement
Informed Consent Statement
Data Availability Statement
Acknowledgments
Conflicts of Interest
References
- Stewart, H. Food Away From Home. In The Oxford Handbook of the Economics of Food Consumption and Policy; Lusk, J.L., Roosen, J., Shogren, J.F., Eds.; Oxford University Press: Oxford, UK, 2011; pp. 646–666. ISBN 978-0-19-956944-1. [Google Scholar]
- Lin, B.-H.; Guthrie, J.; Smith, T. Dietary Quality by Food Source and Demographics in the United States, 1977–2018. Available online: http://www.ers.usda.gov/publications/pub-details/?pubid=105955 (accessed on 12 September 2023).
- U.S. Consumers’ Food Spending Hit Record High in 2022. Available online: http://www.ers.usda.gov/data-products/chart-gallery/gallery/chart-detail/?chartId=106851 (accessed on 20 August 2023).
- Lin, B.-H.; Guthrie, J. Nutritional Quality of Food Prepared at Home and Away From Home, 1977-2008. Available online: https://ageconsearch.umn.edu/record/142361/ (accessed on 20 August 2023).
- Todd, J.E.; Mancino, L.; Lin, B.-H. The Impact of Food Away from Home on Adult Diet Quality. SSRN J. 2010. [Google Scholar] [CrossRef]
- Seguin, R.A.; Aggarwal, A.; Vermeylen, F.; Drewnowski, A. Consumption Frequency of Foods Away from Home Linked with Higher Body Mass Index and Lower Fruit and Vegetable Intake among Adults: A Cross-Sectional Study. J. Environ. Public Health 2016, 2016, 3074241. [Google Scholar] [CrossRef] [PubMed]
- Mancino, L.; Todd, J.; Lin, B.-H. Separating What We Eat from Where: Measuring the Effect of Food Away from Home on Diet Quality. Food Policy 2009, 34, 557–562. [Google Scholar] [CrossRef]
- An, R. Fast-Food and Full-Service Restaurant Consumption and Daily Energy and Nutrient Intakes in US Adults. Eur. J. Clin. Nutr. 2016, 70, 97–103. [Google Scholar] [CrossRef]
- Godbharle, S.; Jeyakumar, A.; Giri, B.R.; Kesa, H. Pooled Prevalence of Food Away from Home (FAFH) and Associated Non-Communicable Disease (NCD) Markers: A Systematic Review and Meta-Analysis. J. Health Popul. Nutr. 2022, 41, 55. [Google Scholar] [CrossRef]
- Zong, G.; Eisenberg, D.M.; Hu, F.B.; Sun, Q. Consumption of Meals Prepared at Home and Risk of Type 2 Diabetes: An Analysis of Two Prospective Cohort Studies. PLoS Med. 2016, 13, e1002052. [Google Scholar] [CrossRef]
- Mancino, L.; Todd, J.E.; Guthrie, J.; Lin, B.-H. Food Away from Home and Childhood Obesity. Curr. Obes. Rep. 2014, 3, 459–469. [Google Scholar] [CrossRef]
- Gillis, L.J.; Bar-Or, O. Food Away from Home, Sugar-Sweetened Drink Consumption and Juvenile Obesity. J. Am. Coll. Nutr. 2003, 22, 539–545. [Google Scholar] [CrossRef]
- Glanz, K.; Sallis, J.F.; Saelens, B.E.; Frank, L.D. Healthy Nutrition Environments: Concepts and Measures. Am. J. Health Promot. 2005, 19, 330–333. [Google Scholar] [CrossRef]
- Saelens, B.E.; Glanz, K.; Sallis, J.F.; Frank, L.D. Nutrition Environment Measures Study in Restaurants (NEMS-R)Development and Evaluation. Am. J. Prev. Med. 2007, 32, 273–281. [Google Scholar] [CrossRef]
- Lytle, L.A.; Sokol, R.L. Measures of the Food Environment: A Systematic Review of the Field, 2007–2015. Health Place 2017, 44, 18–34. [Google Scholar] [CrossRef]
- Kelly, B.; Flood, V.M.; Yeatman, H. Measuring Local Food Environments: An Overview of Available Methods and Measures. Health Place 2011, 17, 1284–1293. [Google Scholar] [CrossRef]
- Charreire, H.; Casey, R.; Salze, P.; Simon, C.; Chaix, B.; Banos, A.; Badariotti, D.; Weber, C.; Oppert, J.-M. Measuring the Food Environment Using Geographical Information Systems: A Methodological Review. Public Health Nutr. 2010, 13, 1773–1785. [Google Scholar] [CrossRef] [PubMed]
- Shim, J.-S.; Oh, K.; Kim, H.C. Dietary Assessment Methods in Epidemiologic Studies. Epidemiol. Health 2014, 36, e2014009. [Google Scholar] [CrossRef] [PubMed]
- Picó, C.; Serra, F.; Rodríguez, A.M.; Keijer, J.; Palou, A. Biomarkers of Nutrition and Health: New Tools for New Approaches. Nutrients 2019, 11, 1092. [Google Scholar] [CrossRef] [PubMed]
- Martin, C.K.; Nicklas, T.; Gunturk, B.; Correa, J.B.; Allen, H.R.; Champagne, C. Measuring Food Intake with Digital Photography. J. Hum. Nutr. Diet 2014, 27, 72–81. [Google Scholar] [CrossRef] [PubMed]
- Potischman, N. Biologic and Methodologic Issues for Nutritional Biomarkers. J. Nutr. 2003, 133, 875S–880S. [Google Scholar] [CrossRef]
- Wild, C.P.; Andersson, C.; O’Brien, N.M.; Wilson, L.; Woods, J.A. A Critical Evaluation of the Application of Biomarkers in Epidemiological Studies on Diet and Health. Br. J. Nutr. 2001, 86, S37–S53. [Google Scholar] [CrossRef]
- Williamson, D.A.; Allen, H.R.; Martin, P.D.; Alfonso, A.; Gerald, B.; Hunt, A. PAPER for Estimating Food Intake in Cafeteria. Eat. Weight. Disord. 2004, 9, 24–28. [Google Scholar] [CrossRef]
- Martin, C.K.; Han, H.; Coulon, S.M.; Allen, H.R.; Champagne, C.M.; Anton, S.D. A Novel Method to Remotely Measure Food Intake of Free-Living Individuals in Real Time: The Remote Food Photography Method. Br. J. Nutr. 2008, 101, 446–456. [Google Scholar] [CrossRef]
- Rollo, M.E.; Ash, S.; Lyons-Wall, P.; Russell, A. Trial of a Mobile Phone Method for Recording Dietary Intake in Adults with Type 2 Diabetes: Evaluation and Implications for Future Applications. J. Telemed. Telecare 2011, 17, 318–323. [Google Scholar] [CrossRef] [PubMed]
- Kawano, Y.; Yanai, K. Food Image Recognition with Deep Convolutional Features. In Proceedings of the 2014 ACM International Joint Conference on Pervasive and Ubiquitous Computing: Adjunct Publication, Seattle, WA, USA, 13 September 2014; pp. 589–593. [Google Scholar]
- Liu, C.; Cao, Y.; Luo, Y.; Chen, G.; Vokkarane, V.; Ma, Y. DeepFood: Deep Learning-Based Food Image Recognition for Computer-Aided Dietary Assessment. In Inclusive Smart Cities and Digital Health; Chang, C.K., Chiari, L., Cao, Y., Jin, H., Mokhtari, M., Aloulou, H., Eds.; Lecture Notes in Computer Science; Springer International Publishing: Cham, Switzerland, 2016; Volume 9677, pp. 37–48. ISBN 978-3-319-39600-2. [Google Scholar]
- Christodoulidis, S.; Anthimopoulos, M.; Mougiakakou, S. Food Recognition for Dietary Assessment Using Deep Convolutional Neural Networks. In New Trends in Image Analysis and Processing—ICIAP 2015 Workshops; Murino, V., Puppo, E., Sona, D., Cristani, M., Sansone, C., Eds.; Lecture Notes in Computer Science; Springer International Publishing: Cham, Switzerland, 2015; Volume 9281, pp. 458–465. ISBN 978-3-319-23221-8. [Google Scholar]
- Mezgec, S.; Koroušić Seljak, B. NutriNet: A Deep Learning Food and Drink Image Recognition System for Dietary Assessment. Nutrients 2017, 9, 657. [Google Scholar] [CrossRef] [PubMed]
- Dehais, J.; Anthimopoulos, M.; Mougiakakou, S. Food Image Segmentation for Dietary Assessment. In Proceedings of the 2nd International Workshop on Multimedia Assisted Dietary Management, Amsterdam, The Netherlands, 16 October 2016; pp. 23–28. [Google Scholar]
- Chen, X.; Johnson, E.; Kulkarni, A.; Ding, C.; Ranelli, N.; Chen, Y.; Xu, R. An Exploratory Approach to Deriving Nutrition Information of Restaurant Food from Crowdsourced Food Images: Case of Hartford. Nutrients 2021, 13, 4132. [Google Scholar] [CrossRef] [PubMed]
- Chen, X.; Zhao, B.; Yang, X. The Obesogenity of Restaurant Food: Mapping the Nutritional Foodscape of Franklin County, Ohio Using Food Review Images. Appl. Geogr. 2022, 144, 102717. [Google Scholar] [CrossRef]
- 2022 Online Reviews Statistics and Trends: A Report by ReviewTrackers. Available online: https://www.reviewtrackers.com/reports/online-reviews-survey/ (accessed on 1 August 2023).
- Homepage. Available online: https://dev.caloriemama.ai/ (accessed on 1 August 2023).
- Van Asbroeck, S.; Matthys, C. Use of Different Food Image Recognition Platforms in Dietary Assessment: Comparison Study. JMIR Form. Res. 2020, 4, e15602. [Google Scholar] [CrossRef]
- Patterns|SafeGraph Docs. Available online: https://docs.safegraph.com/docs/monthly-patterns (accessed on 1 August 2023).
- Determining Points of Interest Visits From Location Data: A Technical Guide To Visit Attribution. Available online: https://safegraph.com/guides/visit-attribution-white-paper (accessed on 1 August 2023).
- Restaurant Menus Online: Pizza, Chinese, and More—Allmenus. Available online: https://www.allmenus.com/ (accessed on 1 August 2023).
- FoodData Central. Available online: https://fdc.nal.usda.gov/ (accessed on 1 August 2023).
- Green, S.H.; Glanz, K. Development of the Perceived Nutrition Environment Measures Survey. Am. J. Prev. Med. 2015, 49, 50–61. [Google Scholar] [CrossRef]
- Amichai-Hamburger, Y.; Vinitzky, G. Social Network Use and Personality. Comput. Hum. Behav. 2010, 26, 1289–1295. [Google Scholar] [CrossRef]
- Dhir, A.; Torsheim, T. Age and Gender Differences in Photo Tagging Gratifications. Comput. Hum. Behav. 2016, 63, 630–638. [Google Scholar] [CrossRef]
- Thelwall, M.; Vis, F. Gender and Image Sharing on Facebook, Twitter, Instagram, Snapchat and WhatsApp in the UK: Hobbying Alone or Filtering for Friends? Aslib J. Inf. Manag. 2017, 69, 702–720. [Google Scholar] [CrossRef]
- You, Q.; Bhatia, S.; Sun, T.; Luo, J. The Eyes of the Beholder: Gender Prediction Using Images Posted in Online Social Networks. In Proceedings of the 2014 IEEE International Conference on Data Mining Workshop, Shenzhen, China, 14 December 2014; pp. 1026–1030. [Google Scholar]
- Kelley, M.J. Urban Experience Takes an Informational Turn: Mobile Internet Usage and the Unevenness of Geosocial Activity. GeoJournal 2014, 79, 15–29. [Google Scholar] [CrossRef]
- Shen, Y.; Clarke, P.; Gomez-Lopez, I.N.; Hill, A.B.; Romero, D.M.; Goodspeed, R.; Berrocal, V.J.; Vydiswaran, V.V.; Veinot, T.C. Using Social Media to Assess the Consumer Nutrition Environment: Comparing Yelp Reviews with a Direct Observation Audit Instrument for Grocery Stores. Public Health Nutr. 2019, 22, 257–264. [Google Scholar] [CrossRef] [PubMed]
- Ghosh, D.; Guha, R. What Are We ‘Tweeting’ about Obesity? Mapping Tweets with Topic Modeling and Geographic Information System. Cartogr. Geogr. Inf. Sci. 2013, 40, 90–102. [Google Scholar] [CrossRef] [PubMed]
- Widener, M.J.; Li, W. Using Geolocated Twitter Data to Monitor the Prevalence of Healthy and Unhealthy Food References across the US. Appl. Geogr. 2014, 54, 189–197. [Google Scholar] [CrossRef]
- Schomberg, J.P.; Haimson, O.L.; Hayes, G.R.; Anton-Culver, H. Supplementing Public Health Inspection via Social Media. PLoS ONE 2016, 11, e0152117. [Google Scholar] [CrossRef]
- Chen, X.; Yang, X. Does Food Environment Influence Food Choices? A Geographical Analysis through “Tweets.” Appl. Geogr. 2014, 51, 82–89. [Google Scholar] [CrossRef]
- Vydiswaran, V.G.V.; Romero, D.M.; Zhao, X.; Yu, D.; Gomez-Lopez, I.; Lu, J.X.; Iott, B.E.; Baylin, A.; Jansen, E.C.; Clarke, P.; et al. Uncovering the Relationship between Food-Related Discussion on Twitter and Neighborhood Characteristics. J. Am. Med. Inform. Assoc. 2020, 27, 254–264. [Google Scholar] [CrossRef]
- Nguyen, Q.C.; Meng, H.; Li, D.; Kath, S.; McCullough, M.; Paul, D.; Kanokvimankul, P.; Nguyen, T.X.; Li, F. Social Media Indicators of the Food Environment and State Health Outcomes. Public Health 2017, 148, 120–128. [Google Scholar] [CrossRef]
- Sears, A.; Shneiderman, B. Split Menus: Effectively Using Selection Frequency to Organize Menus. ACM Trans. Comput.-Hum. Interact. 1994, 1, 27–51. [Google Scholar] [CrossRef]
- Lu, L.; Chi, C.G.-Q. Examining Diners’ Decision-Making of Local Food Purchase: The Role of Menu Stimuli and Involvement. Int. J. Hosp. Manag. 2018, 69, 113–123. [Google Scholar] [CrossRef]
- Dayan, E.; Bar-Hillel, M. Nudge to Nobesity II: Menu Positions Influence Food Orders. Judgm. Decis. Mak. 2011, 6, 333–342. [Google Scholar] [CrossRef]
- Full Service Restaurants Vs. Limited Service Restaurants: What’s the Difference? CHD Expert 2012. Available online: file:///Users/weixuanlyu/Zotero/storage/QCJL354X/full-service-restaurants-vs-limited-service-restaurants-whats-the-difference.html (accessed on 11 August 2023).
- Javed, M.; Malik, F.A.; Awan, T.M.; Khan, R. Food Photo Posting on Social Media While Dining: An Evidence Using Embedded Correlational Mixed Methods Approach. J. Food Prod. Mark. 2021, 27, 10–26. [Google Scholar] [CrossRef]
- Peng, Y. Feast for the Eyes: Effects of Food Perceptions and Computer Vision Features on Food Photo Popularity. Int. J. Commun. 2018, 12, 313–336. [Google Scholar]

| Characteristics | N (%) |
|---|---|
| Gender | |
| Male | 227 (53.5%) |
| Female | 195 (46%) |
| Other | 2 (0.2%) |
| Age | |
| 18–24 | 18 (4.2%) |
| 25–34 | 237 (55.9%) |
| 35–44 | 136 (32.1%) |
| 45–54 | 20 (4.7%) |
| 55–64 | 6 (1.4%) |
| 65 and above | 7 (1.7%) |
| Race | |
| American Indian or Alaska Native | 21 (5%) |
| Asian | 32 (7.5%) |
| Black or African-American | 64 (15.1%) |
| Native Hawaiian or Other Pacific Islander | 8 (1.9%) |
| White | 298 (70.3%) |
| Other | 3 (0.7%) |
| Education | |
| Finished middle school | 12 (2.8%) |
| Finished high school or got a GED | 51 (12%) |
| Some college | 117 (27.6%) |
| Completed a 2-year college degree | 94 (22.2%) |
| Completed a 4-year college degree | 122 (28.8%) |
| Completed a graduate degree | 27 (6.4%) |
| Income (USD) | |
| Less than 20,000 | 8 (1.9%) |
| 20,000–39,999 | 51 (12%) |
| 40,000–59,999 | 148 (34.9%) |
| 60,000–79,999 | 78 (18.4%) |
| 80,000–99,999 | 56 (13.2%) |
| 100,000–149,999 | 66 (15.6%) |
| 150,000–199,999 | 10 (2.4%) |
| 200,000 and above | 7 (1.7%) |
| Employment | |
| A homemaker | 8 (1.9%) |
| A student | 10 (2.4%) |
| Employed for wages | 302 (71.2%) |
| Military | 3 (0.7%) |
| Out of work and looking for work | 32 (7.5%) |
| Out of work but not currently looking for work | 22 (5.2%) |
| Self-employed | 42 (9.9%) |
| Retired | 5 (1.2%) |
| Marital status | |
| Married or domestic partnership | 328 (77.4%) |
| Single, never married | 78 (18.4%) |
| Widowed, divorced, or separated | 18 (4.2%) |
| Access to a car | |
| Yes | 385 (90.8%) |
| No | 39 (9.2%) |
| Always | Very Often | Sometimes | Rarely | Never | Total | |
|---|---|---|---|---|---|---|
| Gender (chi-squared = 7.5, p = 0.5) | ||||||
| Male | 38 (17%) | 78 (34%) | 71 (31%) | 19 (8%) | 21 (9%) | 227 |
| Female | 39 (20%) | 58 (30%) | 50 (26%) | 24 (12%) | 24 (12%) | 195 |
| Other | 1 (50%) | 0 (0%) | 1 (50%) | 0 (0%) | 0 (0%) | 2 |
| Age (chi-squared = 108.2, p < 0.0001) | ||||||
| 18–24 | 1 (6%) | 5 (28%) | 7 (39%) | 4 (22%) | 1 (6%) | 18 |
| 25–34 | 63 (27%) | 94 (40%) | 51 (22%) | 16 (7%) | 13 (5%) | 237 |
| 35–44 | 12 (9%) | 33 (24%) | 54 (40%) | 18 (13%) | 19 (14%) | 136 |
| 45–54 | 2 (10%) | 3 (15%) | 10 (50%) | 1 (5%) | 4 (20%) | 20 |
| 55–64 | 0 (0%) | 0 (0%) | 0 (0%) | 3 (50%) | 3 (50%) | 6 |
| 65 and above | 0 (0%) | 1 (14%) | 0 (0%) | 1 (14%) | 5 (71%) | 7 |
| Race (chi-squared = 35.1, p = 0.02) | ||||||
| American Indian or Alaska Native | 1 (5%) | 3 (14%) | 8 (38%) | 4 (19%) | 5 (24%) | 21 |
| Asian | 4 (13%) | 5 (16%) | 12 (38%) | 3 (9%) | 8 (25%) | 32 |
| Black or African-American | 11 (17%) | 22 (34%) | 19 (30%) | 9 (14%) | 3 (5%) | 64 |
| Native Hawaiian or Other Pacific Islander | 0 (0%) | 2 (25%) | 4 (50%) | 1 (13%) | 1 (13%) | 8 |
| White | 62 (21%) | 104 (35%) | 78 (26%) | 25 (8%) | 27 (9%) | 296 |
| Other | 0 (0%) | 0 (0%) | 1 (33%) | 1 (33%) | 1 (33%) | 3 |
| Education (chi-squared = 90.7, p < 0.0001) | ||||||
| Finished middle school | 3 (25%) | 2 (17%) | 5 (42%) | 2 (17%) | 1 (8%) | 12 |
| Finished high school or got a General Educational Development (GED) | 5 (10%) | 17 (33%) | 21 (41%) | 3 (6%) | 5 (10%) | 51 |
| Some college | 10 (9%) | 52 (44%) | 31 (26%) | 10 (9%) | 14 (12%) | 117 |
| Completed a 2-year college degree | 4 (4%) | 31 (33%) | 40 (43%) | 12 (13%) | 7 (7%) | 94 |
| Completed a 4-year college degree | 49 (40%) | 31 (25%) | 18 (15%) | 13 (11%) | 11 (9%) | 122 |
| Completed a graduate degree | 7 (26%) | 3 (11%) | 7 (26%) | 3 (11%) | 7 (26%) | 27 |
| Income (USD) (chi-squared = 123.0, p < 0.0001) | ||||||
| Less than 20,000 | 0 (0%) | 2 (25%) | 1 (13%) | 5 (63%) | 0 (0%) | 8 |
| 20,000–39,999 | 6 (12%) | 17 (33%) | 21 (41%) | 3 (6%) | 4 (8%) | 51 |
| 40,000–59,999 | 30 (20%) | 62 (42%) | 34 (23%) | 13 (9%) | 9 (6%) | 148 |
| 60,000–79,999 | 7 (9%) | 28 (36%) | 28 (36%) | 8 (10%) | 7 (9%) | 78 |
| 80,000–99,999 | 5 (9%) | 7 (13%) | 25 (45%) | 7 (13%) | 12 (21%) | 56 |
| 100,000–149,999 | 28 (42%) | 17 (26%) | 10 (15%) | 4 (6%) | 7 (11%) | 66 |
| 150,000–199,999 | 2 (20%) | 2 (20%) | 3 (30%) | 2 (20%) | 1 (10%) | 10 |
| 200,000 and above | 0 (0%) | 1 (14%) | 0 (0%) | 1 (14%) | 5 (71%) | 7 |
| Employment (chi-squared = 78.5, p < 0.0001) | ||||||
| A homemaker | 1 (13%) | 3 (38%) | 3 (38%) | 0 (0%) | 1 (13%) | 8 |
| A student | 0 (0%) | 3 (30%) | 2 (20%) | 4 (40%) | 1 (10%) | 10 |
| Employed for wages | 65 (22%) | 102 (34%) | 77 (25%) | 24 (8%) | 34 (11%) | 302 |
| Military | 0 (0%) | 1 (33%) | 1 (33%) | 1 (33%) | 0 (0%) | 3 |
| Out of work and looking for work | 4 (13%) | 11 (34%) | 11 (34%) | 5 (16%) | 1 (3%) | 32 |
| Out of work, but not currently looking for work | 2 (9%) | 4 (18%) | 10 (45%) | 5 (23%) | 1 (5%) | 22 |
| Self-employed | 6 (14%) | 12 (29%) | 18 (43%) | 4 (10%) | 2 (5%) | 42 |
| Retired | 0 (0%) | 0 (0%) | 0 (0%) | 0 (0%) | 5 (100%) | 5 |
| Marital status (chi-squared = 20.4, p = 0.01) | ||||||
| Married or domestic partnership | 68 (21%) | 110 (34%) | 91 (28%) | 24 (7%) | 35 (11%) | 328 |
| Single, never married | 9 (12%) | 23 (29%) | 23 (29%) | 16 (21%) | 7 (9%) | 78 |
| Widowed, divorced, or separated | 1 (6%) | 3 (17%) | 8 (44%) | 3 (17%) | 3 (17%) | 18 |
| Access to a car (chi-squared = 18.4, p = 0.001) | ||||||
| Yes | 78 (20%) | 124 (32%) | 110 (29%) | 33 (9%) | 40 (10%) | 385 |
| No | 0 (0%) | 12 (31%) | 12 (31%) | 10 (26%) | 5 (13%) | 39 |
| Mean (SD) | Range | |
|---|---|---|
| All restaurants (n = 120) | 44% (18%) | 2–96% |
| Full-service (n = 60) | 40% (12%) | 2–67% |
| Limited-service (n = 60) | 48% (22%) | 7–96% |
| Composite Item | Availability of Healthy Options | Restaurant Promotes Healthy Options/Nutrition Information | Costs More to Buy Healthy Options | |
|---|---|---|---|---|
| Model estimated calorie density of the restaurant | Correlation coefficient ® | 0.06 | 0.17 | 0.24 |
| p | 0.6 | 0.1 | 0.03 | |
| Cronbach’s alpha (α) | 0.5 | 0.5 | na | |
| Calories Calculated from the Menu: All Restaurants (n = 419) | Calories Calculated from the Menu: Full-Service Restaurants (n = 114) | Calories Calculated from the Menu: Limited-Service Restaurants (n = 305) | ||
|---|---|---|---|---|
| Calories estimated by the image recognition model | Pearson Correlation | 0.16 ** | 0.17 | 0.17 ** |
| p | 0.001 | 0.076 | 0.002 | |
| Number of Images of Total Restaurants from Food Image Dataset (n = 359) | Number of Images of Full-Service Restaurants from Food Image Dataset (n = 69) | Number of Images of Limited-Service Restaurants from Food Image Dataset (n = 290) | ||
|---|---|---|---|---|
| Foot traffic from SafeGraph | Pearson Correlation | 0.14 ** | 0.24 * | 0.11 |
| p | 0.007 | 0.047 | 0.063 | |
Disclaimer/Publisher’s Note: The statements, opinions and data contained in all publications are solely those of the individual author(s) and contributor(s) and not of MDPI and/or the editor(s). MDPI and/or the editor(s) disclaim responsibility for any injury to people or property resulting from any ideas, methods, instructions or products referred to in the content. |
© 2023 by the authors. Licensee MDPI, Basel, Switzerland. This article is an open access article distributed under the terms and conditions of the Creative Commons Attribution (CC BY) license (https://creativecommons.org/licenses/by/4.0/).
Share and Cite
Lyu, W.; Seok, N.; Chen, X.; Xu, R. Using Crowdsourced Food Image Data for Assessing Restaurant Nutrition Environment: A Validation Study. Nutrients 2023, 15, 4287. https://doi.org/10.3390/nu15194287
Lyu W, Seok N, Chen X, Xu R. Using Crowdsourced Food Image Data for Assessing Restaurant Nutrition Environment: A Validation Study. Nutrients. 2023; 15(19):4287. https://doi.org/10.3390/nu15194287
Chicago/Turabian StyleLyu, Weixuan, Nina Seok, Xiang Chen, and Ran Xu. 2023. "Using Crowdsourced Food Image Data for Assessing Restaurant Nutrition Environment: A Validation Study" Nutrients 15, no. 19: 4287. https://doi.org/10.3390/nu15194287
APA StyleLyu, W., Seok, N., Chen, X., & Xu, R. (2023). Using Crowdsourced Food Image Data for Assessing Restaurant Nutrition Environment: A Validation Study. Nutrients, 15(19), 4287. https://doi.org/10.3390/nu15194287