Abstract
Little is known about the inflammatory potential of diet and its relation to bone health. This cross-sectional study examined the association between the inflammatory potential of diet and bone-related outcomes in midwestern, post-menopausal women enrolled in the Heartland Osteoporosis Prevention Study (HOPS) randomized controlled trial. Dietary intake from the HOPS cohort was used to calculate Dietary Inflammatory Index (DII®) scores, which were energy-adjusted (E-DIITM) and analyzed by quartile. The association between E-DII and lumbar and hip bone mineral density (BMD) and lumbar trabecular bone scores (TBS; bone structure) was assessed using ANCOVA, with pairwise comparison to adjust for relevant confounders (age, education, race/ethnicity, smoking history, family history of osteoporosis/osteopenia, BMI, physical activity, and calcium intake). The cohort included 272 women, who were predominately white (89%), educated (78% with college degree or higher), with a mean BMI of 27 kg/m2, age of 55 years, and E-DII score of −2.0 ± 1.9 (more anti-inflammatory). After adjustment, E-DII score was not significantly associated with lumbar spine BMD (p = 0.53), hip BMD (p = 0.29), or TBS at any lumbar location (p > 0.05). Future studies should examine the longitudinal impact of E-DII scores and bone health in larger, more diverse cohorts.
1. Introduction
As the most common bone disease among adults, osteoporosis is a major public health concern, affecting approximately 54 million people in the United States and 200 million worldwide [1,2]. Osteoporosis increases risk of fractures, leading to increased disability, decreased mobility, and decreased quality of life [2,3]. Post-menopausal women are a high-risk group for developing osteoporosis as the hormonal changes surrounding menopause contribute to rapid bone loss, creating porous and thin bones [3]. This leads to one in two post-menopausal women developing a fracture [1,2]. Testing bone mineral density (BMD) is a widely accepted marker for the diagnosis of osteoporosis and can aid in the prediction of fracture risks. Dual-energy X-ray absorptiometry (DXA) is a validated method of assessing bone health outcomes [1,2]. Trabecular bone scores (TBS), used in DXA measurements to assess bone microarchitecture for variation in bone texture, are an emerging adjunct fracture risk identifier [4,5]. As such, TBS provide additional bone health information on bone structure, complementing the standard BMD assessment and enhancing fracture risk stratification [5]. Therefore, it is pertinent to include measures of TBS in the evaluation of overall bone health, something not currently seen in the majority of bone health literature.
There are many lifestyle modifications, including diet, known to aid in the prevention and management of osteoporosis. Traditional bone-related nutrients including vitamins D and K, calcium, and magnesium, are known to play significant roles in the protection and promotion of bone health [6]. Most commonly, these nutrients are found in dairy products, which has received thorough investigation in terms of its role in increasing BMD in post-menopausal women [7]. Furthermore, many studies have examined the effects of specific dietary patterns including the Mediterranean diet, Healthy Eating Index, and Alternate Healthy Eating Index, among others, on bone health and osteoporosis [8,9]. Dietary patterns that are high in vegetables, fruits, fish, whole grains, legumes, and dairy products are associated with higher BMD, while dietary patterns with the excessive consumption of sweets, caffeinated beverages, and meats are associated with lower BMD [10,11]. However, some research has yielded inconsistent results, with other studies reporting no association between dietary pattern scores and bone density [9,12].
The association between dietary patterns and bone health may also be related to the inflammatory effect of diet on bone health. Chronic inflammation stems from a variety of sources, including diet, and is associated with a deleterious effect on bone health [13,14]. The pro-inflammatory potential of the diet is associated with biomarkers of inflammation including C-reactive protein (CRP), interleukin-1β (IL-1β), IL-6, and tumor necrosis factor-alpha (TNF-α) and anti-inflammatory diet potential is associated with the biomarkers IL-4 and IL-10 [15]. Higher concentrations of these circulating inflammatory biomarkers, including CRP, IL-6, and TNF-α, have been associated with lower BMD [13,16]. A novel approach to studying the effect of inflammatory diets on bone outcomes is the Dietary Inflammatory Index (DII®) [15]. As opposed to previous studies that have evaluated certain dietary patterns, the DII itself is not a dietary pattern. Rather, the DII is a scoring algorithm that takes into consideration the synergistic effect of multiple individual nutrients and certain foods (e.g., garlic and onion) on the inflammatory potential of the diet.
While diet plays a key role in modulating inflammation, little research has been performed utilizing a quantitative measure of the overall effect of diet on inflammatory potential and its relation to bone health in the prevention and management of osteoporosis. Thus, the objective of this study was to determine the relationship between the inflammatory potential of diet, as measured by the DII, and bone-related outcomes of midwestern post-menopausal women screened for enrollment in the Heartland Osteoporosis Prevention Study (HOPS) [17]. It was hypothesized that a diet with higher inflammatory potential would be associated with poorer measures of bone health as measured using DXA.
2. Materials and Methods
Study population: This study was a secondary cross-sectional analysis of data collected from the Heartland Osteoporosis Prevention Study (HOPS). HOPS was a randomized controlled trial (RCT) that evaluated the impact of risedronate versus exercise on bone outcomes in women within six years of menopause with a diagnosis of low bone mass (T-score of −1.0 to −2.49) [17]. Potential participants were recruited from eastern Nebraska and western Iowa and underwent a multi-step screening process, starting with a pre-screen questionnaire. In the parent study, 3033 persons were assessed for eligibility, with a total of 276 out of the optimal enrollment goal of 302 enrolled and randomized (Figure 1A) [18]. For inclusion into the present study, all women completing the in-person screening visit, which included a DXA scan, physical activity assessment, and a demographic questionnaire, were eligible, regardless of the parent study eligibility criteria. The HOPS RCT was approved by the Institutional Review Board (IRB) of the University of Nebraska Medical Center and written consent was obtained at the time of screening. Additional information regarding HOPS recruitment, enrollment, and HOPS study design are detailed elsewhere [17].
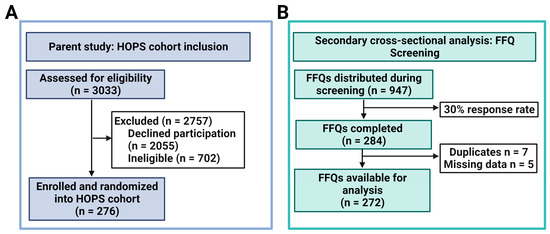
Figure 1.
(A,B). Participant inclusion flowchart for parent study (A); Food frequency questionnaire (FFQ) inclusion flowchart (B).
Diet Intake Assessment: In addition to the original study protocol, the need for complete dietary assessment was acknowledged. Therefore, a separate protocol was developed to capture these data after the initiation of the parent study. Screening for this ancillary study was performed at the time of eligibility screening after original enrollment began. The present study evaluated dietary intakes using the Harvard semi-quantitative food frequency questionnaire (FFQ), which has been previously validated and used in a variety of cohorts, including female populations [19,20]. Dietary intake was assessed during the screening process, where FFQs were either provided to women at the in-person screening assessment or mailed to their home address. A total of 947 FFQ surveys were distributed. Of those 947 surveys, 284 were completed—a 30% response rate. Of the 284 completed surveys, seven duplicate records were removed (retaining the first entry), and five records were removed for missing data, for a total of 272 eligible diet records (Figure 1B). The completed FFQs were analyzed by the Nutrition Department, Harvard School of Public Health, providing absolute values for intakes of nutrients, including supplements.
Calculation of the Dietary Inflammatory Index (DII®): The DII has been previously validated with various inflammatory markers, including in post-menopausal women, and a complete description of the DII scoring process has been detailed elsewhere [15,21]. To summarize, the DII includes up to 45 components with individual inflammatory effect scores. In the present study, a total of 34 DII components were available from the FFQs for score calculation (Table 1). The calculation for the DII is based on dietary data from a world database, providing an estimate of a mean and standard deviation (SD) for each food-derived parameter. Dietary data collected from study participants are used to calculate z-scores and centered percentiles based on the world average intake in order to minimize “right skewing” [15]. The centered proportion scores are multiplied by the corresponding food parameter effect scores, creating food parameter-specific DII scores that are summed to produce the overall DII score for each participant. In this study, energy-adjusted DII (E-DII™) scores were calculated for each participant, using the available assessed nutrients from the FFQs to account for caloric intake in relation to the amount of nutrients consumed. E-DII scores are calculated per 1000 calories of food consumed, utilizing the energy-standardized version of the world database [22]. A higher, more positive E-DII score designates a more pro-inflammatory diet, whereas smaller, more negative E-DII values indicate more anti-inflammatory diets. In this analysis, E-DII scores were the primary exposures. E-DII scores were analyzed by quartiles, wherein the highest E-DII quartile (quartile 4) represents the most pro-inflammatory diet, while the lower quartiles indicate more anti-inflammatory diets.

Table 1.
DII components available for calculation of the DII score *.
Bone outcome measures: The outcome measures for this study included bone outcomes from DXA scans, which provide BMD and TBS, the latter being a measure of bone structure. BMD and TBS measurements were taken using a Hologic DXA instrument (Hologic QDR2000™ model, Hologic Inc., Waltham, MA, USA) [17]. The densitometer was operated by a certified radiological technician at Creighton University Osteoporosis Research Center. BMD outcome locations included lumbar spine BMD (L1-L4) and total hip BMD. TBS was obtained via the re-analysis of lumbar spine DXA images, using the beta version 4.0 of TBS software (TBS Osteo 4.0-beta) to account for abdominal soft tissue thickness (TBS iNsight®; Medimaps Group USA LLC, Wilmington, DE, USA) [17]. TBS outcome locations included TBS of individual lumbar vertebra (L1, L2, L3, and L4) and total TBS L1–L4.
Other measures: Baseline demographic information and clinical data were obtained from the HOPS database and included age (years), education (some college or less, which includes less than a high school diploma, high school diploma or some college but no degree; college degree; master’s or doctorate degree), race/ethnicity (white/non-Hispanic; non-white/other), smoking history (ever/never), BMI (≤24.9 kg/m2, 25–29.9 kg/m2, and ≥30 kg/m2), calcium intake (including supplemental calcium; mg), and physical activity category. Physical activity was evaluated via the International Physical Activity Questionnaire (IPAQ) and activity levels were categorized into inactive, minimally active, and health-enhancing physical activity (HEPA) [23]. HEPA denotes physical activity levels that exceed the minimum public health physical activity recommendations.
Statistical analysis: Baseline descriptive statistics were reported for all continuous and categorical variables (mean, standard deviation, counts and percentages). The baseline statistics were presented for the total population and by E-DII quartile, with quartile 1 representing the greatest anti-inflammatory potential and quartile 4 representing the least substantial pro-inflammatory potential. Differences in baseline characteristics were assessed by E-DII quartile, with analysis of variance (ANOVA) used for continuous data and chi-square tests applied to categorical data with pairwise adjustments for multiple comparisons. The differences in bone outcomes were assessed by E-DII quartile via ANCOVA, with pairwise adjustments used for multiple comparisons to explore the adjusted relationship addressing covariances of age, education, race/ethnicity, smoking history, family history of osteoporosis/osteopenia, BMI, physical activity, and calcium intake. Analysis was conducted using SAS, Version 9.4. For all analyses, a p value < 0.05 was considered statistically significant.
3. Results
3.1. Characteristics of the Study Population
The final analysis included 272 participants (Figure 1B). Participant characteristics, categorized by quartiles, are displayed in Table 2 according to total population and E-DII scores. The majority of participants were white (89%), never-smokers (76%), and overweight (mean BMI of 27 kg/m2), with a mean age of about 55 years old. The mean (SD) E-DII score was −2.0 ± 1.9, indicating more anti-inflammatory diet potential. Baseline mean calcium intake was 1396.4 ± 604.2. There were no significant differences between E-DII quartiles in relation to education level, BMI categories, smoking status, race, and family history of osteoporosis. Calcium intake was significantly different across E-DII quartiles (p = 0.01). Physical activity was significantly different across E-DII quartiles (p = 0.02), where those in quartile 1 (most anti-inflammatory) had a higher percentage of participants with HEPA (E-DII Q1: 41% HEPA) compared to those in quartile 4 (most pro-inflammatory), who had the highest proportion of inactive participants (E-DII Q4: 44% Inactive).
Table 2.
Participant characteristics of post-menopausal women overall and by quartiles of E-DII scores.
3.2. E-DII Quartiles and Bone Outcomes
Results for the ANCOVA analysis between E-DII quartiles and bone outcomes are displayed in Table 3. No significant associations were found between DXA outcomes and E-DII quartiles after adjustment.
Table 3.
The relationship between E-DII quartiles and mean bone outcomes of post-menopausal women after adjustment for relevant confounders.
4. Discussion
In this study, there was no association between bone outcomes, including BMD, TBS, and dietary inflammatory potential. To our knowledge, we are among the first to include TBS among bone outcomes in the assessment of their relationship with E-DII in post-menopausal women. While chronic inflammation has been associated with an increased risk in osteoporosis and dietary patterns are known to impact inflammatory markers, little investigation has been carried out using E-DII to evaluate the impact on bone health.
Our cohort was predominately white, with most being overweight or obese, and the mean E-DII scores suggested an anti-inflammatory diet. While not all previous studies reported E-DII scores, our population’s average E-DII score was more anti-inflammatory compared to previous DII studies involving post-menopausal cohorts, which had reported higher DII scores ranging from −1.18 to 0.85 [24,25,26,27,28]. This suggests that the diet of our sample was more anti-inflammatory than that of the larger population of post-menopausal women, which could limit our ability to see an association between E-DII and bone outcomes. Additionally, 78% of the sample had completed college or obtained a post-graduate degree. This high level of education likely contributed to diet habits being healthier than those of the broad population, with there being consistent evidence that more highly educated women bias self-reports of their intake towards less calorie-dense foods on the basis of social desirability [29,30,31]. Therefore, it is conceivable that self-reports in this cohort reflect such bias. Unfortunately, as with most studies, no information on social desirability was collected within the HOPS cohort to account for this factor.
TBS has been associated with fracture history and improving prediction of fracture risk, with increasing attention in its role in risk of osteoporosis, but its relationship with dietary factors is yet to be fully understood [4,5]. Of the few studies that have examined the impact of nutrition or dietary patterns on TBS, most report no association with dietary factors such as dairy or calcium intake [32,33,34]. A three-year retrospective medical record review of middle-aged to older women examined the impact of vegetarian dietary patterns on bone outcomes, including BMD and TBS. This study found that, while perimenopausal-aged women following a vegetarian diet had lower BMD, TBS did not differ between dietary patterns for any ages [35]. Other studies provide inconsistent evidence on the impact of alcohol use and protein sources on TBS [36,37,38]. For example, in the VITAL RCT, which included women aged ≥ 55 years, univariate analysis demonstrated that high alcohol intake was associated with lower TBS (p = 0.009). However, when adjusted for age, sex and race, alcohol intake was positively associated with TBS (β = 0.019, p = 0.041) [37]. This contradicts an earlier study examining Canadian post-menopausal women, which found, after adjustment, alcohol abuse to be associated with lower TBS [38]. There is even further limited evidence on the use of the E-DII/DII and trabecular measurements, with one study of healthy adolescents find no relationship between the DII and tibia trabecular area after adjustment [39]. While our findings are consistent with most of the existing diet-related literature, further investigation is warranted among larger, more diverse cohorts.
Unlike previous studies that have reviewed the DII and bone outcomes, our study did not find any significant association between BMD and E-DII scores after adjustment for important potential confounders. One of the first studies to evaluate the inflammatory potential of diet using the DII and BMD was an observational study of post-menopausal Iranian women aged 50–85 years [40]. After adjustment, an increase in DII was found to be significantly associated with a decrease in the BMD of the lumbar spine (β = −0.03, p = 0.001). When the DII was analyzed as a categorical variable, the odds of having a DII score greater than the DII median was 2.3 times higher in those with lower lumbar spine BMD, suggesting that poorer lumbar spine BMD was associated with diets that have greater pro-inflammatory potential (OR = 2.3, p = 0.04) [40]. Adding to the literature, a study by Mazidi et al. aimed to evaluate the relationship between the DII, bone fractures, and DXA outcomes [41]. This study was conducted among American men and women using the 2005 and 2010 National Health and Nutrition Examination Surveys (NHANES). In the adjusted, stratified analysis of women, moving from quartile 1 (least inflammatory) to quartile 4 (most inflammatory), we found that those with more anti-inflammatory diet potential had significantly higher mean lumbar vertebrae L3 BMD, lumber vertebrae L4 BMD, total femur BMD, femoral neck BMD, trochanter BMD, and intertrochanter BMD [41]. While our study adjusted for many of the same covariates, the study of Mazidi et al. additionally controlled for C-reactive protein (CRP). This may have affected their outcomes as CRP levels take into account systemic inflammation status. The inflammatory potential of diets has also been shown to impact BMD over time, as seen in a study utilizing the Women’s Health Initiative, one of the largest post-menopausal women cohorts in the United States [25]. Here, they demonstrated how, after adjustment, women with the least substantial inflammatory diet potential (quartile 1) had a less significant loss of hip BMD over a period of six years than those in quartile four with the highest inflammatory potential (p < 0.0001). Interestingly, a recent meta-analysis of bone heath and DII found BMD and fracture risk to only be significantly associated with DII scores in non-cohort studies (i.e., case control or cross-sectional) [42]. While our results represent a cross-sectional analysis of an RCT and differ from these recent findings, it is possible that differences in sample size or populations studied, including potential for reporting bias, led to these contrary findings.
There are several potential mechanisms by which diet impacts bone outcomes, including the role of chronic inflammation and oxidative stress [43,44]. In fact, a recent systematic review and meta-analysis of post-menopausal osteoporosis demonstrated that specific oxidative stress biomarkers, accompanied by decreased total antioxidant status and total antioxidant power, were significant among those with osteoporosis. Additionally, it was found that these markers may be beneficial to follow in clinical care [44]. As diet serves as an ample source of antioxidants and has previously been associated with decreasing inflammation [45], it warrants further investigation for its potential to improve bone health. Preliminary research has been undertaken with antioxidant dietary components used to improve bone health in post-menopausal women. Examples include resveratrol, which can be found in grapes and berries. The Resveratrol for Healthy Aging in Women (RESHAW) trial examined the impact of the twice-daily supplementation of resveratrol on bone health in a 24-month randomized crossover controlled intervention [46]. After 12 months, bone density was improved in the intervention group, along with a reduction in the probability of fracture risk. This study highlights the utility of emphasizing the dietary intake of antioxidant-rich foods, such as resveratrol. While individual dietary components may contribute to bone health outcomes, the DII integrates the synergistic effects of multiple antioxidants, nutrients, and foods together, warranting further investigation.
It is also important to note the interplay between diet, obesity, and inflammation as it pertains to bone health. As previously stated, the majority of our population were overweight or obese. Obesity is associated with increased systemic inflammation and oxidative stress, leading to higher risk of fracture and osteoporosis, as well as the dysregulation of calcium homeostasis and protein synthesis [47,48,49,50,51]. Therefore, it is reasonable to speculate that the effect of pro-inflammatory diets on bones could be more pronounced in women who already carry an increased burden of inflammation due to obesity. Few studies have been conducted into defining the connection between higher BMI and pro-inflammatory DII scores with poorer bone health, including the increased risk of fractures and osteoporosis. A study in post-menopausal women based on data from 2009 to 2011 Korea National Health and Nutrition Examination Surveys found that those with DII scores of >−0.07 (more pro-inflammatory) were 2.757 (95% CI: 1.398, 5.438, p = 0.004) times more likely to have osteopenic obesity and 2.186 (95% CI: 1.182, 4.044; p = 0.013) times more likely to have osteosarcopenic obesity than those with more anti-inflammatory DII scores (≤−0.07) [52]. It is important to note that in this population of Korean women, a BMI of >25kg/m2 was used to define obesity, whereas this would encompass overweight and obesity within United States National Institutes of Health (NIH) guideline classifications [53]. This study reinforces the idea that relative components of lean and fat mass are important factors to consider in the relationship of DII and bone outcomes, not just weight status or BMI that are important, as current literature supports lean mass over fat mass use as a stronger predictor of BMD [54]. While our study controlled for BMI status, future studies should include additional measures of body composition.
Study Limitations
This is a cross-sectional study with DII and bone outcomes only analyzed at one time point, the screening visit of the parent RCT. Therefore, we could not conduct a prospective examination of the effects of the inflammatory potential of diet on bone outcomes. However, this is the first study to our knowledge to examine TBS scores in relation to E-DII. Little research has been undertaken to evaluate the relationship between nutrition and TBS; therefore, this study is important to moving the literature forward. While this study may be generalizable to white, midwestern post-menopausal women, future studies should aim to include more diverse populations. This study used an FFQ to assess dietary intake which can lead to under- or over-estimation of the actual dietary intake of the variables due to participant recall bias. An FFQ response rate of 30% may also carry additional bias in responders compared to non-responders, which cannot unable to be assessed. Additionally, social desirability bias in self-report data may be more strongly expressed in women, especially highly educated women, as seen in our population. This can potentially lead to skewed nutrient intakes from which E-DII scores were calculated [29,30,31]. However, the DII is a robust and validated scoring system used in numerous populations in more than 60 countries around the world [15]. To combat self-report bias and further quantify exposures, future studies should include the concurrent evaluation of biomarkers of nutrient intake and inflammation. Not accounting for vitamin D status at baseline may interfere with the analysis as low vitamin D status may contribute to poor bone outcomes independently. This would be an important covariate to include in future studies due to its role in bone health.
5. Conclusions
Osteoporosis is an important health concern, impact the lives of post-menopausal women and healthcare. Diet has long been studied for its potential as a minimally invasive preventative measure and treatment for osteoporosis. Our study advances the current literature as the first to assess the relationship of TBS and E-DII scores within post-menopausal women. However, we did not observe any significant associations between diet-derived inflammation and bone health after adjustment. It will be important for future studies to determine the impact of E-DII scores over time and whether changing to a more anti-inflammatory dietary pattern is associated with better bone outcomes long-term.
Author Contributions
Conceptualization, L.D.B., C.H. and M.K.J.; methodology, C.H., J.M., E.R.L., J.R.H. and S.P.; resources, L.D.B., N.L.W., J.R.H. and S.P.; validation, L.D.B., D.H. and J.M.; formal analysis, J.M. and E.R.L.; investigation, M.K.J., L.D.B. and C.H.; data curation, L.D.B. and N.L.W.; writing—original draft preparation, M.K.J. and C.H.; writing—review and editing, N.L.W., J.R.H., S.P., L.G.-A., J.A.P., L.R.M., D.H. and M.K.J.; visualization, M.K.J.; supervision, C.H. All authors have read and agreed to the published version of the manuscript.
Funding
National Institute of Nursing Research of the National Institutes of Health (award number R01NR015029). J.R.H. and S.P. were supported by grant U01 CA272977-01 from the National Cancer Institute. The present study has no other funding to disclose.
Institutional Review Board Statement
The original study was conducted in accordance with the Declaration of Helsinki, approved by the Institutional Review Board of University of Nebraska Medical Center and is registered on clinicaltrials.gov (NCT02186600).
Informed Consent Statement
Informed consent was obtained from all subjects involved in the original study.
Data Availability Statement
Not applicable.
Acknowledgments
Figure 1 was created using BioRender.com.
Conflicts of Interest
The Dietary Inflammatory Index (DII®) is a registered trademark of the University of South Carolina. J.R.H. owns controlling interest in Connecting Health Innovations LLC (CHI), a company planning to license the right to his invention of the DII from the University of South Carolina in order to develop computer and smart phone applications for patient counseling and dietary intervention in clinical settings. C.H. is funded by a Veteran’s Affairs Merit Award. J.A.P. received funding from the Department of Defense (#PR200793) and NIOSH (R01OH012045). J.A.P. is site recruiter (no monies) for patients with asthma and allergic skin and sinus disease with AstraZeneca, Regeneron, GSK. D.H. is co-owner of the TBS patent and has corresponding ownerships shares and position at Medimaps group. M.K.J., L.B., J.M., E.R.L., N.W., L.R.M., L.G-A., S.P. have no conflict or disclosures to report. No other disclosures were reported. The funders of the original study had no role in the design of the study; in the collection, analyses, or interpretation of data; in the writing of the manuscript, or in the decision to publish the results.
References
- Cotts, K.G.; Cifu, A.S. Treatment of Osteoporosis. JAMA 2018, 319, 1040–1041. [Google Scholar] [CrossRef]
- National Osteoporosis Foundation. What Is Osteoporosis and What Causes It? Available online: https://www.nof.org/patients/what-is-osteoporosis/ (accessed on 1 October 2022).
- Armas, L.A.; Recker, R.R. Pathophysiology of osteoporosis: New mechanistic insights. Endocrinol. Metab. Clin. N. Am. 2012, 41, 475–486. [Google Scholar] [CrossRef]
- Camacho, P.M.; Petak, S.M.; Binkley, N.; Diab, D.L.; Eldeiry, L.S.; Farooki, A.; Harris, S.T.; Hurley, D.L.; Kelly, J.; Lewiecki, E.M.; et al. American Association of Clinical Endocrinologists/american College of Endocrinology Clinical Practice Guidelines for the Diagnosis and Treatment of Postmenopausal Osteoporosis-2020 Update Executive Summary. Endocr. Pract. Off. J. Am. Coll. Endocrinol. Am. Assoc. Clin. Endocrinol. 2020, 26, 564–570. [Google Scholar] [CrossRef]
- Harvey, N.C.; Gluer, C.C.; Binkley, N.; McCloskey, E.V.; Brandi, M.L.; Cooper, C.; Kendler, D.; Lamy, O.; Laslop, A.; Camargos, B.M.; et al. Trabecular bone score (TBS) as a new complementary approach for osteoporosis evaluation in clinical practice. Bone 2015, 78, 216–224. [Google Scholar] [CrossRef]
- Movassagh, E.Z.; Vatanparast, H. Current Evidence on the Association of Dietary Patterns and Bone Health: A Scoping Review. Adv. Nutr. 2017, 8, 1–16. [Google Scholar] [CrossRef]
- Shi, Y.; Zhan, Y.; Chen, Y.; Jiang, Y. Effects of dairy products on bone mineral density in healthy postmenopausal women: A systematic review and meta-analysis of randomized controlled trials. Arch. Osteoporos. 2020, 15, 48. [Google Scholar] [CrossRef]
- Hamidi, M.; Tarasuk, V.; Corey, P.; Cheung, A.M. Association between the Healthy Eating Index and bone turnover markers in US postmenopausal women aged ≥ 45 y. Am. J. Clin. Nutr. 2011, 94, 199–208. [Google Scholar] [CrossRef]
- Zagarins, S.E.; Ronnenberg, A.G.; Gehlbach, S.H.; Lin, R.; Bertone-Johnson, E.R. Are existing measures of overall diet quality associated with peak bone mass in young premenopausal women? J. Hum. Nutr. Diet. Off. J. Br. Diet. Assoc. 2012, 25, 172–179. [Google Scholar] [CrossRef]
- de Jonge, E.A.; Kiefte-de Jong, J.C.; de Groot, L.C.; Voortman, T.; Schoufour, J.D.; Zillikens, M.C.; Hofman, A.; Uitterlinden, A.G.; Franco, O.H.; Rivadeneira, F. Development of a Food Group-Based Diet Score and Its Association with Bone Mineral Density in the Elderly: The Rotterdam Study. Nutrients 2015, 7, 6974–6990. [Google Scholar] [CrossRef]
- Fabiani, R.; Naldini, G.; Chiavarini, M. Dietary Patterns in Relation to Low Bone Mineral Density and Fracture Risk: A Systematic Review and Meta-Analysis. Adv. Nutr. 2019, 10, 219–236. [Google Scholar] [CrossRef]
- Langsetmo, L.; Poliquin, S.; Hanley, D.A.; Prior, J.C.; Barr, S.; Anastassiades, T.; Towheed, T.; Goltzman, D.; Kreiger, N.; CaMos Research, G. Dietary patterns in Canadian men and women ages 25 and older: Relationship to demographics, body mass index, and bone mineral density. BMC Musculoskelet. Disord. 2010, 11, 20. [Google Scholar] [CrossRef]
- Ding, C.; Parameswaran, V.; Udayan, R.; Burgess, J.; Jones, G. Circulating levels of inflammatory markers predict change in bone mineral density and resorption in older adults: A longitudinal study. J. Clin. Endocrinol. Metab. 2008, 93, 1952–1958. [Google Scholar] [CrossRef]
- Tang, Y.; Peng, B.; Liu, J.; Liu, Z.; Xia, Y.; Geng, B. Systemic immune-inflammation index and bone mineral density in postmenopausal women: A cross-sectional study of the national health and nutrition examination survey (NHANES) 2007–2018. Front. Immunol. 2022, 13, 975400. [Google Scholar] [CrossRef]
- Shivappa, N.; Steck, S.E.; Hurley, T.G.; Hussey, J.R.; Hebert, J.R. Designing and developing a literature-derived, population-based dietary inflammatory index. Public. Health Nutr. 2014, 17, 1689–1696. [Google Scholar] [CrossRef]
- de Pablo, P.; Cooper, M.S.; Buckley, C.D. Association between bone mineral density and C-reactive protein in a large population-based sample. Arthritis Rheum. 2012, 64, 2624–2631. [Google Scholar] [CrossRef]
- Bilek, L.D.; Waltman, N.L.; Lappe, J.M.; Kupzyk, K.A.; Mack, L.R.; Cullen, D.M.; Berg, K.; Langel, M.; Meisinger, M.; Portelli-Trinidad, A.; et al. Protocol for a randomized controlled trial to compare bone-loading exercises with risedronate for preventing bone loss in osteopenic postmenopausal women. BMC Women’s Health 2016, 16, 59. [Google Scholar] [CrossRef]
- Waltman, N.; Kupzyk, K.A.; Flores, L.E.; Mack, L.R.; Lappe, J.M.; Bilek, L.D. Bone-loading exercises versus risedronate for the prevention of osteoporosis in postmenopausal women with low bone mass: A randomized controlled trial. Osteoporos. Int. 2022, 33, 475–486. [Google Scholar] [CrossRef]
- Willett, W.C.; Sampson, L.; Stampfer, M.J.; Rosner, B.; Bain, C.; Witschi, J.; Hennekens, C.H.; Speizer, F.E. Reproducibility and validity of a semiquantitative food frequency questionnaire. Am. J. Epidemiol. 1985, 122, 51–65. [Google Scholar] [CrossRef]
- Yuan, C.; Spiegelman, D.; Rimm, E.B.; Rosner, B.A.; Stampfer, M.J.; Barnett, J.B.; Chavarro, J.E.; Rood, J.C.; Harnack, L.J.; Sampson, L.K.; et al. Relative Validity of Nutrient Intakes Assessed by Questionnaire, 24-Hour Recalls, and Diet Records as Compared With Urinary Recovery and Plasma Concentration Biomarkers: Findings for Women. Am. J. Epidemiol. 2018, 187, 1051–1063. [Google Scholar] [CrossRef]
- Tabung, F.K.; Steck, S.E.; Zhang, J.; Ma, Y.; Liese, A.D.; Agalliu, I.; Hingle, M.; Hou, L.; Hurley, T.G.; Jiao, L.; et al. Construct validation of the dietary inflammatory index among postmenopausal women. Ann. Epidemiol. 2015, 25, 398–405. [Google Scholar] [CrossRef]
- Hebert, J.R.; Shivappa, N.; Wirth, M.D.; Hussey, J.R.; Hurley, T.G. Perspective: The Dietary Inflammatory Index (DII)-Lessons Learned, Improvements Made, and Future Directions. Adv. Nutr. 2019, 10, 185–195. [Google Scholar] [CrossRef]
- Craig, C.L.; Marshall, A.L.; Sjöström, M.; Bauman, A.E.; Booth, M.L.; Ainsworth, B.E.; Pratt, M.; Ekelund, U.; Yngve, A.; Sallis, J.F.; et al. International physical activity questionnaire: 12-country reliability and validity. Med. Sci. Sports Exerc. 2003, 35, 1381–1395. [Google Scholar] [CrossRef]
- Ge, I.; Rudolph, A.; Shivappa, N.; Flesch-Janys, D.; Hébert, J.R.; Chang-Claude, J. Dietary inflammation potential and postmenopausal breast cancer risk in a German case-control study. Breast 2015, 24, 491–496. [Google Scholar] [CrossRef]
- Orchard, T.; Yildiz, V.; Steck, S.E.; Hebert, J.R.; Ma, Y.; Cauley, J.A.; Li, W.; Mossavar-Rahmani, Y.; Johnson, K.C.; Sattari, M.; et al. Dietary Inflammatory Index, Bone Mineral Density, and Risk of Fracture in Postmenopausal Women: Results From the Women’s Health Initiative. J. Bone Miner. Res. Off. J. Am. Soc. Bone Miner. Res. 2017, 32, 1136–1146. [Google Scholar] [CrossRef]
- Shivappa, N.; Blair, C.K.; Prizment, A.E.; Jacobs, D.R.; Hebert, J.R. Prospective study of the dietary inflammatory index and risk of breast cancer in postmenopausal women. Mol. Nutr. Food Res. 2017, 61, 1600592. [Google Scholar] [CrossRef]
- Shivappa, N.; Blair, C.K.; Prizment, A.E.; Jacobs, D.R., Jr.; Hebert, J.R. Dietary inflammatory index and risk of renal cancer in the Iowa Women’s Health Study. Eur. J. Nutr. 2018, 57, 1207–1213. [Google Scholar] [CrossRef]
- Tabung, F.K.; Steck, S.E.; Ma, Y.; Liese, A.D.; Zhang, J.; Lane, D.S.; Ho, G.Y.F.; Hou, L.; Snetselaar, L.; Ockene, J.K.; et al. Changes in the Inflammatory Potential of Diet Over Time and Risk of Colorectal Cancer in Postmenopausal Women. Am. J. Epidemiol. 2017, 186, 514–523. [Google Scholar] [CrossRef]
- Hebert, J.R. Social Desirability Trait: Biaser or Driver of Self-Reported Dietary Intake? J. Acad. Nutr. Diet. 2016, 116, 1895–1898. [Google Scholar] [CrossRef]
- Hebert, J.R.; Ebbeling, C.B.; Matthews, C.E.; Hurley, T.G.; Ma, Y.; Druker, S.; Clemow, L. Systematic errors in middle-aged women’s estimates of energy intake: Comparing three self-report measures to total energy expenditure from doubly labeled water. Ann. Epidemiol. 2002, 12, 577–586. [Google Scholar] [CrossRef]
- Hebert, J.R.; Ma, Y.; Clemow, L.; Ockene, I.S.; Saperia, G.; Stanek, E.J., 3rd; Merriam, P.A.; Ockene, J.K. Gender differences in social desirability and social approval bias in dietary self-report. Am. J. Epidemiol. 1997, 146, 1046–1055. [Google Scholar] [CrossRef]
- Anderson, K.B.; Holloway-Kew, K.L.; Hans, D.; Kotowicz, M.A.; Hyde, N.K.; Pasco, J.A. Physical and lifestyle factors associated with trabecular bone score values. Arch. Osteoporos. 2020, 15, 177. [Google Scholar] [CrossRef] [PubMed]
- Lanyan, A.; Marques-Vidal, P.; Gonzalez-Rodriguez, E.; Hans, D.; Lamy, O. Postmenopausal women with osteoporosis consume high amounts of vegetables but insufficient dairy products and calcium to benefit from their virtues: The CoLaus/OsteoLaus cohort. Osteoporos. Int. 2020, 31, 875–886. [Google Scholar] [CrossRef] [PubMed]
- Millar, C.L.; Kiel, D.P.; Hannan, M.T.; Sahni, S. Dairy food intake is not associated with spinal trabecular bone score in men and women: The Framingham Osteoporosis Study. Nutr. J. 2022, 21, 26. [Google Scholar] [CrossRef] [PubMed]
- Chuang, T.L.; Koo, M.; Chuang, M.H.; Lin, C.H.; Huang, C.H.; Wang, Y.F. Changes in Bone Mineral Density and Trabecular Bone Score over Time between Vegetarian and Non-Vegetarian Middle-Aged and Older Women: A Three-Year Retrospective Medical Record Review. Int. J. Environ. Res. Public. Health 2022, 19, 2445. [Google Scholar] [CrossRef] [PubMed]
- de Jonge, E.A.L.; Koromani, F.; Hofman, A.; Uitterlinden, A.G.; Franco, O.H.; Rivadeneira, F.; Kiefte-de Jong, J.C. Dietary acid load, trabecular bone integrity, and mineral density in an ageing population: The Rotterdam study. Osteoporos. Int. 2017, 28, 2357–2365. [Google Scholar] [CrossRef] [PubMed]
- Goldman, A.L.; Donlon, C.M.; Cook, N.R.; Manson, J.E.; Buring, J.E.; Copeland, T.; Yu, C.Y.; LeBoff, M.S. VITamin D and OmegA-3 TriaL (VITAL) bone health ancillary study: Clinical factors associated with trabecular bone score in women and men. Osteoporos. Int. 2018, 29, 2505–2515. [Google Scholar] [CrossRef] [PubMed]
- Leslie, W.D.; Krieg, M.A.; Hans, D.; Manitoba Bone Density, P. Clinical factors associated with trabecular bone score. J. Clin. Densitom. Off. J. Int. Soc. Clin. Densitom. 2013, 16, 374–379. [Google Scholar] [CrossRef] [PubMed]
- Coheley, L.M.; Shivappa, N.; Hebert, J.R.; Lewis, R.D. Dietary inflammatory index® and cortical bone outcomes in healthy adolescent children. Osteoporos. Int. 2019, 30, 1645–1654. [Google Scholar] [CrossRef]
- Shivappa, N.; Hebert, J.R.; Karamati, M.; Shariati-Bafghi, S.E.; Rashidkhani, B. Increased inflammatory potential of diet is associated with bone mineral density among postmenopausal women in Iran. Eur. J. Nutr. 2016, 55, 561–568. [Google Scholar] [CrossRef]
- Mazidi, M.; Shivappa, N.; Wirth, M.D.; Hebert, J.R.; Vatanparast, H.; Kengne, A.P. The association between dietary inflammatory properties and bone mineral density and risk of fracture in US adults. Eur. J. Clin. Nutr. 2017, 71, 1273–1277. [Google Scholar] [CrossRef]
- Taheri, E.; Mahdavi-Gorabi, A.; Moludi, J.; Asayesh, H.; Qorbani, M. A meta-analysis of dietary inflammatory index and bone health status. J. Diabetes Metab. Disord. 2022, 21, 109–121. [Google Scholar] [CrossRef] [PubMed]
- Biswas, S.K. Does the Interdependence between Oxidative Stress and Inflammation Explain the Antioxidant Paradox? Oxid. Med. Cell Longev. 2016, 2016, 5698931. [Google Scholar] [CrossRef] [PubMed]
- Zhao, F.; Guo, L.; Wang, X.; Zhang, Y. Correlation of oxidative stress-related biomarkers with postmenopausal osteoporosis: A systematic review and meta-analysis. Arch. Osteoporos. 2021, 16, 4. [Google Scholar] [CrossRef]
- Shivappa, N.; Hebert, J.R.; Marcos, A.; Diaz, L.E.; Gomez, S.; Nova, E.; Michels, N.; Arouca, A.; González-Gil, E.; Frederic, G.; et al. Association between dietary inflammatory index and inflammatory markers in the HELENA study. Mol. Nutr. Food Res. 2017, 61, 1600707. [Google Scholar] [CrossRef] [PubMed]
- Wong, R.H.; Thaung Zaw, J.J.; Xian, C.J.; Howe, P.R. Regular Supplementation With Resveratrol Improves Bone Mineral Density in Postmenopausal Women: A Randomized, Placebo-Controlled Trial. J. Bone Min. Res. 2020, 35, 2121–2131. [Google Scholar] [CrossRef] [PubMed]
- Barbour, K.E.; Boudreau, R.; Danielson, M.E.; Youk, A.O.; Wactawski-Wende, J.; Greep, N.C.; LaCroix, A.Z.; Jackson, R.D.; Wallace, R.B.; Bauer, D.C.; et al. Inflammatory markers and the risk of hip fracture: The Women’s Health Initiative. J. Bone Miner. Res. Off. J. Am. Soc. Bone Miner. Res. 2012, 27, 1167–1176. [Google Scholar] [CrossRef] [PubMed]
- Barbour, K.E.; Lui, L.Y.; Ensrud, K.E.; Hillier, T.A.; LeBlanc, E.S.; Ing, S.W.; Hochberg, M.C.; Cauley, J.A.; Study of Osteoporotic Fractures Research Group. Inflammatory markers and risk of hip fracture in older white women: The study of osteoporotic fractures. J. Bone Miner. Res. Off. J. Am. Soc. Bone Miner. Res. 2014, 29, 2057–2064. [Google Scholar] [CrossRef]
- Gonzalez, A.; Simon, F.; Achiardi, O.; Vilos, C.; Cabrera, D.; Cabello-Verrugio, C. The Critical Role of Oxidative Stress in Sarcopenic Obesity. Oxid. Med. Cell Longev. 2021, 2021, 4493817. [Google Scholar] [CrossRef]
- Ishii, S.; Cauley, J.A.; Greendale, G.A.; Crandall, C.J.; Danielson, M.E.; Ouchi, Y.; Karlamangla, A.S. C-reactive protein, bone strength, and nine-year fracture risk: Data from the Study of Women’s Health Across the Nation (SWAN). J. Bone Miner. Res. Off. J. Am. Soc. Bone Miner. Res. 2013, 28, 1688–1698. [Google Scholar] [CrossRef]
- Lumeng, C.N.; Saltiel, A.R. Inflammatory links between obesity and metabolic disease. J. Clin. Investig. 2011, 121, 2111–2117. [Google Scholar] [CrossRef]
- Park, S.; Na, W.; Sohn, C. Relationship between osteosarcopenic obesity and dietary inflammatory index in postmenopausal Korean women: 2009 to 2011 Korea National Health and Nutrition Examination Surveys. J. Clin. Biochem. Nutr. 2018, 63, 211–216. [Google Scholar] [CrossRef]
- National Institutes of Health. Clinical Guidelines on the Identification, Evaluation, and Treatment of Overweight and Obesity in Adults—The Evidence Report. Obes. Res. 1998, 6 (Suppl. S2), 51s–209s. [Google Scholar]
- Ilesanmi-Oyelere, B.L.; Coad, J.; Roy, N.; Kruger, M.C. Lean Body Mass in the Prediction of Bone Mineral Density in Postmenopausal Women. Biores. Open Access 2018, 7, 150–158. [Google Scholar] [CrossRef]
Disclaimer/Publisher’s Note: The statements, opinions and data contained in all publications are solely those of the individual author(s) and contributor(s) and not of MDPI and/or the editor(s). MDPI and/or the editor(s) disclaim responsibility for any injury to people or property resulting from any ideas, methods, instructions or products referred to in the content. |
© 2023 by the authors. Licensee MDPI, Basel, Switzerland. This article is an open access article distributed under the terms and conditions of the Creative Commons Attribution (CC BY) license (https://creativecommons.org/licenses/by/4.0/).