
Dietary Patterns and Association with Anemia in Children Aged 9–16 Years in Guangzhou, China: A Cross-Sectional Study
 ,
,
Abstract
:
1. Introduction
2. Materials and Methods
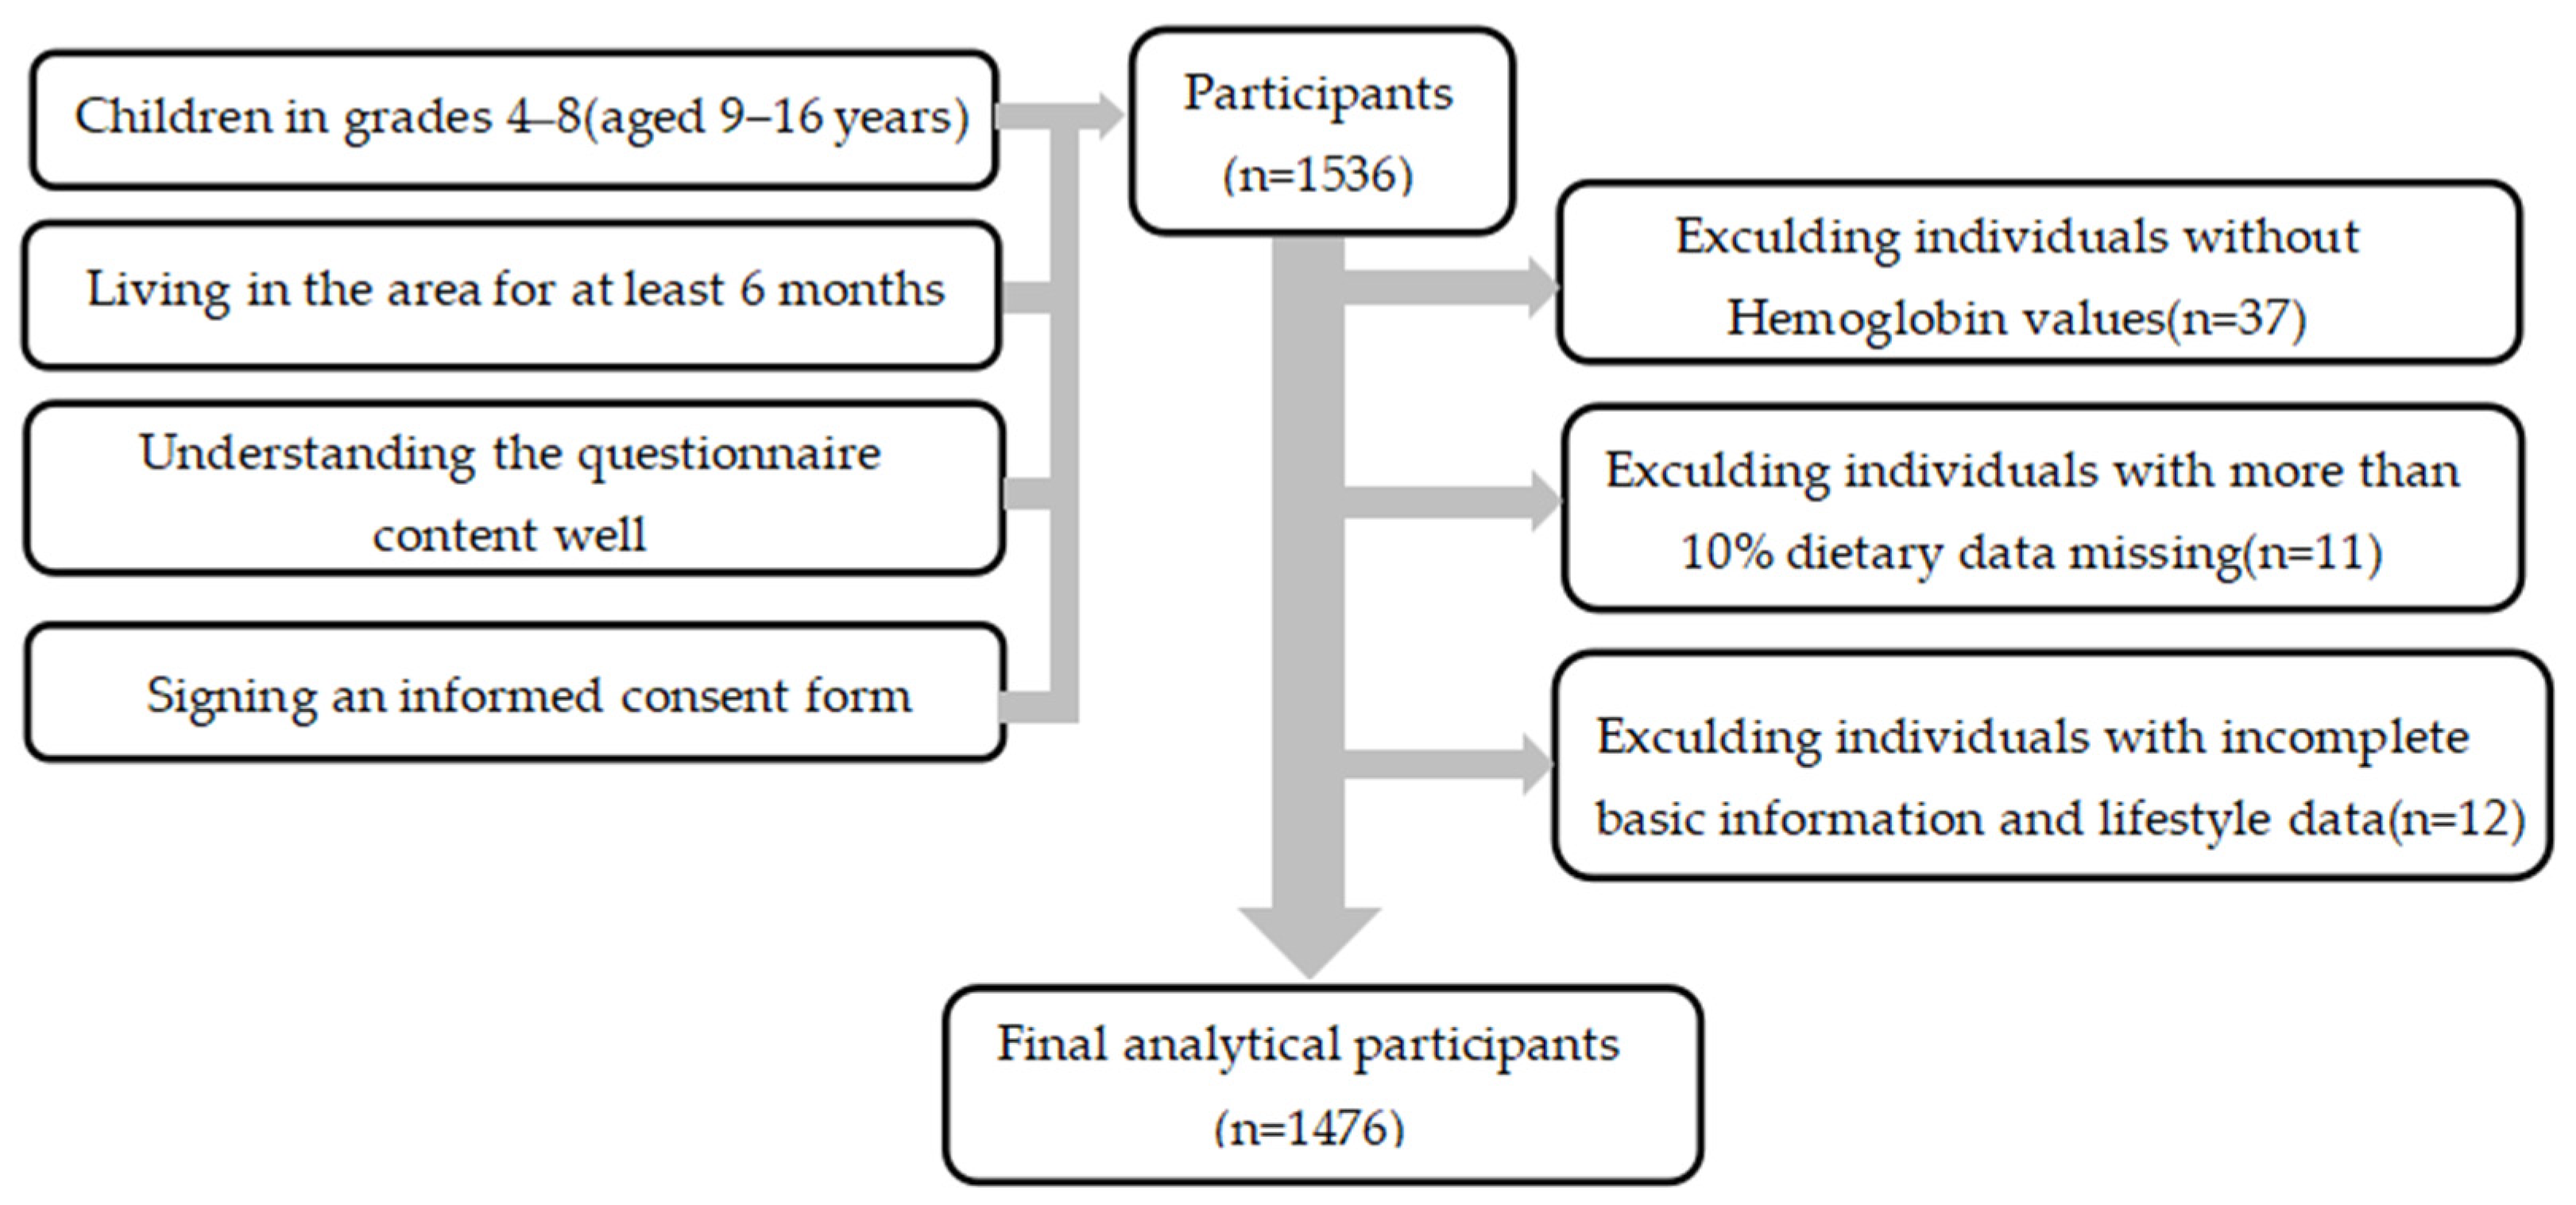
2.1. Participants
2.2. Survey Content
- (1)
- Questionnaire survey: (1) Demographic information included age, gender, region, place of residence, parents’ education level, etc. (2) Lifestyle variables included smoking, drinking, moderate-to-high physical activity, physical education classes, sedentary time, bedtime, and sleep time. (3) Dietary surveys were conducted using a semi-quantitative food frequency questionnaire (FFQ) to investigate the frequency and intake of food consumed by students in the past month. Food models and pictorials aided participants in assessing their food intake. Based on the food frequency questionnaire derived from the China National Chronic Non-communicable Disease and Nutrition Surveillance in 2015 [14] and the dietary characteristics of children in Guangzhou, the questionnaire was adjusted by a panel of experts, including scientists in the fields of epidemiology and nutrition. In the FFQ, 66 types of food across 19 categories were included based on the Chinese Food Composition Table Standard Edition (6th edition) [15,16].
- (2)
- Physical examination: Height and weight were measured by a mechanical height meter and an electronic scale, respectively, with a measurement accuracy of 0.1 cm and 0.1 kg, respectively. All examination instruments and methods were in accordance with the Chinese national standard of anthropometric measurement methods in health surveillance [17]. Body mass index (BMI) was calculated as BMI = weight (kg)/height (m2). The criteria for assessing the nutritional status were determined by the 2007 WHO BMI-for-age reference (age was calculated as the date of investigation minus the date of birth) [18], including four categories: BMI Z score < −2 indicates malnutrition, −2 ≤ BMI Z score < 1 indicates normal, 1< BMI Z score ≤ 2 indicates overweight, and BMI Z score > 2 indicates obesity. BMI Z scores were calculated by WHO AnthroPlus 3.0 software. Based on the WS/T 456-2014 “Screening of Malnutrition in School-Age Children and Adolescents” [19], children with growth retardation were considered those whose height was less than or equal to the height threshold for their age group.
- (3)
- Laboratory examination: Hemoglobin levels were measured with the cyanmethemoglobin method. According to the World Health Organization’s 2011 “Haemoglobin concentrations for the diagnosis of anemia and assessment of severity’” [20], anemia was diagnosed with the following criteria: Children aged 5–11 years with Hb < 115 g/L were diagnosed with anemia, those aged 12–14 years with Hb < 120 g/L were diagnosed with anemia, males aged 15 years and above with Hb < 130 g/L were diagnosed with anemia, and non-pregnant females aged 15 years and above with Hb < 120 g/L were diagnosed with anemia.
2.3. Dietary Pattern Establishment
2.4. Statistical Analysis
3. Results
3.1. Participant Characteristics
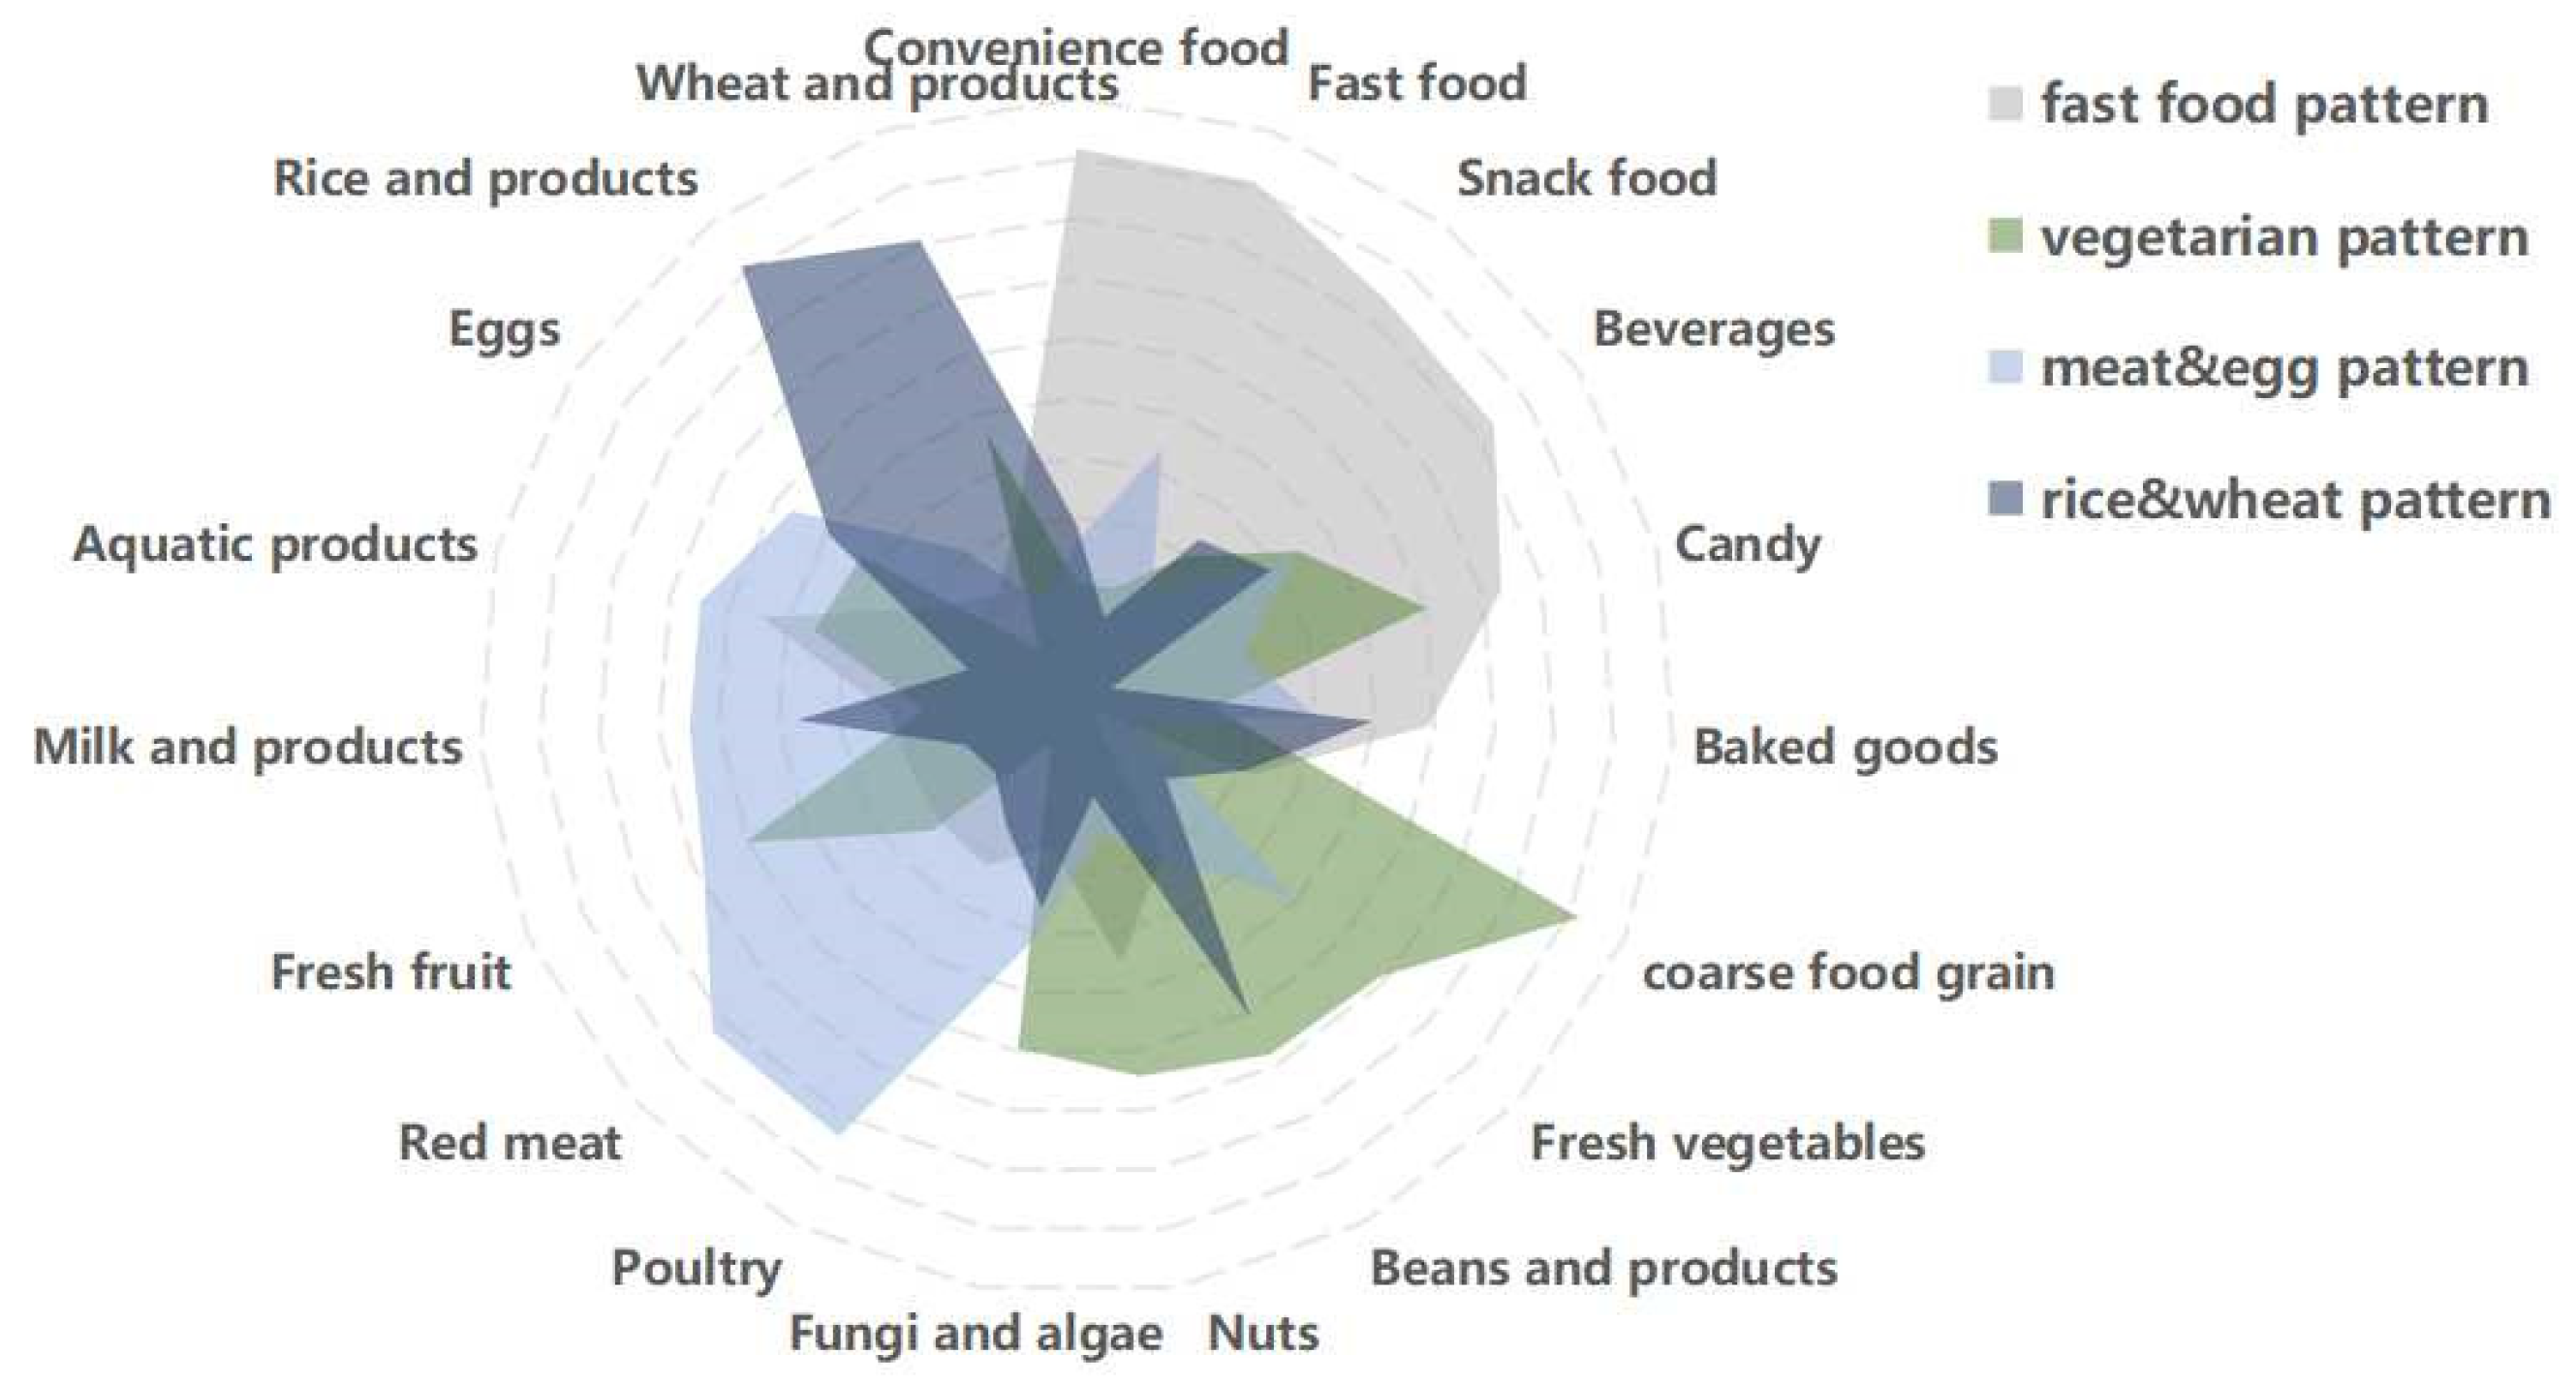
3.2. Dietary Patterns
3.3. Characteristics of Quartiles (Q) of Dietary Patterns in Study Participants
3.4. Association Analysis between Dietary Patterns and Anemia
3.4.1. Analysis of Dietary Patterns and Anemia
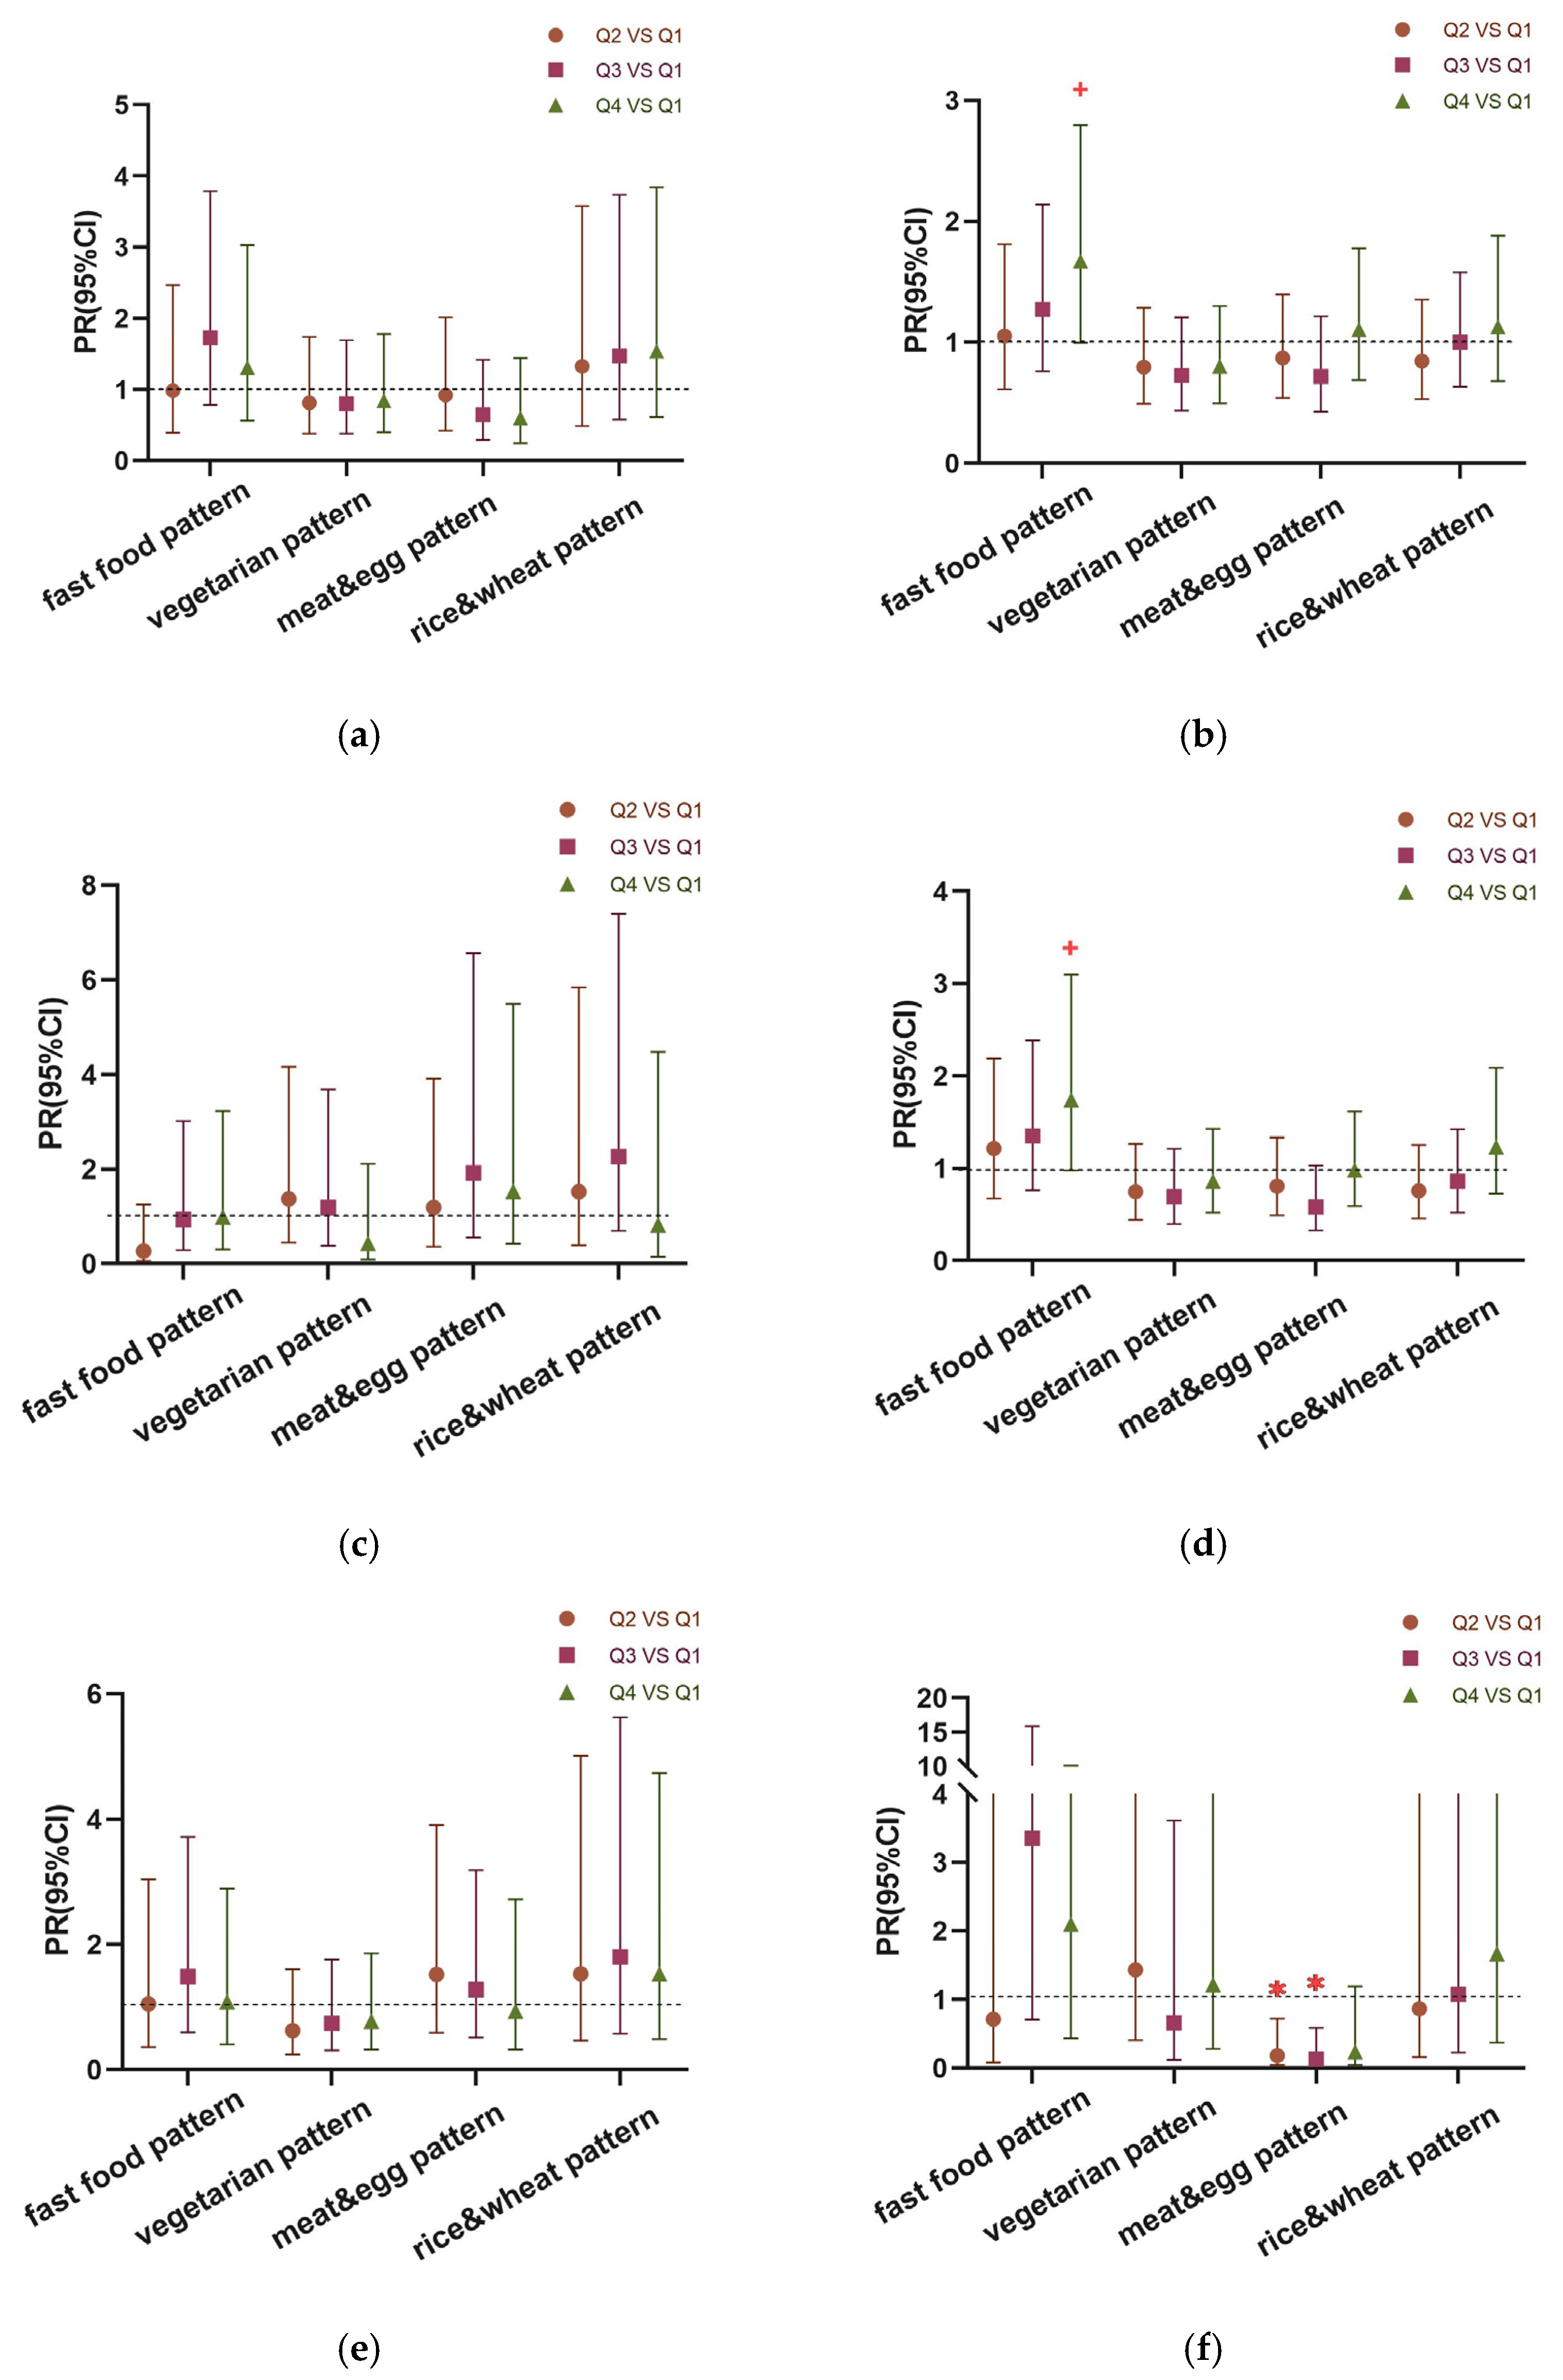
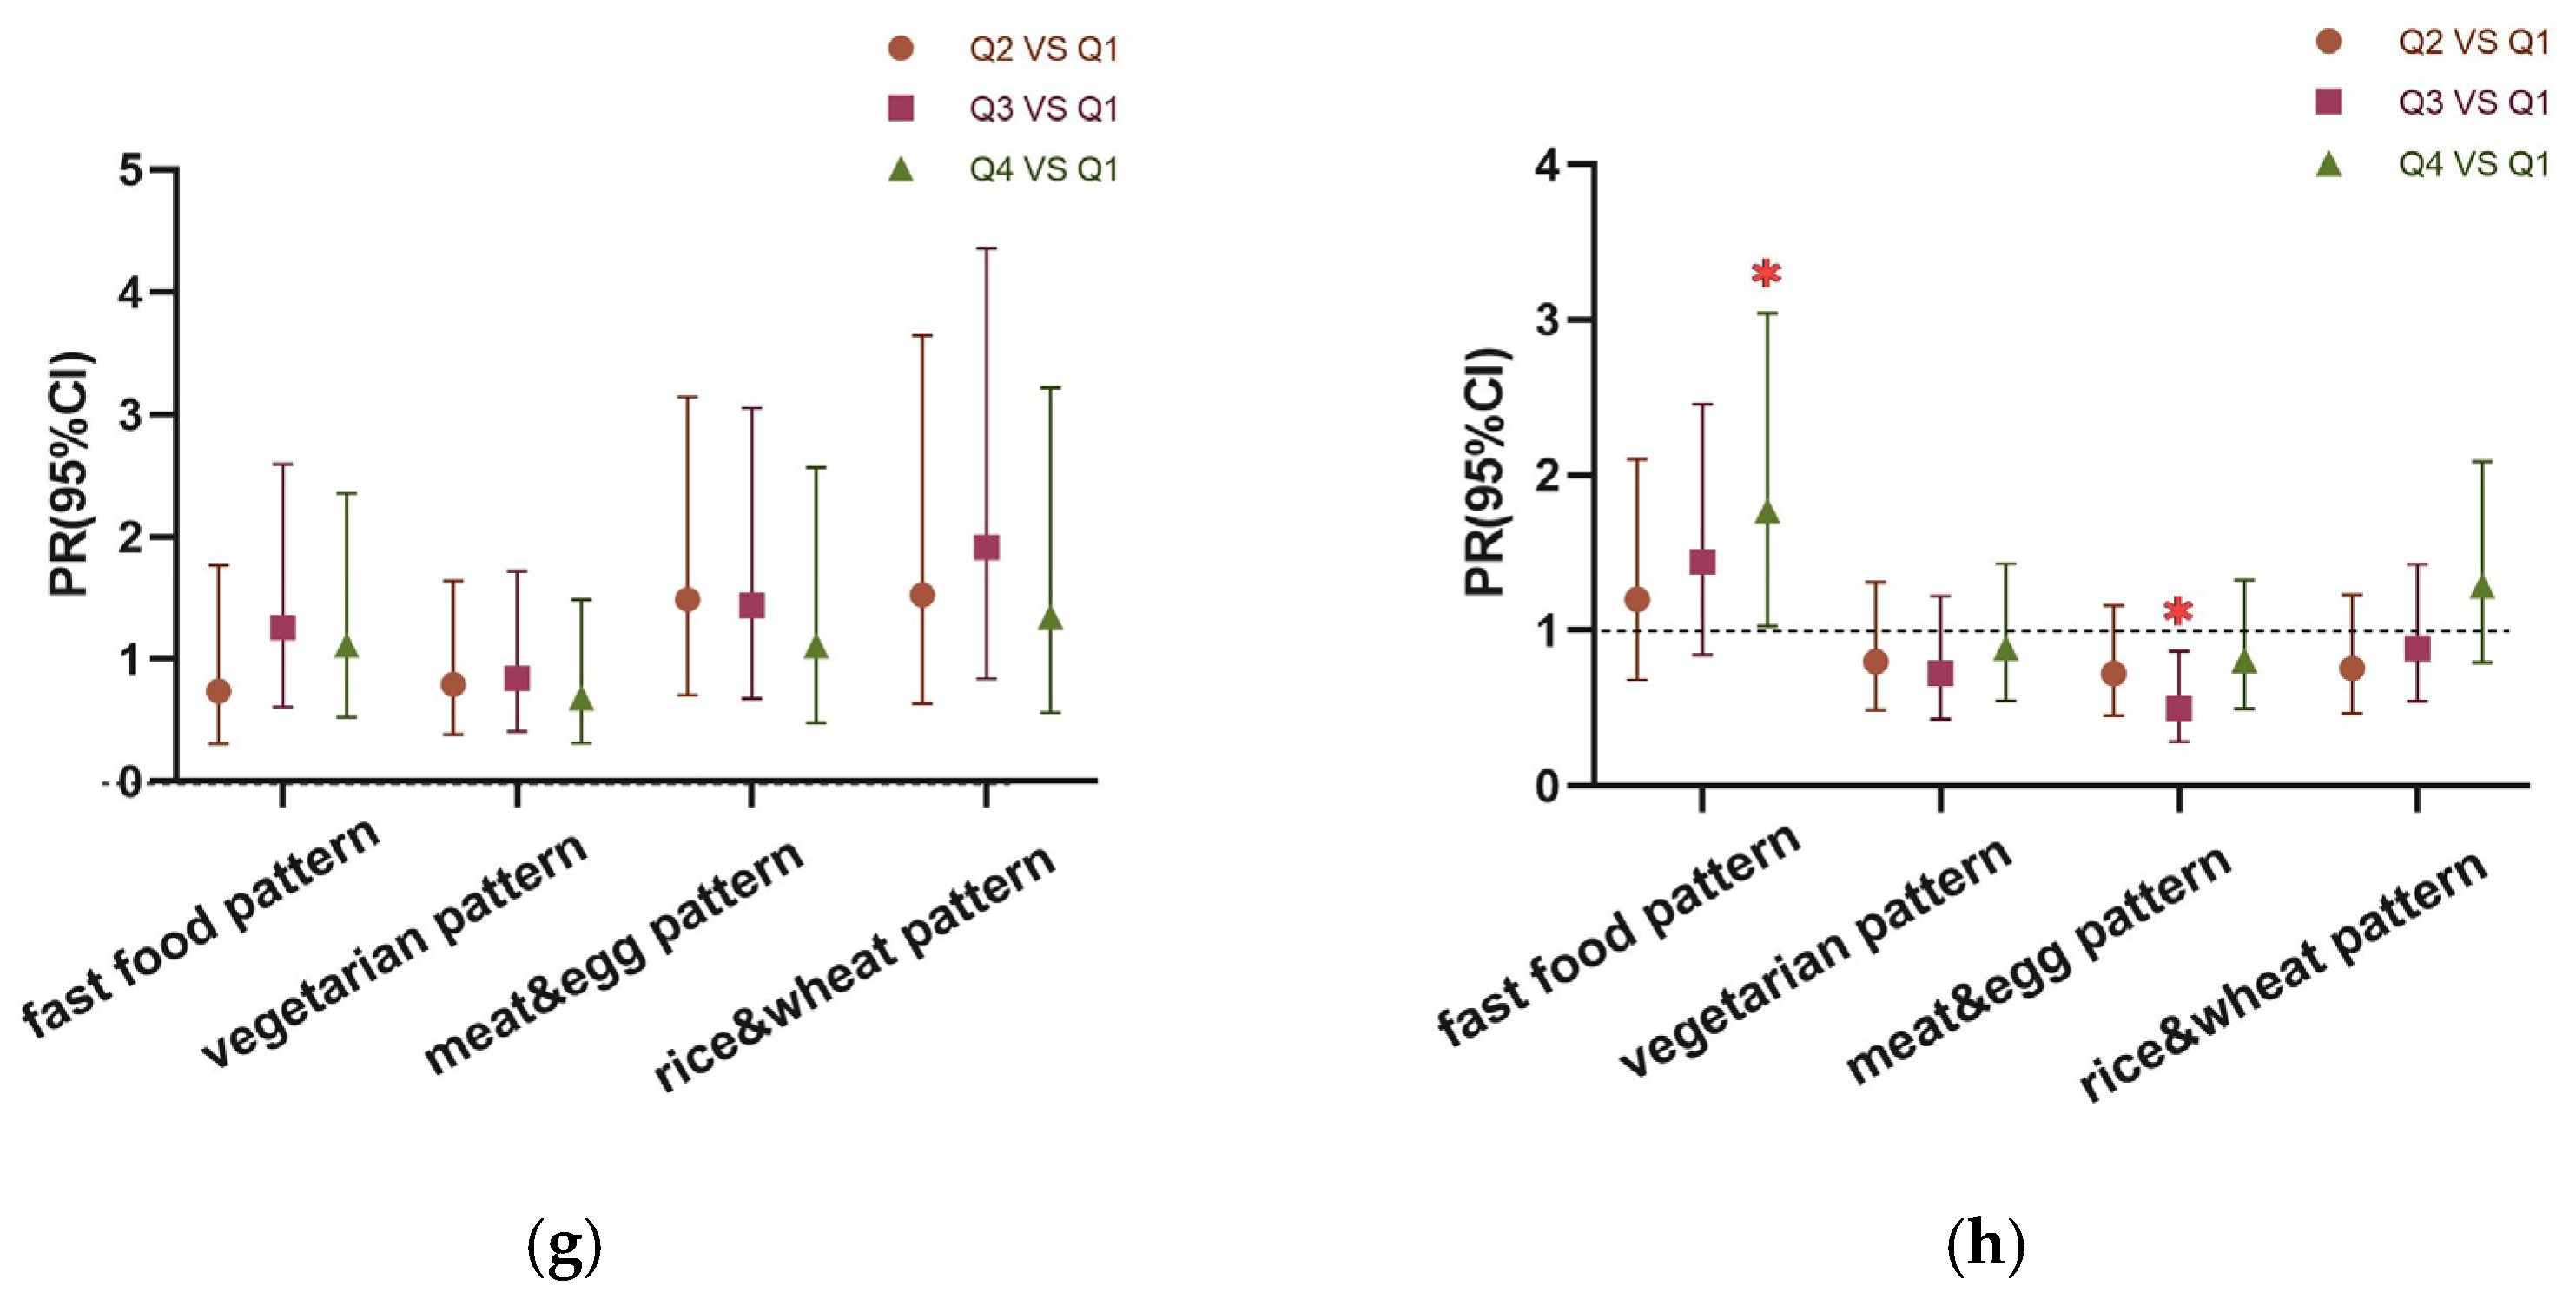
3.4.2. Robust Poisson Regression Analysis of Dietary Patterns and Anemia in Children of Different Genders and Ages
4. Discussion
5. Conclusions
Supplementary Materials
Author Contributions
Funding
Institutional Review Board Statement
Informed Consent Statement
Data Availability Statement
Acknowledgments
Conflicts of Interest
References
- Safiri, S.; Kolahi, A.-A.; Noori, M.; Nejadghaderi, S.A.; Karamzad, N.; Bragazzi, N.L.; Sullman, M.J.M.; Abdollahi, M.; Collins, G.S.; Kaufman, J.S.; et al. Burden of Anemia and Its Underlying Causes in 204 Countries and Territories, 1990–2019: Results from the Global Burden of Disease Study 2019. J. Hematol. Oncol. 2021, 14, 185. [Google Scholar] [CrossRef]
- National Health Commission of the People’s Republic of China. State Council Information Office Press Conference on December 23, 2020-Transcript. Available online: https://www.gov.cn/xinwen/2020-12/24/content_5572983.htm (accessed on 19 September 2023).
- Xu, P.P.; Zhang, Q.; Yang, T.T.; Xu, J.; Gan, Q.; Cao, W.; Li, L.; Pan, H.; Zhao, W.H. Anemia prevalence and its influencing factors among students involved in the Nutrition Improvement Program for Rural Compulsory Education Students in 2019. Zhonghua Liu Xing Bing Xue Za Zhi 2022, 43, 496–502. [Google Scholar] [CrossRef]
- Fuhrmann, D.; Knoll, L.J.; Blakemore, S.-J. Adolescence as a Sensitive Period of Brain Development. Trends Cogn. Sci. 2015, 19, 558–566. [Google Scholar] [CrossRef]
- Chen, M.; Xiong, J.; Zhao, L.; Chen, G.; Zhang, Q.; Ding, G. Epidemiological research progress on the relationship between children′s dietary patterns and health. Chin. J. Prev. Med. 2022, 56, 139–145. [Google Scholar] [CrossRef]
- Beard, J.L. Iron Biology in Immune Function, Muscle Metabolism and Neuronal Functioning. J. Nutr. 2001, 131, 568S–580S. [Google Scholar] [CrossRef]
- Wang, M. Iron Deficiency and Other Types of Anemia in Infants and Children. Am. Fam. Physician 2016, 93, 270–278. [Google Scholar]
- Schulz, C.-A.; Oluwagbemigun, K.; Nöthlings, U. Advances in Dietary Pattern Analysis in Nutritional Epidemiology. Eur. J. Nutr. 2021, 60, 4115–4130. [Google Scholar] [CrossRef]
- Zhao, J.; Li, Z.; Gao, Q.; Zhao, H.; Chen, S.; Huang, L.; Wang, W.; Wang, T. A Review of Statistical Methods for Dietary Pattern Analysis. Nutr. J. 2021, 20, 37. [Google Scholar] [CrossRef]
- Zarate-Ortiz, A.G.; Melse-Boonstra, A.; Rodriguez-Ramirez, S.; Hernandez-Cordero, S.; Feskens, E.J.M. Dietary Patterns and the Double Burden of Malnutrition in Mexican Adolescents: Results from ENSANUT-2006. Nutrients 2019, 11, 2753. [Google Scholar] [CrossRef]
- Kito, A.; Imai, E. The Association with Dietary Patterns and Risk of Anemia in Japanese Elderly. J. Nutr. Sci. Vitaminol. 2020, 66, 32–40. [Google Scholar] [CrossRef] [PubMed]
- Li, L.; Zhan, S.; Ye, D.; Tan, H. Epidemiology, 8th ed.; People’s Medical Publishing House: Beijing, China, 2017; ISBN 978-7-117-24557-9. [Google Scholar]
- Du, X.; Tan, W.; Yang, F.; Ye, J.; Yang, J. Research of prevalence and impact factors of anemia among primary and junior high school students in Guangzhou. Chin. J. Sch. Health 2016, 37, 1845–1847. [Google Scholar] [CrossRef]
- National Health Commission of the People’s Republic of China. National Health Commission of the People’s Republic of China Work Plan of Chinese National Chronic Noncommunicable Disease and Nutrition Surveillance (Trial); National Health Commission of the People’s Republic of China: Beijing, China, 2014.
- National Institute for Nutrition and Health Chinese Center for Disease Control and Prevention. China Food Composition Tables Standard Edition I, 6th ed.; Peking University Medical Press: Beijing, China, 2022; Volume 1, ISBN 978-7-5659-1699-1.
- National Institute for Nutrition and Health Chinese Center for Disease Control and Prevention. China Food Composition Tables Standard Edition II, 6th ed.; Peking University Medical Press: Beijing, China, 2022; Volume 2, ISBN 978-7-5659-1978-7.
- WS/T 424–2013; National Health and Family Planning Commission of the People’s Republic of China. Anthropometric Measurements Method In Health Surveillance 2013. Standards Press of China: Beijing, China, 2013. [Google Scholar]
- De Onis, M.; Onyango, A.W.; Borghi, E.; Siyam, A.; Nishida, C.; Siekmann, J. Development of a WHO Growth Reference for School-Aged Children and Adolescents. Bull. World Health Organ. 2007, 85, 660–667. [Google Scholar] [CrossRef]
- WS/T 456–2014; National Health and Family Planning Commission of the People’s Republic of China. Screening standard for malnutrition of school-age children and adolescents 2014. Standards Press of China: Beijing, China, 2014. [Google Scholar]
- WHO. Haemoglobin concentrations for the diagnosis of anaemia and assessment of severity. Vitamin and Mineral Nutrition Information System. World Health Organization: Geneva, Switzerland, 2011; (WHO/NMH/NHD/MNM/11.1). [Google Scholar]
- Wang, Y.; Tian, T.; Pan, D.; Zhang, J.; Xie, W.; Wang, S.; Xia, H.; Dai, Y.; Sun, G. The Relationship between Dietary Patterns and Overweight and Obesity among Adult in Jiangsu Province of China: A Structural Equation Model. BMC Public Health 2021, 21, 1225. [Google Scholar] [CrossRef]
- Wang, Y.; Xie, W.; Tian, T.; Zhang, J.; Zhu, Q.; Pan, D.; Xu, D.; Lu, Y.; Sun, G.; Dai, Y. The Relationship between Dietary Patterns and High Blood Glucose among Adults Based on Structural Equation Modelling. Nutrients 2022, 14, 4111. [Google Scholar] [CrossRef] [PubMed]
- Choi, H.-J.; Lee, H.-J.; Jang, H.B.; Park, J.Y.; Kang, J.-H.; Park, K.-H.; Song, J. Effects of Maternal Education on Diet, Anemia, and Iron Deficiency in Korean School-Aged Children. BMC Public Health 2011, 11, 870. [Google Scholar] [CrossRef] [PubMed]
- Smith, C.; Gasparetto, M.; Jordan, C.; Pollyea, D.A.; Vasiliou, V. The Effects of Alcohol and Aldehyde Dehydrogenases on Disorders of Hematopoiesis. Adv. Exp. Med. Biol. 2015, 815, 349–359. [Google Scholar] [CrossRef] [PubMed]
- He, B.; Chen, Y.; Zhu, Y.; Mai, J.; Jing, J.; Bao, P.; Yu, M. The Relationship between BMI and Anemia in Children Aged 7–12 Years in Guangzhou in 2010. Chin J Prev Med 2014, 48, 1115–1117. [Google Scholar] [CrossRef]
- Srivastava, S.; Kumar, P.; Paul, R.; Debnath, P. Effect of Change in Individual and Household Level Characteristics on Anemia Prevalence among Adolescent Boys and Girls in India. BMC Public Health 2022, 22, 1478. [Google Scholar] [CrossRef]
- Liang, J.; Mai, J. Analysis of the age characteristics of puberty sexual development in adolescents in Guangzhou. Chin. J. Sch. Health 2012, 33, 1493–1495. [Google Scholar] [CrossRef]
- Luo, J.; Tang, Y.; Duan, R.; Yang, M.; Liu, Y.; Xue, H.; Tian, G.; Chen, G. Onset and development trends of male puberty. Chin. J. Sch. Health 2015, 36, 1756–1760. [Google Scholar] [CrossRef]
- Xu, H.; Nie, S.; Meng, R.; Xu, Y.; Xia, L.; Li, J. Prevalence and related physical factors of anemia among primary and highschool students in Guangdong province. Chin. J. Public Health 2018, 34, 1136–1139. [Google Scholar]
- Teixeira, B.; Afonso, C.; Rodrigues, S.; Oliveira, A. Healthy and Sustainable Dietary Patterns in Children and Adolescents: A Systematic Review. Adv. Nutr. 2022, 13, 1144–1185. [Google Scholar] [CrossRef] [PubMed]
- Howard, A.G.; Attard, S.M.; Herring, A.H.; Wang, H.; Du, S.; Gordon-Larsen, P. Socioeconomic Gradients in the Westernization of Diet in China over 20 Years. SSM-Popul. Health 2021, 16, 100943. [Google Scholar] [CrossRef]
- Ma, J.; Li, Y. Progress of nutritional intervention in children and adolescents with iron deficiency anemia. J. Prev. Med. Lnformation 2023, 39, 717–722. [Google Scholar]
- Esposito, G.; Dottori, L.; Pivetta, G.; Ligato, I.; Dilaghi, E.; Lahner, E. Pernicious Anemia: The Hematological Presentation of a Multifaceted Disorder Caused by Cobalamin Deficiency. Nutrients 2022, 14, 1672. [Google Scholar] [CrossRef]
- Palika, R.; Dasi, T.; Ghosh, S.; Peter, R.; Parasannanavar, D.J.; Pradhan, A.S.; Kurpad, A.V.; Sachdev, H.S.; Kulkarni, B.; Pullakhandam, R. Efficacy of Iron-Folic Acid Treatment for Reducing Anemia Prevalence and Improving Iron Status in Women of Reproductive Age: A One-Year Longitudinal Study. Clin Nutr ESPEN 2022, 49, 390–397. [Google Scholar] [CrossRef]
- Vogt, A.-C.S.; Arsiwala, T.; Mohsen, M.; Vogel, M.; Manolova, V.; Bachmann, M.F. On Iron Metabolism and Its Regulation. Int. J. Mol. Sci. 2021, 22, 4591. [Google Scholar] [CrossRef]
- Kulkarni, A.; Khade, M.; Arun, S.; Badami, P.; Kumar, G.R.K.; Dattaroy, T.; Soni, B.; Dasgupta, S. An Overview on Mechanism, Cause, Prevention and Multi-Nation Policy Level Interventions of Dietary Iron Deficiency. Crit. Rev. Food Sci. Nutr. 2022, 62, 4893–4907. [Google Scholar] [CrossRef]
- Grajeta, H.; Prescha, A.; Biernat, J. Fe, Ca and Mg Contents in Selected Fast Food Products in Poland. Die Nahr. 2002, 46, 7–10. [Google Scholar] [CrossRef]
- Moschonis, G.; Papandreou, D.; Mavrogianni, C.; Giannopoulou, A.; Damianidi, L.; Malindretos, P.; Lionis, C.; Chrousos, G.P.; Manios, Y. Association of Iron Depletion with Menstruation and Dietary Intake Indices in Pubertal Girls: The Healthy Growth Study. Biomed Res. Int. 2013, 2013, 423263. [Google Scholar] [CrossRef]
- Jiang, S.; Yan, K.; Sun, B.; Gao, S.; Yang, X.; Ni, Y.; Ma, W.; Zhao, R. Long-Term High-Fat Diet Decreases Hepatic Iron Storage Associated with Suppressing TFR2 and ZIP14 Expression in Rats. J. Agric. Food Chem. 2018, 66, 11612–11621. [Google Scholar] [CrossRef] [PubMed]
- Harder, N.H.O.; Hieronimus, B.; Stanhope, K.L.; Shibata, N.M.; Lee, V.; Nunez, M.V.; Keim, N.L.; Bremer, A.; Havel, P.J.; Heffern, M.C.; et al. Effects of Dietary Glucose and Fructose on Copper, Iron, and Zinc Metabolism Parameters in Humans. Nutrients 2020, 12, 2581. [Google Scholar] [CrossRef] [PubMed]
- Wang, C.; Wang, X.; Song, G.; Xing, H.; Yang, L.; Han, K.; Chang, Y. A High-Fructose Diet in Rats Induces Systemic Iron Deficiency and Hepatic Iron Overload by an Inflammation Mechanism. J. Food Biochem. 2021, 45, e13578. [Google Scholar] [CrossRef]
- Sturtzel, B.; Elmadfa, I.; Hermann, B.; Schippinger, W.; Ohrenberger, G. Effects of an Enhanced Iron Dense Foods Offering in the Daily Meals Served in Geriatric Institutions on Measures of Iron Deficiency Anemia. BMC Geriatr. 2018, 18, 123. [Google Scholar] [CrossRef]
- Fuqua, B.K.; Vulpe, C.D.; Anderson, G.J. Intestinal Iron Absorption. J. Trace Elem. Med. Biol. Organ Soc. Miner. Trace Elem. (GMS) 2012, 26, 115–119. [Google Scholar] [CrossRef] [PubMed]
- Ghatpande, N.S.; Apte, P.P.; Naik, S.S.; Kulkarni, P.P. Fruit and Vegetable Consumption and Their Association with the Indicators of Iron and Inflammation Status Among Adolescent Girls. J. Am. Coll. Nutr. 2019, 38, 218–226. [Google Scholar] [CrossRef]
- Chiu, P.-F.; Ko, S.-Y.; Chang, C.-C. Vitamin C Affects the Expression of Hepcidin and Erythropoietin Receptor in HepG2 Cells. J. Ren. Nutr. Off. J. Counc. Ren. Nutr. Natl. Kidney Found. 2012, 22, 373–376. [Google Scholar] [CrossRef]
- Skolmowska, D.; Głąbska, D. Effectiveness of Dietary Intervention with Iron and Vitamin C Administered Separately in Improving Iron Status in Young Women. Int. J. Environ. Res. Public Health 2022, 19, 11877. [Google Scholar] [CrossRef]
- Visser, M.; Van Zyl, T.; Hanekom, S.M.; Baumgartner, J.; van der Hoeven, M.; Taljaard-Krugell, C.; Smuts, C.M.; Faber, M. Nutrient Patterns and Their Relation to Anemia and Iron Status in 5- to 12-y-Old Children in South Africa. Nutr. (Burbank Los Angeles Cty. Calif.) 2019, 62, 194–200. [Google Scholar] [CrossRef]
- Anttila, R.; Siimes, M.A. Serum Transferrin and Ferritin in Pubertal Boys: Relations to Body Growth, Pubertal Stage, Erythropoiesis, and Iron Deficiency. Am. J. Clin. Nutr. 1996, 63, 179–183. [Google Scholar] [CrossRef]
- Peddie, M.; Ranasinghe, C.; Scott, T.; Heath, A.-L.; Horwath, C.; Gibson, R.; Brown, R.; Houghton, L.; Haszard, J. Dietary Intake Nutritional Status and Lifestyle of Adolescent Vegetarian and Nonvegetarian Girls in New Zealand (The SuNDiAL Project): Protocol for a Clustered, Cross-Sectional Survey. JMIR Res. Protoc. 2020, 9, e17310. [Google Scholar] [CrossRef] [PubMed]
- Desmond, M.A.; Sobiecki, J.G.; Jaworski, M.; Płudowski, P.; Antoniewicz, J.; Shirley, M.K.; Eaton, S.; Książyk, J.; Cortina-Borja, M.; De Stavola, B.; et al. Growth, Body Composition, and Cardiovascular and Nutritional Risk of 5- to 10-y-Old Children Consuming Vegetarian, Vegan, or Omnivore Diets. Am. J. Clin. Nutr. 2021, 113, 1565–1577. [Google Scholar] [CrossRef] [PubMed]
- Shi, Z.; Hu, X.; Yuan, B.; Pan, X.; Dai, Y.; Holmboe-Ottesen, G. Association between Dietary Patterns and Anaemia in Adults from Jiangsu Province in Eastern China. Br. J. Nutr. 2006, 96, 906–912. [Google Scholar] [CrossRef]
- Wadolowska, L.; Hamulka, J.; Kowalkowska, J.; Kostecka, M.; Wadolowska, K.; Biezanowska-Kopec, R.; Czarniecka-Skubina, E.; Kozirok, W.; Piotrowska, A. Prudent-Active and Fast-Food-Sedentary Dietary-Lifestyle Patterns: The Association with Adiposity, Nutrition Knowledge and Sociodemographic Factors in Polish Teenagers-The ABC of Healthy Eating Project. Nutrients 2018, 10, 1988. [Google Scholar] [CrossRef] [PubMed]
- Khan, A.; Dix, C.; Burton, N.W.; Khan, S.R.; Uddin, R. Association of Carbonated Soft Drink and Fast Food Intake with Stress-Related Sleep Disturbance among Adolescents: A Global Perspective from 64 Countries. EClinicalMedicine 2020, 31, 100681. [Google Scholar] [CrossRef]
- Lasch, K.F.; Evans, C.J.; Schatell, D. A Qualitative Analysis of Patient-Reported Symptoms of Anemia. Nephrol. Nurs. J. J. Am. Nephrol. Nurses’ Assoc. 2009, 36, 621. [Google Scholar]
- de Andrade Cairo, R.C.; Silva, L.R.; Bustani, N.C.; Marques, C.D.F. Iron Deficiency Anemia in Adolescents; a Literature Review. Nutr. Hosp. 2014, 29, 1240–1249. [Google Scholar] [CrossRef]
- Sprake, E.F.; Russell, J.M.; Cecil, J.E.; Cooper, R.J.; Grabowski, P.; Pourshahidi, L.K.; Barker, M.E. Dietary Patterns of University Students in the UK: A Cross-Sectional Study. Nutr. J. 2018, 17, 90. [Google Scholar] [CrossRef]

| Number | Food Group | Examples of Food Items |
|---|---|---|
| 1 | Rice and rice products | Rice, rice gruel, rice noodles |
| 2 | Wheat and wheat products | Wheat flour noodles, wheat buns, dumplings Fried bread, fried breadsticks |
| 3 | Coarse food grain | Corn, cornmeal Potato, sweet potato, |
| 4 | Beans and bean products | Soybean, soybean milk, tofu, bean curd, dried bean curd |
| 5 | Fresh vegetables | Cabbage, tomato, lettuce |
| 6 | Mushrooms and algae | Mushroom, laver, kelp |
| 7 | Fresh fruits | Banana, apple, berries |
| 8 | Milk and dairy products | Milk, milk powder, yogurt, cheese |
| 9 | Red meat | Pork, beef, goat, lamb Liver, kidney, large intestine Ham sausage, bacon |
| 10 | Poultry | Chicken, duck, goose |
| 11 | Aquatic products | Fish, shrimp, crab |
| 12 | Eggs | Eggs |
| 13 | Nuts | Peanuts, almonds, walnuts, hazelnuts |
| 14 | Baked goods | Cookies, cakes, bread |
| 15 | Candy | Sugar, jam, jelly, candies, chocolate, candied fruit |
| 16 | Snack food | Spicy strips, fried puffed snacks |
| 17 | Convenience food | Instant noodles, instant rice noodles |
| 18 | Fast food | Hamburger, fried chicken |
| 19 | Beverages | Carbonated drinks, prepackaged juice, milk beverages, sweet tea beverages, vegetable protein drinks, sports beverages |
| Variable | Total | Anemia | p | |
|---|---|---|---|---|
| Yes | No | |||
| Age, mean (95% CI) | 12.87 (12.81, 12.94) | 12.99 (12.78, 13.20) | 12.86 (12.79, 12.93) | 0.409 |
| Sex, n (%) | ||||
| Male | 787 | 48 (6.10) | 739 (93.90) | <0.001 |
| Female | 689 | 106 (15.38) | 583 (84.62) | |
| Education of father, n (%) | ||||
| Primary or below | 66 | 10 (15.15) | 56 (84.85) | 0.657 |
| Middle school | 722 | 69 (9.56) | 653 (90.44) | |
| Senior high school | 355 | 38 (10.70) | 317 (89.30) | |
| Junior college or above | 245 | 25 (10.20) | 220 (89.80) | |
| Unknown | 88 | 12 (13.64) | 76 (86.36) | |
| Education of mother, n (%) | ||||
| Primary or below | 116 | 12 (10.34) | 104 (89.66) | 0.159 |
| Middle school | 724 | 83 (11.46) | 641 (88.54) | |
| Senior high school | 302 | 32 (10.60) | 270 (89.40) | |
| Junior college or above | 247 | 20 (8.10) | 227 (91.90) | |
| Unknown | 87 | 7 (8.05) | 80 (91.95) | |
| Boarding, n (%) | ||||
| Yes | 594 | 66 (11.11) | 528 (88.89) | 0.485 |
| No | 882 | 88 (9.98) | 794 (90.02) | |
| Tried smoking, n (%) | ||||
| Yes | 133 | 13 (9.77) | 120 (90.23) | 0.794 |
| No | 1343 | 141 (10.50) | 1202 (89.50) | |
| Alcohol consumption, n (%) | ||||
| Yes | 309 | 32 (10.36) | 277 (89.64) | 0.960 |
| No | 1167 | 122 (10.45) | 1045 (89.55) | |
| Moderate-to-high-intensity exercise, n (%) | ||||
| <3 times/week | 264 | 32 (12.12) | 232 (87.88) | 0.322 |
| ≥3 times/week | 1212 | 122 (10.07) | 1090 (89.93) | |
| Sedentary time, mean (95% CI) | 8.07 (7.97, 8.18) | 8.12 (7.78, 8.46) | 8.07 (7.96, 8.18) | 0.692 |
| Bedtime, n (%) | ||||
| <9 p.m. | 59 | 15 (25.42) | 44 (74.58) | <0.001 |
| ≥9 p.m. | 1417 | 139 (9.81) | 1278 (90.19) | |
| Sleep time, mean (95% CI) | 8.95 (8.88, 9.02) | 8.84 (8.63, 9.06) | 8.96 (8.89, 9.04) | 0.322 |
| BMI Z score, n (%) | ||||
| Underweight | 78 | 9 (11.54) | 69 (88.46) | 0.032 |
| Normal weight | 1168 | 128 (10.96) | 1040 (89.04) | |
| Overweight | 171 | 17 (9.94) | 154 (90.06) | |
| Obesity | 59 | 0 (0.00) | 59 (100.00) | |
| Growth retardation, n (%) | 0.631 | |||
| Yes | 15 | 1 (6.67) | 14 (93.30) | |
| No | 1461 | 153 (10.47) | 1308 (89.53) | |
| Food | Fast Food Pattern | Vegetarian Pattern | Meat and Egg Pattern | Rice and Wheat Pattern |
|---|---|---|---|---|
| Convenience food | 0.716 | |||
| Fast food | 0.710 | |||
| Snack food | 0.641 | |||
| Beverages | 0.632 | |||
| Candy | 0.532 | 0.403 | ||
| Baked goods | 0.389 | |||
| Coarse food grain | 0.718 | |||
| Fresh vegetables | 0.489 | |||
| Beans and bean products | 0.479 | 0.408 | ||
| Nuts | 0.442 | |||
| Mushrooms and algae | 0.395 | |||
| Poultry | 0.635 | |||
| Red meat | 0.626 | |||
| Fresh fruits | 0.406 | 0.482 | ||
| Milk and dairy products | 0.449 | |||
| Aquatic products | 0.344 | 0.449 | ||
| Poultry | 0.368 | |||
| Rice and rice products | 0.712 | |||
| Wheat and wheat products | 0.607 |
| Variable | Fast Food Pattern | Vegetarian Pattern | Meat and Egg Pattern | Rice and Wheat Pattern | ||||||||
|---|---|---|---|---|---|---|---|---|---|---|---|---|
| Q1 | Q4 | p | Q1 | Q4 | p | Q1 | Q4 | p | Q1 | Q4 | p | |
| Age, mean (95% CI) | 12.91 (12.77, 13.05) | 12.85 (12.72, 12.99) | 0.528 | 12.89 (12.75, 13.03) | 12.84 (12.71, 12.97) | 0.380 | 12.57 (12.43, 12.72) | 13.03 (12.9, 13.15) | <0.001 | 12.85 (12.71, 12.99) | 12.88 (12.75, 13.02) | 0.522 |
| Gender, n (%) | ||||||||||||
| Male | 197 (48.28) | 211 (51.72) | 0.300 | 221 (54.17) | 187 (45.83) | 0.012 | 166 (42.35) | 226 (57.65) | <0.001 | 134 (33.33) | 268 (66.67) | <0.001 |
| Female | 172 (52.12) | 158 (47.88) | 148 (44.85) | 182 (55.15) | 203 (58.67) | 143 (41.33) | 235 (69.94) | 101 (30.06) | ||||
| Boarding, n (%) | ||||||||||||
| Yes | 148 (47.13) | 166 (52.87) | 0.180 | 144 (50.17) | 143 (49.83) | 0.940 | 113 (39.79) | 171 (60.21) | <0.001 | 136 (48.92) | 142 (51.08) | 0.649 |
| No | 221 (52.12) | 203 (47.88) | 225 (49.89) | 226 (50.11) | 256 (56.39) | 198 (43.61) | 233 (50.65) | 227 (49.35) | ||||
| Education of father, n (%) | ||||||||||||
| Primary or below | 16 (50.00) | 16 (50.00) | 0.125 | 15 (51.72) | 14 (48.28) | 0.042 | 14 (51.85) | 13 (48.15) | <0.001 | 15 (55.56) | 12 (44.44) | 0.037 |
| Middle school | 173 (48.19) | 186 (51.81) | 200 (54.35) | 168 (45.65) | 218 (58.45) | 155 (41.55) | 168 (46.54) | 193 (53.46) | ||||
| Senior high school | 93 (51.38) | 88 (48.62) | 70 (40.00) | 105 (60.00) | 73 (42.69) | 98 (57.31) | 91 (51.41) | 86 (48.59) | ||||
| Junior college or above | 71 (58.20) | 51 (41.80) | 63 (50.81) | 61 (49.19) | 40 (34.48) | 76 (65.52) | 65 (49.62) | 66 (50.38) | ||||
| Unknown | 16 (36.36) | 28 (63.64) | 21 (50.00) | 21 (50.00) | 24 (47.06) | 27 (52.94) | 30 (71.43) | 12 (28.57) | ||||
| Education of mother, n (%) | ||||||||||||
| Primary or below | 30 (52.63) | 27 (47.37) | 0.067 | 28 (57.14) | 21 (42.86) | 0.845 | 35 (64.81) | 19 (35.19) | <0.001 | 20 (42.55) | 27 (57.45) | 0.159 |
| Middle school | 177 (49.44) | 181 (50.56) | 180 (49.86) | 181 (50.14) | 202 (56.74) | 154 (43.26) | 182 (49.46) | 186 (50.54) | ||||
| Senior high school | 74 (48.68) | 78 (51.32) | 75 (49.34) | 77 (50.66) | 63 (42.86) | 84 (57.14) | 82 (55.03) | 67 (44.97) | ||||
| Junior college or above | 74 (57.81) | 54 (42.19) | 65 (47.79) | 71 (52.21) | 45 (35.16) | 83 (64.84) | 60 (44.78) | 74 (55.22) | ||||
| Unknown | 14 (32.56) | 29 (67.44) | 21 (52.50) | 19 (47.50) | 24 (45.28) | 29 (54.72) | 25 (62.50) | 15 (37.50) | ||||
| Alcohol consumption, n (%) | ||||||||||||
| Yes | 57 (34.76) | 107 (65.24) | <0.001 | 75 (49.34) | 77 (50.66) | 0.856 | 68 (41.72) | 95 (58.28) | 0.017 | 82 (50.00) | 82 (50.00) | 1.000 |
| No | 312 (54.36) | 262 (45.64) | 294 (50.17) | 292 (49.83) | 301 (52.35) | 274 (47.65) | 287 (50.00) | 287 (50.00) | ||||
| Tried smoking, n (%) | ||||||||||||
| Yes | 15 (22.06) | 53 (77.94) | <0.001 | 41 (57.75) | 30 (42.25) | 0.169 | 31 (49.21) | 32 (50.79) | 0.895 | 31 (42.47) | 42 (57.53) | 0.174 |
| No | 354 (52.84) | 316 (47.16) | 328 (49.18) | 339 (50.82) | 338 (50.07) | 337 (49.93) | 338 (50.83) | 327 (49.17) | ||||
| Sleep time, mean (95% CI) | 9.04 (8.91, 9.17) | 8.91 (9.17, 9.05) | 0.003 | 8.88 (8.75, 9.02) | 9.04 (8.89, 9.19) | 0.057 | 9.03 (8.88, 9.18) | 8.98 (8.84, 9.12) | 0.373 | 8.80 (8.65, 8.95) | 9.07 (8.94, 9.20) | 0.015 |
| Moderate-to-high physical activity, n (%) | ||||||||||||
| <3 times/week | 55 (47.41) | 61 (52.59) | 0.544 | 83 (58.45) | 59 (41.55) | 0.025 | 85 (64.89) | 46 (35.11) | <0.001 | 90 (61.64) | 56 (38.36) | 0.002 |
| ≥3 times/week | 314 (50.48) | 308 (49.52) | 286 (47.99) | 310 (52.01) | 284 (46.79) | 323 (53.21) | 279 (47.13) | 313 (52.87) | ||||
| Sedentary time, mean (95% CI) | 8.12(7.91, 8.33) | 8.12(7.91, 8.34) | 0.897 | 7.88(7.68, 8.09) | 8.27(8.06, 8.49) | 0.006 | 7.69(7.49, 7.9) | 8.28(8.08, 8.48) | <0.001 | 8.04(7.84, 8.23) | 8.01(7.79, 8.22) | 0.306 |
| Bedtime, n (%) | ||||||||||||
| <9 p.m. | 22 (73.33) | 8 (26.67) | 0.008 | 9 (31.03) | 20 (68.97) | 0.035 | 13 (43.33) | 17 (56.67) | 0.455 | 15 (45.45) | 18 (54.55) | 0.593 |
| ≥9 p.m. | 347 (49.01) | 361 (50.99) | 360 (50.78) | 349 (49.22) | 356 (50.28) | 352 (49.72) | 354 (50.21) | 351 (49.79) | ||||
| Malnutrition, n (%) | ||||||||||||
| Yes | 18 (48.65) | 19 (51.35) | 0.866 | 11 (31.43) | 24 (68.57) | 0.023 | 12 (42.86) | 16 (57.14) | 0.441 | 15 (44.12) | 19 (55.88) | 0.482 |
| No | 351 (50.07) | 350 (49.93) | 358 (50.92) | 345 (49.08) | 357 (50.28) | 353 (49.72) | 354 (50.28) | 350 (49.72) | ||||
| Overweight/obesity, n (%) | ||||||||||||
| Yes | 61 (51.26) | 58 (48.74) | 0.764 | 58 (49.15) | 60 (50.85) | 0.841 | 52 (47.27) | 58 (52.73) | 0.535 | 48 (41.74) | 67 (58.26) | 0.054 |
| No | 308 (49.76) | 311 (50.24) | 311 (50.16) | 309 (49.84) | 317 (50.48) | 311 (49.52) | 321 (51.52) | 302 (48.48) | ||||
| Growth retardation, n (%) | ||||||||||||
| Yes | 4 (50.00) | 4 (50.00) | 1.000 | 3 (50.00) | 3 (50.00) | 1.000 | 4 (57.14) | 3 (42.86) | 0.704 | 2 (25.00) | 6 (75.00) | 0.136 |
| No | 365 (50.00) | 365 (50.00) | 366 (50.00) | 366 (50.00) | 365 (49.93) | 366 (50.07) | 367 (50.27) | 363 (49.73) | ||||
| Food intake (g/d), mean a | ||||||||||||
| Animal foods | 107 | 137 | <0.001 | 108 | 133 | <0.001 | 47 | 206 | <0.001 | 114 | 119 | 0.016 |
| Rice and rice products | 220 | 201 | 0.012 | 231 | 195 | <0.001 | 187 | 215 | <0.001 | 122 | 306 | <0.001 |
| Wheat and wheat products | 58 | 66 | 0.038 | 40 | 78 | <0.001 | 63 | 58 | 0.486 | 27 | 102 | <0.001 |
| Coarse food grain | 35 | 38 | 0.186 | 9 | 71 | <0.001 | 39 | 30 | 0.769 | 25 | 40 | <0.001 |
| Fresh vegetables | 281 | 169 | <0.001 | 101 | 296 | <0.001 | 129 | 252 | <0.001 | 197 | 199 | 0.017 |
| Fresh fruits | 213 | 206 | 0.292 | 112 | 272 | <0.001 | 113 | 284 | <0.001 | 201 | 190 | 0.782 |
| Milk and dairy products | 264 | 295 | 0.008 | 266 | 288 | 0.035 | 149 | 379 | <0.001 | 215 | 321 | <0.001 |
| Eggs | 43 | 39 | 0.020 | 29 | 50 | <0.001 | 19 | 54 | <0.001 | 24 | 52 | <0.001 |
| Beans and bean products | 14 | 17 | 0.241 | 7 | 24 | <0.001 | 12 | 16 | <0.001 | 7 | 22 | <0.001 |
| Dietary Pattern | Non-Anemia | Anemia | p | Model 1 | Model 2 | ||
|---|---|---|---|---|---|---|---|
| PR (95% CI) | p | PR (95% CI) | p | ||||
| Fast food pattern, n (%) | |||||||
| Q1 | 338 (91.60) | 31 (8.40) | 0.033 a | 1 | 1 | ||
| Q2 | 336 (91.06) | 33 (8.94) | 1.064 (0.666, 1.700) | 0.793 | 1.045 (0.656, 1.663) | 0.851 | |
| Q3 | 325 (88.08) | 44 (11.92) | 1.419 (0.917, 2.195) | 0.115 | 1.382 (0.898, 2.129) | 0.141 | |
| Q4 | 323 (87.53) | 46 (12.47) | 1.483 (0.963, 2.285) | 0.073 | 1.549 (1.002, 2.396) | 0.048 | |
| Vegetarian pattern, n (%) | |||||||
| Q1 | 326 (88.35) | 43 (11.65) | 0.493 | 1 | 1 | ||
| Q2 | 331 (89.70) | 38 (10.30) | 0.883 (0.585, 1.334) | 0.556 | 0.803 (0.535, 1.207) | 0.293 | |
| Q3 | 334 (90.51) | 35 (9.49) | 0.813 (0.533, 1.241) | 0.339 | 0.750 (0.491, 1.145) | 0.183 | |
| Q4 | 331 (89.70) | 38 (10.30) | 0.883 (0.585, 1.334) | 0.556 | 0.816 (0.544, 1.226) | 0.329 | |
| Meat and egg pattern, n (%) | |||||||
| Q1 | 323 (87.53) | 46 (12.47) | 0.128 | 1 | 1 | ||
| Q2 | 328 (88.89) | 41 (11.11) | 0.891 (0.600, 1.323) | 0.568 | 0.906 (0.607, 1.353) | 0.631 | |
| Q3 | 338 (91.60) | 31 (8.40) | 0.673 (0.437, 1.038) | 0.073 | 0.710 (0.456, 1.106) | 0.130 | |
| Q4 | 333 (90.24) | 36 (9.76) | 0.782 (0.518, 1.181) | 0.243 | 0.886 (0.578, 1.358) | 0.580 | |
| Rice and wheat pattern, n (%) | |||||||
| Q1 | 327 (88.62) | 42 (11.38) | 0.594 | 1 | 1 | ||
| Q2 | 333 (90.24) | 36 (9.76) | 0.857 (0.562, 1.306) | 0.473 | 0.927 (0.611, 1.406) | 0.722 | |
| Q3 | 329 (89.16) | 40 (10.84) | 0.952 (0.633, 1.432) | 0.814 | 1.104 (0.741, 1.646) | 0.625 | |
| Q4 | 333 (90.24) | 36 (9.76) | 0.857 (0.562, 1.306) | 0.473 | 1.201 (0.787, 1.834) | 0.394 | |
Disclaimer/Publisher’s Note: The statements, opinions and data contained in all publications are solely those of the individual author(s) and contributor(s) and not of MDPI and/or the editor(s). MDPI and/or the editor(s) disclaim responsibility for any injury to people or property resulting from any ideas, methods, instructions or products referred to in the content. |
© 2023 by the authors. Licensee MDPI, Basel, Switzerland. This article is an open access article distributed under the terms and conditions of the Creative Commons Attribution (CC BY) license (https://creativecommons.org/licenses/by/4.0/).
Share and Cite
Ma, J.; Huang, J.; Zeng, C.; Zhong, X.; Zhang, W.; Zhang, B.; Li, Y. Dietary Patterns and Association with Anemia in Children Aged 9–16 Years in Guangzhou, China: A Cross-Sectional Study. Nutrients 2023, 15, 4133. https://doi.org/10.3390/nu15194133
Ma J, Huang J, Zeng C, Zhong X, Zhang W, Zhang B, Li Y. Dietary Patterns and Association with Anemia in Children Aged 9–16 Years in Guangzhou, China: A Cross-Sectional Study. Nutrients. 2023; 15(19):4133. https://doi.org/10.3390/nu15194133
Chicago/Turabian StyleMa, Jie, Jie Huang, Chunzi Zeng, Xuexin Zhong, Weiwei Zhang, Bo Zhang, and Yan Li. 2023. "Dietary Patterns and Association with Anemia in Children Aged 9–16 Years in Guangzhou, China: A Cross-Sectional Study" Nutrients 15, no. 19: 4133. https://doi.org/10.3390/nu15194133
APA StyleMa, J., Huang, J., Zeng, C., Zhong, X., Zhang, W., Zhang, B., & Li, Y. (2023). Dietary Patterns and Association with Anemia in Children Aged 9–16 Years in Guangzhou, China: A Cross-Sectional Study. Nutrients, 15(19), 4133. https://doi.org/10.3390/nu15194133