
Impact on Fecal Microbiota and Health-Related Markers of an Intervention Focused on Improving Eating Behavior in People at Risk of Food Insecurity
 , , , , , , and
Abstract
1. Introduction
2. Materials and Methods
2.1. Participants and Recruitment
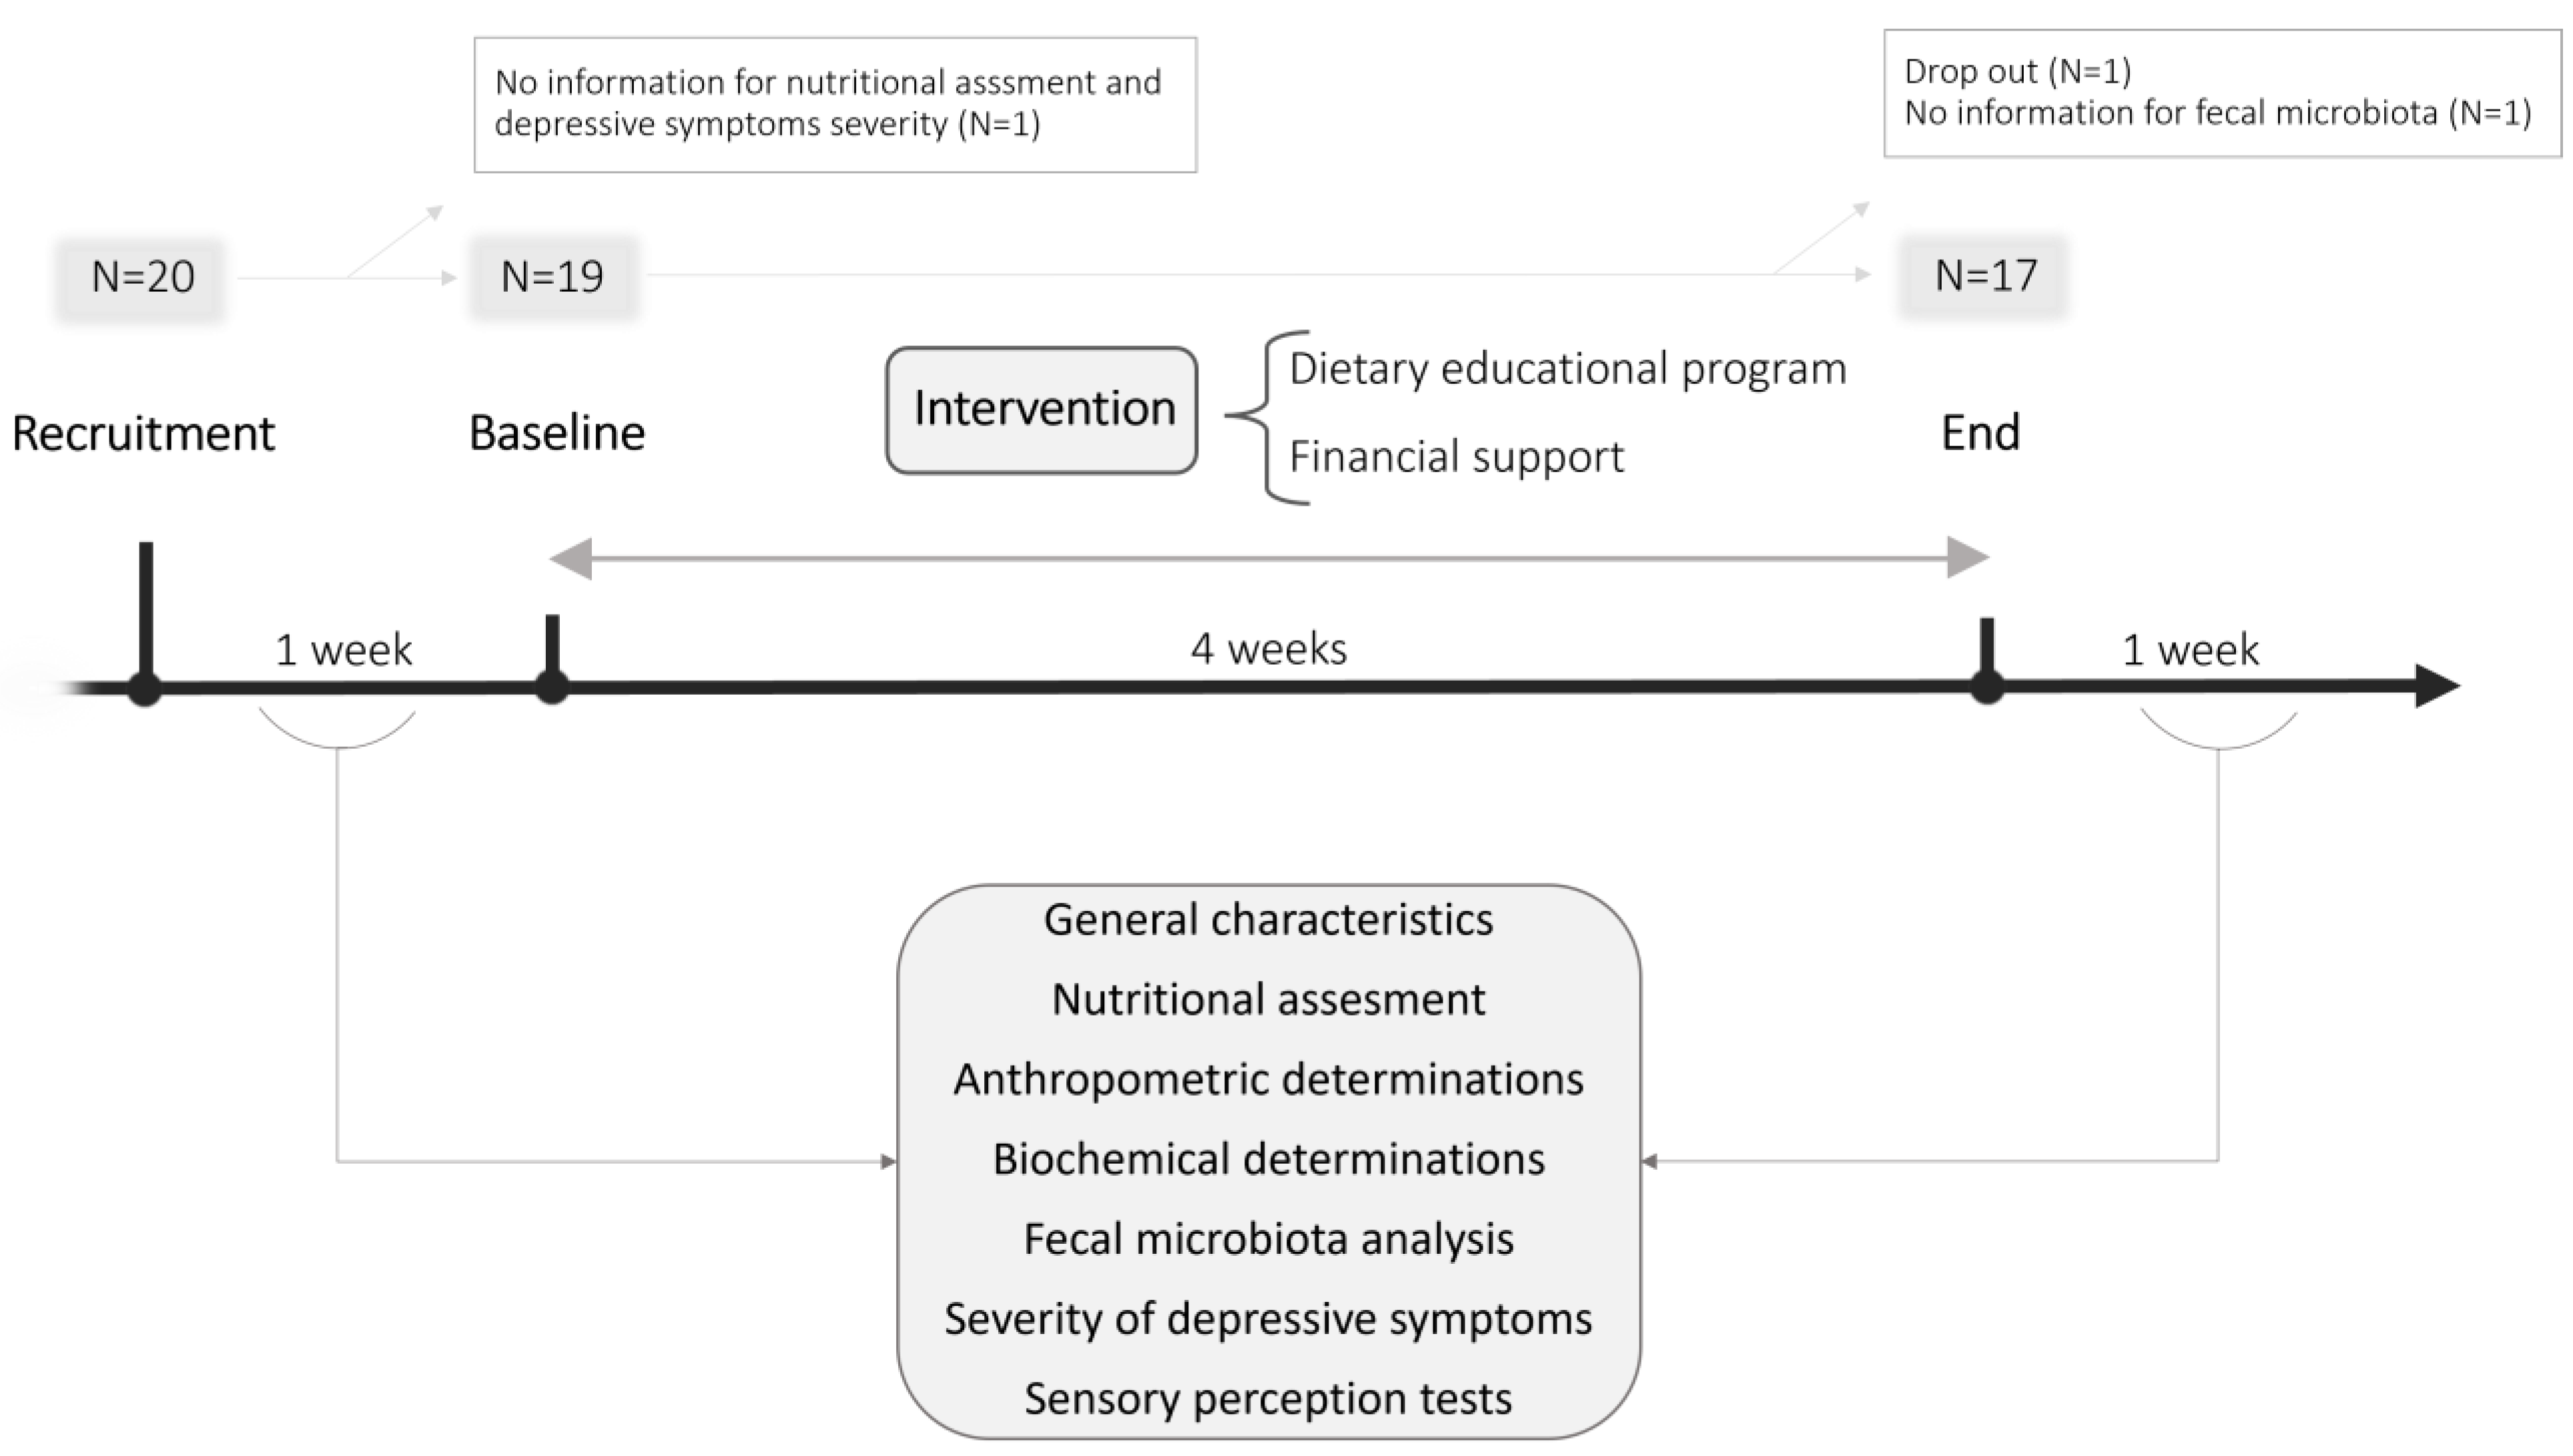
2.2. Study Design
2.3. General Characteristics
2.4. Nutritional Assessment
2.5. Severity of Depressive Symptoms
2.6. Anthropometric Determinations
2.7. Biochemical and Microbiological Analysis
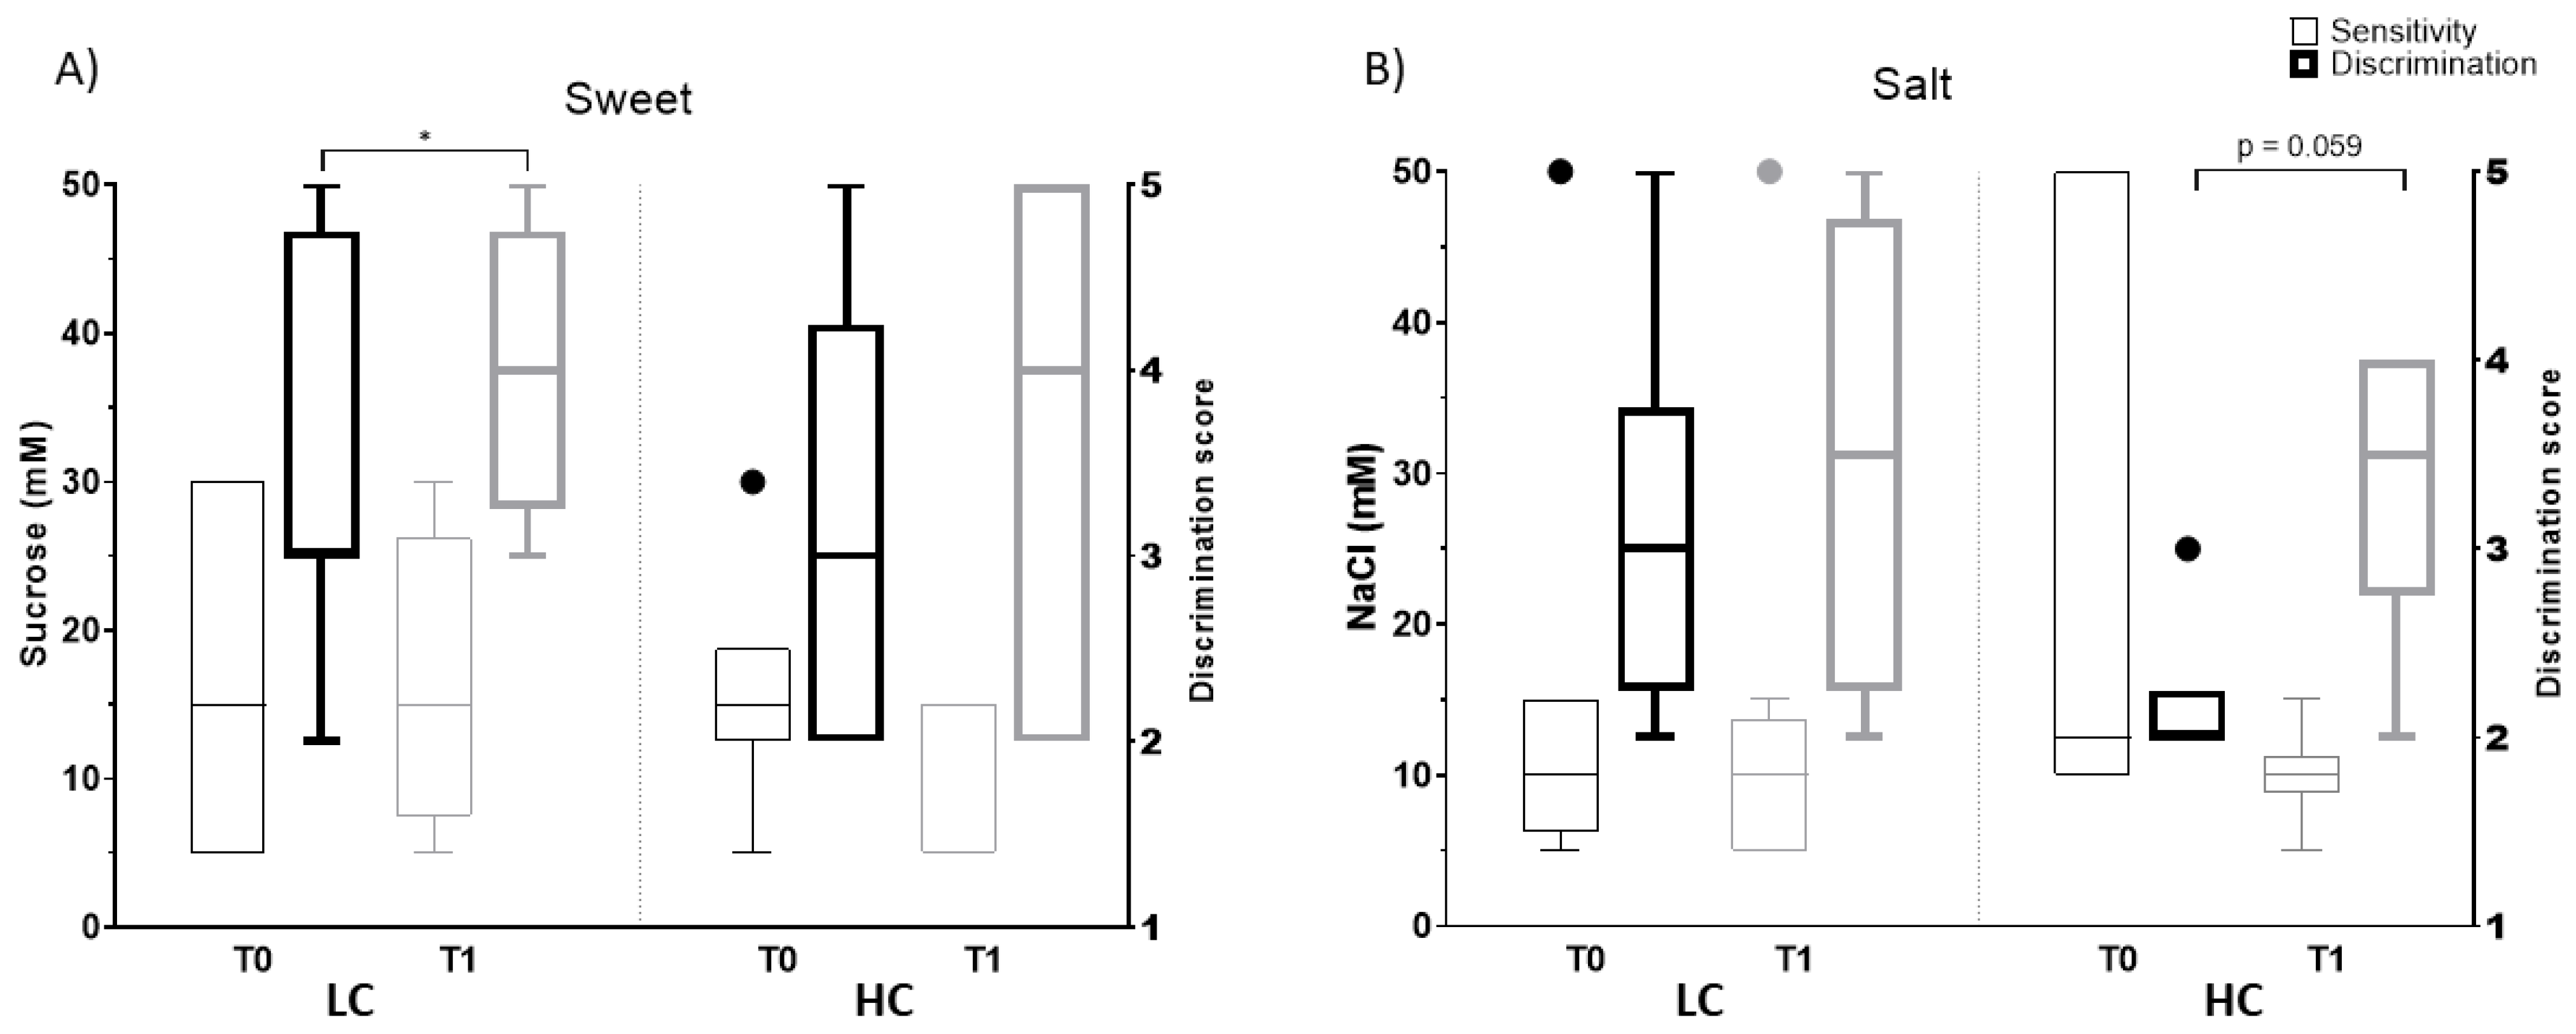
2.8. Salt and Sweet Sensitivity and Discrimination
2.9. Statistical Analysis
3. Results
3.1. Characteristics of the Study Sample
3.2. Effect of the Intervention on Dietary and Nutritional Intake
3.3. Effect of the Intervention on Anthropometric and Biochemical Parameters, Severity of Depressive Symptoms and Sensitivity and Discrimination for Salt and Sweet Taste
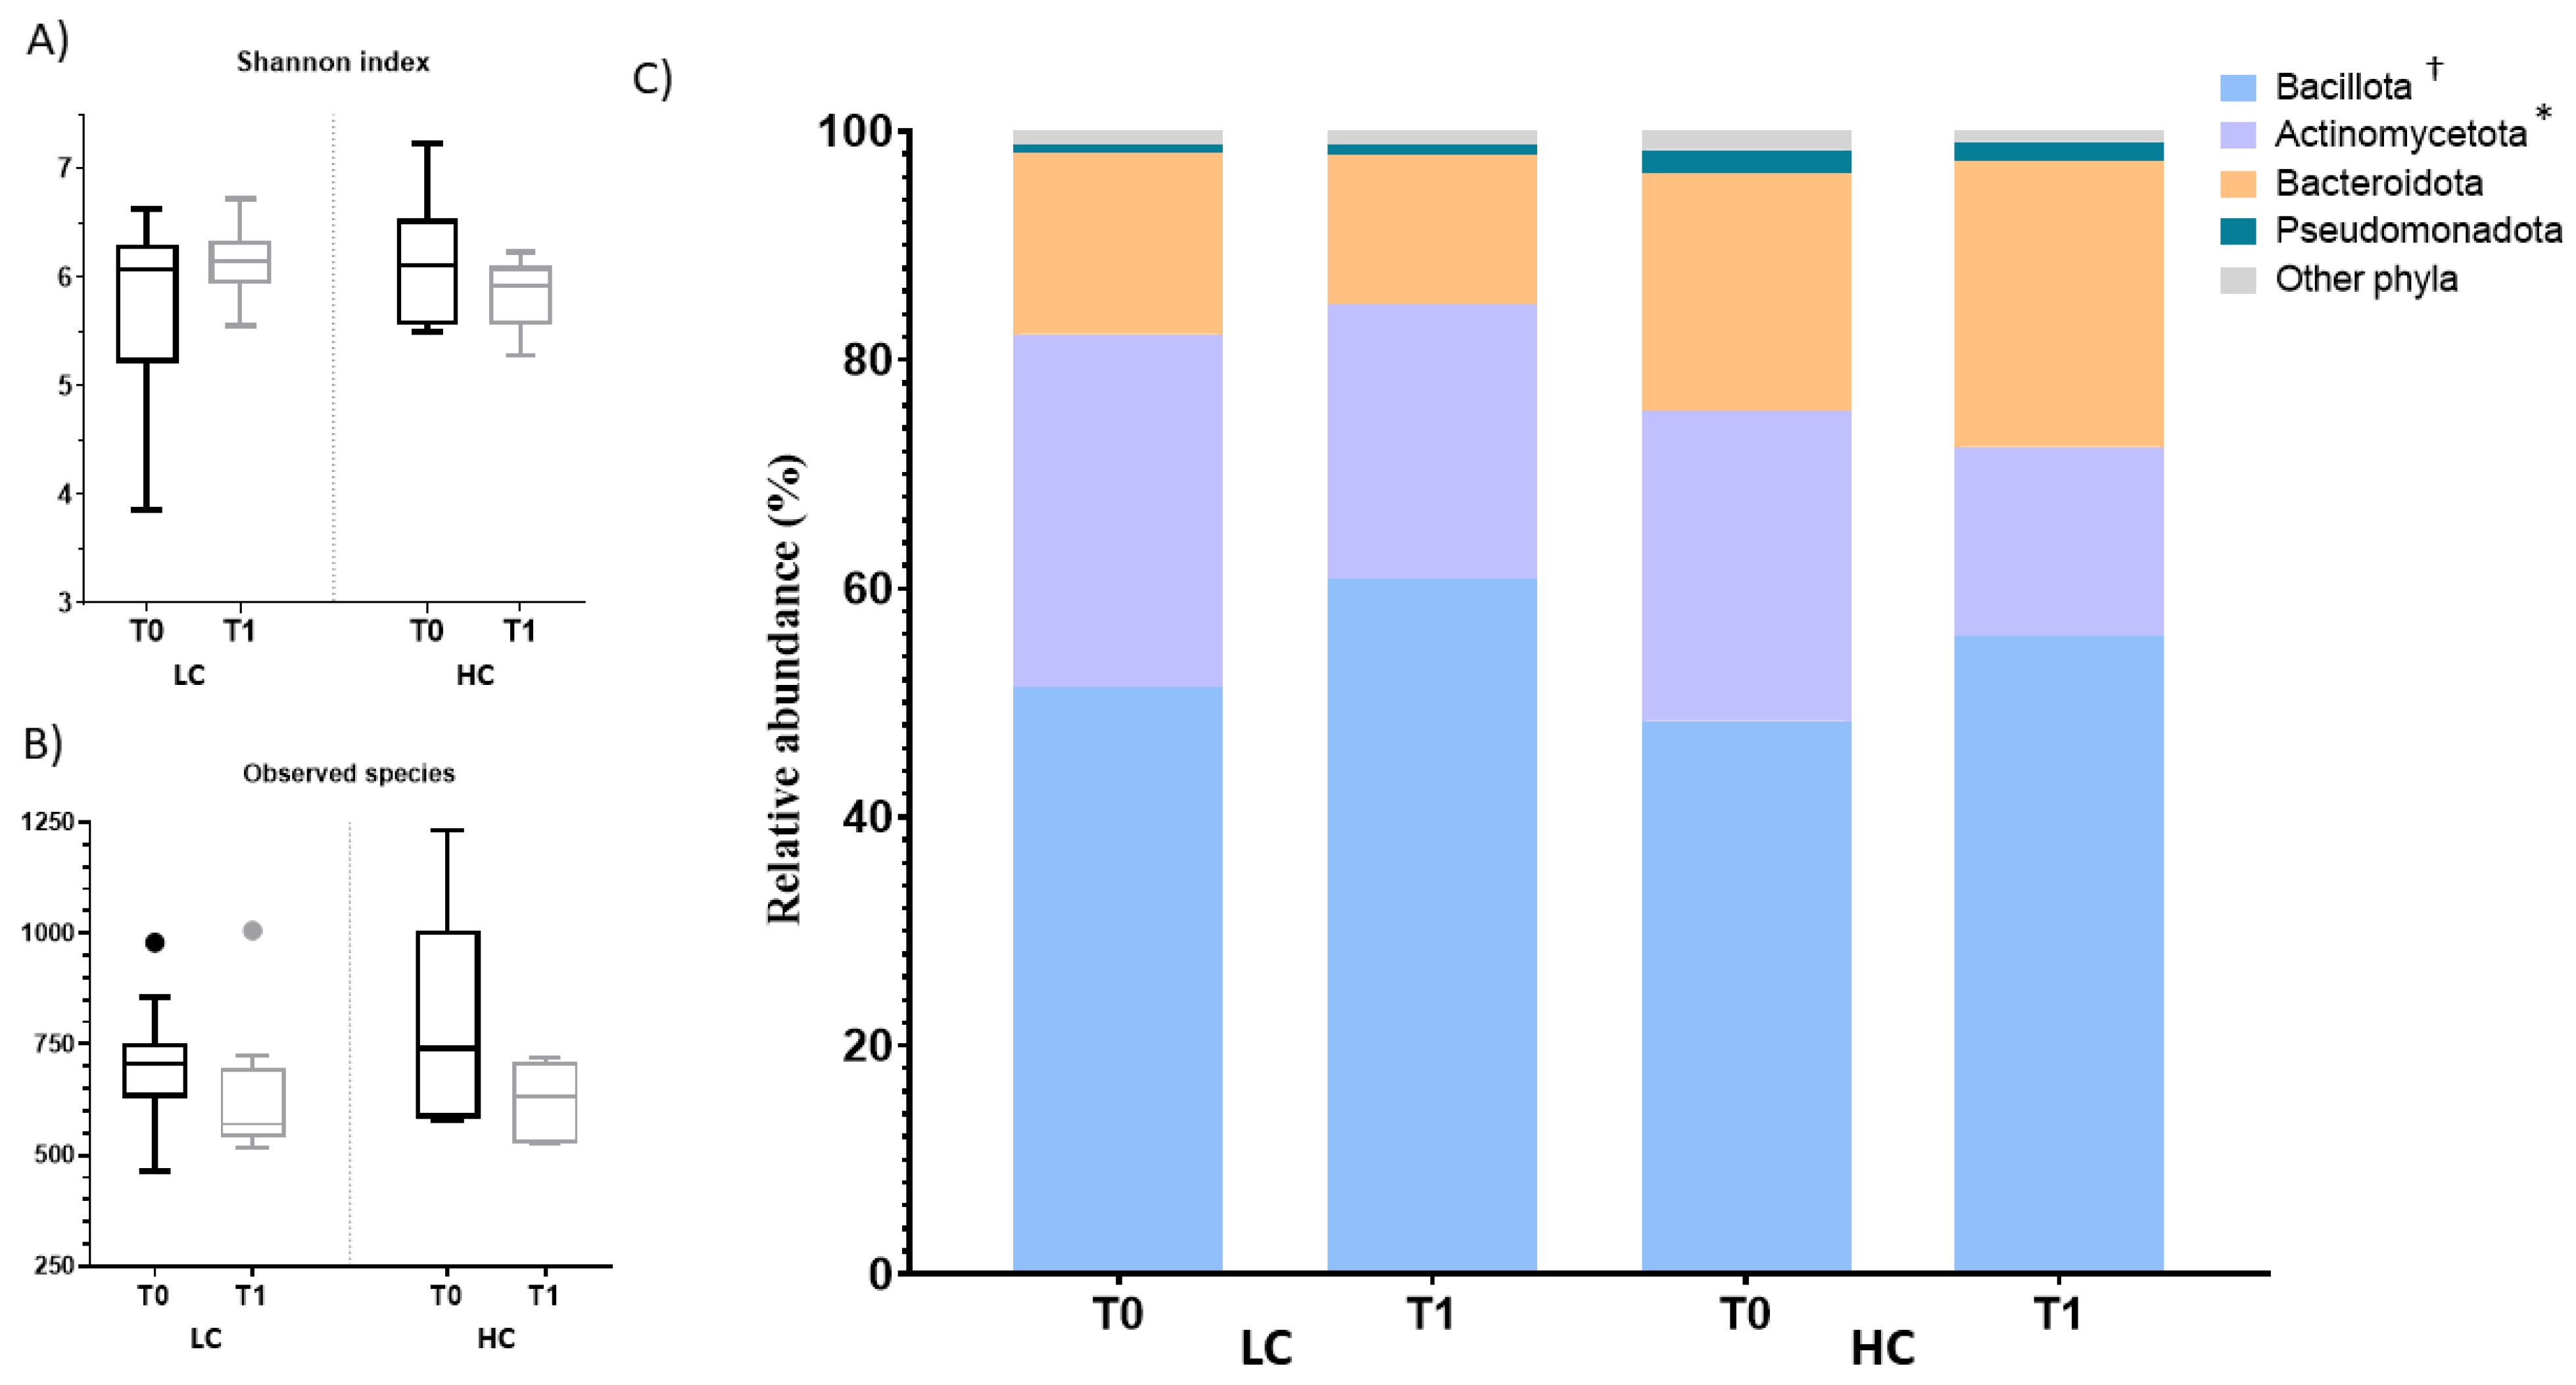
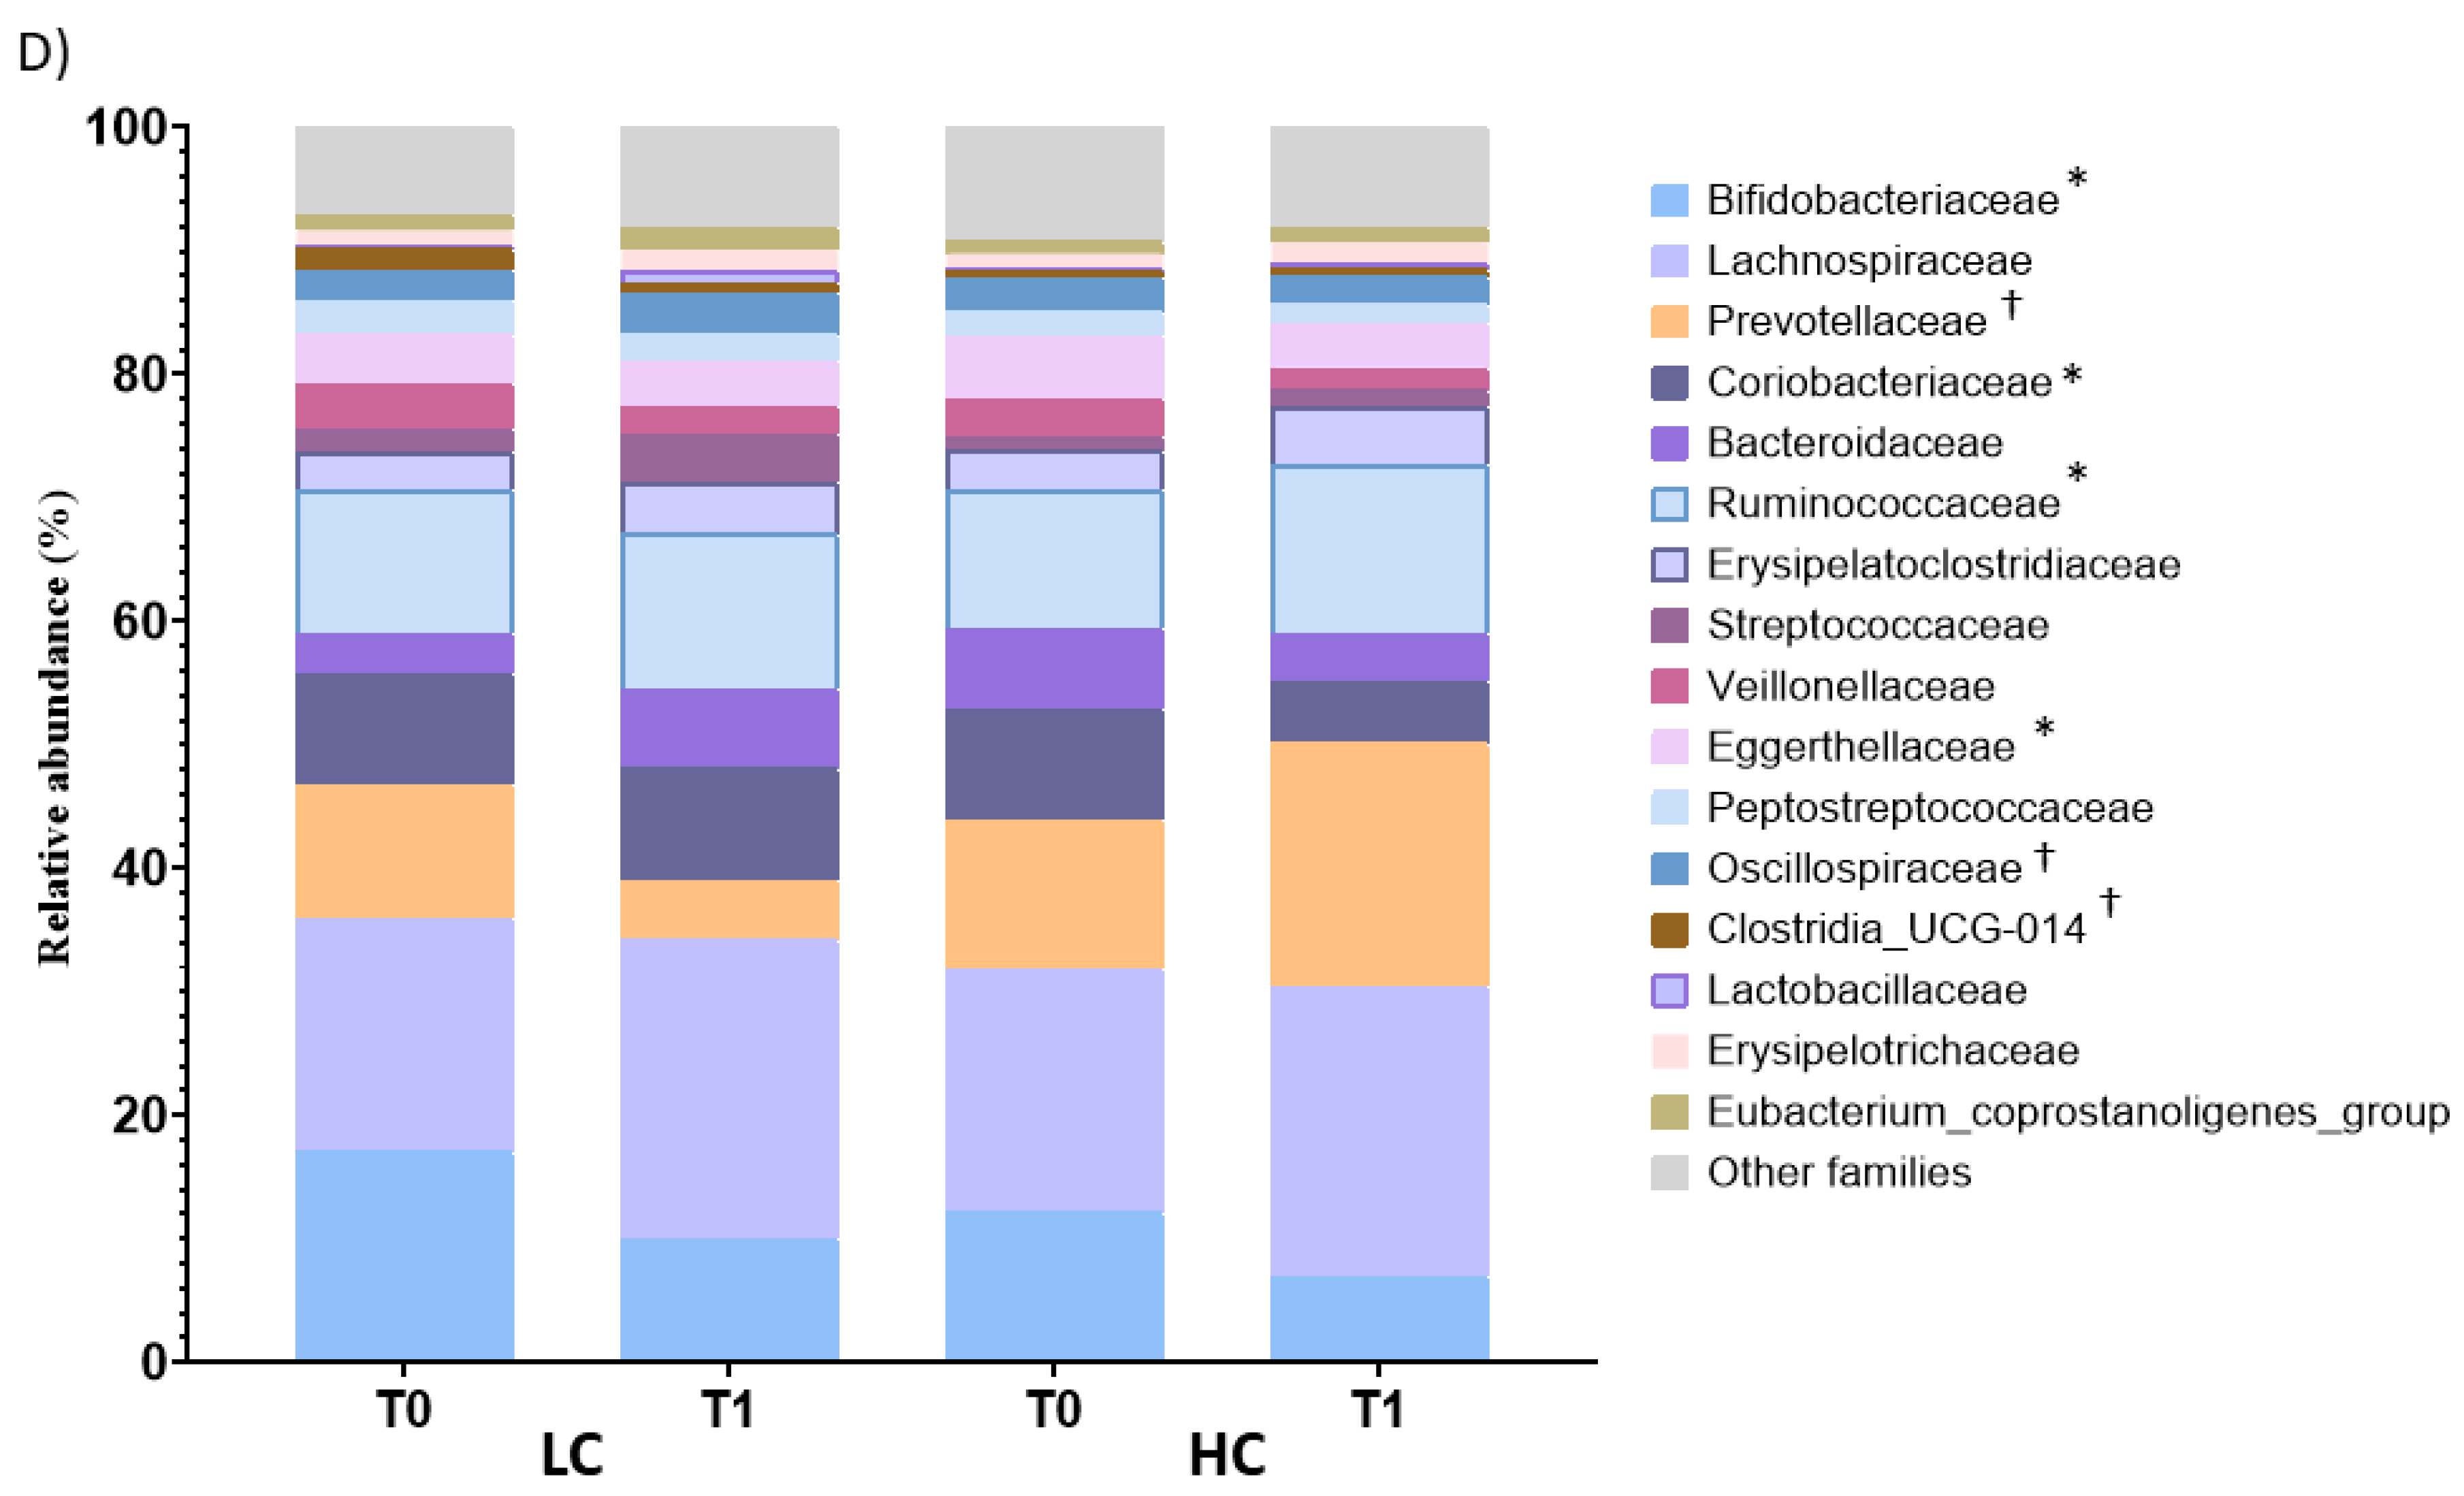
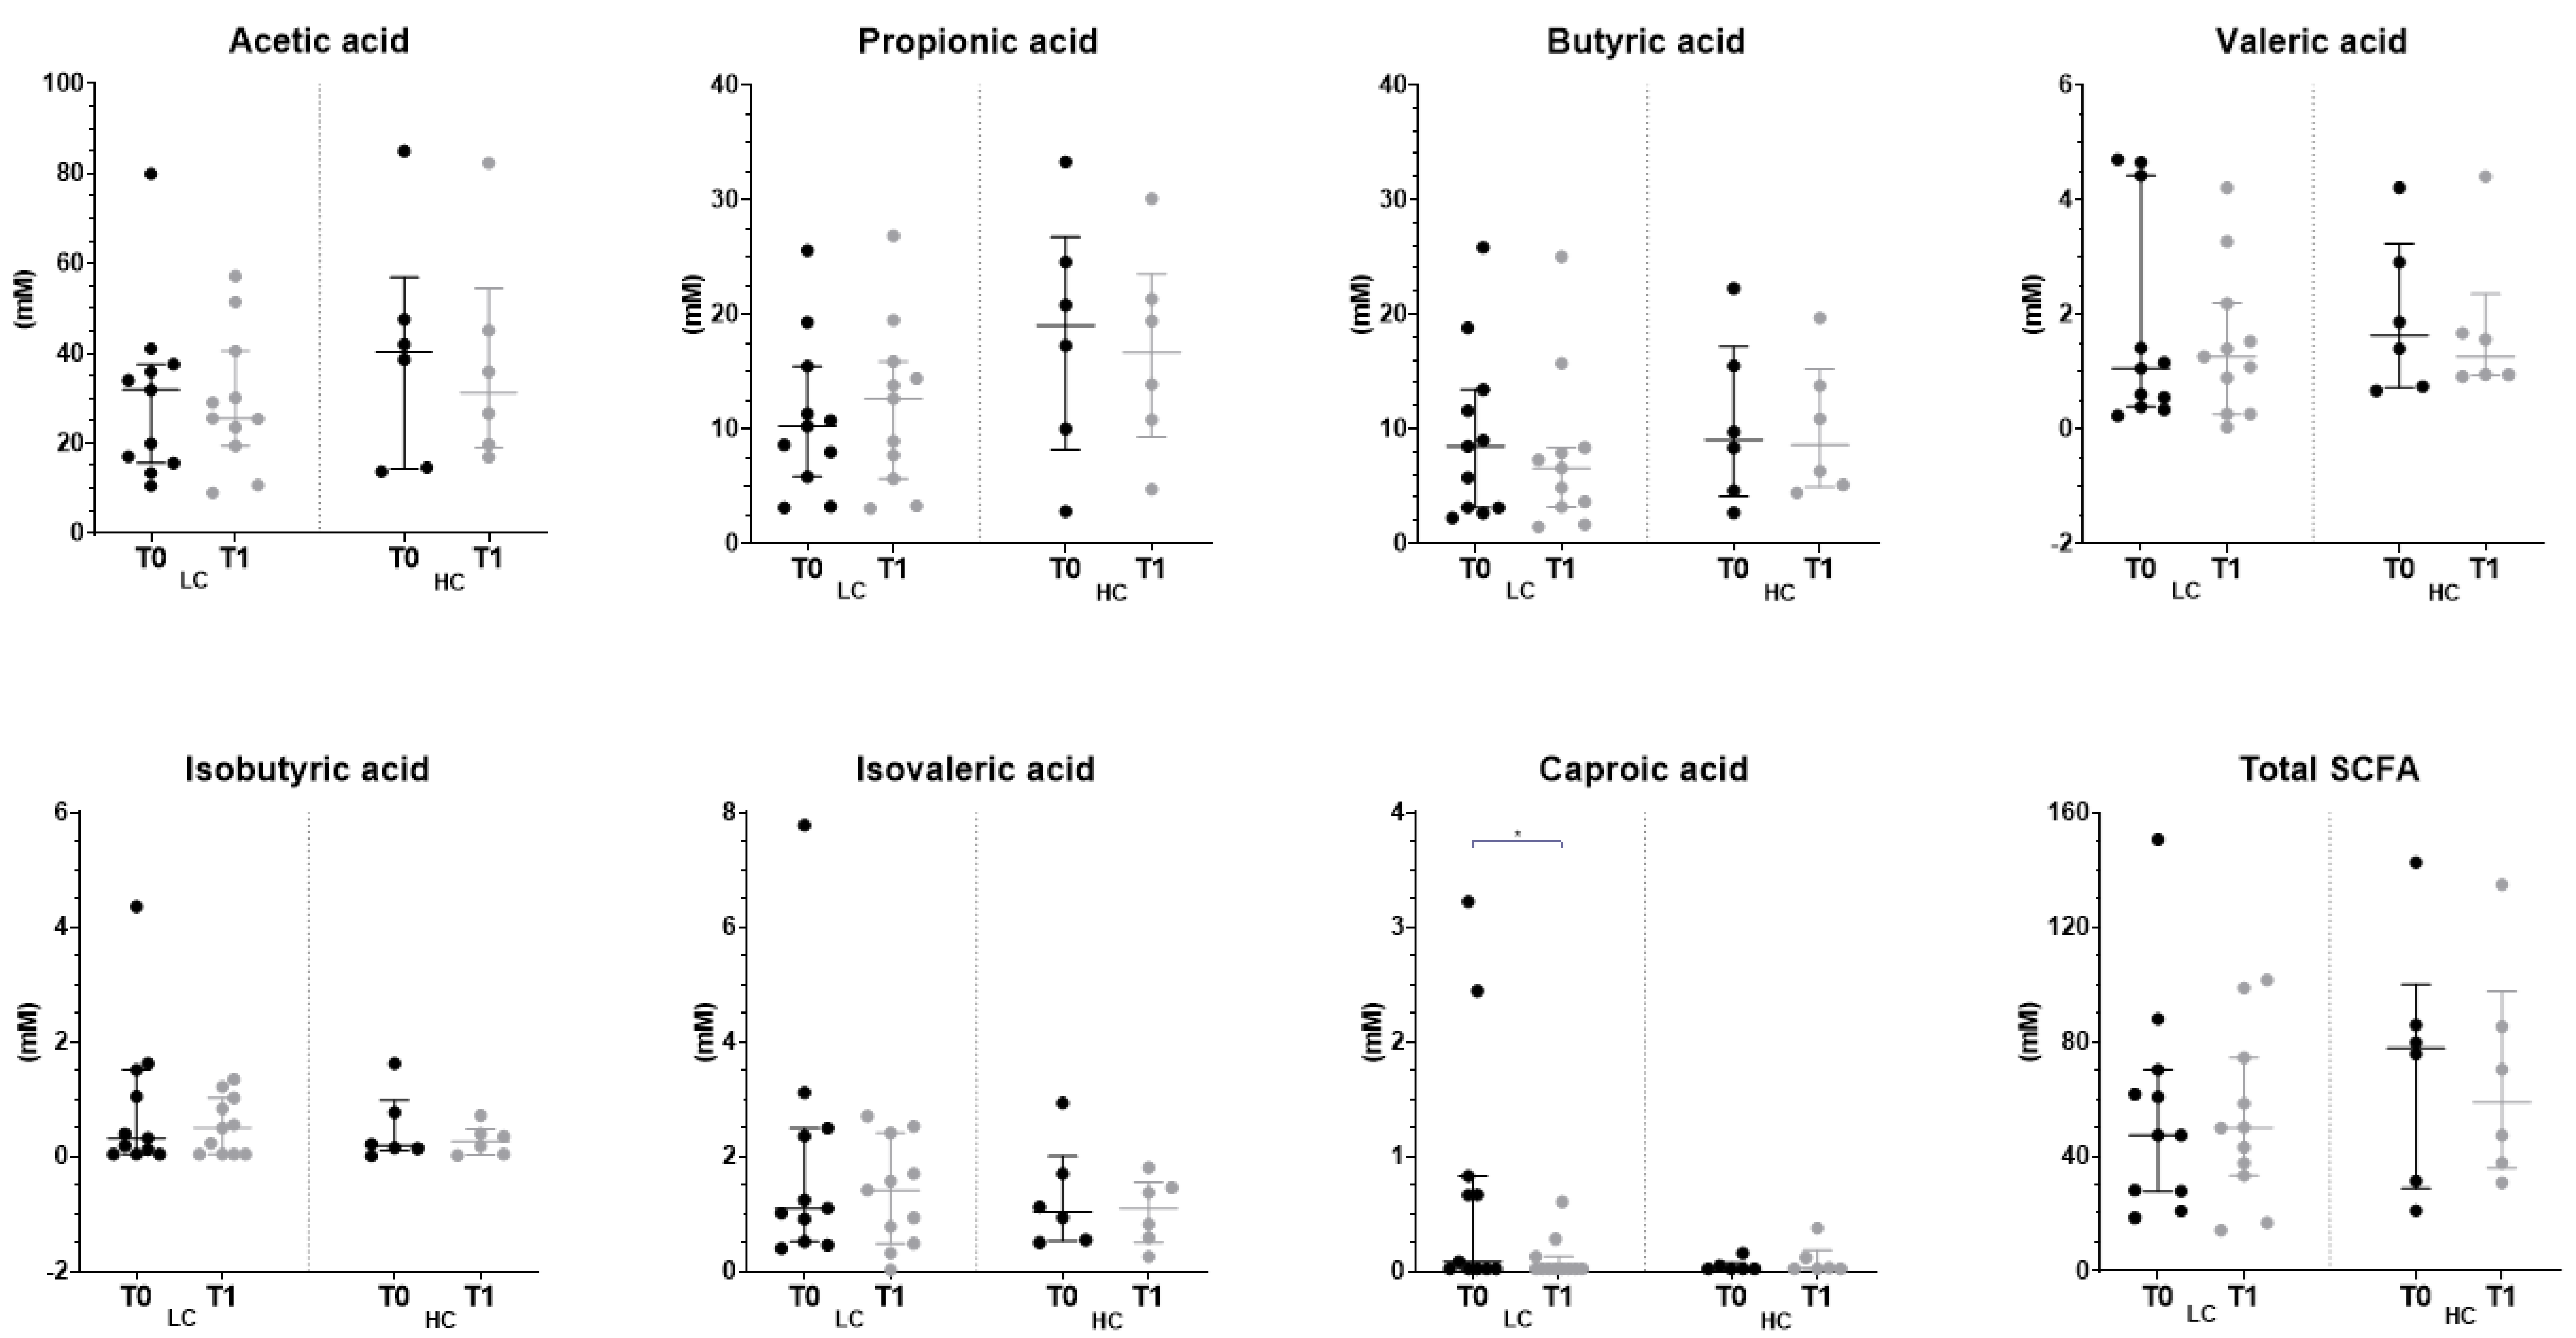
3.4. Effect of the Intervention on the Fecal Profile of Microbiota and SCFA
3.5. Dietary Intake and Shifts of Microbiota Profile Composition among Individuals with Reduced Severity of Depressive Symptoms
4. Discussion
5. Conclusions
Supplementary Materials
Author Contributions
Funding
Institutional Review Board Statement
Informed Consent Statement
Data Availability Statement
Acknowledgments
Conflicts of Interest
References
- Monteiro, C.A.; Cannon, G.; Lawrence, M.; Laura Da Costa Louzada, M.; Machado, P.P. Ultra-Processed Foods, Diet Quality, and Health Using the NOVA Classification System; FAO: Rome, Italy, 2019; Available online: https://www.fao.org/3/ca5644en/ca5644en.pdf (accessed on 20 June 2023).
- Bratanova, B.; Loughnan, S.; Klein, O.; Claassen, A.; Wood, R. Poverty, Inequality, and Increased Consumption of High Calorie Food: Experimental Evidence for a Causal Link. Appetite 2016, 100, 162–171. [Google Scholar] [CrossRef] [PubMed]
- Laitinen, J.; Ek, E.; Sovio, U. Stress-Related Eating and Drinking Behavior and Body Mass Index and Predictors of This Behavior. Prev. Med. 2002, 34, 29–39. [Google Scholar] [CrossRef] [PubMed]
- Parmenter, K.; Waller, J.; Wardle, J. Demographic Variation in Nutrition Knowledge in England. Health Educ. Res. 2000, 15, 163–174. [Google Scholar] [CrossRef]
- Rao, M.; Afshin, A.; Singh, G.; Mozaffarian, D. Do Healthier Foods and Diet Patterns Cost More than Less Healthy Options? A Systematic Review and Meta-Analysis. BMJ Open 2013, 3, 4277–4293. [Google Scholar] [CrossRef]
- Torres, S.J.; Nowson, C.A. Relationship between Stress, Eating Behavior, and Obesity. Nutrition 2007, 23, 887–894. [Google Scholar] [CrossRef] [PubMed]
- Van Der Velde, L.A.; Schuilenburg, L.A.; Thrivikraman, J.K.; Numans, M.E.; Kiefte-De Jong, J.C. Needs and Perceptions Regarding Healthy Eating among People at Risk of Food Insecurity: A Qualitative Analysis. Int. J. Equity Health 2019, 18, 1–12. [Google Scholar] [CrossRef]
- Zellner, D.A.; Loaiza, S.; Gonzalez, Z.; Pita, J.; Morales, J.; Pecora, D.; Wolf, A. Food Selection Changes under Stress. Physiol. Behav. 2006, 87, 789–793. [Google Scholar] [CrossRef]
- Katikireddi, S.V.; Whitley, E.; Lewsey, J.; Gray, L.; Leyland, A.H. Socioeconomic Status as an Effect Modifier of Alcohol Consumption and Harm: Analysis of Linked Cohort Data. Lancet Public Health 2017, 2, e267–e276. [Google Scholar] [CrossRef]
- Kinra, S.; Nelder, R.P.; Lewendon, G.J. Deprivation and Childhood Obesity: A Cross Sectional Study of 20 973 Children in Plymouth, United Kingdom. J. Epidemiol. Community Health 2000, 54, 456–460. [Google Scholar] [CrossRef]
- Martinez, S.A.; Beebe, L.A.; Thompson, D.M.; Wagener, T.L.; Terrell, D.R.; Campbell, J.E. A Structural Equation Modeling Approach to Understanding Pathways That Connect Socioeconomic Status and Smoking. PLoS ONE 2018, 13, e0192451–e0192468. [Google Scholar] [CrossRef]
- Oliver, L.N.; Hayes, M.V. Neighbourhood Socio-Economic Status and the Prevalence of Overweight Canadian Children and Youth. Can. J. Public Health 2005, 96, 415–420. [Google Scholar] [CrossRef] [PubMed]
- Ministère de la Santé et des Services sociaux (MSSS). Plan d’action Interministériel 2017–2021 de La Politique Gouvernementale de Prévention En Santé, Québec. 2018. Available online: https://publications.msss.gouv.qc.ca/msss/fichiers/2017/17-297-02W.pdf (accessed on 20 June 2023).
- Menezes, C.A.; Magalhães, L.B.; da Silva, J.T.; da Silva Lago, R.M.R.; Gomes, A.N.; Ladeia, A.M.T.; Vianna, N.A.; Oliveira, R.R. Ultra-Processed Food Consumption Is Related to Higher Trans Fatty Acids, Sugar Intake, and Micronutrient-Impaired Status in Schoolchildren of Bahia, Brazil. Nutrients 2023, 15, 381. [Google Scholar] [CrossRef] [PubMed]
- Segura, I.E. Avaliação Do Estado Nutricional e Consumo Alimentar de Escolares Da Rede Municipal de Educação de São Paulo; Universidade de São Paulo Facultade de Saude Publica: São Paulo, Brazil, 2019. [Google Scholar]
- Clinton, S.K.; Giovannucci, E.L.; Hursting, S.D. The World Cancer Research Fund/American Institute for Cancer Research Third Expert Report on Diet, Nutrition, Physical Activity, and Cancer: Impact and Future Directions. J. Nutr. 2020, 150, 663–671. [Google Scholar] [CrossRef] [PubMed]
- Gantenbein, K.V.; Kanaka-Gantenbein, C. Mediterranean Diet as an Antioxidant: The Impact on Metabolic Health and Overall Wellbeing. Nutrients 2021, 13, 1951. [Google Scholar] [CrossRef]
- Ruiz-Saavedra, S.; Zapico, A.; del Rey, C.; Gonzalez, C.; Suárez, A.; Díaz, Y.; de los Reyes-Gavilán, C.G.; González, S. Dietary Xenobiotics Derived from Food Processing: Association with Fecal Mutagenicity and Gut Mucosal Damage. Nutrients 2022, 14, 3482. [Google Scholar] [CrossRef]
- Donoso, F.; Cryan, J.F.; Olavarría-Ramírez, L.; Nolan, Y.M.; Clarke, G. Inflammation, Lifestyle Factors, and the Microbiome-gut-brain Axis: Relevance to Depression and Antidepressant Action. Clin. Pharmacol. Ther. 2023, 113, 246–259. [Google Scholar] [CrossRef]
- Zamora-Ros, R.; Andres-Lacueva, C.; Lamuela-Raventós, R.M.; Berenguer, T.; Jakszyn, P.; Barricarte, A.; Ardanaz, E.; Amiano, P.; Dorronsoro, M.; Larrañaga, N.; et al. Estimation of Dietary Sources and Flavonoid Intake in a Spanish Adult Population (EPIC-Spain). J. Am. Diet. Assoc. 2010, 110, 390–398. [Google Scholar] [CrossRef]
- Kimble, R.; Gouinguenet, P.; Ashor, A.; Stewart, C.; Deighton, K.; Matu, J.; Griffiths, A.; Malcomson, F.C.; Joel, A.; Houghton, D.; et al. Effects of a Mediterranean Diet on the Gut Microbiota and Microbial Metabolites: A Systematic Review of Randomized Controlled Trials and Observational Studies. Crit. Rev. Food Sci. Nutr. 2022, 1, 1–22. [Google Scholar] [CrossRef]
- Meslier, V.; Laiola, M.; Roager, H.M.; De Filippis, F.; Roume, H.; Quinquis, B.; Giacco, R.; Mennella, I.; Ferracane, R.; Pons, N.; et al. Mediterranean Diet Intervention in Overweight and Obese Subjects Lowers Plasma Cholesterol and Causes Changes in the Gut Microbiome and Metabolome Independently of Energy Intake. Gut 2020, 69, 1258–1268. [Google Scholar] [CrossRef]
- Merra, G.; Noce, A.; Marrone, G.; Cintoni, M.; Tarsitano, M.G.; Capacci, A.; De Lorenzo, A. Influence of Mediterranean Diet on Human Gut Microbiota. Nutrients 2021, 13, 7. [Google Scholar] [CrossRef]
- Chanmuang, S.; Kim, B.M.; Gu, S.Y.; Son, Y.J.; Le, H.G.; Nam, Y.D.; Song, E.J.; Ham, K.S.; Kim, H.J. Effects of Sea Salt Intake on Metabolites, Steroid Hormones, and Gut Microbiota in Rats. PLoS ONE 2022, 17, e0269014. [Google Scholar] [CrossRef]
- Conlon, M.A.; Bird, A.R. The Impact of Diet and Lifestyle on Gut Microbiota and Human Health. Nutrients 2015, 7, 17. [Google Scholar] [CrossRef] [PubMed]
- Kaakoush, N. Insights into the Role of Erysipelotrichaceae in the Human Host. Front. Cell Infect. Microbiol. 2015, 5, 84–88. [Google Scholar] [CrossRef] [PubMed]
- Butler, M.I.; Bastiaanssen, T.F.S.; Long-Smith, C.; Berding, K.; Morkl, S.; Cusack, A.M.; Strain, C.; Busca, K.; Porteous-Allen, P.; Claesson, M.J.; et al. Recipe for a Healthy Gut: Intake of Unpasteurised Milk Is Associated with Increased Lactobacillus Abundance in the Human Gut Microbiome. Nutrients 2020, 12, 1468. [Google Scholar] [CrossRef] [PubMed]
- Yin, Y.N.; Yu, Q.F.; Fu, N.; Liu, X.W.; Lu, F.G. Effects of Four Bifidobacteria on Obesity in High-Fat Diet Induced Rats. World J. Gastroenterol. 2010, 16, 3394–3401. [Google Scholar] [CrossRef]
- Li, J.; Wang, J.; Wang, M.; Zheng, L.; Cen, Q.; Wang, F.; Zhu, L.; Pang, R.; Zhang, A. Bifidobacterium: A Probiotic for the Prevention and Treatment of Depression. Front. Microbiol. 2023, 14, 1174800. [Google Scholar] [CrossRef]
- Berding, K.; Vlckova, K.; Marx, W.; Schellekens, H.; Stanton, C.; Clarke, G.; Jacka, F.; Dinan, T.G.; Cryan, J.F. Diet and the Microbiota-Gut-Brain Axis: Sowing the Seeds of Good Mental Health. Adv. Nutr. 2021, 12, 1239–1285. [Google Scholar] [CrossRef]
- Di Polito, N.; Stylianakis, A.A.; Richardson, R.; Baker, K.D. Real-World Intake of Dietary Sugars Is Associated with Reduced Cortisol Reactivity Following an Acute Physiological Stressor. Nutrients 2023, 15, 209. [Google Scholar] [CrossRef]
- Jørgensen, B.P.; Hansen, J.T.; Krych, L.; Larsen, C.; Klein, A.B.; Nielsen, D.S.; Josefsen, K.; Hansen, A.K.; Sørensen, D.B. A Possible Link between Food and Mood: Dietary Impact on Gut Microbiota and Behavior in BALB/c Mice. PLoS ONE 2014, 9, e103398. [Google Scholar] [CrossRef]
- Opie, R.S.; O’Neil, A.; Itsiopoulos, C.; Jacka, F.N. The Impact of Whole-of-Diet Interventions on Depression and Anxiety: A Systematic Review of Randomised Controlled Trials. Public Health Nutr. 2015, 18, 2074–2093. [Google Scholar] [CrossRef]
- Berding, K.; Bastiaanssen, T.F.S.; Moloney, G.M.; Boscaini, S.; Strain, C.R.; Anesi, A.; Long-Smith, C.; Mattivi, F.; Stanton, C.; Clarke, G.; et al. Feed Your Microbes to Deal with Stress: A Psychobiotic Diet Impacts Microbial Stability and Perceived Stress in a Healthy Adult Population. Mol. Psychiatry 2022, 28, 601–610. [Google Scholar] [CrossRef] [PubMed]
- Uemura, M.; Hayashi, F.; Ishioka, K.; Ihara, K.; Yasuda, K.; Okazaki, K.; Omata, J.; Suzutani, T.; Hirakawa, Y.; Chiang, C.; et al. Obesity and Mental Health Improvement Following Nutritional Education Focusing on Gut Microbiota Composition in Japanese Women: A Randomised Controlled Trial. Eur. J. Nutr. 2019, 58, 3291–3302. [Google Scholar] [CrossRef]
- Aizawa, E.; Tsuji, H.; Asahara, T.; Takahashi, T.; Teraishi, T.; Yoshida, S.; Ota, M.; Koga, N.; Hattori, K.; Kunugi, H. Possible Association of Bifidobacterium and Lactobacillus in the Gut Microbiota of Patients with Major Depressive Disorder. J. Affect. Disord. 2016, 202, 254–257. [Google Scholar] [CrossRef] [PubMed]
- Craig, C.; Marshall, A.; Sjöström, M.; Bauman, A.; Booth, M.; Ainsworth, B.; Pratt, M.; Ekelund, U.; Yngve, A.; Sallis, J.; et al. International Physical Activity Questionannaire: 12-Country Reliability and Validity. Med. Sci. Sports Exerc. 2003, 35, 1381–1395. [Google Scholar] [CrossRef] [PubMed]
- International Physical Activity Questionnaire (IPAQ). Research Committee Guidelines for Data Processing and Analysis of the International Physical Activity Questionnaire (IPAQ)—Short and Long Forms. 2005. Available online: https://www.researchgate.net/file.PostFileLoader.html?id=5641f4c36143250eac8b45b7&assetKey=AS%3A294237418606593%401447163075131 (accessed on 20 June 2023).
- Zapico, A.; Arboleya, S.; Ruiz-Saavedra, S.; Gómez-Martín, M.; Salazar, N.; Nogacka, A.M.; Gueimonde, M.; de los Reyes-Gavilán, C.G.; González, S. Dietary Xenobiotics, (Poly)Phenols and Fibers: Exploring Associations with Gut Microbiota in Socially Vulnerable Individuals. Front. Nutr. 2022, 9, 1000829. [Google Scholar] [CrossRef]
- Farran, A.; Zamora, R.; Cervera, P. Tablas de Composición de Alimentos Del Centro de Enseñanza Superior En Nutrición y Dietética (CESNID); McGraw Hill Interamericana: New York, NY, USA, 2004; ISBN 9789701069202. [Google Scholar]
- Marlett, J.; Cheung, T. Database and Quick Methods of Assessing Typical Dietary Fiber Intakes Using Data for 228 Commonly Consumed Foods. J. Am. Diet. Assoc. 1997, 97, 1139–1148. [Google Scholar] [CrossRef]
- United States Department of Agriculture (USDA). Food Composition Databases. Available online: https://fdc.nal.usda.gov/download-datasets.html (accessed on 12 May 2023).
- Neveu, V.; Perez-Jiménez, J.; Vos, F.; Crespy, V.; du Chaffaut, L.; Mennen, L.; Knox, C.; Eisner, R.; Cruz, J.; Wishart, D.; et al. Phenol-Explorer: An Online Comprehensive Database on Polyphenol Contents in Foods. Database 2010, 2010, 1–9. [Google Scholar] [CrossRef] [PubMed]
- Jakszyn, P.; Ibáñez, R.; Pera, G.; Agudo, A.; García-Closas, R.; Amiano, P.; González, C. Food Content of Potential Carcinogens; Catalan Institute of Oncology: Barcelona, Spain, 2004. [Google Scholar]
- National Institute of Health (NIH). CHARRED: Computerized Heterocyclic Amines Resource for Research in Epidemiology of Disease. Available online: https://dceg.cancer.gov/tools/design/charred (accessed on 21 May 2021).
- European Food Safety Authority (EFSA). Opinion of the Scientific Panel on Contaminants in the Food Chain on a Request from the European Commission to Perform a Scientific Risk Assessment on Nitrate in Vegetables. EFSA J. 2008, 689, 1–79. [Google Scholar] [CrossRef]
- Food and Drug Administration (FDA). Survey Data on Acrylamide in Food. Available online: https://www.fda.gov/food/chemical-contaminants-food/survey-data-acrylamide-food (accessed on 6 September 2022).
- Campillo, N.; Viñas, P.; Martínez-Castillo, N.; Hernández-Córdoba, M. Determination of Volatile Nitrosamines in Meat Products by Microwave-Assisted Extraction and Dispersive Liquid-Liquid Microextraction Coupled to Gas Chromatography-Mass Spectrometry. J. Chromatogr. A 2011, 1218, 1815–1821. [Google Scholar] [CrossRef]
- De Mey, E.; De Klerck, K.; De Maere, H.; Dewulf, L.; Derdelinckx, G.; Peeters, M.C.; Fraeye, I.; Vander Heyden, Y.; Paelinck, H. The Occurrence of N-Nitrosamines, Residual Nitrite and Biogenic Amines in Commercial Dry Fermented Sausages and Evaluation of Their Occasional Relation. Meat Sci. 2014, 96, 821–828. [Google Scholar] [CrossRef]
- Falcó, G.; Domingo, J.L.; Llobet, J.M.; Teixidó, A.; Casas, C.; Müller, L. Polycyclic Aromatic Hydrocarbons in Foods: Human Exposure through the Diet in Catalonia, Spain. J. Food Prot. 2003, 66, 2325–2331. [Google Scholar] [CrossRef]
- Hellenäs, K.-E.; Fohgelberg, P.; Fäger, U.; Busk, L.; Zetterberg, A.; Ionescu, C.; Färnstrand, J.S. Acrylamide in Swedish Food—Targeted Sampling 2011 and 2012. Livsmedels Verket. Sweedish Food Agency: Uppsala, Sweden, 2013. Available online: https://www.livsmedelsverket.se/globalassets/publikationsdatabas/rapporter/2013/2013_national_food_agency_25_acrylamide_in_swedish_food_targeted_sampling_2011_and_2012.pdf (accessed on 20 June 2023).
- Konings, E.J.M.; Baars, A.J.; Van Klaveren, J.D.; Spanjer, M.C.; Rensen, P.M.; Hiemstra, M.; Van Kooij, J.A.; Peters, P.W.J. Acrylamide Exposure from Foods of the Dutch Population and an Assessment of the Consequent Risks. Food Chem. Toxicol. 2003, 41, 1569–1579. [Google Scholar] [CrossRef]
- Lee, H.S. Literature Compilation of Volatile N-Nitrosamines in Processed Meat and Poultry Products—An Update. Food Addit. Contam. Part A Chem. Anal. Control Expo. Risk Assess. 2019, 36, 1491–1500. [Google Scholar] [CrossRef]
- Palacios-Colón, L.; Rascón, A.J.; Ballesteros, E. Trace-Level Determination of Polycyclic Aromatic Hydrocarbons in Dairy Products Available in Spanish Supermarkets by Semi-Automated Solid-Phase Extraction and Gas Chromatography–Mass Spectrometry Detection. Foods 2022, 11, 713. [Google Scholar] [CrossRef] [PubMed]
- Park, J.E.; Seo, J.E.; Lee, J.Y.; Kwon, H. Distribution of Seven N-Nitrosamines in Food. Toxicol. Res. 2015, 31, 279–288. [Google Scholar] [CrossRef] [PubMed]
- Svensson, K.; Abramsson, L.; Becker, W.; Glynn, A.; Hellenäs, K.E.; Lind, Y.; Rosén, J. Dietary Intake of Acrylamide in Sweden. Food Chem. Toxicol. 2003, 41, 1581–1586. [Google Scholar] [CrossRef]
- Martínez-González, M.Á.; Corella, D.; Salas-Salvadó, J.; Ros, E.; Covas, M.I.; Fiol, M.; Wärnberg, J.; Arós, F.; Ruíz-Gutiérrez, V.; Lamuela-Raventós, R.M.; et al. Cohort Profile: Design and Methods of the PREDIMED Study. Int. J. Epidemiol. 2012, 41, 377–385. [Google Scholar] [CrossRef]
- Schröder, H.; Fitó, M.; Estruch, R.; Martínez-González, M.A.; Corella, D.; Salas-Salvadó, J.; Lamuela-Raventós, R.; Ros, E.; Salaverría, I.; Fiol, M.; et al. A Short Screener Is Valid for Assessing Mediterranean Diet Adherence among Older Spanish Men and Women. J. Nutr. 2011, 141, 1140–1145. [Google Scholar] [CrossRef]
- Sanz, J.; Gutiérrez, S.; Gesteira, C.; García-Vera, M.P. Criterios y Baremos Para Interpretar El “Inventario de Depresión de Beck-II” (BDI-II). Behav. Psychol. Psicol. Conduct. 2014, 22, 37–59. [Google Scholar]
- Schutt, P.E.; Kung, S.; Clark, M.M.; Koball, A.M.; Grothe, K.B. Comparing the Beck Depression Inventory-II (BDI-II) and Patient Health Questionnaire (PHQ-9) Depression Measures in an Outpatient Bariatric Clinic. Obes. Surg. 2016, 26, 1274–1278. [Google Scholar] [CrossRef] [PubMed]
- Fernández-Navarro, T.; Díaz, I.; Gutiérrez-Díaz, I.; Rodríguez-Carrio, J.; Suárez, A.; de los Reyes-Gavilán, C.G.; Gueimonde, M.; Salazar, N.; González, S. Exploring the Interactions between Serum Free Fatty Acids and Fecal Microbiota in Obesity through a Machine Learning Algorithm. Food Res. Int. 2019, 121, 533–541. [Google Scholar] [CrossRef] [PubMed]
- Sociedad Española para el Estudio de la Obesidad (SEEDO). Consenso SEEDO 2000 Para La Evaluación Del Sobrepeso y La Obesidad y El Establecimiento de Criterios de Intervención Terapéutica. Med. Clin. 2000, 115, 587–597. [Google Scholar] [CrossRef]
- Visscher, T.; Seidell, J.C.; Molarius, A.; Van Der Kuip, D.; Hofman, A.; Witteman, J. A Comparison of Body Mass Index, Waist-Hip Ratio and Waist Circumference as Predictors of All-Cause Mortality among the Elderly: The Rotterdam Study. Int. J. Obes. 2001, 25, 1730–1735. [Google Scholar] [CrossRef] [PubMed]
- Dore, J.; Ehrlich, S.D.; Levenez, F.; Pelletier, E.; Alberti, A.; Bertrand, L.; Bork, P.; Costea, P.I.; Sunagawa, S.; Guarner, F.; et al. Standard Operating Procedure for Fecal Samples DNA Extraction. Protocol Q. International Human Microbiome Standards. 2015. Available online: https://brd.nci.nih.gov/brd/sop/download-pdf/2525 (accessed on 20 June 2023).
- Valdés, L.; Salazar, N.; González, S.; Arboleya, S.; Ríos-Covián, D.; Genovés, S.; Ramón, D.; de los Reyes-Gavilán, C.G.; Ruas-Madiedo, P.; Gueimonde, M. Selection of Potential Probiotic Bifidobacteria and Prebiotics for Elderly by Using in Vitro Faecal Batch Cultures. Eur. Food Res. Technol. 2017, 243, 157–165. [Google Scholar] [CrossRef]
- Salazar, N.; Gueimonde, M.; Hernández-Barranco, A.M.; Ruas-Madiedo, P.; De Los Reyes-Gavilán, C.G. Exopolysaccharides Produced by Intestinal Bifidobacterium Strains Act as Fermentable Substrates for Human Intestinal Bacteria. Appl. Environ. Microbiol. 2008, 74, 4737–4745. [Google Scholar] [CrossRef] [PubMed]
- Arguelles, J.; Diaz, J.J.; Malaga, I.; Perillan, C.; Costales, M.; Vijande, M. Sodium Taste Threshold in Children and Its Relationship to Blood Pressure. Braz. J. Med. Biol. Res. 2007, 40, 721–726. [Google Scholar] [CrossRef] [PubMed]
- Málaga, I.; Arguelles, J.; Díaz, J.J.; Perillán, C.; Vijande, M.; Málaga, S. Maternal Pregnancy Vomiting and Offspring Salt Taste Sensitivity and Blood Pressure. Pediatr. Nephrol. 2005, 20, 956–960. [Google Scholar] [CrossRef]
- Webb, J.; Bolhuis, D.P.; Cicerale, S.; Hayes, J.E.; Keast, R. The Relationships between Common Measurements of Taste Function. Chemosens. Percept. 2015, 8, 11–18. [Google Scholar] [CrossRef]
- López, G.E.; Bretón, L.I.; Perales, A.D.; Arribas, V.M.; Del Puy, M.; Baquedano, P.; María, A.; Velasco, R.; Salvo, U.F.; Romero, L.T.; et al. Informe Del Comité Científico de La Agencia Española de Seguridad Alimentaria y Nutrición (AESAN) Sobre Recomendaciones Dietéticas Sostenibles y Recomendaciones de Actividad Física Para La Población Española. Rev. Com. Científico AESAN 2022, 36, 11–71. [Google Scholar]
- Willett, W.; Rockström, J.; Loken, B.; Springmann, M.; Lang, T.; Vermeulen, S.; Garnett, T.; Tilman, D.; DeClerck, F.; Wood, A.; et al. Food in the Anthropocene: The EAT–Lancet Commission on Healthy Diets from Sustainable Food Systems. Lancet 2019, 393, 447–492. [Google Scholar] [CrossRef]
- Loo, Y.T.; Howell, K.; Chan, M.; Zhang, P.; Ng, K. Modulation of the Human Gut Microbiota by Phenolics and Phenolic Fiber-Rich Foods. Compr. Rev. Food Sci. Food Saf. 2020, 19, 1268–1298. [Google Scholar] [CrossRef] [PubMed]
- Fritsch, J.; Garces, L.; Quintero, M.A.; Pignac-Kobinger, J.; Santander, A.M.; Fernández, I.; Ban, Y.J.; Kwon, D.; Phillips, M.C.; Knight, K.; et al. Low-Fat, High-Fiber Diet Reduces Markers of Inflammation and Dysbiosis and Improves Quality of Life in Patients with Ulcerative Colitis. Clin. Gastroenterol. Hepatol. 2021, 19, 1189–1199. [Google Scholar] [CrossRef] [PubMed]
- Neyrinck, A.M.; Nazare, J.A.; Rodriguez, J.; Jottard, R.; Dib, S.; Sothier, M.; Van Den Berghe, L.; Alligier, M.; Alexiou, H.; Maquet, V.; et al. Development of a Repertoire and a Food Frequency Questionnaire for Estimating Dietary Fiber Intake Considering Prebiotics: Input from the FiberTAG Project. Nutrients 2020, 12, 2824. [Google Scholar] [CrossRef]
- Gwiazdowska, D.; Juś, K.; Jasnowska-Małecka, J.; Kluczyńska, K. The Impact of Polyphenols on Bifidobacterium Growth. Acta Biochim. Pol. 2015, 62, 895–901. [Google Scholar] [CrossRef]
- Ruiz-Saavedra, S.; González del-Rey, C.; Suárez, A.; Díaz, Y.; Zapico, A.; Arboleya, S.; Salazar, N.; Gueimonde, M.; de los Reyes-Gavilán, C.; González, S. Associations of dietary factors and xenobiotics intake with faecal microbiota composition according to the presence of intenstinal mucosa damage. Food Funct. 2023. submitted. [Google Scholar]
- Lassale, C.; Batty, G.D.; Baghdadli, A.; Jacka, F.; Sánchez-Villegas, A.; Kivimäki, M.; Akbaraly, T. Healthy Dietary Indices and Risk of Depressive Outcomes: A Systematic Review and Meta-Analysis of Observational Studies. Mol. Psychiatry 2019, 24, 965–986. [Google Scholar] [CrossRef]
- Madani, S.; Ahmadi, A.; Shoaei-Jouneghani, F.; Moazen, M.; Sasani, N. The Relationship between the Mediterranean Diet and Axis I Disorders: A Systematic Review of Observational Studies. Food Sci. Nutr. 2022, 10, 3241–3258. [Google Scholar] [CrossRef]
- Psaltopoulou, T.; Sergentanis, T.N.; Panagiotakos, D.B.; Sergentanis, I.N.; Kosti, R.; Scarmeas, N. Mediterranean Diet, Stroke, Cognitive Impairment, and Depression: A Meta-Analysis. Ann. Neurol. 2013, 74, 580–591. [Google Scholar] [CrossRef] [PubMed]
- Riera-Sampol, A.; Bennasar-Veny, M.; Tauler, P.; Nafría, M.; Colom, M.; Aguilo, A. Association between Depression, Lifestyles, Sleep Quality and Sense of Coherence in a Population with Cardiovascular Risk. Nutrients 2021, 13, 585. [Google Scholar] [CrossRef]
- Lang, U.E.; Beglinger, C.; Schweinfurth, N.; Walter, M.; Borgwardt, S. Nutritional Aspects of Depression. Cell. Physiol. Biochem. 2015, 37, 1029–1043. [Google Scholar] [CrossRef]
- McGuinness, A.J.; Davis, J.A.; Dawson, S.L.; Loughman, A.; Collier, F.; O’Hely, M.; Simpson, C.A.; Green, J.; Marx, W.; Hair, C.; et al. A Systematic Review of Gut Microbiota Composition in Observational Studies of Major Depressive Disorder, Bipolar Disorder and Schizophrenia. Mol. Psychiatry 2022, 27, 1920–1935. [Google Scholar] [CrossRef] [PubMed]
- Mennella, J.A.; Finkbeiner, S.; Lipchock, S.V.; Hwang, L.D.; Reed, D.R. Preferences for Salty and Sweet Tastes Are Elevated and Related to Each Other during Childhood. PLoS ONE 2014, 9, e92201. [Google Scholar] [CrossRef] [PubMed]
- Petty, S.; Salame, C.; Mennella, J.A.; Pepino, M.Y. Relationship between Sucrose Taste Detection Thresholds and Preferences in Children, Adolescents, and Adults. Nutrients 2020, 12, 1918. [Google Scholar] [CrossRef] [PubMed]
- Jaime-Lara, R.B.; Franks, A.T.; Agarwal, K.; Nawal, N.; Courville, A.B.; Guo, J.; Yang, S.; Brooks, B.E.; Roy, A.; Taylor, K.; et al. No Significant Salt or Sweet Taste Preference or Sensitivity Differences Following Ad Libitum Consumption of Ultra-Processed and Unprocessed Diets: A Randomized Controlled Pilot Study. Chem. Senses 2023, 48, 1–16. [Google Scholar] [CrossRef] [PubMed]
- Cox, D.N.; Hendrie, G.A.; Carty, D. Sensitivity, Hedonics and Preferences for Basic Tastes and Fat amongst Adults and Children of Differing Weight Status: A Comprehensive Review. Food Qual. Prefer. 2016, 48, 359–367. [Google Scholar] [CrossRef]
- Hoppu, U.; Hopia, A.; Pohjanheimo, T.; Rotola-Pukkila, M.; Mäkinen, S.; Pihlanto, A.; Sandell, M. Effect of Salt Reduction on Consumer Acceptance and Sensory Quality of Food. Foods 2017, 6, 103. [Google Scholar] [CrossRef] [PubMed]
- Kourouniotis, S.; Keast, R.S.J.; Riddell, L.J.; Lacy, K.; Thorpe, M.G.; Cicerale, S. The Importance of Taste on Dietary Choice, Behaviour and Intake in a Group of Young Adults. Appetite 2016, 103, 1–7. [Google Scholar] [CrossRef]
- Mameli, C.; Cattaneo, C.; Panelli, S.; Comandatore, F.; Sangiorgio, A.; Bedogni, G.; Bandi, C.; Zuccotti, G.; Pagliarini, E. Taste Perception and Oral Microbiota Are Associated with Obesity in Children and Adolescents. PLoS ONE 2019, 14, e0221656. [Google Scholar] [CrossRef]
- Mojet, J.; Christ-Hazelhof, E.; Heidema, J. Taste Perception with Age: Generic or Specific Losses in Threshold Sensitivity to the Five Basic Tastes? Chem. Senses 2001, 26, 845–860. [Google Scholar] [CrossRef]
- Pepino, M.Y.; Finkbeiner, S.; Beauchamp, G.K.; Mennella, J.A. Obese Women Have Lower Monosodium Glutamate Taste Sensitivity and Prefer Higher Concentrations than Do Normal-Weight Women. Obesity 2010, 18, 959–965. [Google Scholar] [CrossRef]
- Puputti, S.; Aisala, H.; Hoppu, U.; Sandell, M. Factors Explaining Individual Differences in Taste Sensitivity and Taste Modality Recognition among Finnish Adults. J. Sens. Stud. 2019, 34, e12506–e12517. [Google Scholar] [CrossRef]


| Total Sample n = 17 | |
|---|---|
| Age (years) | 41 (34–50) |
| Gender | |
| Female | 14 (82) |
| Educational level | |
| Primary | 4 (24) |
| Secondary | 4 (24) |
| Technical | 7 (41) |
| University | 2 (12) |
| Family size(n) | |
| 1–2 | 6 (35) |
| 3–4 | 9 (53) |
| ≥5 | 2 (12) |
| Lifestyle | |
| Sleep (hours/day) | 6 (5–7) |
| Physical activity (walking min/day) | 60 (21–90) |
| IPAQ classification | |
| Low/inactive | 3 (18) |
| Moderate | 8 (47) |
| Vigorous | 6 (35) |
| Total METs | 2010 (1315–2772) |
| Smoking status | |
| Current smoker | 4 (24) |
| Former smoker | 2 (12) |
| Never smoker | 11 (65) |
| Occasional alcohol consumption (a) | 6 (35) |
| Chronic conditions | |
| Respiratory diseases | 9 (53) |
| LC n = 11 | HC n = 6 | |||
|---|---|---|---|---|
| T0 | T1 | T0 | T1 | |
| Energy (Kcal/day) | 1471.98 (999.59–1641.27) | 1437.07 (1197.17–1576.69) | 1524.55 (1262.86–1849.45) | 1376.52 (1123.48–1621.64) |
| Food groups intake (g/day) | ||||
| Cereals and cereals products | 123.30 (58.33–148.07) | 119.97 (94.44–146.20) | 117.87 (113.29–174.66) | 56.73 (41.20–92.75) * † |
| Whole grain cereals | 0.00 (0.00–0.00) | 10.00 (0.00–23.33) | 0.00 (0.00–32.50) | 4.33 (0.00–30.00) |
| Milk and dairy products | 293.53 (148.23–451.66) | 245.90 (179.33–530.68) | 123.67 (31.67–187.50) | 116.48 (84.17–204.73) † |
| Meat and meat products | 110.00 (93.99–172.48) | 94.83 (69.17–175.16) | 156.58 (108.83–206.13) | 102.98 (76.67–156.83) |
| White meat | 53.58 (33.30–107.95) | 55.33 (5.58–108.91) | 53.58 (53.33–80.09) | 79.02 (0.00–108.91) |
| Red meat | 27.08 (5.90–63.33) | 31.25 (0.00–50.00) | 38.96 (5.90–110.16) | 43.96 (0.00–47.92) |
| Proccesed meat | 13.33 (0.00–31.33) | 23.75 (13.33–40.00) | 11.67 (6.67–23.33) | 0.00 (0.00–0.00) * † |
| Eggs | 53.33 (21.33–69.93) | 42.67 (26.67–76.00) | 58.30 (45.43–72.00) | 34.28 (20.67–42.67) |
| Fish | 21.67 (0.00–33.75) | 59.67 (43.33–84.00) | 27.97 (0.00–75.00) | 61.25 (13.33–94.62) |
| Seafood | 0.00 (0.00–29.00) | 0.00 (0.00–0.00) | 0.00 (0.00–0.00) | 0.00 (0.00–26.66) |
| Oils and fats | 14.09 (10.50–23.99) | 15.53 (11.14–19.11) | 21.00 (12.33–25.57) | 24.01 (17.00–25.28) |
| Vegetables | 67.71 (34.73–190.00) | 98.80 (56.83–111.73) | 144.48 (43.37–207.33) | 251.35 (169.67–357.00) * † |
| Legumes | 11.67 (0.00–33.33) | 12.77 (0.00–46.67) | 16.94 (7.77–150.00) | 35.00 (0.00–200.00) |
| Potatoes and tubers | 46.14 (8.33–88.83) | 62.86 (33.33–123.00) | 37.97 (23.00–59.00) | 79.42 (24.60–101.00) |
| Fruits | 96.17 (62.50–170.35) | 139.35 (42.34–164.58) | 151.00 (39.60–336.40) | 262.08 (114.76–383.94) |
| Nuts and seeds | 0.00 (0.00–0.00) | 0.00 (0.00–0.00) | 5.00 (0.00–16.67) | 8.34 (0.00–16.67) † |
| Sugar and sweets | 10.00 (0.00–20.80) | 11.67 (4.17–18.67) | 11.42 (7.00–64.59) | 4.67 (0.00–14.00) |
| Snacks | 0.00 (0.00–0.00) | 0.00 (0.00–0.00) | 0.00 (0.00–0.00) | 0.00 (0.00–11.67) † |
| Sauces and condiments | 18.50 (1.70–24.30) | 13.83 (2.75–20.46) | 21.37 (5.37–31.13) | 10.14 (1.67–21.26) |
| Other foods | 0.00 (0.00–125.00) | 0.00 (0.00–75.00) | 5.00 (0.00–83.33) | 15.00 (0.00–40.00) |
| Non alcoholic beverages (a) | 268.33 (126.67–333.33) | 250.00 (183.33–517.67) | 345.84 (187.50–403.33) | 225.00 (66.67–366.67) |
| Soft drinks (a) | 0.00 (0.00–0.00) | 0.00 (0.00–83.33) | 0.00 (0.00–166.67) | 0.00 (0.00–83.33) |
| Alcoholic beverages (a) | 0.00 (0.00–0.00) | 0.00 (0.00–33.33) | 0.00 (0.00–0.00) | 0.00 (0.00–0.00) |
| Bioactive Compounds | LC n = 11 | HC n = 6 | ||
|---|---|---|---|---|
| T0 | T1 | T0 | T1 | |
| Total dietary fiber | 9.06 (6.77–14.45) | 11.37 (9.01–15.73) | 13.70 (12.44–15.06) | 15.25 (12.37–19.66) |
| Soluble dietary fiber | 1.34 (0.80–1.78) | 1.25 (1.01–1.90) | 2.00 (1.44–2.29) | 1.51 (1.25–2.94) |
| Insoluble dietary fiber | 5.04 (3.72–8.09) | 5.85 (4.30–7.63) | 9.25 (7.11–11.97) † | 7.40 (5.64–12.78) |
| Starch | 17.46 (9.07–35.87) | 9.70 (7.44–18.85) | 35.19 (10.07–49.84) | 1.83 (0.11–14.04) * |
| Celulose | 1.92 (1.66–3.31) | 2.25 (1.70–3.30) | 3.19 (2.31–3.80) † | 2.93 (2.36–4.30) |
| Klason lignine | 0.87 (0.43–1.18) | 0.83 (0.73–1.21) | 1.47 (1.27–2.04) † | 1.15 (0.74–1.54) |
| Hemicellulose | ||||
| Soluble hemicellulose | 1.05 (0.47–1.26) | 0.85 (0.65–1.31) | 1.27 (1.09–1.53) † | 0.62 (0.60–1.60) |
| Insoluble hemicellulose | 1.63 (1.18–2.71) | 1.87 (1.47–2.40) | 2.89 (2.51–3.63) | 2.09 (1.88–4.32) |
| Pectin | ||||
| Soluble pectin | 0.36 (0.26–0.47) | 0.50 (0.30–0.57) | 0.56 (0.32–0.65) | 0.79 (0.45–1.23) |
| Insoluble pectin | 0.61 (0.39–0.94) | 0.74 (0.44–0.92) | 1.05 (0.59–1.28) | 1.26 (1.05–1.72) |
| Total (poly)phenols | 346.16 (206.13–1208.90) | 907.60 (552.78–1082.57) | 869.88 (738.35–1211.61) | 841.02 (795.02–913.25) |
| Flavonoids | 14.70 (6.30–117.65) | 61.82 (45.13–110.77) | 105.13 (16.54–183.03) | 57.23 (18.16–142.95) |
| Phenolic acids | 186.24 (80.77–361.26) | 271.21 (177.11–573.50) | 589.79 (226.37–888.03) | 324.55 (272.85–643.02) |
| Lignans | 13.33 (4.32–27.69) | 8.45 (4.79–16.00) | 9.51 (8.73–14.92) | 31.96 (18.06–51.23) * † |
| Other (poly)phenols | 7.48 (2.12–16.29) | 7.52 (6.05–11.87) | 12.49 (9.79–22.45) | 9.93 (6.85–36.28) |
| Stilbenes | 0.00 (0.00–0.03) | 0.01 (0.00–0.07) | 0.01 (0.00–0.02) | 0.00 (0.00–0.02) |
| Xenobiotics | LC n = 11 | HC n = 6 | ||
|---|---|---|---|---|
| T0 | T1 | T0 | T1 | |
| Heterocyclic amines (ng/day) | ||||
| IQ | 0.00 (0.00–0.00) | 0.00 (0.00–0.00) | 0.00 (0.00–0.00) | 0.00 (0.00–0.00) |
| MeIQ | 0.00 (0.00–0.00) | 0.00 (0.00–0.00) | 0.00 (0.00–0.00) | 0.00 (0.00–6.84) |
| MeIQx | 47.91 (0.00–65.45) | 81.47 (10.66–112.83) | 36.73 (7.08–154.13) | 54.63 (8.00–84.08) |
| DiMeIQx | 2.33 (0.00–23.35) | 33.20 (0.00–66.40) | 1.18 (0.00–70.46) | 25.00 (16.00–37.99) |
| PhlP | 7.00 (0.00–298.97) | 580.97 (10.94–1162.04) | 66.50 (0.00–1743.00) | 397.55 (4.00–603.31) |
| Polycyclic aromatic hydrocarbons (ng/day) | ||||
| B(a)P | 36.30 (21.80–50.40) | 46.10 (24.40–63.80) | 52.20 (33.20–68.90) | 36.40 (35.20–41.40) |
| DiB(a)A | 3.20 (2.00–5.10) | 4.30 (2.00–6.60) | 4.30 (2.50–22.60) | 2.40 (1.20–3.50) * |
| Total PAHs | 616.10 (266.10–1190.70) | 623.50 (368.60–1092.80) | 1108.20 (660.70–1347.00) | 372.80 (134.80–727.80) * |
| Nitrates. nitrites and nitroso compounds (ng/day) | ||||
| Nitrates (mg/day) | 30.62 (17.77–48.18) | 67.45 (24.00–100.83) * | 100.77 (27.73–119.99) | 153.26 (126.99–182.58) * † |
| Nitrites (mg/day) | 0.63 (0.31–1.06) | 1.24 (0.65–1.81) | 0.65 (0.43–0.78) | 0.36 (0.30–0.83) † |
| NDMA | 34.70 (3.20–85.30) | 86.70 (44.20–112.70) | 24.90 (19.80–34.70) | 0.00 (0.00–90.50) |
| NPIP | 25.30 (0.00–45.50) | 36.10 (24.00–63.30) | 15.80 (8.00–25.30) | 0.00 (0.00–0.00) * † |
| NPYR | 45.30 (0.00–68.00) | 64.60 (29.00–105.30) | 28.30 (11.50–45.30) | 0.00 (0.00–0.00) † |
| Comb | 0.00 (0.00–0.00) | 0.00 (0.00–4.70) | 0.70 (0.00–1.90) | 0.00 (0.00–0.00) |
| Acrylamide (µg/day) | 8.73 (6.44–11.62) | 12.24 (7.70–20.21) | 8.44 (7.22–10.44) | 2.83 (1.51-6.13) * † |
| LC | HC | |||
|---|---|---|---|---|
| Improved BDI-II Score n = 7 | No Improvement of BDI-II Score n = 4 | Improved BDI-II Score n = 5 | No Improvement of BDI-II Score n = 1 | |
| Energy (kcal/day) | 1437.07 (1977.06–1250.26) | 1317.42 (1467.85–1196.86) | 1255.91 (1497.14–1123.48) | 2101.11 (2101.11–2101.11) |
| Food groups intake (g/day) | ||||
| Oils and fats | 17.00 (15.53–21.16) | 11.46 (6.41–13.01) * | 24.15 (17.00–25.28) | 23.86 (23.86–23.86) |
| Olive oil | 13.33 (11.00–17.00) | 6.89 (4.06–9.83) | 16.33 (11.00–17.48) | 15.45 (15.45–15.45) |
| Cereals and cereals products | 119.97 (94.44–147.27) | 117.06 (67.89–139.27) | 46.27 (41.20–67.19) | 136.44 (136.44–136.44) |
| Whole grain cereals | 10.00 (0.00–24.17) | 12.27 (4.44–19.50) | 0.00 (0.00–30.00) | 8.67 (8.67–8.67) |
| Milk and dairy products | 398.34 (215.00–545.84) | 176.75 (137.84–355.01) | 99.63 (84.17–133.33) | 204.73 (204.73–204.73) |
| Meat and meat products | 94.83 (69.17–175.16) | 125.87 (60.53–194.29) | 128.2 (77.76–156.83) | 0.00 (0.00–0.00) |
| White meat | 55.33 (5.58–69.17) | 82.12 (26.79–127.42) | 80.28 (77.76–108.91) | 0.00 (0.00–0.00) |
| Red meat | 31.25 (0.00–58.33) | 33.33 (13.33–45.00) | 47.92 (40.00–47.92) | 0.00 (0.00–0.00) |
| Proccesed meat | 33.33 (10.00–41.33) | 21.88 (16.67–25.63) | 0.00 (0.00–0.00) | 0.00 (0.00–0.00) |
| Eggs | 64.00 (32.00–84.67) | 34.67 (13.34–46.84) | 25.88 (20.67–42.67) | 106.00 (106.00–106.00) |
| Fish | 45.83 (3.00–107.33) | 59.67 (53.62–71.84) | 90.00 (32.50–94.62) | 13.33 (13.33–13.33) |
| Seafood | 0.00 (0.00–19.33) | 0.00 (0.00–0.00) | 0.00 (0.00–0.00) | 26.66 (26.66–26.66) |
| Vegetables | 90.11 (48.83–107.67) | 105.27 (77.82–112.70) | 193.00 (169.67–309.70) | 372.27 (372.27–372.27) |
| Legumes | 12.77 (0.00–53.00) | 11.67 (0.00–35.00) | 23.33 (0.00–46.67) | 200.00 (200.00–200.00) |
| Potatoes and tubers | 95.67 (47.83–150.67) | 25.00 (16.52–64.19) * | 66.67 (24.60–92.17) | 241.00 (241.00–241.00) |
| Fruits | 118.68 (42.34–164.58) | 144.68 (69.68–168.9) | 372.20 (114.76–383.94) | 151.96 (151.96–151.96) |
| Nuts and seeds | 0.00 (0.00–0.00) | 0.00 (0.00–0.00) | 16.67 (0.00–16.67) | 0.00 (0.00–0.00) |
| Sugar and sweets | 11.67 (4.17–18.67) | 7.00 (0.00–19.50) | 9.33 (0.00–14.00) | 0.00 (0.00–0.00) |
| Snacks | 0.00 (0.00–0.00) | 0.00 (0.00–0.00) | 0.00 (0.00–0.00) | 21.67 (21.67–21.67) |
| Sauces and condiments | 13.83 (0.67–17.33) | 22.28 (6.96–56.22) | 5.10 (1.67–15.17) | 27.56 (27.56–27.56) |
| Other foods | 0.00 (0.00–83.33) | 0.00 (0.00–37.50) | 30.00 (0.00–40.00) | 0.00 (0.00–0.00) |
| Non alcoholic beverages (mL/day) | 250.00 (183.33–517.67) | 276.67 (135.00–462.50) | 200.00 (66.67–250.00) | 366.67 (366.67–366.67) |
| Soft drinks (mL/day) | 0.00 (0.00–0.00) | 41.67 (0.00–151.67) | 0.00 (0.00–0.00) | 316.67 (316.67–316.67) |
| Alcoholic beverages (mL/day) | 0.00 (0.00–66.67) | 2.00 (0.00–18.67) | 0.00 (0.00–0.00) | 0.00 (0.00–0.00) |
Disclaimer/Publisher’s Note: The statements, opinions and data contained in all publications are solely those of the individual author(s) and contributor(s) and not of MDPI and/or the editor(s). MDPI and/or the editor(s) disclaim responsibility for any injury to people or property resulting from any ideas, methods, instructions or products referred to in the content. |
© 2023 by the authors. Licensee MDPI, Basel, Switzerland. This article is an open access article distributed under the terms and conditions of the Creative Commons Attribution (CC BY) license (https://creativecommons.org/licenses/by/4.0/).
Share and Cite
Zapico, A.; Arboleya, S.; Salazar, N.; Perillán, C.; Ruiz-Saavedra, S.; de los Reyes-Gavilán, C.G.; Gueimonde, M.; González, S. Impact on Fecal Microbiota and Health-Related Markers of an Intervention Focused on Improving Eating Behavior in People at Risk of Food Insecurity. Nutrients 2023, 15, 3537. https://doi.org/10.3390/nu15163537
Zapico A, Arboleya S, Salazar N, Perillán C, Ruiz-Saavedra S, de los Reyes-Gavilán CG, Gueimonde M, González S. Impact on Fecal Microbiota and Health-Related Markers of an Intervention Focused on Improving Eating Behavior in People at Risk of Food Insecurity. Nutrients. 2023; 15(16):3537. https://doi.org/10.3390/nu15163537
Chicago/Turabian StyleZapico, Aida, Silvia Arboleya, Nuria Salazar, Carmen Perillán, Sergio Ruiz-Saavedra, Clara G. de los Reyes-Gavilán, Miguel Gueimonde, and Sonia González. 2023. "Impact on Fecal Microbiota and Health-Related Markers of an Intervention Focused on Improving Eating Behavior in People at Risk of Food Insecurity" Nutrients 15, no. 16: 3537. https://doi.org/10.3390/nu15163537
APA StyleZapico, A., Arboleya, S., Salazar, N., Perillán, C., Ruiz-Saavedra, S., de los Reyes-Gavilán, C. G., Gueimonde, M., & González, S. (2023). Impact on Fecal Microbiota and Health-Related Markers of an Intervention Focused on Improving Eating Behavior in People at Risk of Food Insecurity. Nutrients, 15(16), 3537. https://doi.org/10.3390/nu15163537