

Changes in Food Consumption in Postmenopausal Women during the COVID-19 Pandemic: A Longitudinal Study
 , , ,
, , ,  ,
, 
Abstract
:1. Introduction
2. Materials and Methods
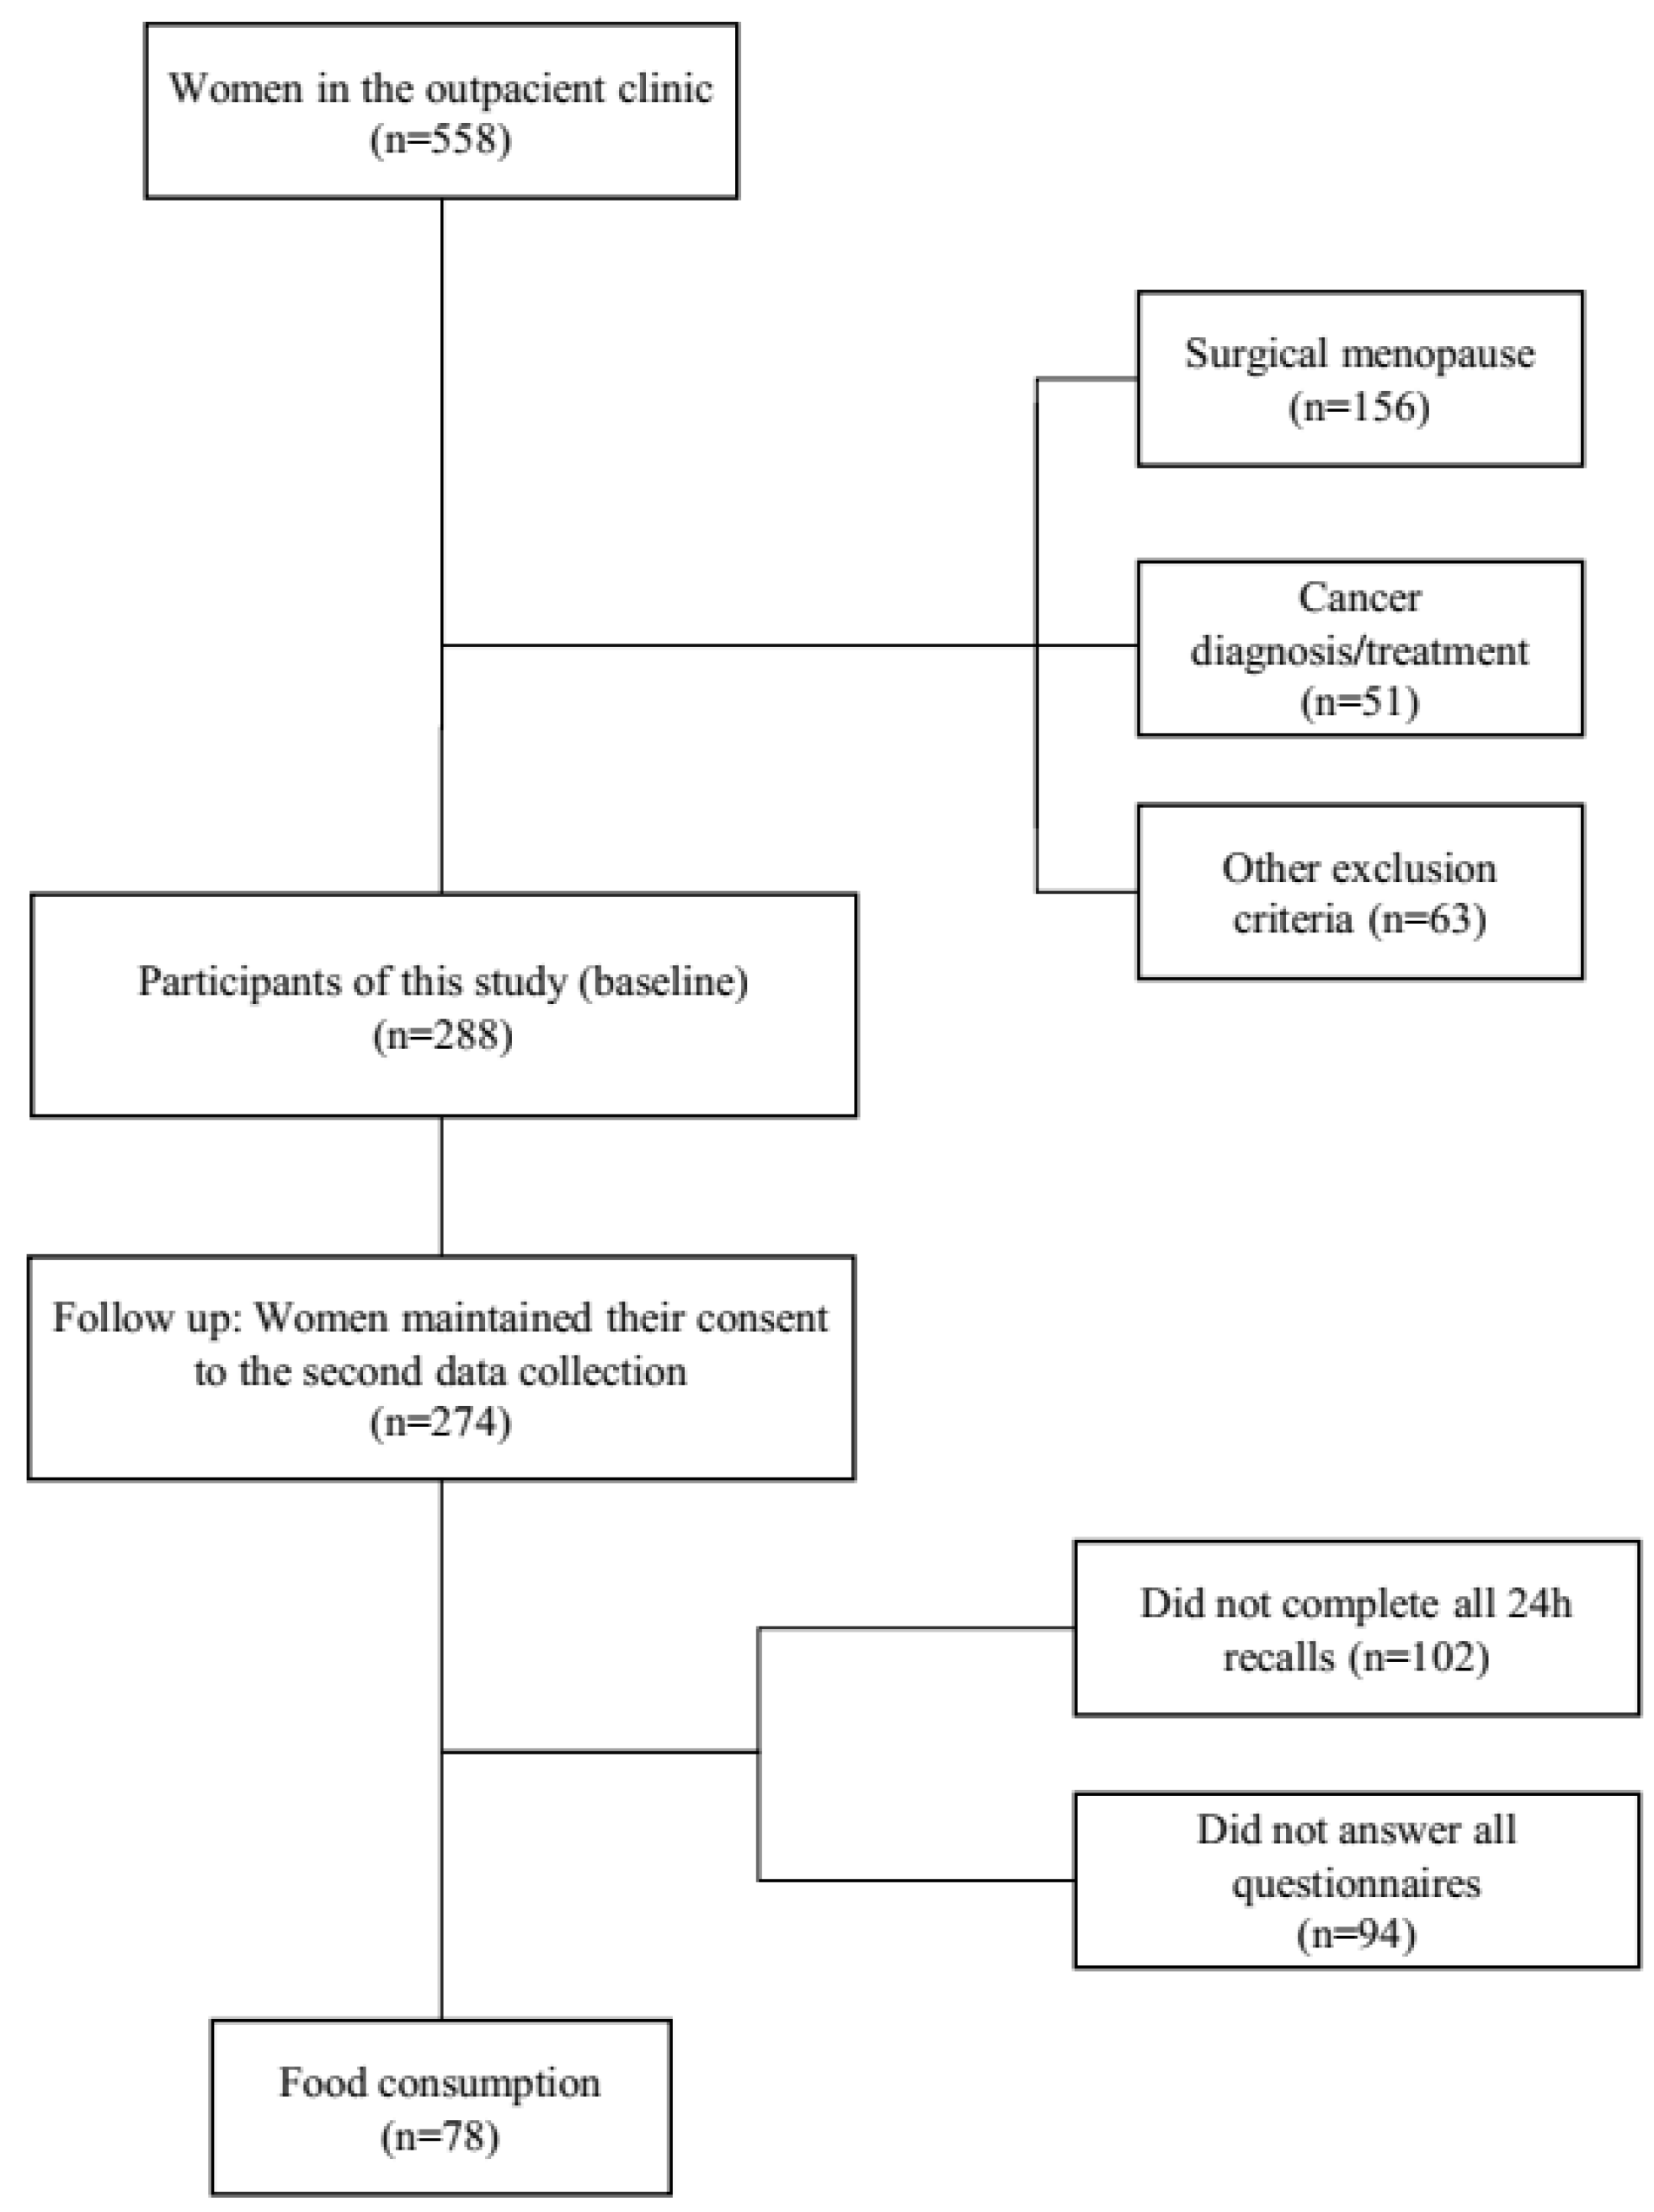
2.1. Population and Sample
2.2. Ethical Aspects
2.3. Data Collection and Measurement
2.4. Follow-Up
2.5. Data Analysis
3. Results
4. Discussion
5. Conclusions
Author Contributions
Funding
Institutional Review Board Statement
Informed Consent Statement
Data Availability Statement
Acknowledgments
Conflicts of Interest
References
- World Health Organization. WHO Coronavirus (COVID-19) Dashboard. World Health Organization 2023. Available online: https://covid19.who.int/ (accessed on 5 May 2023).
- Velavan, T.P.; Meyer, C.G. The COVID-19 epidemic. Trop. Med. Int. Health 2020, 25, 278–280. [Google Scholar] [CrossRef] [PubMed] [Green Version]
- Izzo, L.; Santonastaso, A.; Cotticelli, G.; Federico, A.; Pacifico, S.; Castaldo, L.; Colao, A.; Ritieni, A. An Italian survey on dietary habits and changes during the COVID-19 lockdown. Nutrients 2021, 13, 1197. [Google Scholar] [CrossRef] [PubMed]
- Greenhalgh, T.; Koh, G.C.H.; Car, J.; Choon, G.; Koh, H. Covid-19: A remote assessment in primary care. BMJ 2020, 368, m1182. [Google Scholar] [CrossRef] [PubMed] [Green Version]
- Wu, T.; Jia, X.; Shi, H.; Niu, J.; Yin, X.; Xie, J.; Wang, X. Prevalence of mental health problems during the COVID-19 pandemic: A systematic review and meta-analysis. J. Affect. Disord. 2021, 281, 91–98. [Google Scholar] [CrossRef] [PubMed]
- Lee, Y.; Lui, L.M.W.; Chen-Li, D.; Liao, Y.; Mansur, R.B.; Brietzke, E.; Rosenblat, J.D.; Ho, R.; Rodrigues, N.R.; Lipsitz, O.; et al. Government response moderates the mental health impact of COVID-19: A systematic review and meta-analysis of depression outcomes across countries. J. Affect. Disord. 2021, 290, 364–377. [Google Scholar] [CrossRef] [PubMed]
- Ak Sözer, G.; Güdül Öz, H.; Yangın, H. Relationship between menopausal symptoms and perceived stress during the COVID-19 pandemic. J. Women Aging 2022, 34, 675–686. [Google Scholar] [CrossRef]
- VoPham, T.; Harris, H.R.; Tinker, L.F.; Manson, J.E.; Meliker, J.R.; Wassertheil-Smoller, S.; Shadyab, A.H.; Saquib, N.; Anderson, G.L.; Shumaker, S.A. The Impact of the COVID-19 Pandemic on Older Women in the Women’s Health Initiative. J. Gerontol. Ser. A 2022, 77, S3–S12. [Google Scholar] [CrossRef]
- Damayanthi, H.D.W.T.; Prabani, K.I.P. Nutritional determinants and COVID-19 outcomes of older patients with COVID-19: A systematic review. Arch Gerontol. Geriatr. 2021, 95, 104411. [Google Scholar] [CrossRef]
- Butler, M.J.; Barrientos, R.M. The impact of nutrition on COVID-19 susceptibility and long-term consequences. Brain Behav. Immun. 2020, 87, 53–54. [Google Scholar] [CrossRef]
- Wong, E.; Franceschini, N.; Tinker, L.F.; Wise Thomas, S.; Manson, J.E.; Saquib, N.; Liu, S.; Vitolins, M.; Mouton, C.P.; Pettinger, M.; et al. Continuity of Care among Postmenopausal Women with Cardiometabolic Diseases in the United States Early during the COVID-19 Pandemic: Findings from the Women’s Health Initiative. J. Gerontol. Ser. A 2022, 77, S13–S21. [Google Scholar] [CrossRef]
- Wang, X.W.; Hu, H.; Xu, Z.Y.; Zhang, G.K.; Yu, Q.H.; Yang, H.L.; Zheng, J.-H. Association of menopausal status with COVID-19 outcomes: A propensity score matching analysis. Biol. Sex Differ. 2021, 12, 16. [Google Scholar] [CrossRef] [PubMed]
- Soares-Júnior, J.M.; Sorpreso, I.C.E.; Motta, E.V.; Utiyama, E.M.; Baracat, E.C. Gynecology and women’s health care during the COVID-19 pandemic: Patient safety in surgery and prevention. Clinics 2020, 75, e2063. [Google Scholar] [CrossRef] [PubMed]
- Kodoth, V.; Scaccia, S.; Aggarwal, B. Adverse Changes in Body Composition During the Menopausal Transition and Relation to Cardiovascular Risk: A Contemporary Review. Women’s Health Rep. 2022, 3, 573–581. [Google Scholar] [CrossRef]
- Poirier, N.; Legare, F.; Stacey, D.; Lemieux, S.; Begin, C.; Lapointe, A.; Desroches, S. Postmenopausal women with abdominal obesity choosing a nutritional approach for weight loss: A decisional needs assessment. Maturitas 2016, 94, 58–63. [Google Scholar] [CrossRef] [PubMed]
- Monteleone, P.; Mascagni, G.; Giannini, A.; Genazzani, A.R.; Simoncini, T. Symptoms of menopause—Global prevalence, physiology and implications. Nat. Rev. Endocrinol. 2018, 14, 199–215. [Google Scholar] [CrossRef]
- Stute, P.; Ceausu, I.; Depypere, H.; Lambrinoudaki, I.; Mueck, A.; Pérez-López, F.R.; Schouw, Y.V.D.; Senturk, L.M.; Simoncini, T.; Stevenson, J.C.; et al. A model of care for healthy menopause and ageing: EMAS position statement. Maturitas 2016, 92, 1–6. [Google Scholar] [CrossRef] [Green Version]
- Van Dijk, G.M.; Kavousi, M.; Troup, J.; Franco, O.H. Health issues for menopausal women: The top 11 conditions have common solutions. Maturitas 2015, 80, 24–30. [Google Scholar] [CrossRef]
- Hernández-Angeles, C.; Castelo-Branco, C.; Hernandez-Angeles, C.; Castelo-Branco, C.; Hernández-Angeles, C.; Castelo-Branco, C. Cardiovascular risk in climacteric women: Focus on diet. Climacteric 2016, 7137, 215–221. [Google Scholar] [CrossRef]
- Noll, P.R.e.S.; Noll, M.; Zangirolami-Raimundo, J.; Baracat, E.C.; da Louzada, M.L.C.; Soares Júnior, J.M.; Sorpreso, I.C.E. Life habits of postmenopausal women: Association of menopause symptom intensity and food consumption by degree of food processing. Maturitas 2022, 156, 1–11. [Google Scholar] [CrossRef]
- Sorpreso, I.C.E.E.; Vieira, L.H.L.L.; Haidar, M.A.; Nunes, M.G.; Baracat, E.C.; Soares Junior, J.M. Multidisciplinary approach during menopausal transition and postmenopause in Brazilian women. Clin. Exp. Obstet. Gynecol. 2010, 37, 283–286. [Google Scholar]
- Noll, P.R.E.S.; Campos, C.A.S.; Leone, C.; Zangirolami-Raimundo, J.; Noll, M.; Baracat, E.C.; Soares Junior, J.M.; Sorpreso, I.C.E. Dietary intake and menopausal symptoms in postmenopausal women: A systematic review. Climacteric 2021, 24, 128–138. [Google Scholar] [CrossRef]
- Bonaccio, M.; Costanzo, S.; Ruggiero, E.; Persichillo, M.; Esposito, S.; Olivieri, M.; Castelnuovo, A.D.; Cerletti, C.; Donati, M.B.; Gaetano, G.; et al. Changes in ultra-processed food consumption during the first Italian lockdown following the COVID-19 pandemic and major correlates: Results from two population-based cohorts. Public. Health Nutr. 2021, 24, 3905–3915. [Google Scholar] [CrossRef] [PubMed]
- Steele, E.M.; Rauber, F.; Costa, C.D.S.; Leite, M.A.; Gabe, K.T.; Louzada, M.L.d.C.; Levy, R.B.; Monteiro, C.A. Dietary changes in the NutriNet Brasil cohort during the covid-19 pandemic. Rev. Saude Publica 2020, 54, 91. [Google Scholar] [CrossRef] [PubMed]
- Mendes, L.L.; Canella, D.S.; Araújo ML de Jardim, M.Z.; de Cardoso, L.O.; Pessoa, M.C. Food environments and the COVID-19 pandemic in Brazil: Analysis of changes observed in 2020. Public Health Nutr. 2021, 25, 32–35. [Google Scholar] [CrossRef] [PubMed]
- Cuevas, A.; Barquera, S. COVID-19, Obesity, and Undernutrition: A Major Challenge for Latin American Countries. Obesity 2020, 28, 1791–1792. [Google Scholar] [CrossRef] [PubMed]
- Reyes-Olavarría, D.; Latorre-Román, P.Á.; Guzmán-Guzmán, I.P.; Jerez-Mayorga, D.; Caamaño-Navarrete, F.; Delgado-Floody, P. Positive and Negative Changes in Food Habits, Physical Activity Patterns, and Weight Status during COVID-19 Confinement: Associated Factors in the Chilean Population. Int. J. Environ. Res. Public Health 2020, 17, 5431. [Google Scholar] [CrossRef] [PubMed]
- Bhutani, S.; Vandellen, M.R.; Cooper, J.A. Longitudinal weight gain and related risk behaviors during the covid-19 pandemic in adults in the us. Nutrients 2021, 13, 671. [Google Scholar] [CrossRef]
- Oliveira, T.C.; Abranches, M.V.; Lana, R.M. Food (in)security in Brazil in the context of the SARS-CoV-2 pandemic. Cad. Saude Publica 2020, 36, e00055220. [Google Scholar] [CrossRef] [Green Version]
- Harlow, S.D.; Gass, M.; Hall, J.E.; Lobo, R.; Maki, P.; Rebar, R.W.; Sherman, S.; Sluss, P.M.; De Villiers, T.J. Executive summary of the Stages of Reproductive Aging Workshop + 10: Addressing the unfinished agenda of staging reproductive aging. Menopause 2012, 19, 387–395. [Google Scholar] [CrossRef] [Green Version]
- Barnard, N.D.; Kahleova, H.; Holtz, D.N.; Del Aguila, F.; Neola, M.; Crosby, L.M.; Holubkov, R. The Women’s Study for the Alleviation of Vasomotor Symptoms (WAVS): A randomized, controlled trial of a plant-based diet and whole soybeans for postmenopausal women. Menopause 2021, 28, 1150–1156. [Google Scholar] [CrossRef]
- Barnard, N.D.; Kahleova, H.; Holtz, D.N.; Znayenko-Miller, T.; Sutton, M.; Holubkov, R.; Zhao, X.; Galandi, S.; Setchell, K.D.R. A dietary intervention for vasomotor symptoms of menopause: A randomized, controlled trial. Menopause 2023, 30, 80–87. [Google Scholar] [CrossRef] [PubMed]
- Heidari, Z.; Mohammadi, E.; Aghamohammadi, V.; Jalali, S.; Rezazadeh, A.; Sedaghat, F.; Assadi, M.; Rashidkhani, B. Dietary Approaches to Stop Hypertension (DASH) diets and breast cancer among women: A case control study. BMC Cancer 2020, 20, 708. [Google Scholar] [CrossRef]
- Vyas, A.; Rubenstein, L.; Robinson, J.; Seguin, R.A.; Vitolins, M.Z.; Kazlauskaite, R.; Shikany, J.M.; Johnson, K.C.; Snetselaar, L.; Wallace, R. Diet drink consumption and the risk of cardiovascular events: A report from the Women’s Health Initiative. J. Gen. Intern. Med. 2015, 30, 462–468. [Google Scholar] [CrossRef]
- World Health Organization (WHO). Guidelines: Sodium Intake for Adults and Children 2012; WHO: Geneva, Switzerland, 2012.
- World Health Organization. Physical Status: The Use and Interpretation of Anthropometry; WHO: Geneva, Switzerland, 1995; Volume 854.
- Lohman, T.; Roache, A.; Martorell, R. Anthropometric Standardization Reference Manual. Med. Sci. Sports Exerc. 1992, 24, 952. [Google Scholar] [CrossRef] [Green Version]
- World Health Organization (WHO). Waist Circumference and Waist–Hip Ratio: Report of a WHO Expert Consultation 2008; WHO: Geneva, Switzerland, 2008.
- Craig, C.L.; Marshall, A.L.; Sjostrom, M.; Bauman, A.E.; Booth, M.L.; Ainsworth, B.E.; Pratt, M.; Ekelund, U.; Yngve, A.; Sallis, J.F.; et al. International Physical Activity Questionnaire: 12-Country Reliability and Validity. Med. Sci. Sports Exerc. 2003, 35, 1381–1395. [Google Scholar] [CrossRef] [PubMed] [Green Version]
- Matsudo, S.; Araujo, T.; Matsudo, V.; Andrade, D.; Andrade, E.; Oliveira, L.C.; Braggion, G. Questionário Internacional de Atividade Física (IPAQ): Estudo de validade e reprodutibilidade no Brasil. Rev. Bras. Atividade Física Saúde 2001, 6, 5–18. [Google Scholar]
- Kupperman, H.S.; Blatt, M.H.G.; Wiesbader, H.; Filler, W. Comparative clinical evaluation of estrogenic preparations by the menopausal and amenorrheal indices. J. Clin. Endocrinol. Metab. 1953, 13, 688–703. [Google Scholar] [CrossRef]
- Hunter, M.S. The Women’s Health Questionnaire (WHQ): Frequently asked questions (FAQ). Health Qual. Life Outcomes 2003, 1, 41. [Google Scholar] [CrossRef] [Green Version]
- Conway, J.M.; Ingwersen, L.A.; Vinyard, B.T.; Moshfegh, A.J. Effectiveness of the US Department of Agriculture 5-step multiple-pass method in assessing food intake in obese and nonobese women. Am. J. Clin. Nutr. 2003, 77, 1171–1178. [Google Scholar] [CrossRef] [Green Version]
- Thompson, F.E.; Byers, T. Dietary assessment resource manual. J. Nutr. 1994, 124, 2245S–2317S. [Google Scholar]
- Willett, W.C. Nutrition Epidemiology; Oxford University Press: Oxford, UK, 1998. [Google Scholar]
- Goulet, J.; Provencher, V.; Piché, M.-E.; Lapointe, A.; Weisnagel, S.J.; Nadeau, A.; Bergeron, J.; Lemieux, S. Relationship between eating behaviours and food and drink consumption in healthy postmenopausal women in a real-life context. Br. J. Nutr. 2008, 100, 910–917. [Google Scholar] [CrossRef] [PubMed] [Green Version]
- Ibelli, P.M.E.; Martins, C.A.; Baraldi, L.G.; Monteiro, C.A. Recordatório Alimentar de 24 Horas Adaptado à Classificação “NOVA”: Aplicação de Forma Computadorizada via Entrevistas Telefônicas; Escavador: Salvador, Brazil, 2014; pp. 22–25. [Google Scholar]
- Instituto Brasileiro de Geografia e Estatística. Tabelas de Composição Nutricional dos Alimentos Consumidos No Brasil; IBGE: Rio de Janeiro, Brazil, 2011. [Google Scholar]
- Da Louzada, M.L.C.; Martins, A.P.B.; Canella, D.S.; Baraldi, L.G.; Levy, R.B.; Claro, R.M.; Moubarac, J.C.; Cannon, G.; Monteiro, C.A. Ultra-processed foods and the nutritional dietary profile in Brazil. Rev. Saude Publica 2015, 49, 38. [Google Scholar] [CrossRef]
- Monteiro, C.A.; Cannon, G.; Levy, R.; Moubarac, J.-C.; Jaime, P.; Martins, A.P.; Canella, D.; Louzada, M.; Parra, D. Food classification. Public health NOVA. The star shines bright. World Nutr. 2016, 7, 28–38. [Google Scholar]
- Assembleia Legislativa do Estado de São Paulo. Decreto No 64.881, de 22 de Março de 2020; Assembleia Legislativa do Estado de São Paulo: São Paulo, Brazil, 2020. [Google Scholar]
- Conselho Nacional de Secretários de Saúde. Coronavirus 2019-CoV Informações para a Gestão 2023; Conselho Nacional de Secretários de Saúde: Brasília, Brazil, 2023. [Google Scholar]
- Brasil. Coronavírus Brasil. Ministério Da Saúde 2023. Available online: https://covid.saude.gov.br/ (accessed on 1 March 2023).
- Barros, A.J.; Hirakata, V.N. Alternatives for logistic regression in cross-sectional studies: An empirical comparison of models that directly estimate the prevalence ratio. BMC Med. Res. Methodol. 2003, 3, 21. [Google Scholar] [CrossRef] [Green Version]
- Werneck, A.O.; da Silva, D.R.; Malta, D.C.; de Souza-Júnior, P.R.B.; Azevedo, L.O.; de Barros, M.B.A.; Szwarcwald, C.L. Lifestyle behaviors changes during the COVID-19 pandemic quarantine among 6,881 brazilian adults with depression and 35,143 without depression. Cien. Saude Colet. 2020, 25, 4151–4156. [Google Scholar] [CrossRef] [PubMed]
- Malta, D.C.; Szwarcwald, C.L.; de Barros, M.B.A.; Gomes, C.S.; Machado, Í.E.; de Souza Júnior, P.R.B.; Romero, D.E.; Lima, M.G.; Damacena, G.N.; Pina, M.F.; et al. The COVID-19 Pandemic and changes in adult Brazilian lifestyles: A cross-sectional study, 2020. Epidemiol. Serviços Saúde 2020, 29, e2020407. [Google Scholar] [CrossRef]
- Ammar, A.; Brach, M.; Trabelsi, K.; Chtourou, H.; Boukhris, O.; Masmoudi, L.; Bouaziz, B.; Bentlage, E.; How, D.; Ahmed, M.; et al. Effects of COVID-19 Home Confinement on Eating Behaviour and Physical Activity: Results of the ECLB-COVID19 International Online Survey. Nutrients 2020, 12, 1583. [Google Scholar] [CrossRef]
- Fanelli, R.M. Changes in the food-related behaviour of italian consumers during the covid-19 pandemic. Foods 2021, 10, 169. [Google Scholar] [CrossRef]
- Deschasaux-Tanguy, M.; Druesne-Pecollo, N.; Esseddik, Y.; de Edelenyi, F.S.; Allès, B.; Andreeva, V.A.; Baudry, J.; Charreire, H.; Deschamps, V.; Egnell, M.; et al. Diet and physical activity during the coronavirus disease 2019 (COVID-19) lockdown (March–May 2020): Results from the French NutriNet-Santé cohort study. Am. J. Clin. Nutr. 2021, 113, 924–938. [Google Scholar] [CrossRef]
- Di Renzo, L.; Gualtieri, P.; Pivari, F.; Soldati, L.; Attinà, A.; Cinelli, G.; Leggeri, C.; Caparello, G.; Barrea, L.; Scerbo, F.; et al. Eating habits and lifestyle changes during COVID-19 lockdown: An Italian survey. J. Transl. Med. 2020, 18, 229. [Google Scholar] [CrossRef]
- Tribst, A.A.L.; Tramontt, C.R.; Baraldi, L.G. Factors associated with diet changes during the COVID-19 pandemic period in Brazilian adults: Time, skills, habits, feelings and beliefs. Appetite 2021, 163, 105220. [Google Scholar] [CrossRef] [PubMed]
- World Health Organization (WHO). Nutrition advice for adults during the COVID-19 outbreak. WHO 2023. Available online: https://www.emro.who.int/nutrition/covid-19/nutrition-advice-for-adults-during-the-covid-19-outbreak.html (accessed on 15 March 2023).
- Dou, Z.; Stefanovski, D.; Galligan, D.; Lindem, M.; Rozin, P.; Chen, T.; Chao, A.M. Household Food Dynamics and Food System Resilience Amid the COVID-19 Pandemic: A Cross-National Comparison of China and the United State. Front. Sustain. Food Syst. 2021, 4, 577153. [Google Scholar] [CrossRef]
- De Carvalho, C.A.; De Almeida Fonseca Viola, P.C.; Sperandio, N. How is Brazil facing the crisis of Food and Nutrition Security during the COVID-19 pandemic? Public Health Nutr. 2021, 24, 561–564. [Google Scholar] [CrossRef]
- Monteiro, C.A.; Cannon, G.; Moubarac, J.-C.C.; Martins, A.P.B.; Martins, C.A.; Garzillo, J.; Canella, D.C.; Baraldi, L.G.; Barciotte, M.; Louzada, M.L. da C.; et al. Dietary guidelines to nourish humanity and the planet in the twenty-first century. A blueprint from Brazil. Public Health Nutr. 2015, 18, 2311–2322. [Google Scholar] [CrossRef] [PubMed] [Green Version]
- Botelho, L.V.; De Oliveira Cardoso, L.; Canella, D.S. COVID-19 and the digital food environment in Brazil: Reflections on the pandemic’s influence on the use of food delivery apps. Cad. Saude Publica 2020, 36, e00148020. [Google Scholar] [CrossRef]
- Serra, C.O.; Leite, P.M.G.; Bezerra, A.B.; Freitas, L.; Veras, L.; Costa, M.D.; Gonçalves, L.L.C.; Maciel, L.Y.S. Comparison of Climacteric Symptoms, Quality of Life, and Self-Care Attitudes before and during the COVID-19 Pandemic. J. Menopausal Med. 2022, 28, 17. [Google Scholar] [CrossRef]
- Santoro, N.; Epperson, C.N.; Mathews, S.B. Menopausal Symptoms and Their Management. Endocrinol. Metab. Clin. N. Am. 2015, 44, 497–515. [Google Scholar] [CrossRef] [Green Version]
- Wang, C.; Pan, R.; Wan, X.; Tan, Y.; Xu, L.; Ho, C.S.; Ho, R.C. Immediate Psychological Responses and Associated Factors during the Initial Stage of the 2019 Coronavirus Disease (COVID-19) Epidemic among the General Population in China. Int. J. Environ. Res. Public Health 2020, 17, 1729. [Google Scholar] [CrossRef] [Green Version]
- Monterrosa-blanco, A.; Monterrosa-castro, Á.; González-sequeda, A. Online assessment of the perception of loneliness and associated factors in Colombian climacteric women during the COVID-19 pandemic: A cross-sectional study. Heath Promot. Perspect. 2021, 11, 230–239. [Google Scholar] [CrossRef]
- Monteiro, C.A.; Cannon, G.; Levy, R.B.; Claro, R.M.; Moubarac, J.C. The Food System. Ultra-processing. The big issue for nutrition, disease, health, well-being. World Nutr. 2012, 3, 527–569. [Google Scholar]
- Monteiro, C.A.C.A.; Cannon, G.; Lawrence, M.; Costa-Louzada, M.L.; Pereira-Machado, P.; Costa Louzada, M.L.; Machado, P.P. Ultra-Processed Foods, Diet Quality, and Health Using the NOVA Classification System; FAO: Rome, Italy, 2019. [Google Scholar]
- Willett, W.; Rockström, J.; Loken, B.; Springmann, M.; Lang, T.; Vermeulen, S.; Garnett, T.; Tilman, D.; DeClerck, F.; Wood, A.; et al. Food in the Anthropocene: The EAT–Lancet Commission on healthy diets from sustainable food systems. Lancet 2019, 393, 447–492. [Google Scholar] [CrossRef]
- Lane, M.M.; Davis, J.A.; Beattie, S.; Gómez-Donoso, C.; Loughman, A.; O’Neil, A.; Jacka, F.; Berk, M.; Page, R.; Marx, W.; et al. Ultraprocessed food and chronic noncommunicable diseases: A systematic review and meta-analysis of 43 observational studies. Obes. Rev. 2021, 22, e13146. [Google Scholar] [CrossRef] [PubMed]
- Pagliai, G.; Dinu, M.; Madarena, M.P.; Bonaccio, M.; Iacoviello, L.; Sofi, F. Consumption of ultra-processed foods and health status: A systematic review and meta-Analysis. Br. J. Nutr. 2021, 125, 308–318. [Google Scholar] [CrossRef] [PubMed]
- Shumaker, S.A.; LaCroix, A.Z.; Bea, J.W. The Impact, Experience, and Challenges of COVID-19 on the Women’s Health Initiative Participants: An Introduction to the Special Issue. J. Gerontol. Ser. A 2022, 77, S1–S2. [Google Scholar] [CrossRef]


| Sociodemographic and Clinical (n = 274) | Average (SD)/n (%) |
|---|---|
| Age | 56.29 (6.22) |
| Age at menopause | 48.13 (4.94) |
| Menopause time (years) | 8.29 (6.62) |
| n (%) | |
| Ethnicity | |
| Nonwhite a | 128 (46.7) |
| White | 146 (53.3) |
| Marital status | |
| Single/widow/divorced | 129 (47.1) |
| Married or living with a partner | 145 (52.9) |
| Individual monthly income b | |
| ≤2 minimum wages | 175 (63.9) |
| >2 minimum wages | 99 (36.1) |
| School education | |
| ≤8 years | 70 (26.8) |
| 9 to 11 years | 69 (26.3) |
| ≥12 years | 123 (46.9) |
| Average (SD) | |
| Anthropometric (n = 273) | |
| Body Mass Index (kg/m2) | 28.40 (5.36) |
| Waist circumference (cm) | 94.09 (12.99) |
| n (%) | |
| Body Mass Index | |
| Normal body weight | 77 (28.2) |
| Overweight | 105 (38.5) |
| Obesity | 91 (33.3) |
| Life habits (n = 274) | |
| Physical activity | |
| Active | 127 (46.4) |
| Inactive | 147 (53.6) |
| Smoking | |
| No | 227 (82.8) |
| Yes | 47 (17.2) |
| Alcohol intake | |
| No | 202 (73.7) |
| Yes | 72 (26.3) |
| COVID-19 (n = 78) * | |
| Diagnosis of COVID-19 ** | |
| No | 76 (97.4) |
| Yes | 2 (2.6) |
| Lockdown | |
| No | 2 (2.6) |
| Yes, but still working in person | 62 (79.5) |
| Yes | 14 (17.9) |
| K-BMI | Ratings | Before Pandemic (n = 274) | During Pandemic (n = 78) | p * | ||
|---|---|---|---|---|---|---|
| N | % | N | % | |||
| Vasomotor | None | 32 | 11.68 | 21 | 26.9 | <0.001 |
| Mild | 89 | 32.48 | 25 | 32.1 | ||
| Moderate | 58 | 21.17 | 22 | 28.2 | ||
| Severe | 95 | 34.67 | 10 | 12.8 | ||
| Paresthesia | None | 80 | 29.2 | 47 | 60.26 | <0.001 |
| Mild | 116 | 42.34 | 19 | 24.36 | ||
| Moderate | 49 | 17.88 | 9 | 11.54 | ||
| Severe | 29 | 10.58 | 3 | 3.85 | ||
| Insomnia | None | 41 | 14.96 | 23 | 29.49 | 0.003 |
| Mild | 91 | 33.21 | 25 | 32.05 | ||
| Moderate | 43 | 15.69 | 16 | 20.51 | ||
| Severe | 99 | 36.13 | 14 | 17.95 | ||
| Nervousness | None | 38 | 13.87 | 17 | 21.79 | 0.034 |
| Mild | 104 | 37.96 | 31 | 39.74 | ||
| Moderate | 72 | 26.28 | 23 | 29.49 | ||
| Severe | 60 | 21.9 | 7 | 8.97 | ||
| Melancholy | None | 41 | 14.96 | 27 | 34.62 | 0.001 |
| Mild | 131 | 47.81 | 28 | 35.9 | ||
| Moderate | 62 | 22.63 | 19 | 24.36 | ||
| Severe | 40 | 14.6 | 4 | 5.13 | ||
| Vertigo | None | 61 | 22.26 | 41 | 52.56 | <0.001 |
| Mild | 149 | 54.38 | 54 | 30.77 | ||
| Moderate | 35 | 12.77 | 11 | 14.1 | ||
| Severe | 29 | 10.58 | 2 | 2.56 | ||
| Weakness | None | 59 | 21.53 | 34 | 43.59 | 0.001 |
| Mild | 137 | 50 | 26 | 33.33 | ||
| Moderate | 51 | 18.61 | 14 | 17.95 | ||
| Severe | 27 | 9.85 | 4 | 5.13 | ||
| Arthralgia/Myalgia | None | 30 | 10.95 | 18 | 23.08 | 0.05 |
| Mild | 77 | 28.1 | 21 | 26.92 | ||
| Moderate | 62 | 22.63 | 17 | 21.79 | ||
| Severe | 105 | 38.32 | 22 | 28.21 | ||
| Headache | None | 51 | 18.61 | 23 | 29.49 | <0.001 |
| Mild | 139 | 50.73 | 38 | 48.72 | ||
| Moderate | 48 | 17.52 | 17 | 21.79 | ||
| Severe | 36 | 13.14 | 0 | 0 | ||
| Palpitation | None | 60 | 21.9 | 38 | 48.72 | <0.001 |
| Mild | 135 | 49.27 | 28 | 35.9 | ||
| Moderate | 55 | 20.07 | 11 | 14.1 | ||
| Severe | 24 | 8.76 | 1 | 1.28 | ||
| Tingling | None | 48 | 21.9 | 33 | 42.31 | <0.001 |
| Mild | 144 | 49.27 | 35 | 32.05 | ||
| Moderate | 40 | 20.07 | 15 | 19.23 | ||
| Severe | 42 | 8.76 | 5 | 6.41 | ||
| Total | None | 0 | 0 | 43 | 55.16 | <0.001 |
| Mild | 83 | 30.29 | 0 | 0 | ||
| Moderate | 141 | 51.46 | 30 | 38.46 | ||
| Severe | 50 | 18.25 | 5 | 6.41 | ||
| WHQ | Before Pandemic (n = 78) | During Pandemic (n = 78) | p ** | |||
| Mean ± SD | Median (Q1–Q3) | Mean ± SD | Median (Q1–Q3) | |||
| Depressive mood | 0.28 ± 0.26 | 0.14 (0–0.42) | 0.28 ± 0.26 | 0.21 (0–0.42) | 0.800 | |
| Somatic symptoms | 0.51 ± 0.32 | 0.71 (0.14–0.71) | 0.50 ± 0.28 | 0.42 (0.28–0.71) | 0.195 | |
| Memory/concentration | 0.57 ± 0.41 | 0.66 (0–1) | 0.54 ± 0.37 | 0.66 (0.33–1) | 0.512 | |
| Vasomotor | 0.57 ± 0.53 | 1 (0–1) | 0.57 ± 0.45 | 0.5 (0–1) | 0.438 | |
| Anxiety/fear | 0.39 ± 0.40 | 0.5 (0–0.75) | 0.32 ± 0.35 | 0.25 (0–0.5) | 0.094 | |
| Sexual behavior | 0.61 ± 0.29 | 0.66 (0.33–1) | 0.58 ± 0.30 | 0.66 (0.33–0.66) | 0.707 | |
| Sleep disorders | 0.62 ± 0.35 | 0.66 (0.33–1) | 0.54 ± 0.39 | 0.66 (0.33–1) | 0.369 | |
| Attractiveness | 0.35 ± 0.47 | 0 (0–1) | 0.41 ± 0.40 | 0.5 (0–0.5) | 0.157 | |
| Food Consumption | Before Pandemic (n = 78) | During Pandemic (n = 78) | p * | ||
|---|---|---|---|---|---|
| Average ± SD | Median (Q1–Q3) | Average ± SD | Median (Q1–Q3) | ||
| Total energy intake (kcal) | 1726.04 ± 577.01 | 1802.81 (1371.08–2156.35) | 1541.28 ± 604.07 | 1466.86 (1035.15–1918.58) | 0.003 |
| Degree of food processing (% of total daily energy intake) | |||||
| Culinary preparations | 61.22 ± 14.45 | 60.78 (53.01–72.3) | 63.14 ± 16.70 | 63.27 (51.81–74.60) | 0.697 |
| Processed foods | 8.97± 6.44 | 8.75 (3.33–13.50) | 5.88 ± 6.16 | 4.24 (0–9.71) | 0.003 |
| Ultra-processed foods | 29.81 ± 14.42 | 29.38 (19.78–40.15) | 31.18 ± 17.21 | 29.73 (18.29–41.77) | 0.216 |
| Healthy markers (g) | |||||
| Fruits | 161.79 ± 109.42 | 153.5 (83.03–213.69) | 135.22 ± 123.69 | 107.08 (44.96–180.01) | 0.658 |
| Vegetables | 64.17 ± 78.93 | 38.54 (18.01–74.29) | 55.70 ± 74.19 | 20.99 (9.05–83.53) | 0.392 |
| Legumes | 78.93 ± 93.26 | 54.07 (0–109.75) | 64.77 ± 78.09 | 38.82 (11.57–83.82) | 0.063 |
| Milk and plain yogurt | 134.70 ± 124.02 | 116.10 (6.95–213.81) | 106.67 ± 102.23 | 89 (2.99–168.9) | 0.043 |
| Unhealthy markers (g) | |||||
| Sugar-sweetened beverages | 63.21 ± 81.68 | 29.93 (6.28–87.84) | 66.99 ± 83.88 | 29.28 (0–89.8) | 0.007 |
| Sweet foods | 184.15 ± 138.65 | 157.32 (62.51–273.34) | 190.72 ± 227.02 | 128.12 (13.67–286.44) | 0.001 |
| Sausages | 43.46 ± 75.71 | 0 (0–51.5) | 26.65 ± 59.71 | 0 (0–19.94) | 0.082 |
| Fast food and ready meals | 103.44 ± 189.54 | 15.17 (0–122.79) | 101.64 ± 154.18 | 46.80 (0–131.61) | 0.385 |
| Before Pandemic (n = 78) | During Pandemic (n = 78) | p * | |||
|---|---|---|---|---|---|
| Average ± SD | Median (Q1–Q3) | Average ± SD | Median (Q1–Q3) | ||
| Total energy intake (kcal) | 1726.04 ± 577.01 | 1802.81 (1371.08–2156.35) | 1541.28 ± 604.07 | 1466.86 (1035.15–1918.58) | 0.003 |
| Nutrients (g) | |||||
| Proteins | 64.89 ± 29.53 | 60.94 (45.30–85.87) | 60.55 ± 28.19 | 54.19 (38.28–75.83) | 0.001 |
| Carbohydrates | 212.92 ± 76.92 | 205.28 (159.43–266.13) | 207.04 ± 79.52 | 195.67 (146.78–262.83) | 0.079 |
| Fibers | 17.27 ± 7.14 | 15.74 (12.97–20.38) | 16.76 ± 7.62 | 14.98 (12.25–20.32) | 0.159 |
| Lipids | 56.39 ± 27.52 | 53.13 (35.00–73.88) | 52.22 ± 25.34 | 47.79 (33.93–64.54) | 0.004 |
| Saturated Fatty Acids | 21.82 ± 11.69 | 19.34 (13.75–28.05) | 20.51 ± 10.97 | 17.52 (12.69–25.26) | 0.011 |
| Monounsaturated Fatty Acids | 19.36 ± 9.87 | 16.33 (11.77–26.12) | 17.76 ± 9.22 | 15.89 (11.00–21.89) | 0.006 |
| Polyunsaturated Fatty Acids | 8.95 ± 4.68 | 8.59 (5.32–12.54) | 8.33 ± 4.40 | 7.68 (4.80–14.16) | 0.061 |
| Trans Fatty Acids | 2.27 ± 1.13 | 1.71 (1.26–3.06) | 2.21 ± 1.34 | 1.75 (1.21–2.87) | 0.002 |
Disclaimer/Publisher’s Note: The statements, opinions and data contained in all publications are solely those of the individual author(s) and contributor(s) and not of MDPI and/or the editor(s). MDPI and/or the editor(s) disclaim responsibility for any injury to people or property resulting from any ideas, methods, instructions or products referred to in the content. |
© 2023 by the authors. Licensee MDPI, Basel, Switzerland. This article is an open access article distributed under the terms and conditions of the Creative Commons Attribution (CC BY) license (https://creativecommons.org/licenses/by/4.0/).
Share and Cite
Noll, P.R.E.S.; Nascimento, M.G.; Bayer, L.H.C.M.; Zangirolami-Raimundo, J.; Turri, J.A.O.; Noll, M.; Baracat, E.C.; Soares Junior, J.M.; Sorpreso, I.C.E. Changes in Food Consumption in Postmenopausal Women during the COVID-19 Pandemic: A Longitudinal Study. Nutrients 2023, 15, 3494. https://doi.org/10.3390/nu15153494
Noll PRES, Nascimento MG, Bayer LHCM, Zangirolami-Raimundo J, Turri JAO, Noll M, Baracat EC, Soares Junior JM, Sorpreso ICE. Changes in Food Consumption in Postmenopausal Women during the COVID-19 Pandemic: A Longitudinal Study. Nutrients. 2023; 15(15):3494. https://doi.org/10.3390/nu15153494
Chicago/Turabian StyleNoll, Priscilla Rayanne E. Silva, Monique G. Nascimento, Luiza Helena Costa Moreira Bayer, Juliana Zangirolami-Raimundo, José Antonio Orellana Turri, Matias Noll, Edmund Chada Baracat, José Maria Soares Junior, and Isabel Cristina Esposito Sorpreso. 2023. "Changes in Food Consumption in Postmenopausal Women during the COVID-19 Pandemic: A Longitudinal Study" Nutrients 15, no. 15: 3494. https://doi.org/10.3390/nu15153494
APA StyleNoll, P. R. E. S., Nascimento, M. G., Bayer, L. H. C. M., Zangirolami-Raimundo, J., Turri, J. A. O., Noll, M., Baracat, E. C., Soares Junior, J. M., & Sorpreso, I. C. E. (2023). Changes in Food Consumption in Postmenopausal Women during the COVID-19 Pandemic: A Longitudinal Study. Nutrients, 15(15), 3494. https://doi.org/10.3390/nu15153494