Article

Fermentation and Quality Characteristics of Yogurt Treated with Bifidobacterium longum

1
Department of Food Science & Biotechnology, Chungbuk National University, Cheongju-si 28644, Republic of Korea
2
Department of Food and Nutrition, Daejeon Health Sciences College, Daejeon 34504, Republic of Korea
*
Author to whom correspondence should be addressed.
Nutrients 2023, 15(15), 3490; https://doi.org/10.3390/nu15153490
Submission received: 7 July 2023 / Revised: 31 July 2023 / Accepted: 3 August 2023 / Published: 7 August 2023
(This article belongs to the Section Prebiotics and Probiotics)

Abstract

:
The fermentation and quality characteristics of yogurt were investigated according to the inoculation concentration of Bifidobacterium longum. The total sugar content of yogurt decreased as the fermentation time increased, and with an increased concentration of B. longum treatment the fermentation time decreased rapidly. As fermentation progressed, the lactose content decreased rapidly at the beginning and gradually decreased as the pH decreased. Depending on the B. longum treatment concentration, the lactose content varied from 0.29 ± 0.01 to 0.47 ± 0.01% and was 0.5% or less in all experimental groups. The experimental group inoculated with 0.0015% of B. longum displayed the best results in all categories, including pH, total acidity, lactic acid content, solid non-fat content, and total lactic acid bacteria count, which are factors that determine the quality of yogurt. In summary, the experimental group inoculated with 0.0015% of B. longum was determined to be the highest quality yogurt.

1. Introduction

In addition to its anti-cancer and blood cholesterol-lowering effects, yogurt is known for its high nutritional and hydration levels, ability to reduce lactose intolerance, increase beneficial bacteria such as bifidobacteria, inhibit growth of intestinal pathogenic bacteria, and improve constipation [1]. Lactobacillus bulgaricus, L. acidophilus, L. casei, and Streptococcus salivarius subsp. thermophilus are the major lactic acid bacteria used in yogurt production [2] Given its improved nutrition, digestibility, unique flavor, and various physiological functions, the demand for yogurt is steadily increasing worldwide [3]. Because the demand for yogurt and other milk products with high milk solid content and lactic acid bacteria has been steadily increasing for several years, liquid yogurt has been the main type of yogurt popular in Korea [4]. The Codex standards for fermented milk state that the number of starter culture bacteria should be at least 107 CFU g−1 throughout its shelf life and the minimum numbers required for health benefits should be at least 106 CFU g−1 [5]. In Korea, it can be called yogurt only when it contains more than 100 million lactic acid bacteria and has a non-solid content of 8% or more [6].
Yogurt fermented with Lactobacillus bulgaricus, Streptococcus salivarius subsp. thermophilus, and Bifidobacterium longum together has higher viscosity than separately fermented, respectively. Additionally, specific exopolysaccharide (EPS) producing bifidobacterial could improve the quality of fermented milk products, including physicochemical properties, as well as endowing products with health benefits [7].
Lactose is primarily obtained by consuming dairy products. In general, milk contains approximately 5% lactose, whereas yogurt has a lactose content of approximately 3.5%. However, more than 70% of the global population is genetically incapable of digesting lactose [8]. Bifidobacterium longum is a Gram-positive, catalase-negative, rod-shaped bacterium present in the human gastrointestinal tract and it is one of the 32 species belonging to the genus Bifidobacterium [9]. B. longum is non-pathogenic and is often added to food products. B. longum is the most common species of Bifidobacteria, it has better growth properties in milk than other species of this genus but is usually used as supplements [10]. Many studies have been conducted on the production of lactose-free dairy products; however, little research has been conducted on lactose-free yogurt.
Therefore, this study examined the quality and fermentation characteristics of lactose-free yogurt fermented directly by B. longum, rather than its use as a supplement. Additionally, yogurt manufacturing conditions were established according to the optimal B. longum inoculation conditions with lactase.

2. Materials and Methods

2.1. Materials

Raw milk, sterilized milk, Bifidobacterium longum (Bifidobacteriul longum KACC 91563), lactase (MAXILACT LGI 5000), and yogurt lactic acid bacteria (Lyofast SAB 440 B, SACCO) used in this experiment were provided by Cheongwon Natural Land located in Cheongju-si, Republic of Korea.

2.2. Manufacture of Yogurt

To prepare the yogurt, 0.032% lactic acid bacteria (Lyofast SAB 440 B, SACCO, Cadorago, Italy) containing Streptococcus salivarius subsp. thermophilus, Lactobacillus acidophilus, Bifidobacterium animalis ssp., and 15% lactase were added to milk based on its volume. To examine the effect of Bifidobacterium longum (KACC91563), it was inoculated at concentrations of 0.001, 0.00125, and 0.0015% by volume of milk, and the unadded sample was used as the control. Cells were allowed to ferment in an incubator at 37 °C for 8 h. Subsequently, the mixture was refrigerated at 4 °C for 15 h and used in the experiments.

2.3. Measurement of Total Sugar Content

The total sugar content of the yogurt was measured using the phenol-sulfuric acid method [11]. The sample was diluted to an appropriate ratio, 0.5 mL of a 5% phenol (Shinyo Pure Chemicals Co., Ltd., Osaka, Japan) solution was added to 1 mL of the diluent, 2.5 mL of 95% sulfuric acid (Daejung Chemicals and Metals Co., Ltd., Siheung, Republic of Korea) was added, and the mixture was left at room temperature for 30 min. The absorbance was measured at 470 nm using an Epoch microplate spectrophotometer (Biotek Instruments Inc., Winooski, VT, USA). The calibration curve was prepared using glucose as the standard and expressed as equivalent milligrams of glucose per milliliter.

2.4. Measurement of Reducing Sugar Content

The reduced sugar content of the yogurt was measured using the DNS method [12] after diluting the sample to an appropriate ratio. After adding 0.4 mL of DNS reagent to 0.2 mL of the sample, heating it in boiling water at 100 °C for 5 min, cooling it rapidly, and adding 1.8 mL of distilled water, the sugar content was measured using an Epoch microplate spectrophotometer (Biotek Instruments Inc., VT, USA). The absorbance was measured at 525 nm. For the standard, a calibration curve was prepared using glucose and expressed as milligrams of glucose equivalents per milliliter.

2.5. Measurement of Lactose Content

The lactose content of yogurt was analyzed by modifying the method described by Kim et al. [13]. Subsequently, 49 mL of 70% acetonitrile was added to 1 mL of the sample, diluted 50 times, filtered through a 0.2 μm membrane filter, and analyzed using HPLC (Jasco System, Tokyo, Japan). A Luna 5 μm NH-2 100Å column (4.6 × 250 mm ID, Phenomenex, Torrance, CA, USA) was used. Acetonitrile water (80:20, v/v) was used as the mobile phase. An ELSD detector was used (Waters 2420, Waters, Milford, MA, USA). The flow rate was 1 mL/min and the injection volume was 20 μL. Lactose (Sigma-Aldrich, St. Louis, MO, USA) was used as the standard.

2.6. Measurement of pH, Total Acidity, and Lactic Acid Content

The pH of the yogurt was measured using a pH meter (Orion 4 Star; Thermo Scientific, Beverly, MA, USA). The total acidity of the yogurt was determined as the amount of standardized 0.1 N NaOH required for neutralization using 1% phenolphthalein as an indicator. It was expressed as lactic acid (%) content [14]. The lactic acid content of the yogurt was analyzed by modifying the method described by Hwang et al. [15]. The yogurt was diluted to an appropriate concentration, filtered through a 0.45 μm membrane filter, and analyzed by HPLC (YL9120 system, Younglin, Anyang, Republic of Korea). The column used was a YMC-Triart C18 column (4.6 × 250 mm ID, YMC Co., Ltd., Kyoto, Japan). The absorbance was detected at 215 nm using a UV detector. The mobile phase was a 20 mM potassium phosphate-buffered solution (pH 2.8). The flow rate was 0.6 mL/min and the injection volume was 20 μL. Lactic acid was used as a standard.

2.7. Measurement of Viscosity

The viscosity of the yogurt during fermentation was measured at 37 °C by the viscometer (DV-Ⅱ+ Pro, Ametek Brookfield, Middleboro, MA, USA) with 1, 2, 3, 4, and 5 spindles at 200 rpm. All values were measured five times.

2.8. Measurement of Solids Non-Fat

Solids non-fat content was measured using the Food Code analysis method [16]. Next, 15 g of purified sea sand was placed with a small glass rod in a weighing tube with a base diameter of 5 cm or more, and it was dried in a dryer at 98–100 °C until a constant weight was achieved. Next, we accurately weighed about 5 g of the test sample, placed it in a weighing tube, and stirred the contents in a water bath while mixing. After most of the moisture was evaporated by heating, the sample was transferred to a dryer and dried until a constant weight was obtained to determine the amount of dry matter. The percentages of crude fat and sugar (sucrose, fructose, and glucose) were subtracted from the percentage of dry matter to obtain the percentage of solids content.

2.9. Measurement of Total Lactic Acid Bacteria Cell Number

The total lactic acid bacteria cell number was confirmed by the number of colonies after incubating for 48 h at 37 °C in anaerobic condition and dispensing 1 mL of a sample diluted to 106–108 using a Petrifilm medium (Lactic acid bacteria count plate, 3M, Maplewood, NJ, USA) for lactic acid bacteria.

2.10. Statistical Analysis

All analyses were repeated three times and expressed as mean ± SD. Statistical analyses were performed using the SPSS statistical program (Statistical Package for the Social Science, ver. 12.0, IBM SPSS Statistics, Chicago, IL, USA), which was used to calculate the mean and standard deviation of each treatment group. Subsequently, a one-way ANOVA test and Duncan’s multiple range test was used to test the significance.

3. Results and Discussions

3.1. Total Sugar and Reducing Sugar Content

Changes in the total sugar content of the yogurt according to the inoculation concentration of B. longum and fermentation time are presented in Table 1. With increasing fermentation time and inoculation concentration of B. longum, the total sugar content decreased. After 4 h of fermentation, the total sugar content was 78.63 mg/mL in the control group and 76.14 mg/mL in the 0.0015% inoculum of B. longum, and after 8 h of fermentation, the total sugar content was 72.62 and 69.91 mg/mL, respectively. These results were similar to those reported by Nguyen and Hwang [17]. As displayed in Table 1, the reducing sugar content increased during the early fermentation stage and then decreased subsequently. The increase in reducing sugars in the early fermentation stage is attributed to the high lactase activity and the decomposition of lactose into glucose and galactose [18]. After 4 h of fermentation, the reducing sugar content decreased because of the increased conversion of reducing sugars into acids compared with the decomposition of lactose. In the case of the control group, it increased from 44.33 mg/mL to 53.89 mg/mL after 4 h of fermentation and then decreased to 50.63 mg/mL at the end of fermentation. As the B. longum inoculum concentration increased, the reducing sugar content decreased. The group inoculated with 0.0015% of B. longum displayed an increase from 44.12 mg/mL before fermentation to 50.19 mg/mL after 4 h of fermentation and decreased to 46.97 mg/mL after 8 h of fermentation, and these results were similar to those reported in a study by Kim et al. [13]. As fermentation proceeds, sugar is converted to acid and its content decreases. Therefore, the change of total and reducing sugar contents in this experiment indicates that the higher concentration of B. longum fermented more effectively.

3.2. Lactose Content

Changes in the lactose content of yogurt according to the inoculation concentration and fermentation time of B. longum are presented in Table 1. At the beginning of fermentation, the lactose content decreased rapidly but gradually decreased after 4 h of fermentation, and the difference according to the amount of B. longum inoculation was not significant. The lactose content ranged from 4.59% to 4.65% depending on the amount of B. longum inoculation before fermentation. After 2 h of fermentation, the percentage in the control group was 1.37% and ranged from 1.46 to 1.52%, depending on the amount of B. longum inoculation. After 8 h of fermentation, the lactose content was 0.29% in the control group and 0.39, 0.44, and 0.47% in the B. longum inoculation group. The lactose content did not change significantly depending on the presence or absence of B. longum inoculation, and these results were similar to those reported by Popescu et al. [19]. Considering that the domestic low-lactose yogurt standard is <0.5%, all treatments in this experiment were considered suitable.

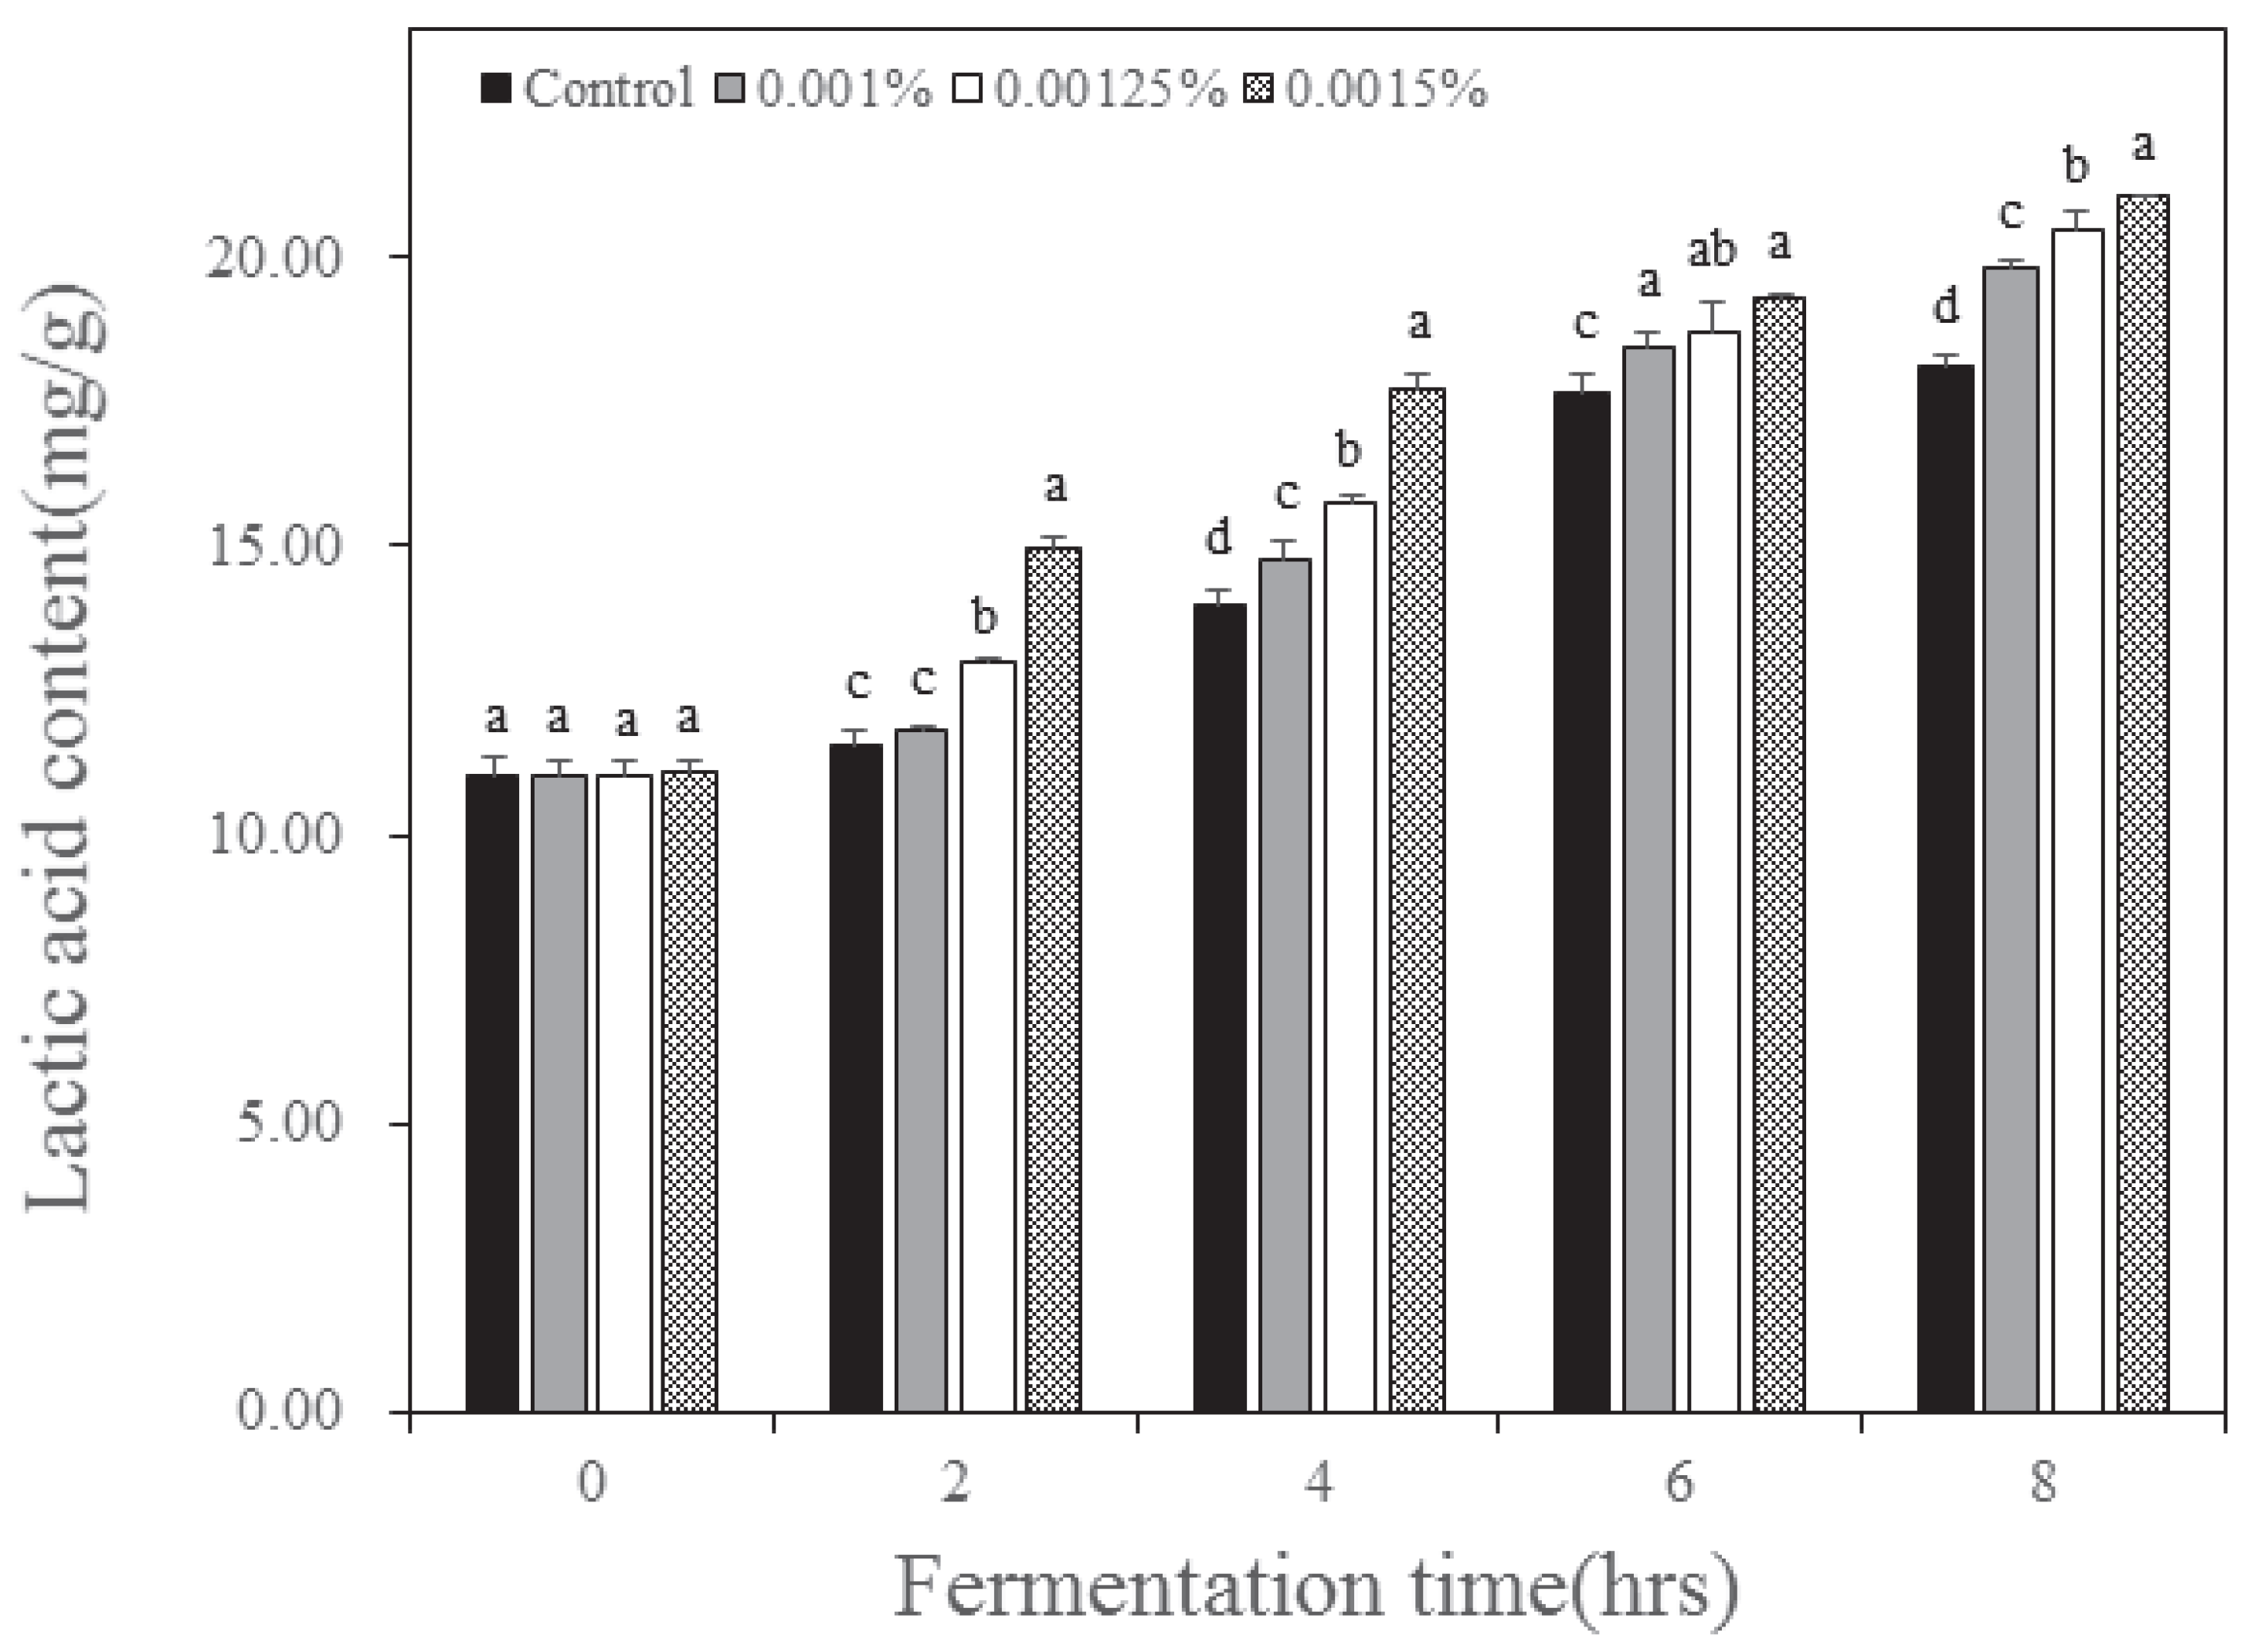
3.3. pH, Total Acidity, and Lactic Acid Content
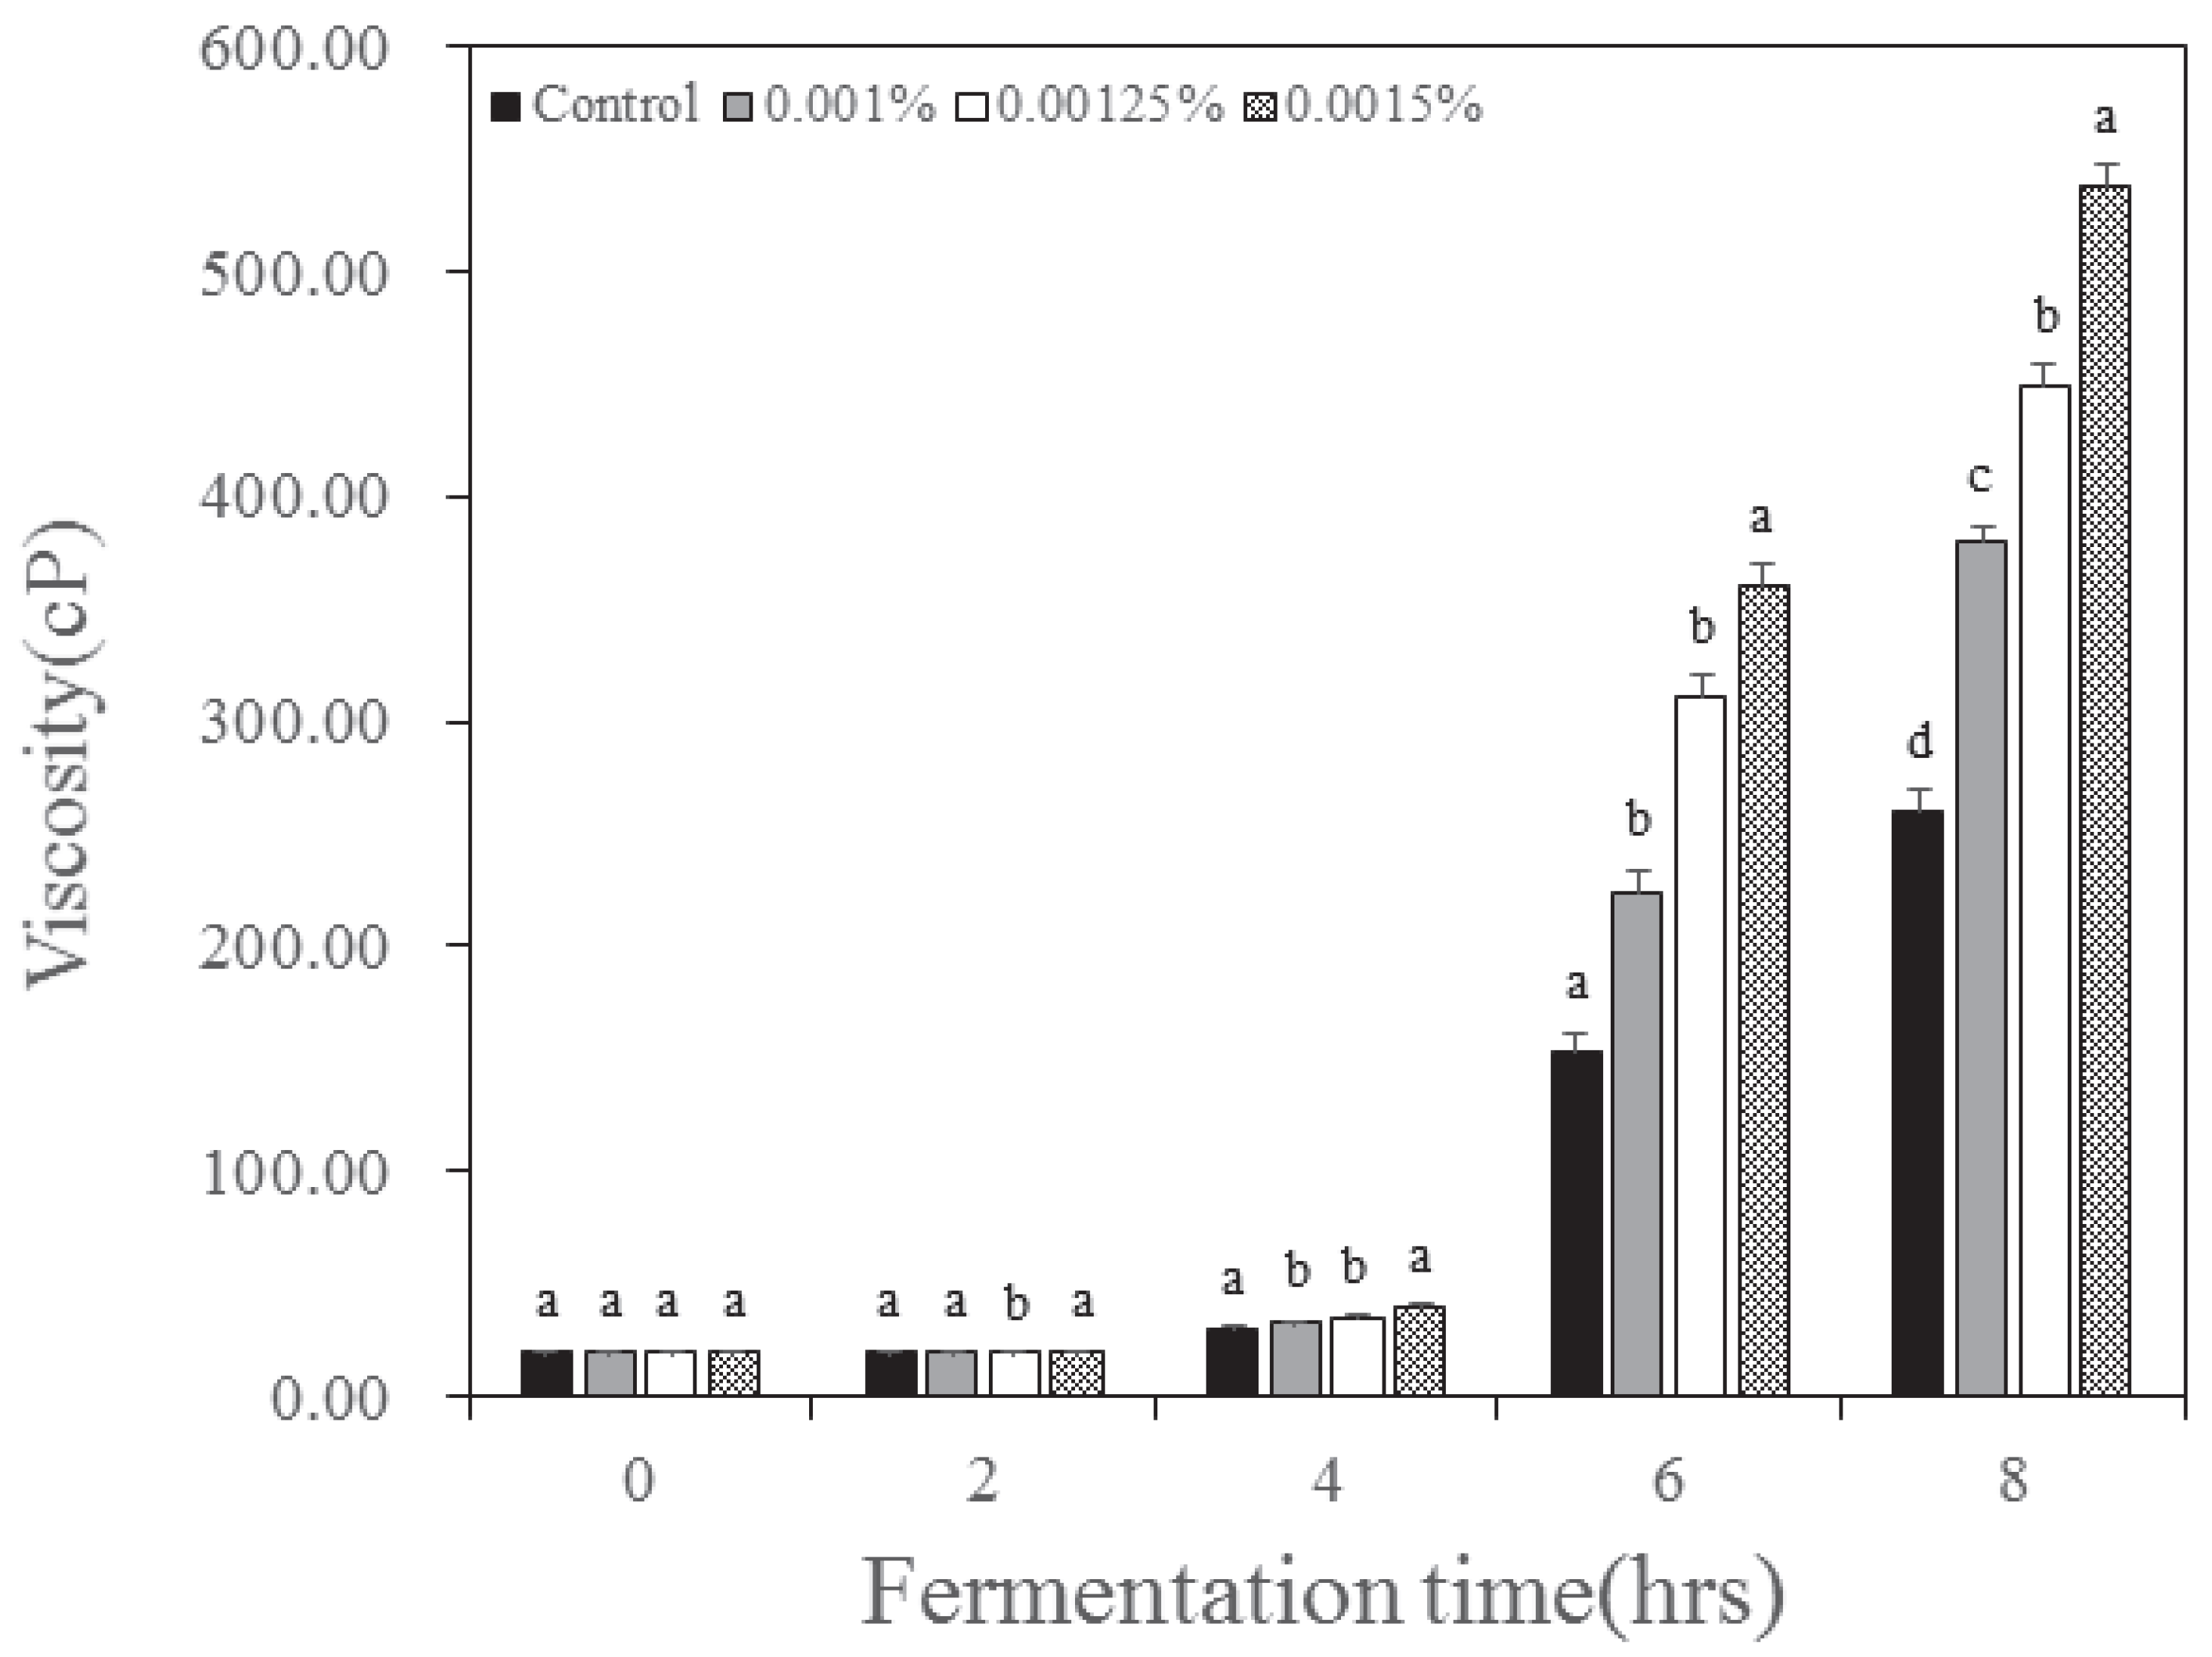
The pH of the yogurt according to the inoculation concentration and fermentation time of B. longum is presented in Table 2. As fermentation time increased, the pH of the yogurt decreased. The pH was 6.67 before fermentation, 8 h after fermentation the control group was at 4.69, and for B. longum inoculation concentrations of 0.001, 0.00125, and 0.0015% pH were 4.54, 4.47, and 4.42, respectively. As displayed in Table 2, the total acidity increased with fermentation time and increased concentration of B. longum. Total acidity was 0.10% before fermentation, and 8 h after fermentation the control was 0.59%. With increasing B. longum inoculation concentrations from 0.001 to 0.0015%, total acidity increased from 0.65 to 0.76%. The decrease in pH of yogurt and increase in total acidity according to B. longum inoculation concentration and fermentation time were similar to those reported by Irma et al. [20]. The lactic acid content displayed the same trend as total acidity (Figure 1). Similar to the total acidity, the lactic acid content increased with increasing concentrations of B. longum. Yogurt made by inoculating B. longum is known to increase the lactic acid content as fermentation time increases [21], and the same result was observed in this study. This change indicated that the increase in B. longum concentration can lead fermentation effectively, just like the change in sugar.

3.4. Viscosity

The viscosity of the yogurt according to the inoculation concentration and fermentation time of B. longum is depicted in Figure 2. The viscosity of the yogurt tended to increase with fermentation time, and the viscosity increased as the B. longum inoculation concentration increased. The control was increased from 19.89 cP before fermentation to 260.65 cP at the end of fermentation. The experimental group inoculated with 0.001% B. longum increased from 20.30 cP at the beginning to 380.13 cP at the end of fermentation. Additionally, the viscosity of the inoculation group with 0.00125% B. longum was increased to 448.67 and the inoculation group with 0.0015% was increased to 536.86 cP. Viscosity displayed the same trend as that of yogurt, which increased because of protein coagulation due to lowered pH during milk fermentation. Decreasing pH and disulfide bonds can lead to casein aggregation and result in gel formation [22]. These results are consistent with those of Yan et al. [7], who found that viscosity increased when Lactobacillus bulgaricus, Streptococcus salivarius subsp. thermophilus, and Bifidobacterium longum were used together. Additionally, base composition of milk, fermentation process, and starter culture can also affect the viscosity. Viscosity is one of the crucial texture properties of yogurt. In our result, the viscosity was the highest at the highest B. longum concentration. This may be due to interaction between exopolysaccharide (EPS) produced by B. longum and the milk protein, which affect the property of the gel structure in fermented milk and acidity.

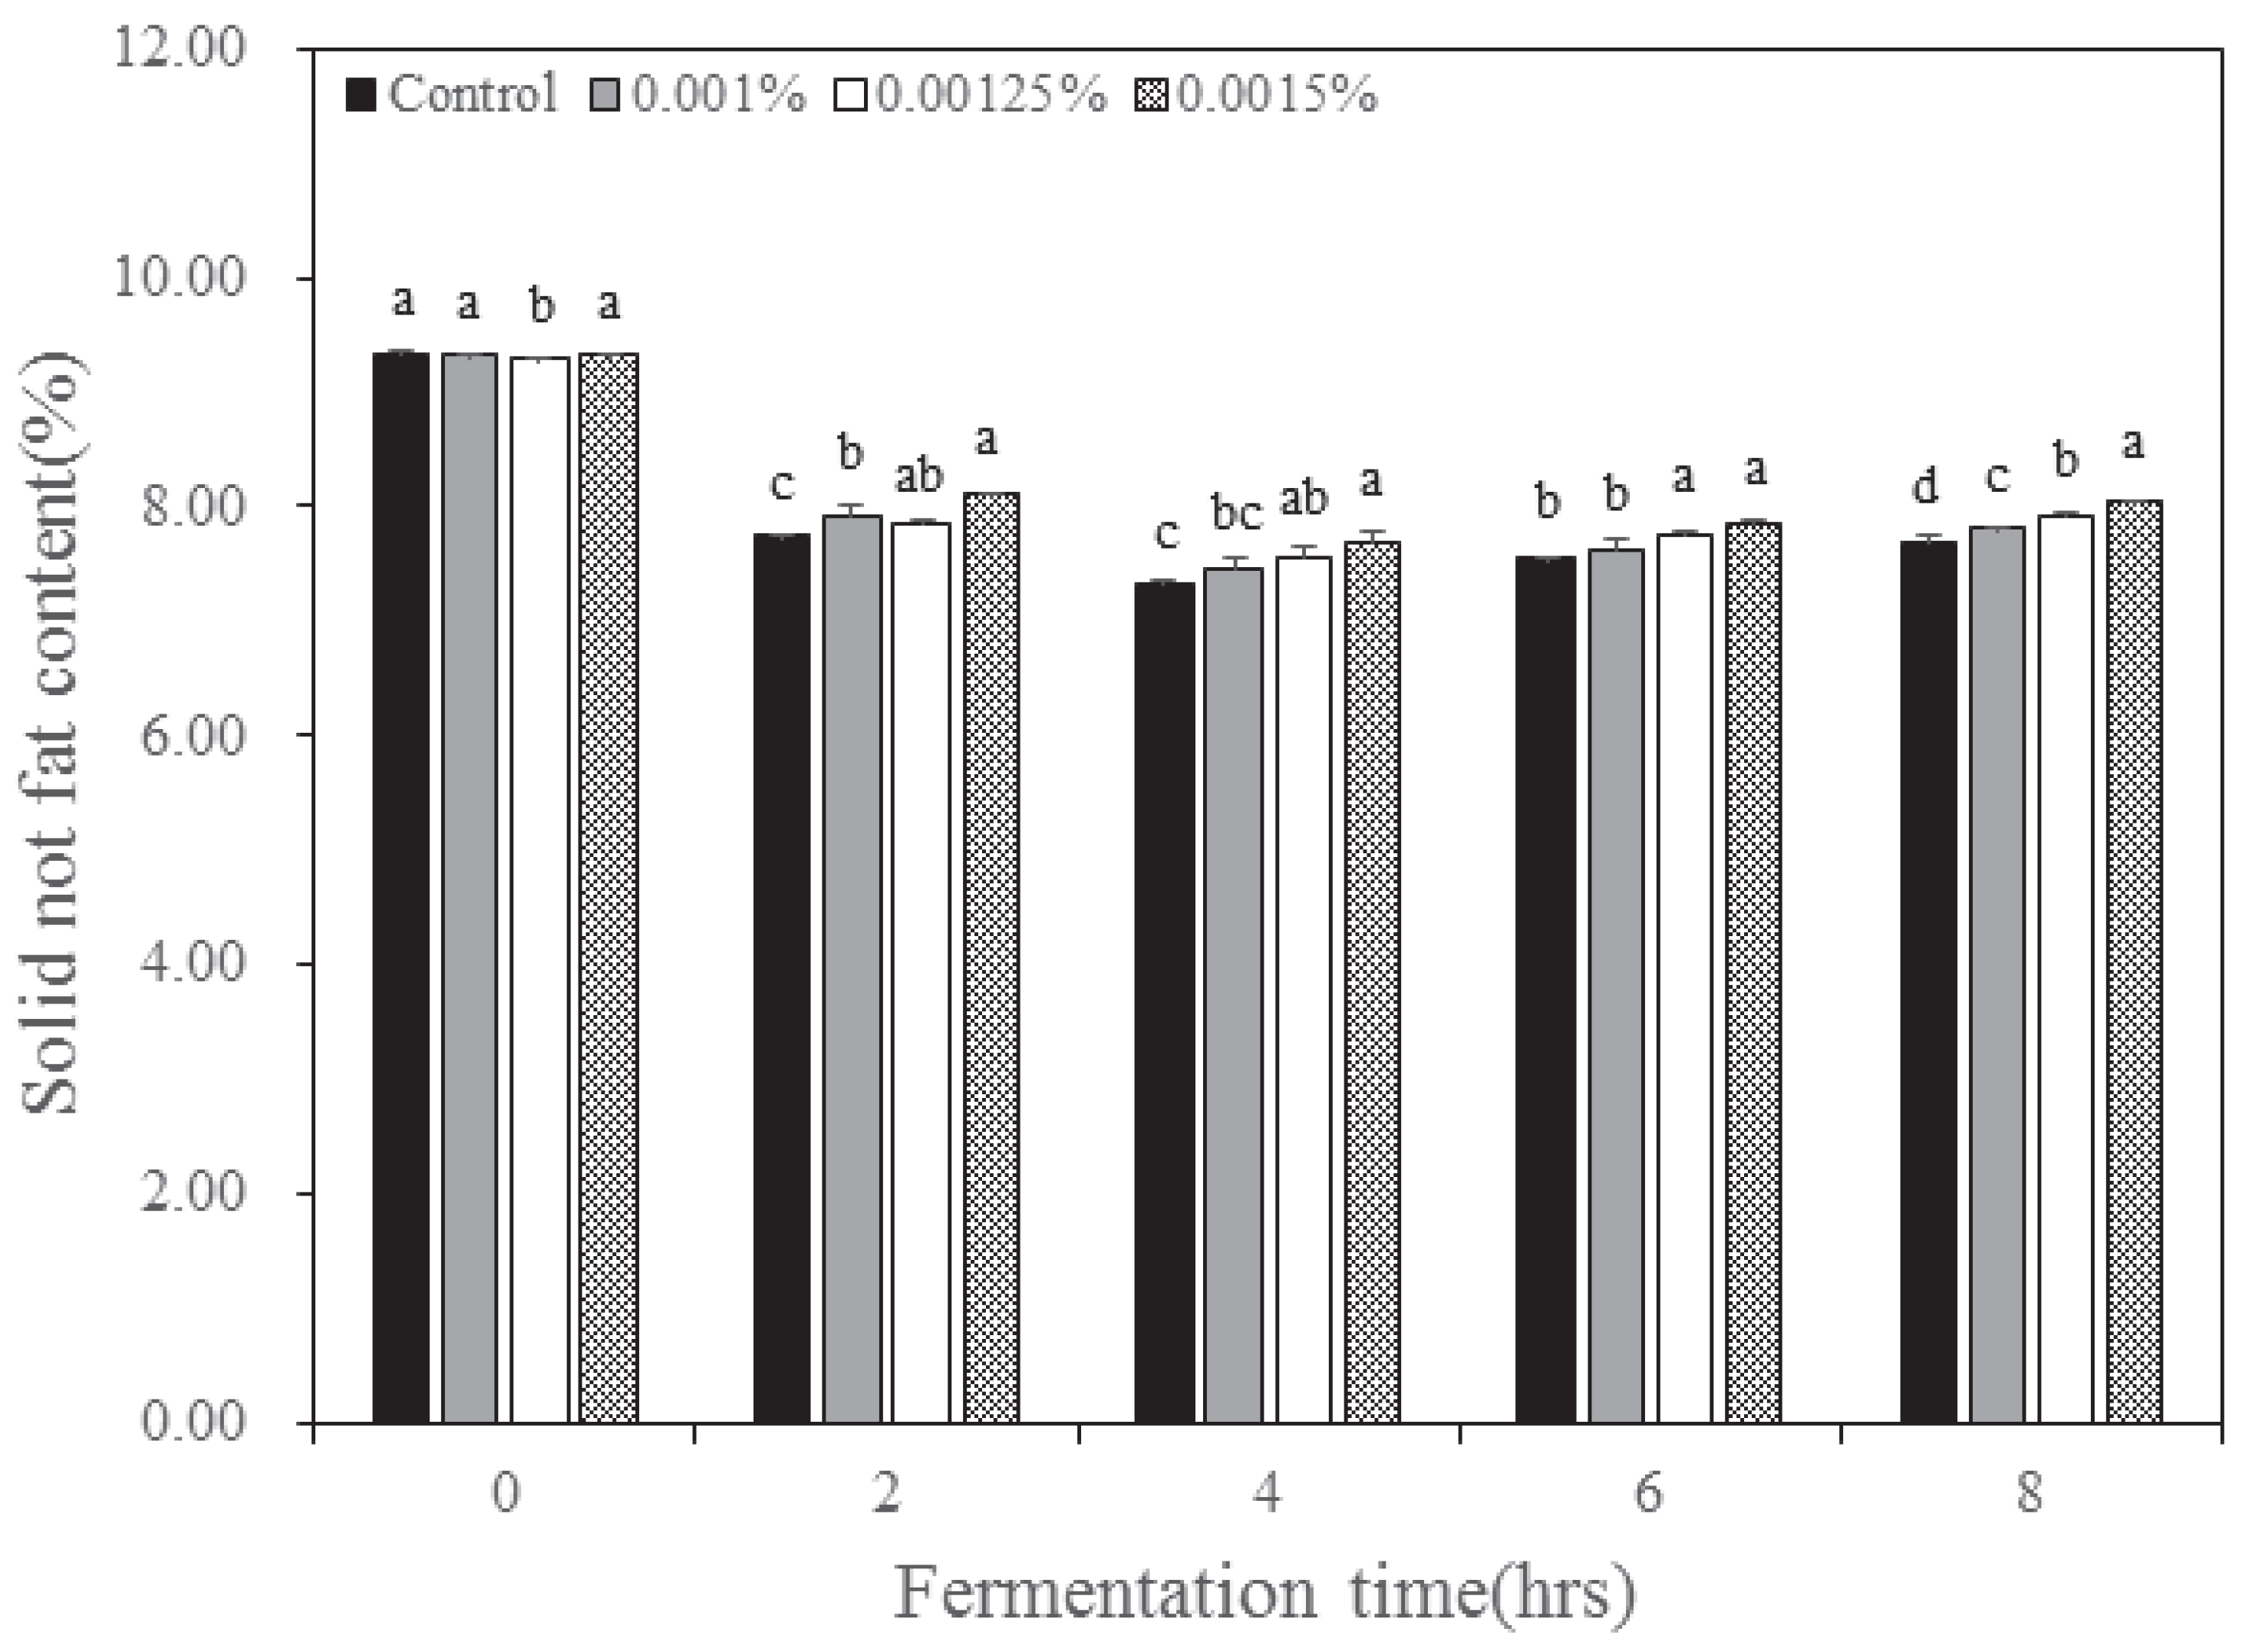
3.5. Solids Non-Fat Content

The solids non-fat content of yogurt according to the inoculation concentration and fermentation time of B. longum is illustrated in Figure 3. Solid non-fat content is the value obtained by subtracting fructose, glucose, sucrose, and crude fat from the solid content. The solid non-fat content decreased from 9.28–9.33% before fermentation to 7.68~8.04% after 8 h of fermentation, and the content was higher in 0.0015% of B. longum inoculation. In all experimental groups, the solid non-fat content displayed a tendency to decrease until 4 h of fermentation and then increase subsequently. The solid non-fat content increased because the activity of lactase was reduced by the pH and the conversion rate of glucose into acid increased, resulting in a decrease in glucose content. The experimental group that was inoculated with 0.0015% of B. longum displayed a solid non-fat content of 8% or more, which is the Korean standard for yogurt [23]. However, the control and inoculated group with 0.001% and 0.00125% of B. longum was unsuitable as per the Korean standard for yogurt because the solid non-fat content of the three group was less than 8%.

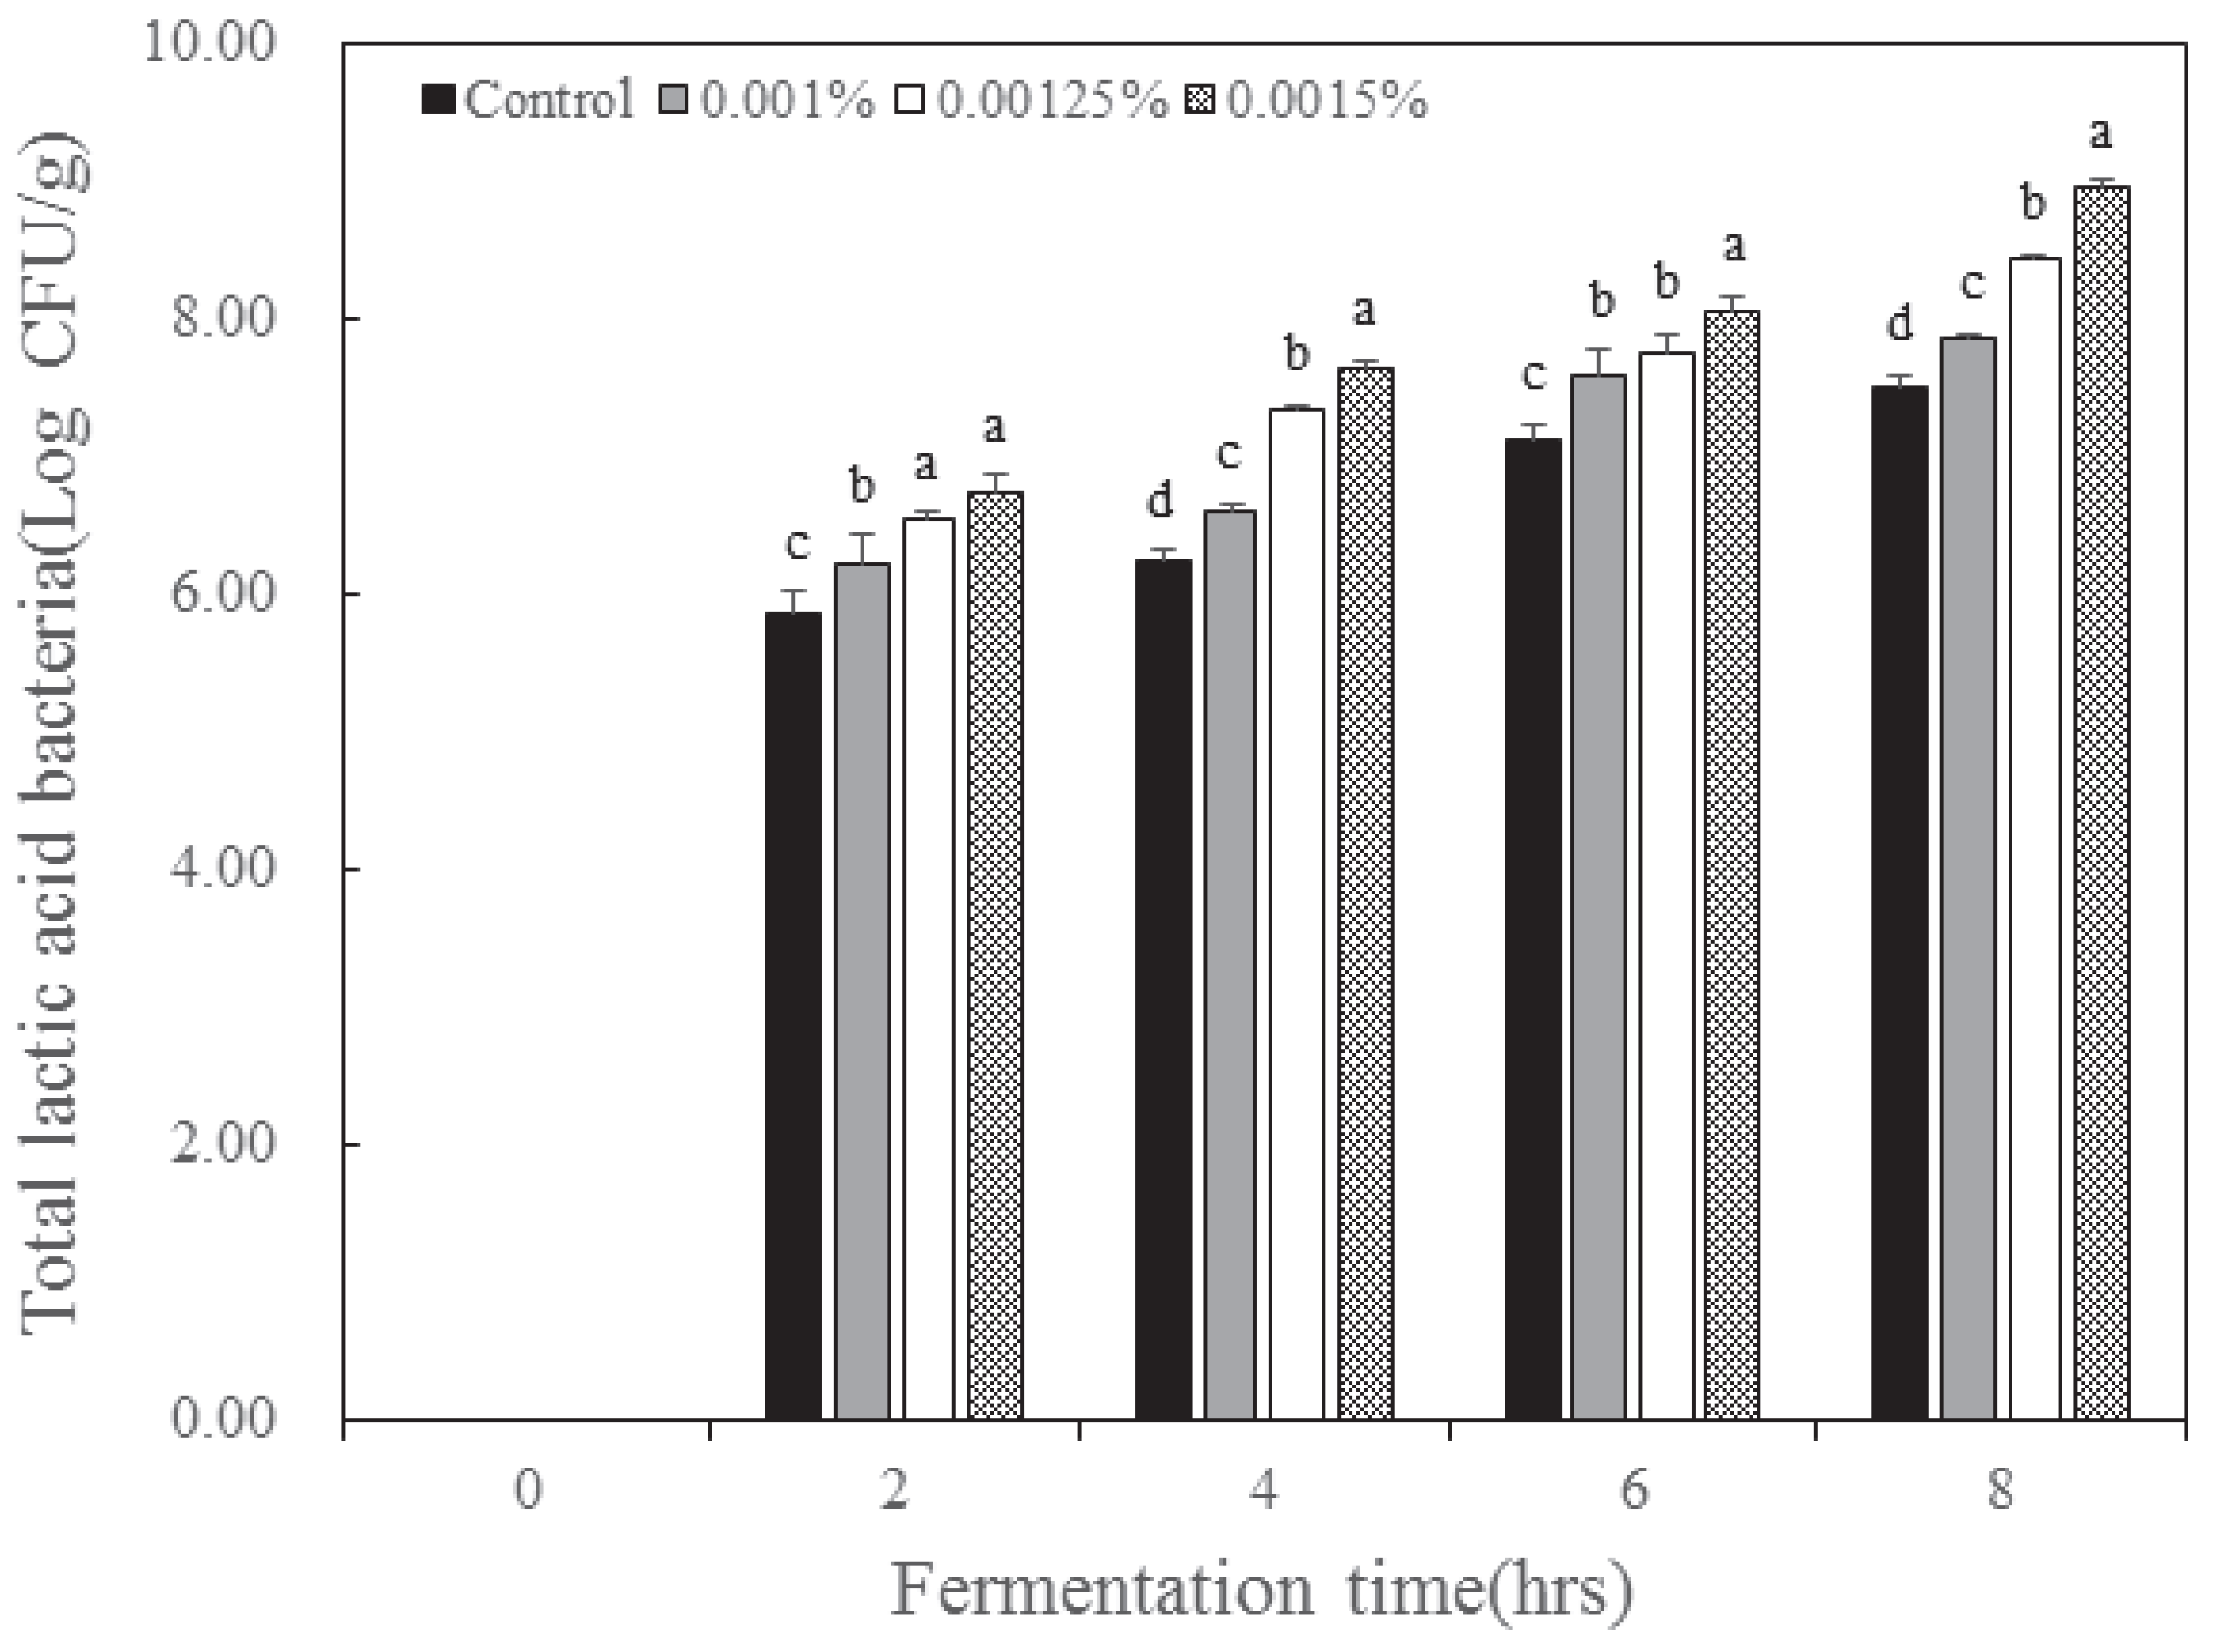
3.6. Total Lactic Acid Bacteria Cell Number

The total number of lactic acid bacteria cells in the yogurt according to the inoculation concentration and fermentation time of B. longum is presented in Figure 4. Lactic acid bacteria were not detected in the sterilized milk. With increasing fermentation time, the groups inoculated with higher concentrations of B. longum displayed a higher number of total lactic acid bacteria. When B. longum was non-inoculated, the number of lactic acid bacteria after 8 h of fermentation was 7.49 log CFU/g, and when B. longum was inoculated at 0.001% concentration, the number of lactic acid bacteria after fermentation was 7.85 log CFU/g and was 8.44 log CFU/g at 0.00125% and 8.95 log CFU/g at 0.0015%, respectively. The control and 0.001% B. longum treatment groups indicated that the total number of lactic acid bacteria was less than 100 million, which is not suitable according to Korean yogurt standards. Additionally, the total lactic acid bacteria number of the 0.00125% and 0.0015% B. longum treatment groups was suitable according to Korean yogurt standards [23].

4. Conclusions

In this study, the fermentation and quality characteristics of yogurt were investigated based on the inoculation concentration of Bifidobacterium longum. As B. longum uses sugars to produce acids, the higher the concentration of B. longum, the faster the total sugar and reducing sugar content decreased. After fermentation, the lactose content ranged from 0.29 to 0.47% and was less than 0.5% in all experimental groups. The higher the concentration of B. longum was, the faster the sugar was converted to acid; therefore, when the amount of B. longum added was 0.0015%, the total acid and lactic acid contents were high in yogurt, and the number of total lactic acid bacteria and solid non-fat content were also high. From the above results, the experimental group inoculated with 0.0015% of B. longum had the best factors for determining the quality of yogurts, such as total acidity, pH, non-fat solids, and total lactic acid bacteria number compared to the other experimental groups.

Author Contributions

Conceptualization, J.K.S. and H.S.J.; Methodology, H.S.J.; Formal analysis, J.K.S.; Writing—original draft, J.K.S. and H.S.J.; Writing—review & editing, J.K.S. and H.S.J.; Supervision, Y.R.L., J.L. and H.S.J.; Project administration, Y.J.J. (Yeon Jae Jo), Y.J.J. (Yun Jo Jung) and H.S.J. All authors have read and agreed to the published version of the manuscript.

Funding

This research received no external funding.

Conflicts of Interest

The authors declare no conflict of interest.

References

  1. Lee, I.S.; Lee, S.O.; Kim, H.S. Preparation and quality characteristics of yogurt added with Saururus chinensis (lour.) bail. J. Food Sci. Technol. 2002, 45, 721–726. [Google Scholar]
  2. Chung, D.H. Fermented Food a Complete Collection; Yu Han Publishing Co.: Seoul, Republic of Korea, 2012; pp. 25–43. [Google Scholar]
  3. Buttriss, J. Nutritional properties of fermented milk product. Int. J. Dairy Technol. 1997, 50, 21–27. [Google Scholar] [CrossRef]
  4. Noh, Y.H.; Jang, A.S.; Pyo, Y.H. Quality characteristics and antioxidant capacities of Korean commercial yogurt. Korean J. Food Sci. Technol. 2020, 52, 113–118. [Google Scholar]
  5. Codex Alimentarius Commission. Codex Standard for Fermented Milks; No. CODEX Stan; Alimentarius Commission: Roma, Italy, 2003; pp. 1–5. [Google Scholar]
  6. Sung, Y.M.; Cho, J.R.; Oh, N.S.; Kim, D.C.; In, M.J. Preparation and quality characteristic of curd yogurt added with chlorella. Appl. Biol. Chem. 2005, 48, 60–64. [Google Scholar]
  7. Yan, S.; Yang, B.; Stanton, C.; Ross, R.P.; Zhao, J.; Zhang, H.; Chen, W. Ropy exopolysaccharide-producing Bifidobacterium longum YS108R as a starter culture for fermented milk. Int. J. Food Sci. Technol. 2019, 54, 240–248. [Google Scholar] [CrossRef] [Green Version]
  8. Yoon, S.S. Review: Distribution, lactose malabsorption and alleviation strategies of lactose intolerance. Korean J. Dairy Sci. Technol. 2009, 27, 55–62. [Google Scholar]
  9. Schell, M.A.; Karmirantzou, M.; Snel, B.; Vilanova, D.; Berger, B.; Pessi, G.; Zwahlen, M.C.; Desiere, F.; Bork, P.; Delley, M.; et al. The genome sequence of Bifidobacterium longum reflects its adaptation to the human gastrointentinal tract. Proc. Natl. Acad. Sci. USA 2002, 99, 14422–14427. [Google Scholar] [CrossRef] [PubMed]
  10. Yaeshima, T.; Takahashi, S.; Matsumoto, N.; Ishibashi, N.; Hayasawa, H.; Iino, H. Effect of yogurt containing Bifidobacterium longum BB536 on the intestinal environment, fecal characteristics and defecation frequency: A comparison with standard yogurt. Biosci. Microflora 1997, 16, 73–77. [Google Scholar] [CrossRef] [Green Version]
  11. Lee, H.Y.; Hong, C.Y.; Jo, Y.J.; You, T.Y.; Shin, T.H.; Chung, M.N.; Lee, J.S.; Jeong, H.S. Changes in sugar content of Sweet Potatoes with changes in curing and storage conditions. J. Korean Soc. Food Sci. Nutr. 2021, 50, 1211–1217. [Google Scholar] [CrossRef]
  12. Miller, G.L. Use of dinitro salicylic acid reagent for determination of reducing sugar. Anal. Chem. 1959, 31, 426–428. [Google Scholar] [CrossRef]
  13. Kim, D.C.; Won, S.I.; In, M.J. Substitution effect of enzymatically hydrolyzed purple sweet potato powder on skim milk in yogurt preparation. J. Appl. Biol. Chem. 2015, 58, 311–316. [Google Scholar] [CrossRef] [Green Version]
  14. Sung, H.J.; Son, J.K.; Yu, J.H.; Jo, Y.J.; Kwak, J.E.; Lee, J.S.; Jeong, H.S. Quality Characteristics of Soy Milk Made from Different Soybean (Glycine max (L.) Merrill) Cultivar. J. Korean Soc. Food Sci. Nutr. 2022, 51, 855–860. [Google Scholar] [CrossRef]
  15. Hwang, C.R.; Oh, S.H.; Kim, H.Y.; Lee, S.H.; Hwang, I.G.; Shin, Y.S.; Lee, J.-S.; Jeong, H.-S. Chemical composition and antioxidant activity of Deoduk (Codonopsis lanceolata) and Doragi (Platycodon grandiflorum) according to temperature. J. Korean Soc. Food Sci. Nutr. 2011, 40, 798–803. [Google Scholar] [CrossRef]
  16. Ministry of Food and Drug Safety (MFDS). Food Code. Notification 2022-84; Ministry of Food and Drug Safety: Cheongju, Republic of Korea, 2022. [Google Scholar]
  17. Nguyen, L.; Hwang, E.S. Quality characteristics and antioxidant activity of yogurt supplemented with aronia (Aronia melanocarpa) juice. Prev. Nutr. Food Sci. 2016, 21, 330–337. [Google Scholar] [CrossRef] [PubMed]
  18. Hartati, A.I.; Pramono, Y.B.; Legowo, A.M. Lactose and reduction sugar concentrations, pH and sourness of date flavored yogurt drink as probiotic beverage. J. Appl. Food Technol. 2012, 1, 1–3. [Google Scholar]
  19. Popescu, L.; Bulgaru, V.; Siminiuc, R. Effect of temperature, pH and amount of enzyme used in the lactose hydrolysis of milk. Food Nutr. Sci. 2021, 12, 1243–1254. [Google Scholar] [CrossRef]
  20. Irma, V.W.; Claudia, L.V.; Maria, C.P. Effect of reduction of lactose in yogurts by addition of b-galactosidase enzyme on volatile compound profile and quality parameters. Int. J. Food Sci. Technol. 2014, 50, 1076–1082. [Google Scholar]
  21. Hadadji, M.; Bensoltane, A. Growth and lactic acid production by Bifidobecterium longum and Lactobacillus acidophilus in goat’s milk. Afr. J. Biotechnol. 2006, 5, 505–509. [Google Scholar]
  22. Won, J.I.; Lee, J.H.; Park, H.I.; Cho, Y.U.; Choi, I.D.; Lee, S.K.; Park, H.Y.; Park, J.Y.; Oh, S.K.; Han, S.I.; et al. Quality characteristics of commercial semisolid type yogurt in Korea. J. Korean Soc. Food Sci. Nutr. 2018, 47, 1185–1190. [Google Scholar] [CrossRef]
  23. Shin, K.S.; Lee, J.H. Evaluation of quality characteristic in commercial yogurt. Korean J. Food Preserv. 2018, 25, 195–204. [Google Scholar] [CrossRef]
Figure 1. Change of lactic acid content in yogurt added with Bifidobacterium longum and lactase. Each value is expressed as the mean ±standard deviation (n = 3); means in the same fermentation time (a–d) are significantly different (p < 0.05) by Duncan’s multiple range test.
Nutrients 15 03490 g001
Figure 2. Change of viscosity in yogurt added with Bifidobacterium longum and lactase. Each value is expressed as the mean ± standard deviation (n = 3); means in the same fermentation time (a–d) are significantly different (p < 0.05) by Duncan’s multiple range test.
Nutrients 15 03490 g002
Figure 3. Change of solid not fat content in yogurt added with Bifidobacterium longum and lactase. Each value is expressed as the mean ± standard deviation (n = 3); means in the same fermentation time (a–d) are significantly different (p < 0.05) by Duncan’s multiple range test.
Nutrients 15 03490 g003
Figure 4. Change in total lactic acid bacteria count in yogurt added with Bifidobacterium longum and lactase. Each value is expressed as the mean ± standard deviation (n = 3); means in the same fermentation time (a–d) are significantly different (p < 0.05) by Duncan’s multiple range test.
Nutrients 15 03490 g004
Table 1. Total sugar, reducing sugar, and lactose contents of yogurt added with Bifidobacterium longum and lactase.
B. longum
Concentration
(%)
Fermentation Time
(h)
Total Sugar
(mg/mL)
Reducing Sugar
(mg/mL)
Lactose
(%)
Control079.42 ± 0.65 a (1) (2)44.33 ± 0.25 a4.65 ± 0.02 a
279.16 ± 0.24 a52.13 ± 0.84 a1.37 ± 0.05 b
478.63 ± 0.81 a53.89 ± 1.69 a0.42 ± 0.00 c
676.02 ± 0.37 a52.12 ± 0.18 a0.36 ± 0.00 d
873.98 ± 0.31 a50.63 ± 0.09 a0.29 ± 0.01 c
0.001079.54 ± 0.22 a44.67 ± 1.55 a4.62 ± 0.01 a
279.10 ± 0.38 a51.41 ± 0.12 ab1.46 ± 0.05 ab
478.08 ± 0.05 a52.10 ± 0.37 ab0.56 ± 0.00 b
674.81 ± 0.45 b50.43 ± 0.10 b0.48 ± 0.01 c
872.61 ± 0.48 b48.93 ± 0.17 b0.39 ± 0.01 b
0.00125079.17 ± 0.42 a44.49 ± 1.21 a4.59 ± 0.01 a
278.97 ± 0.06 a49.93 ± 0.79 bc1.50 ± 0.07 a
477.48 ± 1.08 a51.44 ± 1.07 b0.59 ± 0.04 b
673.11 ± 0.65 c50.12 ± 0.47 b0.52 ± 0.02 b
871.40 ± 0.29 c47.95 ± 0.70 bc0.44 ± 0.02 a
0.0015079.42 ± 1.25 a44.12 ± 0.05 a4.62 ± 0.17 a
278.50 ± 1.25 a48.54 ± 1.65 c1.52 ± 0.01 a
476.14 ± 0.27 b50.19 ± 0.36 b0.62 ± 0.02 a
671.67 ± 0.11 d48.38 ± 0.89 c0.55 ± 0.02 a
869.91 ± 0.70 d46.97 ± 0.79 c0.47 ± 0.01 a
(1) Values are Mean ± SD (n = 3). (2) Different small letters (a–d) in the same column indicate a significant difference by Duncan’s range test (p < 0.05).
Table 2. pH and total acidity in yogurt added with Bifidobacterium longum and lactase.
B. longum
Concentration
(%)
Fermentation Time
(h)
pHTotal Acidity
(%)
Control06.67 ± 0.01 a (1) (2)0.10 ± 0.00 a
26.61 ± 0.02 a0.11 ± 0.00 b
45.84 ± 0.01 a0.19 ± 0.01 c
64.99 ± 0.01 a0.44 ± 0.01 d
84.69 ± 0.01 a0.59 ± 0.01 d
0.00106.67 ± 0.02 a0.10 ± 0.01 a
26.57 ± 0.02 b0.11 ± 0.00 b
45.69 ± 0.05 b0.22 ± 0.00 b
64.88 ± 0.05 b0.49 ± 0.00 c
84.69 ± 0.01 b0.65 ± 0.00 c
0.0012506.68 ± 0.01 a0.10 ± 0.01 a
26.49 ± 0.01 c0.16 ± 0.01 a
45.53 ± 0.01 c0.26 ± 0.00 a
64.84 ± 0.01 bc0.52 ± 0.01 b
84.47 ± 0.01 c0.68 ± 0.01 b
0.001506.68 ± 0.01 a0.10 ± 0.01 a
26.49 ± 0.01 c0.16 ± 0.01 a
45.53 ± 0.01 c0.26 ± 0.02 a
64.80 ± 0.01 c0.58 ± 0.01 a
84.42 ± 0.02 c0.76 ± 0.01 a
(1) Values are mean ± SD (n = 3). (2) Different small letters (a–d) in the same column indicate a significant difference by Duncan’s range test (p < 0.05).
Disclaimer/Publisher’s Note: The statements, opinions and data contained in all publications are solely those of the individual author(s) and contributor(s) and not of MDPI and/or the editor(s). MDPI and/or the editor(s) disclaim responsibility for any injury to people or property resulting from any ideas, methods, instructions or products referred to in the content.

