

A Systematic Literature Review of Nutrition Interventions Implemented to Address Food Insecurity as a Social Determinant of Health


Abstract
:1. Introduction
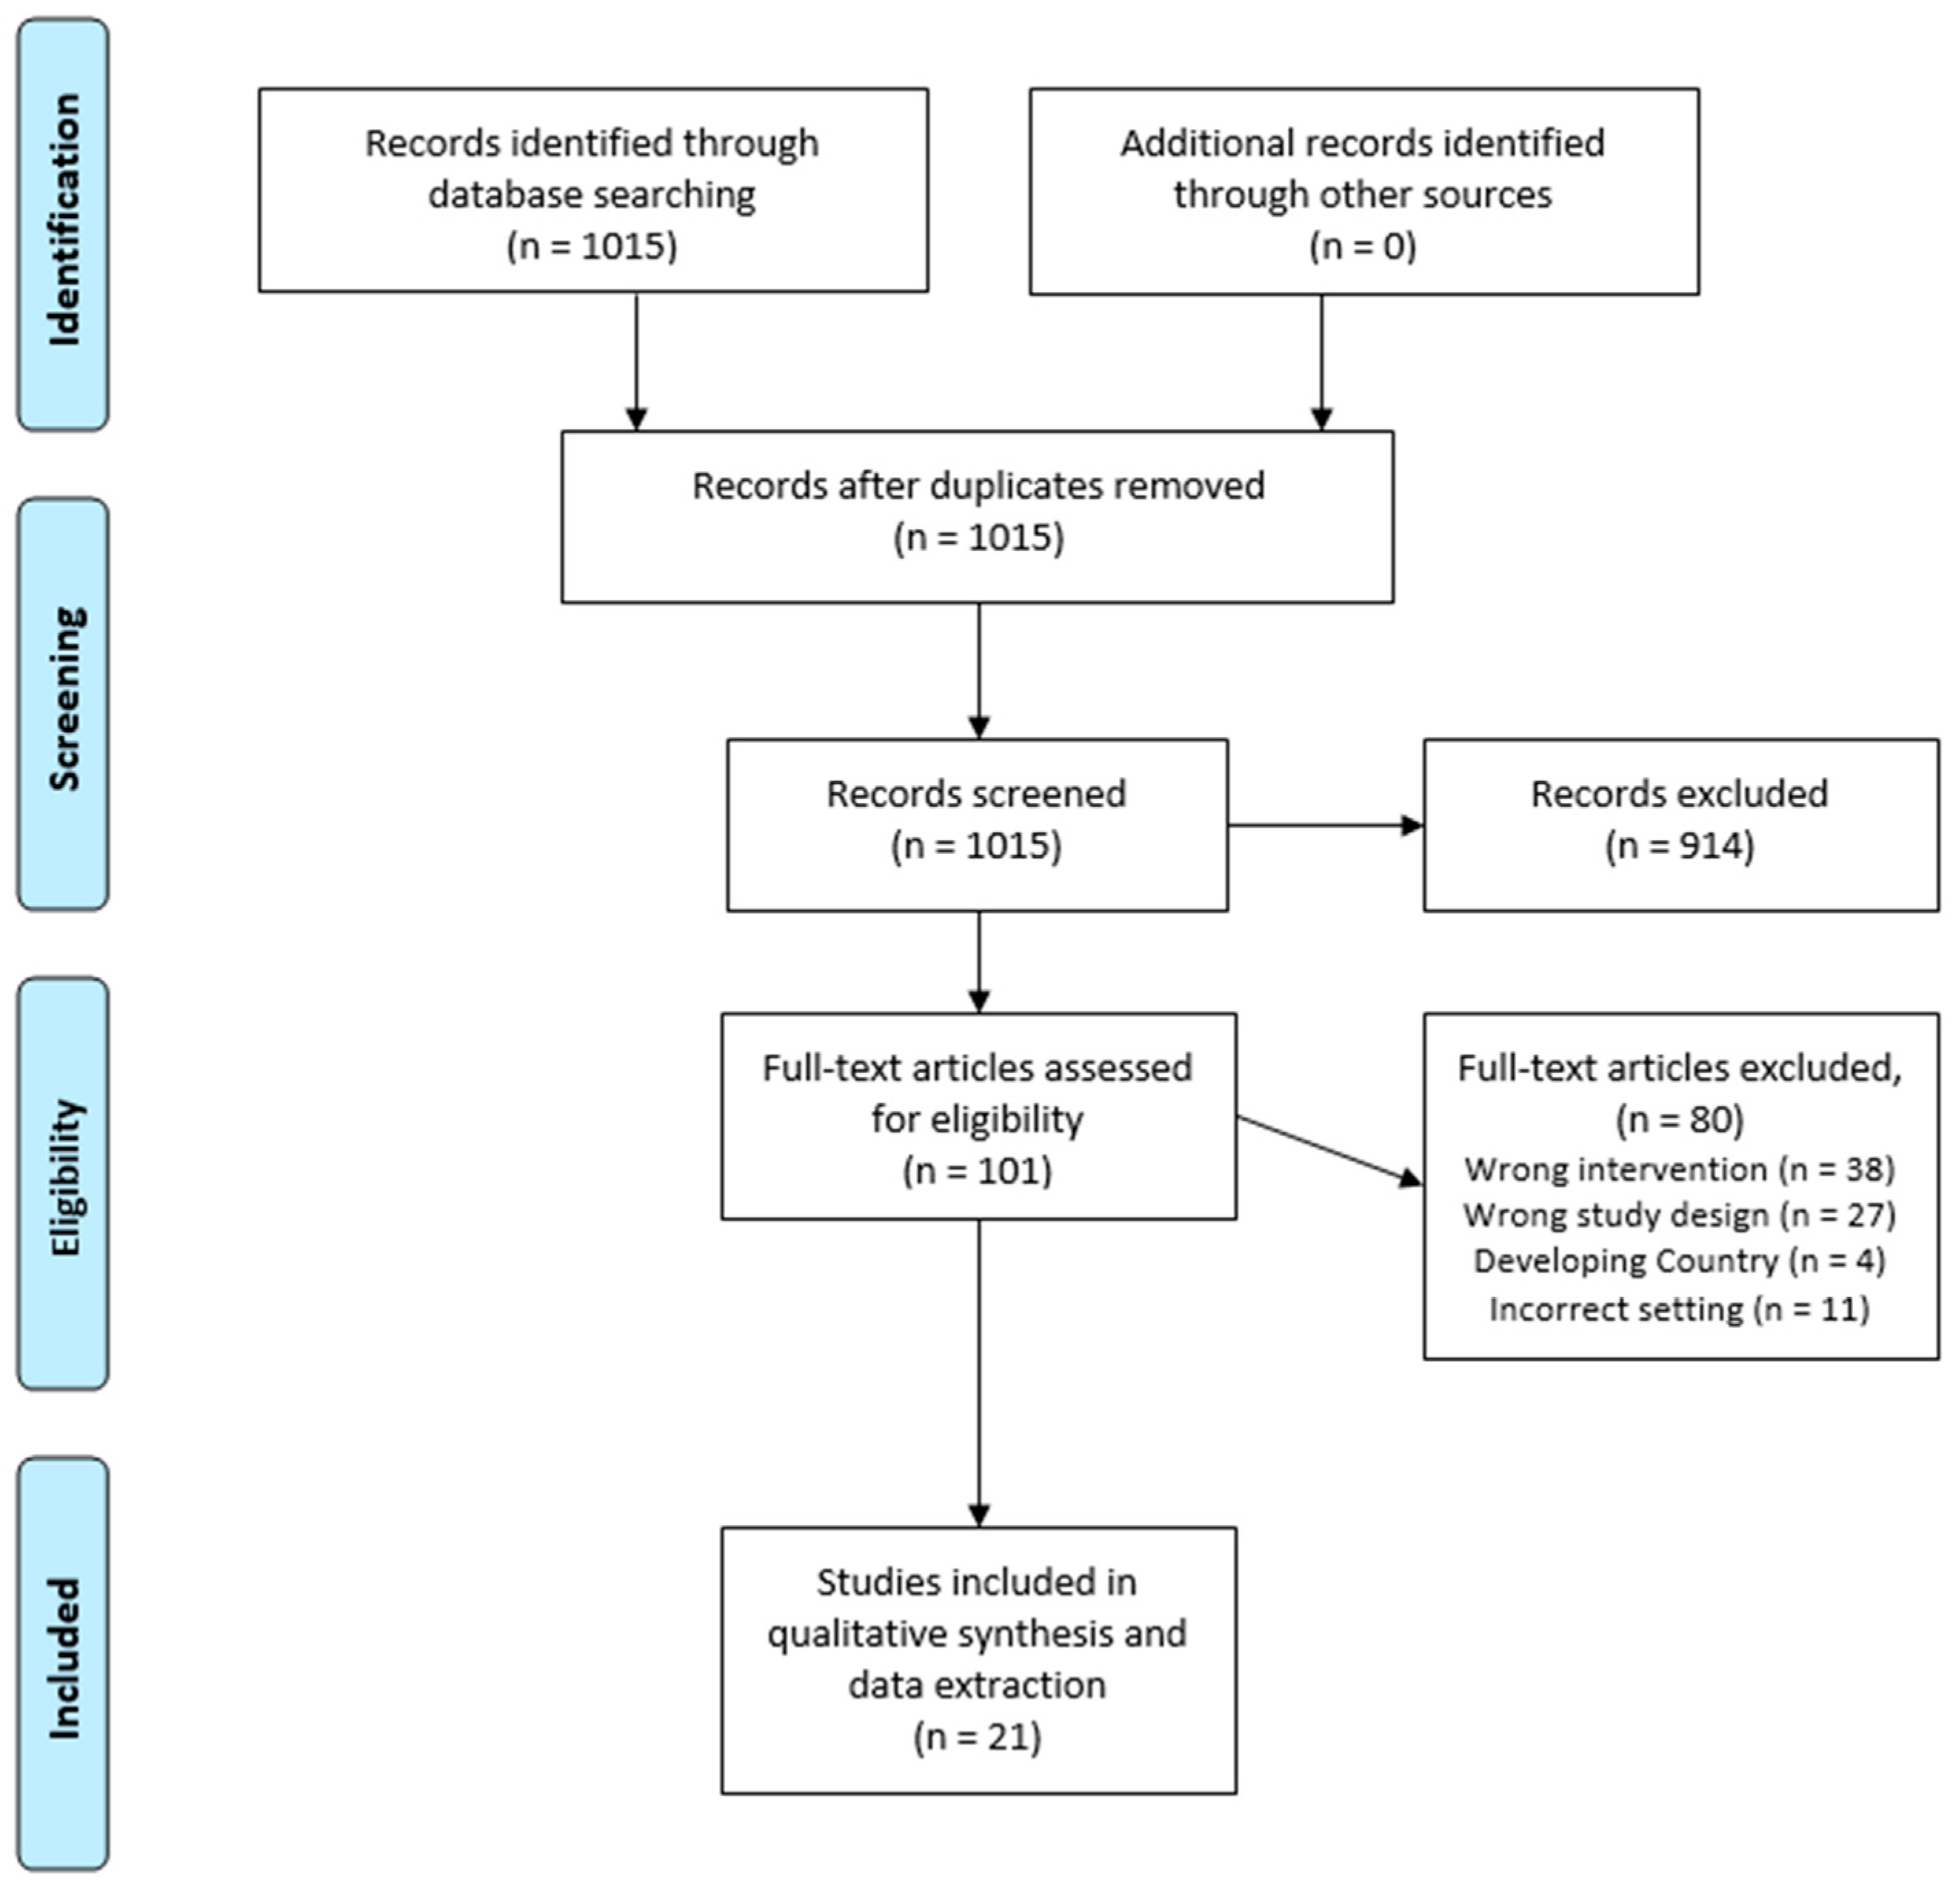
2. Materials and Methods
3. Results
4. Discussion
5. Conclusions
Author Contributions
Funding
Institutional Review Board Statement
Informed Consent Statement
Data Availability Statement
Conflicts of Interest
References
- Coleman-Jensen, A.; Rabbitt, M.P.; Gregory, C.A.; Singh, A. Household Food Security in the United States in 2021; U.S. Department of Agriculture: Washington, DC, USA, 2022.
- Berkowitz, S.A.; Gao, X.; Tucker, K.L. Food-insecure Dietary Patterns are Associated with Poor Longitudinal Glycemic Control in Diabetes: Results from the Boston Puerto Rican Health Study. Diabetes Care 2014, 37, 2587–2592. [Google Scholar] [CrossRef] [Green Version]
- Morales, M.E.; Berkowitz, S.A. The Relationship Between Food Insecurity, Dietary Patterns, and Obesity. Curr. Nutr. Rep. 2016, 5, 54–60. [Google Scholar] [CrossRef]
- Seligman, H.K.; Laraia, B.A.; Kushel, M.B. Food Insecurity Is Associated with Chronic Disease among Low-Income NHANES Participants. J. Nutr. 2010, 140, 304–310. [Google Scholar] [CrossRef] [Green Version]
- Berkowitz, S.A.; Terranova, J.; Randall, L.; Cranston, K.; Waters, D.B.; Hsu, J. Association Between Receipt of a Medically Tailored Meal Program and Health Care Use. JAMA Intern. Med. 2019, 179, 786. [Google Scholar] [CrossRef]
- Healthy Opportunities Pilots Deliver Nearly 24,000 Services to NC Medicaid Beneficiaries. Available online: https://www.ncdhhs.gov/blog/2023/01/11/healthy-opportunities-pilots-deliver-nearly-24000-services-nc-medicaid-beneficiaries (accessed on 12 April 2023).
- Healthy Opportunities Pilots. Available online: https://www.ncdhhs.gov/about/department-initiatives/healthy-opportunities/healthy-opportunities-pilots (accessed on 12 April 2023).
- Berkowitz, S.A.; Seligman, H.K.; Meigs, J.B.; Basu, S. Food Insecurity, Healthcare Utilization, and High Cost: A Longitudinal Cohort Study. Am. J. Manag. Care 2018, 24, 399–404. [Google Scholar]
- Social Determinants of Health. Available online: https://www.who.int/teams/social-determinants-of-health (accessed on 13 July 2023).
- Definitions of Food Security. Available online: https://www.ers.usda.gov/topics/food-nutrition-assistance/food-security-in-the-u-s/definitions-of-food-security/ (accessed on 23 August 2022).
- Gus Schumacher Nutrition Incentive Program (GusNIP). Available online: https://www.nifa.usda.gov/grants/programs/hunger-food-security-programs/gus-schumacher-nutrition-incentive-program (accessed on 27 April 2023).
- Medically Tailored Meals. Available online: https://acl.gov/senior-nutrition/medically-tailored-meals (accessed on 27 April 2023).
- Community Supported Agriculture. Available online: https://www.nal.usda.gov/farms-and-agricultural-production-systems/community-supported-agriculture (accessed on 27 April 2023).
- Moher, D.; Liberati, A.; Tetzlaff, J.; Altman, D.G. PRISMA Group Preferred Reporting Items for Systematic Reviews and Meta-analyses: The PRISMA Statement. PLoS Med. 2009, 6, e1000097. [Google Scholar] [CrossRef] [Green Version]
- EARS Frequently Asked Questions (FAQs) and Answers for Fiscal Year 2017 Reporting. Available online: https://snaped.fns.usda.gov/sites/default/files/documents/EARSGlossaryFinal.pdf (accessed on 7 June 2023).
- Aiyer, J.N.; Raber, M.; Bello, R.S.; Brewster, A.; Caballero, E.; Chennisi, C.; Durand, C.; Galindez, M.; Oestman, K.; Saifuddin, M.; et al. A Pilot Food Pprescription Program Promotes Produce Intake and Decreases Food Insecurity. Transl. Behav. Med. 2019, 9, 922–930. [Google Scholar] [CrossRef]
- Abel, D.; Drucker, G.; Leander, R.; Huber, C.; Nieto, A.; Hulse, E.; Kannan, N.; Rausch, J.C. Assessment of a Fruit and Vegetable Prescription Program in the Northern Manhattan Community. Am. J. Health Promot. 2022, 36, 1014–1018. [Google Scholar] [CrossRef]
- Cook, M.; Ward, R.; Newman, T.; Berney, S.; Slagel, N.; Bussey-Jones, J.; Schmidt, S.; Sun Lee, J.; Webb-Girard, A. Food Security and Clinical Outcomes of the 2017 Georgia Fruit and Vegetable Prescription Program. J. Nutr. Educ. Behav. 2021, 53, 770–778. [Google Scholar] [CrossRef]
- Fischer, L.; Bodrick, N.; Mackey, E.R.; McClenny, A.; Dazelle, W.; McCarron, K.; Mork, T.; Farmer, N.; Haemer, M.; Essel, K. Feasibility of a Home-Delivery Produce Prescription Program to Address Food Insecurity and Diet Quality in Adults and Children. Nutrients 2022, 14, 2006. [Google Scholar] [CrossRef]
- Forbes, J.M.; Forbes, C.R.; Lehman, E.; George, D.R. “Prevention Produce”: Integrating Medical Student Mentorship into a Fruit and Vegetable Prescription Program for At-Risk Patients. Perm. J. 2019, 23, 18–238. [Google Scholar] [CrossRef] [Green Version]
- Heasley, C.; Clayton, B.; Muileboom, J.; Schwanke, A.; Rathnayake, S.; Richter, A.; Little, M. “I was eating more fruits and veggies than I have in years”: A Mixed Methods Evaluation of a Fresh Food Prescription Intervention. Arch. Public Health 2021, 79, 135. [Google Scholar] [CrossRef]
- Kerr, D.; Barua, S.; Glantz, N.; Conneely, C.; Kujan, M.; Bevier, W.; Larez, A.; Sabharwal, A. Farming for Life: Impact of Medical Prescriptions for Fresh Vegetables on Cardiometabolic Health for Adults with or at risk of Type 2 Diabetes in a Predominantly Mexican-American Population. BMJ Nutr. Prev. Health 2020, 3, 239–246. [Google Scholar] [CrossRef]
- Oliveira, J.B.; To, L.; De La Cruz, Y.; Schneider, G.W. Prompting a Fresh Start for Adults With Food Insecurity and Increased BMI: A Case Series of Four Patients in a Food Prescription Program. Cureus 2021, 13, e13857. [Google Scholar] [CrossRef]
- Saxe-Custack, A.; LaChance, J.; Jess, J.; Hanna-Attisha, M. Influence of a Pediatric Fruit and Vegetable Prescription Program on Child Dietary Patterns and Food Security. Nutrients 2021, 13, 2619. [Google Scholar] [CrossRef]
- Slagel, N.; Newman, T.; Sanville, L.; Thompson, J.J.; Dallas, J.; Cotto-Rivera, E.; Lee, J.S. A Pilot Fruit and Vegetable Prescription (FVRx) Program Improves Local Fruit and Vegetable Consumption, Nutrition Knowledge, and Food Purchasing Practices. Health Promot. Pract. 2023, 24, 62–69. [Google Scholar] [CrossRef]
- Veldheer, S.; Scartozzi, C.; Bordner, C.R.; Opara, C.; Williams, B.; Weaver, L.; Rodriguez, D.; Berg, A.; Sciamanna, C. Impact of a Prescription Produce Program on Diabetes and Cardiovascular Risk Outcomes. J. Nutr. Educ. Behav. 2021, 53, 1008–1017. [Google Scholar] [CrossRef]
- Wu, J.H.; Trieu, K.; Coyle, D.; Huang, L.; Wijesuriya, N.; Nallaiah, K.; Lung, T.; Di Tanna, G.L.; Zheng, M.; Mozaffarian, D.; et al. Testing the Feasibility and Dietary Impact of a “Produce Prescription” Program for Adults with Undermanaged Type 2 Diabetes and Food Insecurity in Australia. J. Nutr. 2022, 152, 2409–2418. [Google Scholar] [CrossRef]
- Xie, J.; Price, A.; Curran, N.; Østbye, T. The Impact of a Produce Prescription Programme on Healthy Food Purchasing and Diabetes-related Health Outcomes. Public Health Nutr. 2021, 24, 3945–3955. [Google Scholar] [CrossRef]
- York, B.; Kujan, M.; Conneely, C.; Glantz, N.; Kerr, D. Farming for Life: Pilot Assessment of the Impact of Medical Prescriptions for Vegetables on Health and Food Security among Latino Adults with Type 2 Diabetes. Nutr. Health 2020, 26, 9–12. [Google Scholar] [CrossRef]
- Berkowitz, S.A.; Delahanty, L.M.; Terranova, J.; Steiner, B.; Ruazol, M.P.; Singh, R.; Shahid, N.N.; Wexler, D.J. Medically Tailored Meal Delivery for Diabetes Patients with Food Insecurity: A Randomized Cross-over Trial. J. Gen. Intern. Med. 2018, 34, 396–404. [Google Scholar] [CrossRef] [PubMed] [Green Version]
- Kempainen, S.; Cutts, D.B.; Robinson-O’Brien, R.; De Kesel Lofthus, A.; Gilbertson, D.T.; Mino, R. A Collaborative Pilot to Support Patients with Diabetes through Tailored Food Box Home Delivery. Health Promot. Pract. 2023; online ahead of print. [Google Scholar] [CrossRef]
- Palar, K.; Napoles, T.; Hufstedler, L.L.; Seligman, H.; Hecht, F.M.; Madsen, K.; Ryle, M.; Pitchford, S.; Frongillo, E.A.; Weiser, S.D. Comprehensive and Medically Appropriate Food Support Is Associated with Improved HIV and Diabetes Health. J. Urban Health 2017, 94, 87–99. [Google Scholar] [CrossRef] [Green Version]
- Tester, J.M.; Leak, T.M. Fiber-rich Foods Delivered to Low-Income Households: A Feasibility Study of Children with Prediabetes and Spillover Effect on their Caregivers. Prev. Med. Rep. 2021, 24, 101511. [Google Scholar] [CrossRef]
- Izumi, B.T.; Higgins, C.E.; Baron, A.; Ness, S.J.; Allan, B.; Barth, E.T.; Smith, T.M.; Pranian, K.; Frank, B. Feasibility of Using a Community-Supported Agriculture Program to Increase Access to and Intake of Vegetables among Federally Qualified Health Center Patients. J. Nutr. Educ. Behav. 2018, 50, 289–296. [Google Scholar] [CrossRef]
- Berkowitz, S.A.; O’Neill, J.; Sayer, E.; Shahid, N.N.; Petrie, M.; Schouboe, S.; Saraceno, M.; Bellin, R. Health Center–Based Community-Supported Agriculture: An RCT. Am. J. Prev. Med. 2019, 57, S55–S64. [Google Scholar] [CrossRef] [Green Version]
- Craigie, A.M.; Lake, A.A.; Kelly, S.A.; Adamson, A.J.; Mathers, J.C. Tracking of obesity-related behaviours from childhood to adulthood: A systematic review. Maturitas 2011, 70, 266–284. [Google Scholar] [CrossRef] [Green Version]
- Kirkpatrick, S.; Collins, C.; Keogh, R.; Krebs-Smith, S.; Neuhouser, M.; Wallace, A. Assessing Dietary Outcomes in Intervention Studies: Pitfalls, Strategies, and Research Needs. Nutrients 2018, 10, 1001. [Google Scholar] [CrossRef] [Green Version]
- Veldheer, S.; Scartozzi, C.; Knehans, A.; Oser, T.; Sood, N.; George, D.R.; Smith, A.; Cohen, A.; Winkels, R.M. A Systematic Scoping Review of How Healthcare Organizations Are Facilitating Access to Fruits and Vegetables in Their Patient Populations. J. Nutr. 2020, 150, 2859–2873. [Google Scholar] [CrossRef]
- Bhat, S.; Coyle, D.H.; Trieu, K.; Neal, B.; Mozaffarian, D.; Marklund, M.; Wu, J.H.Y. Healthy Food Prescription Programs and their Impact on Dietary Behavior and Cardiometabolic Risk Factors: A Systematic Review and Meta-Analysis. Adv. Nutr. 2021, 12, 1944–1956. [Google Scholar] [CrossRef]
- Status of State Medicaid Expansion Decisions: Interactive Map. Available online: https://www.kff.org/medicaid/issue-brief/status-of-state-medicaid-expansion-decisions-interactive-map/ (accessed on 30 May 2023).


| Characteristic | Number of Studies (%) |
|---|---|
| Type of intervention | |
| CSA | 4 (19.0%) |
| MTM | 4 (19.0%) |
| Produce Rx | 13 (61.9%) |
| Provided Nutrition Education | 8 (38.1%) |
| Outcomes | |
| BMI | 10 (47.6%) |
| Dietary intake | 17 (81.0%) |
| Food security changes | 13 (61.9%) |
| Disease Improvements | 14 (66.7%) |
| Feasibility | 12 (57.1%) |
| Cost-related outcomes | 4 (19.0%) |
| Age group | |
| Adults | 15 (71.4%) |
| Families | 4 (19.0%) |
| Children | 2 (9.5%) |
| Citation | Program Type | Setting | Eligibility Criteria | N | Study Design and Dates of Data Collection | Intervention Description | Nutrition Education Included? | Race/Ethnicity, Gender | Mean Age (SD), in Years | Socioeconomic Indicators | Adults, Families, or Children |
|---|---|---|---|---|---|---|---|---|---|---|---|
| Aiyer et al., 2019 [16] | Produce RX | Two school-based clinics and one federally qualified health center, Harris County, North Pasadena, Texas | An age of 18 or older, food insecure, resided in one of three targeted zip codes | 242 enrolled, 172 redeemed vouchers | Quasi-experimental pre-post; September 2016–May 2017 | 6-month prescription eligible for redemption every 2 weeks; 12 redemptions and 30 lbs. of produce per redemption | Yes | 79.7% Hispanic, 3.5% African American, 79.1% female | 47.3 (13.6) | Adult patients and parents of pediatric patients | |
| Abel et al., 2022 [17] | Produce RX | Irving Medical Center in Northern Manhattan, New York | English- and Spanish-speaking patients, June and November 2019 | 242 | Retrospective, cross-sectional study; baseline, June–November 2019; follow-up, November 2019–February 2020 | 6 months; $10 for food secure or $20 for food insecure patients for prescription for fruits and vegetables from local greenmarkets | No | 48% of redeemers and 37% of non-redeemers spoke Spanish; gender not assessed | Mean age not provided; 30% pediatric and 70% adult | Redeemers: 56% SNAP, 30% WIC. Non-Redeemers: 42% SNAP, 47.5% WIC | Patients and parents/guardians of pediatric patients |
| Cook et al., 2021 [18] | Produce RX | Six primary care and community-based sites across Atlanta, Athens, and Augusta, Georgia | SNAP eligible or screened positive for food insecurity, and diagnosed or at risk of ≥1 diet-related chronic conditions | 122 program graduates, with 63 lost to follow-up | Quasi-experimental pre-post; April–August 2017 | 6-month group-based nutrition and hands-on cooking education along with nutrition subsidies for fresh produce worth $1 per family member per day, redeemable weekly | Yes | 78.7% African American, 77.0% female | Mean age not provided; 50% were aged 45–64 years | Program graduates: 61.7% any public assistance, 57% SNAP, 4.7% WIC | Adults |
| Forbes et al., 2019 [20] | Produce RX | Medical Center in Hershey, Pennsylvania, and two local farmers markets | Families or individuals aged from 5 to 75 years, patients identified by physician as being at-risk of chronic illness, with difficulty obtaining fruits and vegetables | 10 enrolled, and 9 completed the program | Quasi-experimental pre-post; Fall 2015 | 6 weeks; $40 per visit to spend on produce at a farmer’s market for a total of four farmer’s market visits | Yes | 66.7% African American, 22.2% white, 11.1% unknown 55.6% female | Mean age not provided | 66.7% had a total family income below $40,000 | Adults and children |
| Heasley et al., 2021 [21] | Produce RX | Two community health center locations in Guelph, Ontario, Canada | Food insecure ≥ 1 cardio-metabolic conditions or micronutrient deficiency | Total of 60; 36 responded to follow-up surveys | Quasi-experimental, pre/post; September 2019–June 2020 | 12 weeks; 12 vouchers to the Community Food Market, valued at $10/person with a household maximum of $50/household | No | Not assessed | 47.2 (12.5) | 52% receiving disability support; 40% with income between $10,000–19,999 | Adults |
| Kerr et al., 2020 [22] | Produce RX | A diabetes research Institute, Santa Barbara County, California | Age of 18 years or older, Type 2 Diabetes for at least 6 months or at-risk of Type 2 Diabetes | 159 | Quasi-experimental, pre/post; February 2019–March 2020 | 10 weeks; 10 weekly prescriptions with 21 servings/week of fresh vegetables | No | 75% Hispanic, 20% white, 2.5% African American, 2% Asian, 0.5% Native American; 76.7% female | 52.5 (13.2) | 35% uninsured | Adults |
| Oliveira et al., 2021 [23] | Produce RX | Health Center, South Miami, Florida | Food insecure, BMI > 40, or BMI 35 with ≥2 chronic conditions | 4 (10 were initially recruited) | Prospective case report; no dates provided | 4 months; biweekly packages of fresh fruits and vegetables | Yes | 25% African American, 25% Hispanic, 50% Haitian American 100% female | Not provided | 100% uninsured | Adults |
| Saxe-Custack, et al., 2021 [24] | Produce RX | Children’s Clinic in Flint, Michigan | Caregiver whose child was between ages of 8 and 18 years, food insecure, English-speaking | Total of 122 caregiver-child dyads (244 participants) | Quasi-experimental, pre/post; August 2018–March 2020 | 12 months; $15 prescription for fruits and vegetables during each clinic visit | No | Child’s race: 63% African American, 27% white, 10% not reported/other; Caregiver’s race: 59% African American, 29% white, 12% other/not reported Child’s gender: 52% female; Caregiver gender: 93% female | Child’s mean age: 12.42 (2.78), caregiver mean age 39.94 (10.28) | Caregiver: 37% HS degree or less, 43% some college/technical degree, 19% Bachelor’s degree or more | Children |
| Slagel et al., 2023 [25] | Produce RX | Nurses Clinic, Athens, Georgia | Age of 18 years or older, SNAP eligible or otherwise underserved, diagnosis of ≥1 diet-related chronic conditions | 24 (16 intervention and 8 control participants) | Non-randomized controlled trial; June–December 2017 | 6 months; participants received a produce prescription every month, worth $1/day per household member, redeemed once per week at the local farmers’ market | Yes | 57.4% white, 37.5% Hispanic 79.6% female | 47.5 (11.3) | 90.7% uninsured, 98.1% annual household income ≤ $25,000 | Adults |
| Veldheer et al., 2021 [26] | Produce RX | Hospital in Reading, Pennsylvania | Age of 18 years or older, Type 2 diabetes, HbA1c > 7.0%, BMI of ≥25 | 97 | Quasi-experimental with a single arm pre/post; June 2018–May 2019 | 7 months; the monthly dollar amount equivalent to $1/household member/day for 28 days (range, $28–$140/month), with vouchers provided in $2 increments | No | 81.4% Hispanic, 12.4% white, 6.2% African American; 66% female | 53.8 (11.6) | 65.9% SNAP recipients, 89.4% food insecure | Adults |
| Wu et al., 2022 [27] | Produce RX | Hospital in Sydney, Australia | Age of 18 years or older, Type 2 diabetes, food insecure | 50 (49 completed 6-week and 46 completed 12-week dietary assessments) | Quasi-experimental, pre/post; November 2020–October 2021 | 12 weeks; prescriptions for food were designed for 2 meals/day, 5 days per week including fruits, vegetables, beans/legumes, whole grains, plain milks, cheese, and plant-based fats | Yes | African or Middle Eastern 2%, Asian 12%, European 34%, Oceanian 42%, Peoples of the Americas 10%; 46% female | 63.0 (9.0) | 60% total annual household income < $25,948 | Adults |
| Xie et al., 2021 [28] | Produce RX | Federally qualified health center, outpatient clinic serving low-income patients and two organizations in Durham, North Carolina | Age of 18 years or older, SNAP recipients, had grocery store loyalty card | 699 | Prospective cohort study; grocery store data, April 2018–June 2019; Electronic Health Record data, November 2017–June 2019 | 12 months; $40 monthly voucher was given to participants to spend at a grocery store chain | No | 81.4% African American, 11.6% white, 5.3% Hispanic, 1.7% other; 72.4% female | 58.5 | 86.8% Medicaid, Medicare, were uninsured, or insurance coverage other than private insurance | Adults |
| York et al., 2020 [29] | Produce RX | Local social services, Latino-focused community organizations, and existing diabetes programs | Hispanic participants with self-reported type 2 diabetes diagnosis | 21 | Quasi-experimental, pre/post; no dates provided | 12 weeks; medically prescribed organic vegetables provided weekly | No | 100% Hispanic; 91% female | 56 (11.1) | Not reported | Adults |
| Berkowitz et al., 2019 [5] | MTM | Community health center in Boston, Massachusetts | Age of 18 years or older, reside in the targeted area, captured in the Massachusetts All-Payer Claims Database at least 360 days before the study | 1020 | Retrospective cohort study; MA All-Payer Claims Database from 2011–2015; study conducted December 2016–January 2019. | Mean duration of receipt of meals was 12.4 (10.6) months; weekly delivery of 10 ready-to-consume meals tailored to specific medical needs under supervision of a dietitian | No | 23.8% White, 13.5% African American, 4.5% Hispanic, 1.7% Multiracial/other, 56.6%, information not provided 5; 53.3% female | 52.7 (14.5) | 9.7% living in poverty, 20.9% Medicare recipients, 56.3% Medicaid recipients | Adults |
| Berkowitz et al., 2018 [30] | MTM | Primary care networks and physicians in Eastern Massachusetts | Age of 18 years or older, diagnosed with type 2 diabetes, A1c > 8% in the last year, food insecure, reside in targeted area | 42 | Randomized, cross-over trial; June 2015–July 2017 | 24 weeks: 12 weeks of once-a week delivery of 10 refrigerated and/or frozen meals, followed by 12-week wash-out period | No | Intermediate: 25% African American, 50% white, 20% Hispanic, 5% other; Delayed: 27% African American, 59% white, 14% Hispanic, 0% other; Female 65%; immediate, 73% delayed | Immediate, 57.66 (12.25), 59.21 (13.11) | Immediate: 108.56 of Federal Poverty Level (FPL); Delayed: 170.38 FPL (median income level was 140% of the FPL) | Adults |
| Kempainen et al., 2023 [31] | MTM | Healthcare organization and community-based organization, Minneapolis, Minnesota | Type 2 Diabetes diagnosis, age of 21 to 70 years, receiving care at Hennepin healthcare, screened positive for food insecurity | 281 | Randomized, controlled prospective pilot study; no dates provided | 24 weeks; every 2 weeks, home-delivered meal boxes (30–33 pounds) tailored to nutritional needs and ethnic food preferences | No | 67% African American, 21% White, 9% Native American, 3% Hispanic, 7% Pacific Islander/Asian or other; Gender not assessed | 55.6 | 50% disabled, 13% employed part-time, 7% employed full-time, 13% unemployed, 11% retired, and 6% home-maker/other. | Adults |
| Palar et al., 2017 [32] | MTM | San Francisco Bay area, California | Current client, living with HIV or type 2 diabetes, English- or Spanish-speaking, age of 18 years or older, low-income under 300% of FPL | 52 | Quasi-experimental pre/post; April 2014–June 2015 | 6 months; meals and snacks picked up 2/week to provide 100% of daily caloric requirements tailored to meet nutritional guidelines | No | 28.9% African American, 28.9% White, 21.2% Hispanic, 9.62% Native American, 1.92%, Asian/Pacific Islander, 9.62% other/mixed; 34.9% female | 57.2 (9.8) | 17.3% employed, 21.6% on SNAP; less than high school/GED 13.5%, high school/GED 17.3% | Adults |
| Fischer et al., 2022 [19] | CSA | Outpatient clinics, Washington DC | Adults with young children, ages of 0–5 years, food insecure, diet-related chronic disease risk factor | 25 families | Quasi-experimental pre-post; recruitment in December 2020. | 12 months; families received a 12-month supply of bi-weekly deliveries of fresh produce; produce delivery included approximately 8 lbs. of seasonal, locally-sourced fresh fruits and vegetables | Yes | 100% African American; 100% female | 29.9 (5.8) | 40% had less than $10,000 per year for income | Families with children |
| Tester and Leak, 2021 [33] | CSA | Children’s Hospital and Research Center, Oakland, California | 8–17 years of age, confirmed diagnosis of prediabetes, low SES households (enrolled in public insurance), ≥1 primary care giver, residing in targeted zip codes | 47 | Quasi-experimental, pre/post; enrollment January–June 2017 and follow-up May–October 2017. | 16 weeks; CSA shares had approximately 1/2 serving of vegetables per person/day; bi-weekly deliveries included two 15-oz cans or 1 lbs. of dried beans/legumes and at least 1-oz-eq/day of whole grains per person | Yes | Children: 26% African American, 66% Hispanic, 2% Asian, 6% Mixed/other; Caregivers: 2% White, 24% African American, 72% Hispanic, 2% Asian; Children: 47% female; Caregivers: 96% female | Children: 12.9 (2.4); Adults: 43.0 (9.8) | 59% of households had an annual household income ≤ $30,000, received SNAP (52.5%), and were food-insecure (55%) | Children |
| Izumi et al., 2017 [34] | CSA | Multnomah County Health Department, Portland, Oregon | Patient of FQHC; had to speak Spanish or English | 25 | Quasi-experimental, pre/post; intervention began June 2015 | 23 weeks; subsidized CSA share; most participants paid $5/week and the remainder of the costs were funded through a grant | No. | Race: 4% African American, 56% white, and 24% other; Race/ethnicity: 40% Hispanic; 92% female | 64% between 35 and 60 years of age | 64% on SNAP; Highschool degree or less 24%, some college 44%, college degree or more 24% | Adults |
| Berkowitz et al., 2019 [35] | CSA | Health Center, Franklin County, Massachusetts | 18 or older, BMI of >25 kg/m2, seen at the community center or lived in surrounding area | 122 | Randomized controlled trial; May 2017–December 2018 | 24 weeks; received $300 to buy a CSA share from a local farm | No | 90.2% White, 2.5% African American; 1.6% Hispanic, 5.7%, Asian/multi/other; 82% Female | 50.3 (13.6) | Median income = 146% of the FPL, 39.2% received SNAP benefits, 36.7% food insecure | Adults |
| Citation | BMI | Dietary Intake | Food Insecurity | Condition Improvements | Feasibility | Cost-Related Outcomes |
|---|---|---|---|---|---|---|
| Aiyer et al., 2019 [16] | Not reported | 99% reported eating most or all of the provided food | Food insecurity decreased significantly (94.1% decrease) | Not reported | 73.1% participation rate of total screened candidates, 172 Rx redeemed on average, participants redeemed 6.5 times of the available 12 redemptions | $12.20 per family per redemption |
| Abel et al., 2022 [17] | No statistically significant changes in BMI. | Not reported | Patients who were food insecure at baseline were more likely to redeem their prescription than those not food insecure at baseline | Those who redeemed their vouchers were more likely to have elevated hemoglobin A1c than non-redeemers | Of the 2368 prescriptions distributed from June to November 2019, 49.3% were redeemed | Not reported |
| Cook et al., 2021 [18] | No statistically significant changes in BMI. | Not reported | 42% had increased food security | Program Graduates had lower diastolic blood pressure, smaller waist circumferences, and lower baseline triglycerides. Unadjusted estimates indicate that diastolic blood pressure was modestly but significantly reduced by 0.73 mmHg for every visit completed | Participant retention from the first to the third visit was 64.0%, while retention from the first to the last visit was 22.6% | Not reported |
| Fischer et al., 2022 [19] | Not reported | Children’s fruit and vegetable intake increased: 43% increase in average daily fruit intake (p = 0.02) and 29% increase in average daily vegetable intake (p = 0.21) | Food insecurity decreased from baseline to post-intervention, but the decrease was not statistically significant | Not reported | 77.5% reported produce was used or frozen for future use, 80% were very or completely satisfied with produce variety, attendance at classes was 63.1% per participant, and retention was 60% at 12 months | Not reported |
| Forbes et al., 2019 [20] | Not reported | Daily fresh fruit consumption increased from 37.5% before the program to 62.5% after the program. Green vegetable intake of one serving/week increased from 62.5% to 87.5%, and orange-colored vegetable intake increased from 38% to 87.5% | Not reported | Not reported | Not reported | Not reported |
| Heasley et al., 2021 [21] | Not reported | Increased F/V intake by two servings extra per day on average. Weekly intake of fruits increased from 4.7 to 8.5 (p = 0.05) and other vegetables increased from 3.5 to 5.2 (p = 0.02) | At follow-up, 26 respondents improved their adult food security scores (74%), six households had poorer scores (17%), and three (8.6%) had no change compared to baseline scores | No changes in self-reported mental or physical health | Not reported | Not reported |
| Kerr et al., 2020 [22] | Not reported | Drop in intake of tortillas and soda, and frequency of vegetable intake increased significantly, with 50% of 120 participants consuming vegetables at least once per day compared with 15% at baseline (p < 0.0001) | Proportion of low or very low food security at enrollment was 35% and dropped to 13% after 3 months (p < 0.001). | Waist circumference reduced (−0.77, p = 0.022), systolic BP reduced (−2.42, p = 0.037), weight reduced (−0.4 kg, p = 0.029), and HbA1c decreased by −0.35% (p = 0.009). | Not reported | Not reported |
| Oliveira et al., 2021 [23] | Not reported | Increase in weekly fruit consumption, including increase in fruit servings per day | Not reported | Not reported | Not reported | Not reported |
| Saxe-Custack, et al., 2021 [24] | Not reported | Increase in mean child-reported daily intake of vegetables (p = 0.001), whole grains (p = 0.001), fiber (p = 0.008), and dairy (p < 0.001) | Household food security improved (p < 0.001) from baseline (1.96 ± 2.20) to follow-up (0.87 ± 1.25); child-reported food security improved from baseline (p = 0.01) | Not reported | 5953/7827 eligible patients received prescriptions for a 76% distribution rate | Not reported |
| Slagel et al., 2023 [25] | Not reported | Intervention group reported increased fruit and vegetable intake, 0.81 (SD = 0.91) serving/day, versus control group, −0.25 (SD = 0.99) serving/day (p = 0.02) | Not reported | Not reported | Not reported | Not reported |
| Veldheer et al., 2021 [26] | No statistically significant changes in BMI | There was a 0.49 times/day increase in combined F&V intake at follow-up, but this was not statistically significant | Not reported | There was a −1.3% decrease (p < 0.001) in HbA1c | DSME retention was 62%; the voucher redemption rate was 83.4% and the voucher redemption rate-intention to treat was 53%. Participants attended an average of 3.6 nutrition sessions and all 7 visits were completed by 45.4% of participants | On average, participants received a total of $353 in vouchers and redeemed a total of $295 |
| Wu et al., 2022 [27] | Statistically significant reductions in BMI (−0.67) (p = 0.002) | Mean AHEI scores increased 52.3 to 65.2 pre/post intervention. Seven components of the AHEI increased from pre/post intervention. There were no changes in the biomarkers assessed (Vitamin C, zinc, and magnesium) | Food insecurity decreased from 82% at baseline to 0% at 12-week follow-up | Improvements in mean total cholesterol (−0.28), LDL (−0.23), HDL (0.06), and total HDL cholesterol ratios (−0.48) (p < 0.001) | All who participated had at least one dietitian consultation, and 74% participated in all consultations | Not reported |
| Xie et al., 2021 [28] | No statistically significant changes in BMI | “Frequent Spenders” had increased fruit and vegetable variety and the number of unique FV items in a month. Higher program utilization was correlated with higher FV purchasing. Frequent Spender status was correlated with higher monthly FV spending | Not reported | Program utilization was not associated with diabetes diagnosis, systolic blood pressure, or Emergency Department visits | Not reported | Not reported |
| York et al., 2020 [29] | Not reported | Not reported | Food insecurity improved in 12/21 (57.1%) of participants | Reduction in systolic and diastolic blood pressure (p = 0.03 and 0.01, respectively). A total of 14 (67%) lost weight (median weight loss = 1.9 pounds), and waist circumference decreased in 9/19 (47.4%) responders (median = 1.5 inches) | Not reported | Average retail cost was $31.33 per week per participant |
| Berkowitz et al., 2019 [5] | Not reported | Not reported | Not reported | Significantly fewer in-patient admissions (incidence rate = 0.51) and fewer skilled nursing facility admissions (incidence rate ratio = 0.28) | Not reported | Mean monthly costs would have been $3838 vs. $4591 if no one had been encouraged into treatment. Medical cost reduction was estimated at $712 (95% CI, $1930 lower to $505 higher) per month |
| Berkowitz et al., 2018 [30] | No statistically significant changes in BMI. | Mean HEI score while participants were receiving the MTM was 71.3 (SD 7.5), while mean HEI score when not receiving the meals was 39.9 (SD 7.8) (difference 31.4 points, p < 0.0001), with improvements in almost all sub-categories of the HEI scores | 42% reporting food insecurity during “on-meal” vs. 62% during “off-meal” period (p = 0.047) | Patient-reported reductions in hypoglycemia, with 47% reporting hypoglycemia while receiving the MTM vs. 64% while not receiving the MTM (p = 0.03) | Not reported | Not reported |
| Kempainen et al., 2023 [31] | No statistically significant changes in BMI | No statistically significant changes in fruit or vegetable intake | At baseline, 100% of participants were food insecure, while at follow-up, 87% of the control group and 78% of the treatment group were food insecure (p = 0.07) | Hb1Ac for control at baseline vs. follow-up = 7.89 vs. 7.78; for intervention at baseline vs. follow-up = 7.99 vs. 7.64, p = 0.46 | 93% satisfaction rate; 89% reported assistance in managing their diabetes; 89% either liked the food, used the food, and found the recipes helpful; and 98% of deliveries were made | Not reported |
| Palar et al., 2017 [32] | BMI decreased from 31.2 to 30.1 (p = 0.08). Among those with type 2 diabetes, BMI decreased from 36.1 to 34.8 (p = 0.035) | Frequency of consuming fatty foods decreased from 3.19 vs. 2.21 times per day (p = 0.003); FV intake increased 1.85 to 2.34 times per day (p = 0.011) | Very low food security affected 59.6% of participants at baseline vs. 11.5% at follow-up. High food security was 9.62% at baseline and 53.9% at follow-up | Among those with HIV, adherence to ARV therapy increased from 47% to 70%. Diabetes management improved. At follow-up participants reported fewer depressive symptoms (7.58 vs. 5.84, p = 0.028). Trends toward fewer hospitalizations and ED visits | Adherence to food pick-up was 93%. 78.9% reported eating all or most of the intervention food, and 90.4% reported throwing away intervention food at some point. | Not reported |
| Tester et al., 2021 [33] | BMI increased 0.5 mg/kg2 (p < 0.05) though the change in BMI z-score was not statistically significant | Whole grain consumption increased from 1.7 to 2.5 oz.-eq./day (p < 0.001). Total vegetable intake was unchanged from baseline to follow-up | Not reported | At follow-up, there was a statistically significant 12% increase in serum triglycerides; mean HbA1c was 5.62%, which was significantly lower than the eligibility HbA1c, at the initial study visit (p < 0.001). There were no statistically significant changes in other outcomes (fasting glucose, insulin, HOMA-IR, and HDL and LDL cholesterol) | At follow-up, 97% of participants reported having the cooking education binder given to them at the beginning of the study; 60% prepared some of the recipes; 96% received study text messages and 45% reported they or someone in their household watched the cooking videos. 30% said they or someone in the household had prepared a food-based recipe based on what they learned | Not reported |
| Izumi et al., 2017 [34] | Not reported | At baseline, 25% ate ≥ 2 cups/day of vegetables, versus 50% at follow-up (p = 0.38) | Not reported | Not reported | 56% reported almost no waste, 33% reported ≥ 2 items wasted, and 11% reported 1 item wasted | Not reported |
| Berkowitz et al., 2019 [35] | No statistically significant changes in BMI. However, weight decreased 1.56 (p = 0.17) and BMI (−0.43, p = 0.44) | HEI scores increased comparing intervention (60.2) to control (55.9), p = 0.03; improved scores for total vegetables (4.2 vs. 3.7, p = 0.008), total fruit (3.2 vs. 2.2, p < 0.0001), whole fruit (3.1 vs. 2.4, p = 0.007), and lower consumption of empty calories (15.1 vs. 13.4, p = 0.01) | Food insecurity prevalence decreased from 42% to 32% in the control group and from 31% to 11% in the intervention group (RR 0.68, 0.48, 0.96, p = 0.03) | No statistically significant reductions in blood pressure and HbA1c, but statistically significant decreases in diastolic blood pressure | 79% of participants picked up their weekly CSA share | Not reported |
Disclaimer/Publisher’s Note: The statements, opinions and data contained in all publications are solely those of the individual author(s) and contributor(s) and not of MDPI and/or the editor(s). MDPI and/or the editor(s) disclaim responsibility for any injury to people or property resulting from any ideas, methods, instructions or products referred to in the content. |
© 2023 by the authors. Licensee MDPI, Basel, Switzerland. This article is an open access article distributed under the terms and conditions of the Creative Commons Attribution (CC BY) license (https://creativecommons.org/licenses/by/4.0/).
Share and Cite
Norris, K.; Jilcott Pitts, S.; Reis, H.; Haynes-Maslow, L. A Systematic Literature Review of Nutrition Interventions Implemented to Address Food Insecurity as a Social Determinant of Health. Nutrients 2023, 15, 3464. https://doi.org/10.3390/nu15153464
Norris K, Jilcott Pitts S, Reis H, Haynes-Maslow L. A Systematic Literature Review of Nutrition Interventions Implemented to Address Food Insecurity as a Social Determinant of Health. Nutrients. 2023; 15(15):3464. https://doi.org/10.3390/nu15153464
Chicago/Turabian StyleNorris, Kennedy, Stephanie Jilcott Pitts, Heidi Reis, and Lindsey Haynes-Maslow. 2023. "A Systematic Literature Review of Nutrition Interventions Implemented to Address Food Insecurity as a Social Determinant of Health" Nutrients 15, no. 15: 3464. https://doi.org/10.3390/nu15153464
APA StyleNorris, K., Jilcott Pitts, S., Reis, H., & Haynes-Maslow, L. (2023). A Systematic Literature Review of Nutrition Interventions Implemented to Address Food Insecurity as a Social Determinant of Health. Nutrients, 15(15), 3464. https://doi.org/10.3390/nu15153464