
Major Depressive Disorder, Inflammation, and Nutrition: A Tricky Pattern?
 and
and
Abstract
1. Introduction
1.1. Depression and Inflammation
1.2. The Western Diet, a Risk Factor in the Context of Depression?
2. Materials and Methods
2.1. Population
2.2. Method
2.3. Materials
2.4. Biomarkers
2.5. Statistics
3. Results
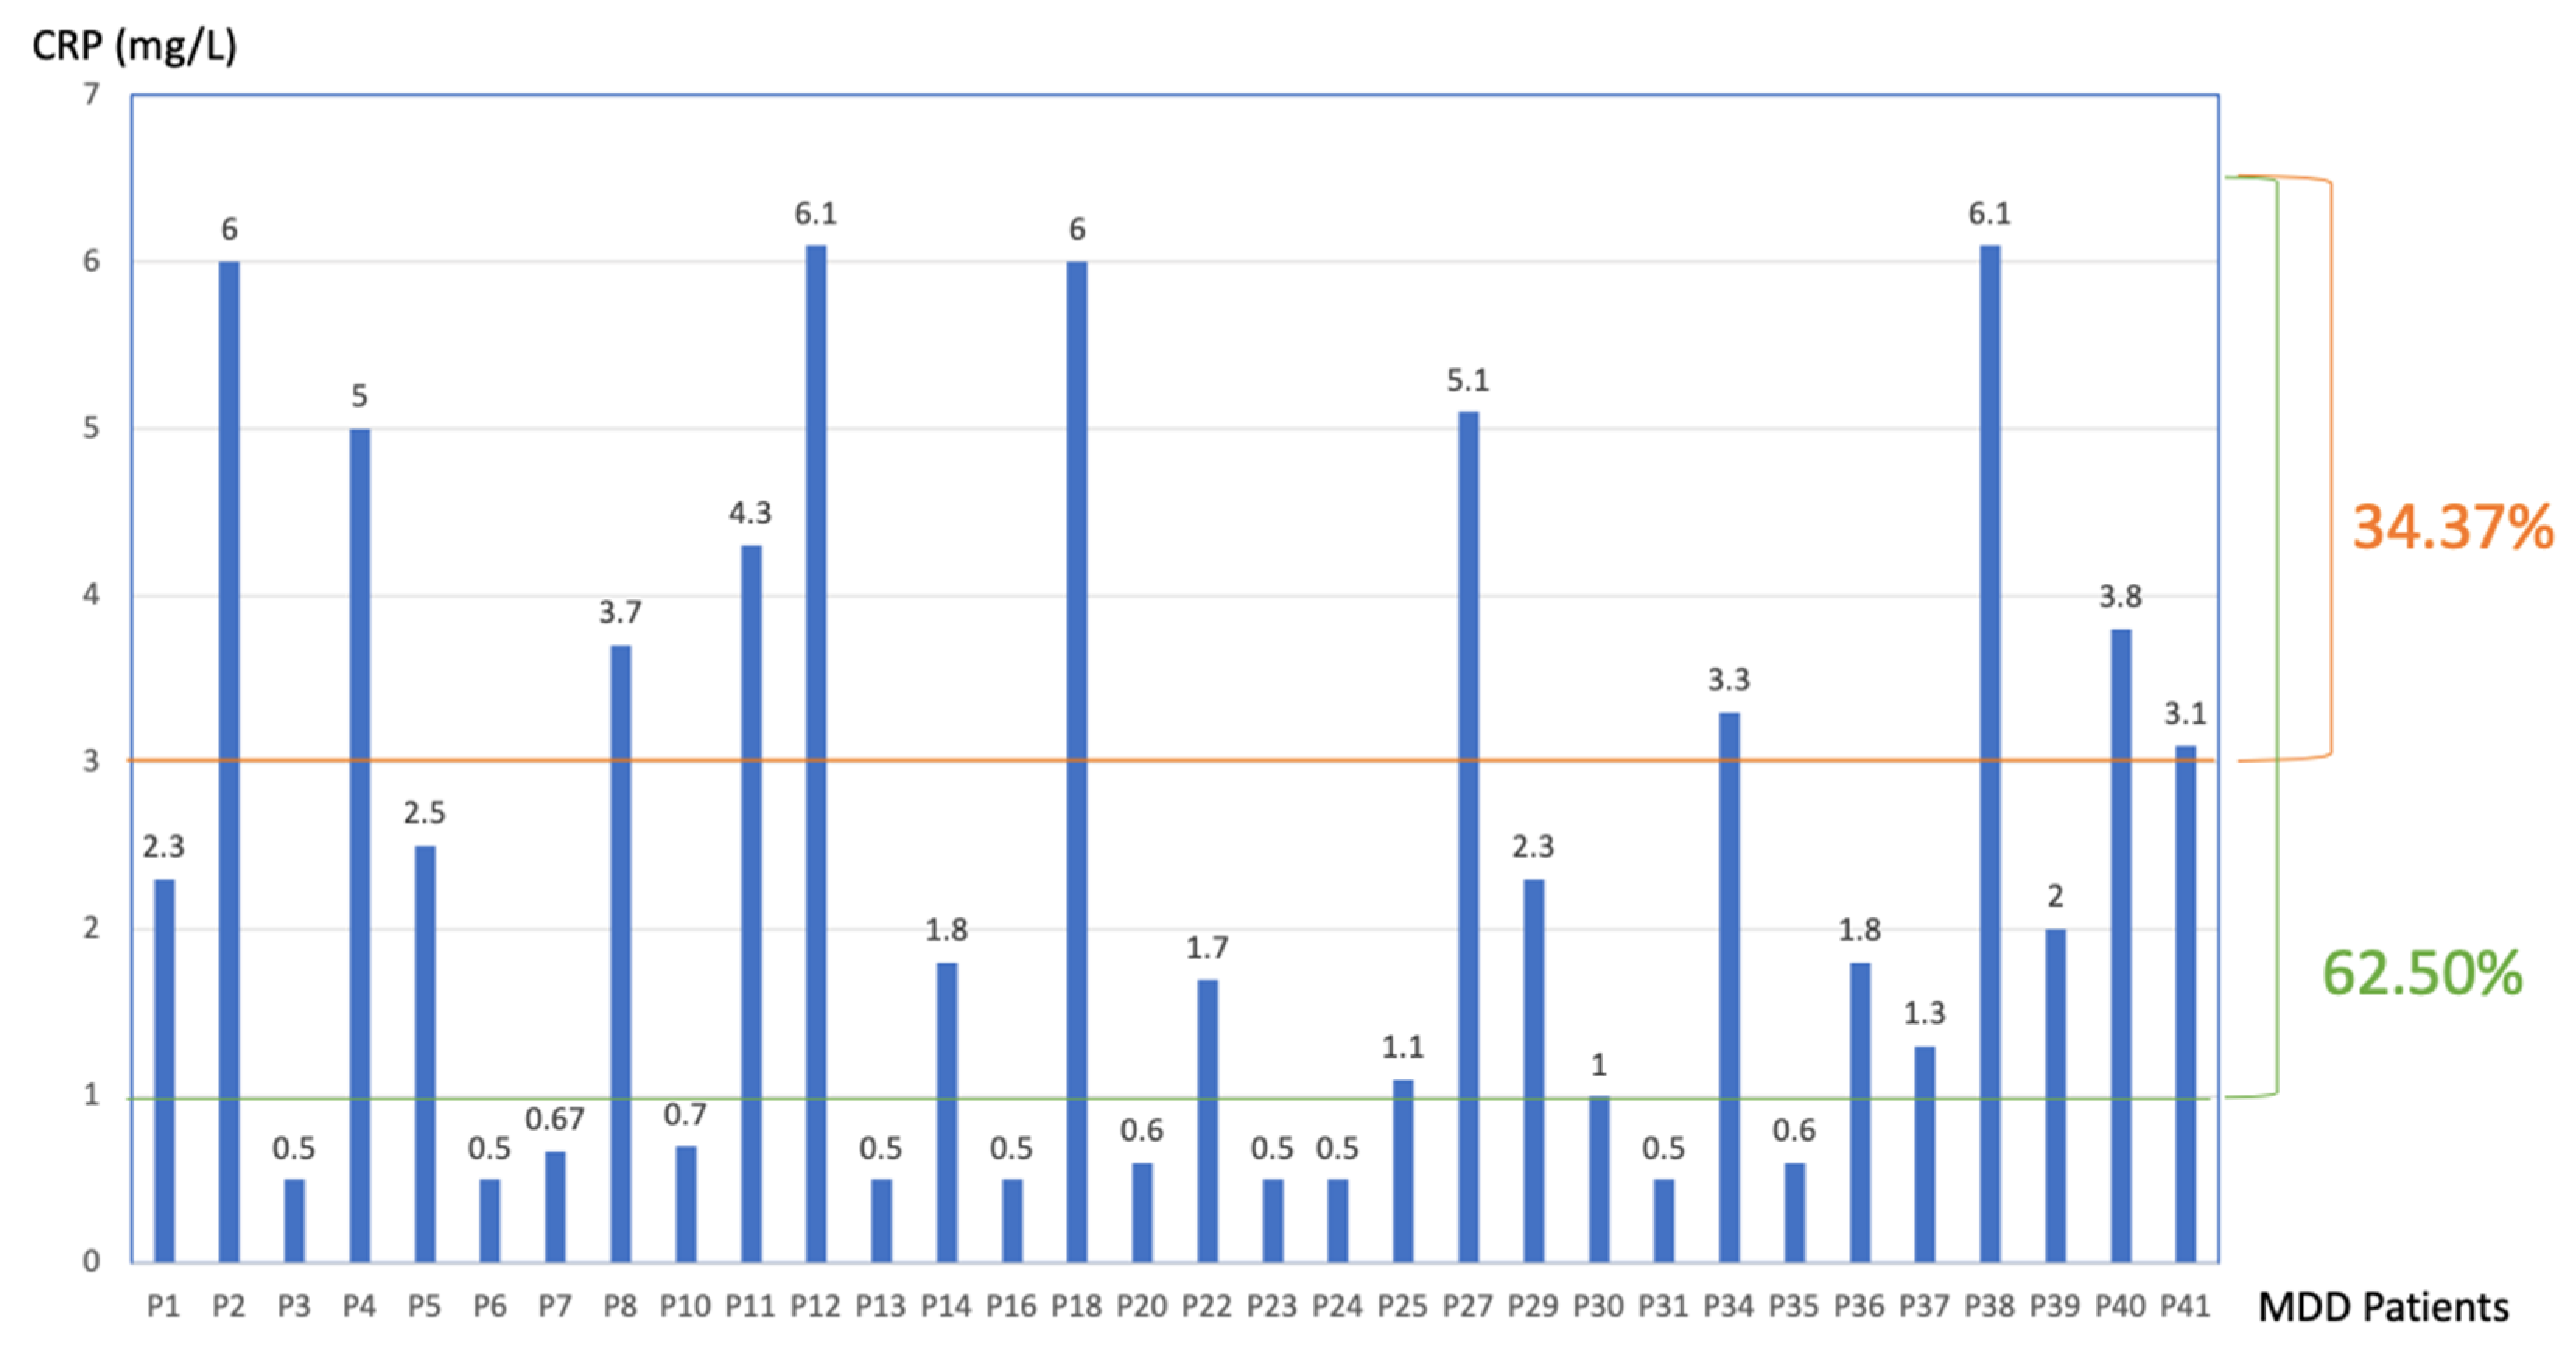
3.1. CRP Data
3.2. Nutritional Data
3.3. Nutrition and Inflammation
4. Discussion
4.1. CRP
4.2. Nutrients
4.3. Carbohydrates, Dietary Fibers, and Glycemic Load
4.4. Advanced Glycation End Products (AGEs) and the Western Diet
4.5. Inflammation and Nutrition
4.6. Limits of the Study
5. Conclusions
Author Contributions
Funding
Institutional Review Board Statement
Informed Consent Statement
Data Availability Statement
Conflicts of Interest
References
- World Health Organization. Depression and Other Common Mental Disorders: Global Health Estimates; World Health Organization: Geneva, Switzerland, 2017. [Google Scholar]
- Evans-Lacko, S.; Aguilar-Gaxiola, S.; Al-Hamzawi, A.; Alonso, J.; Benjet, C.; Bruffaerts, R.; Chiu, W.T.; Florescu, S.; de Girolamo, G.; Gureje, O.; et al. Socio-economic variations in the mental health treatment gap for people with anxiety, mood, and substance use disorders: Results from the WHO World Mental Health (WMH) surveys. Psychol. Med. 2018, 48, 1560–1571. [Google Scholar] [CrossRef]
- Beurel, E.; Toups, M.; Nemeroff, C.B. The Bidirectional Relationship of Depression and Inflammation: Double Trouble. Neuron 2020, 107, 234–256. [Google Scholar] [CrossRef] [PubMed]
- Haapakoski, R.; Mathieu, J.; Ebmeier, K.P.; Alenius, H.; Kivimäki, M. Cumulative meta-analysis of interleukins 6 and 1β, tumour necrosis factor α and C-reactive protein in patients with major depressive disorder. Brain Behav. Immun. 2015, 49, 206–215. [Google Scholar] [CrossRef] [PubMed]
- Osimo, E.F.; Baxter, L.J.; Lewis, G.; Jones, P.B.; Khandaker, G.M. Prevalence of low-grade inflammation in depression: A systematic review and meta-analysis of CRP levels. Psychol. Med. 2019, 49, 1958–1970. [Google Scholar] [CrossRef] [PubMed]
- Ridker, P.M.; Bassuk, S.S.; Toth, P.P. C-reactive protein and risk of cardiovascular disease: Evidence and clinical application. Curr. Atheroscler. Rep. 2003, 5, 341–349. [Google Scholar] [CrossRef]
- Ferrari, A.J.; Somerville, A.J.; Baxter, A.J.; Norman, R.; Patten, S.B.; Vos, T.; Whiteford, H.A. Global variation in the prevalence and incidence of major depressive disorder: A systematic review of the epidemiological literature. Psychol. Med. 2013, 43, 471–481. [Google Scholar] [CrossRef]
- Arias-de la Torre, J.; Vilagut, G.; Ronaldson, A.; Serrano-Blanco, A.; Martín, V.; Peters, M.; Valderas, J.M.; Dregan, A.; Alonso, J. Prevalence and variability of current depressive disorder in 27 European countries: A population-based study. Lancet Public Health 2021, 6, e729–e738. [Google Scholar] [CrossRef]
- Dantzer, R. Cytokine, Sickness Behavior, and Depression. Immunol. Allergy Clin. N. Am. 2009, 29, 247–264. [Google Scholar] [CrossRef]
- Dantzer, R.; O’Connor, J.C.; Freund, G.G.; Johnson, R.W.; Kelley, K.W. From inflammation to sickness and depression: When the immune system subjugates the brain. Nat. Rev. Neurosci. 2008, 9, 46–56. [Google Scholar] [CrossRef]
- Watkins, L.R.; Maier, S.F.; Goehler, L.E. Cytokine-to-brain communication: A review & analysis of alternative mechanisms. Life Sci. 1995, 57, 1011–1026. [Google Scholar] [CrossRef]
- Miller, A.H.; Raison, C.L. The role of inflammation in depression: From evolutionary imperative to modern treatment target. Nat. Rev. Immunol. 2016, 16, 22–34. [Google Scholar] [CrossRef] [PubMed]
- Capuron, L.; Gumnick, J.F.; Musselman, D.L.; Lawson, D.H.; Reemsnyder, A.; Nemeroff, C.B.; Miller, A.H. Neurobehavioral effects of interferon-alpha in cancer patients: Phenomenology and paroxetine responsiveness of symptom dimensions. Neuropsychopharmacol. Off. Publ. Am. Coll. Neuropsychopharmacol. 2002, 26, 643–652. [Google Scholar] [CrossRef] [PubMed]
- Musselman, D.L.; Lawson, D.H.; Gumnick, J.F.; Manatunga, A.K.; Penna, S.; Goodkin, R.S.; Greiner, K.; Nemeroff, C.B.; Miller, A.H. Paroxetine for the prevention of depression induced by high-dose interferon alfa. N. Engl. J. Med. 2001, 344, 961–966. [Google Scholar] [CrossRef] [PubMed]
- Cheng, Y.; Desse, S.; Martinez, A.; Worthen, R.J.; Jope, R.S.; Beurel, E. TNFα disrupts blood brain barrier integrity to maintain prolonged depressive-like behavior in mice. Brain Behav. Immun. 2018, 69, 556–567. [Google Scholar] [CrossRef]
- Niklasson, F.; Agren, H. Brain energy metabolism and blood-brain barrier permeability in depressive patients: Analyses of creatine, creatinine, urate, and albumin in CSF and blood. Biol. Psychiatry 1984, 19, 1183–1206. [Google Scholar]
- Menard, C.; Pfau, M.L.; Hodes, G.E.; Kana, V.; Wang, V.X.; Bouchard, S.; Takahashi, A.; Flanigan, M.E.; Aleyasin, H.; LeClair, K.B.; et al. Social stress induces neurovascular pathology promoting depression. Nat. Neurosci. 2017, 20, 1752–1760. [Google Scholar] [CrossRef]
- Howes, O.D.; Thase, M.E.; Pillinger, T. Treatment resistance in psychiatry: State of the art and new directions. Mol. Psychiatry 2022, 27, 58–72. [Google Scholar] [CrossRef]
- Maes, M.; Bosmans, E.; De Jongh, R.; Kenis, G.; Vandoolaeghe, E.; Neels, H. Increased serum IL-6 and IL-1 receptor antagonist concentrations in major depression and treatment resistant depression. Cytokine 1997, 9, 853–858. [Google Scholar] [CrossRef] [PubMed]
- Strawbridge, R.; Arnone, D.; Danese, A.; Papadopoulos, A.; Herane Vives, A.; Cleare, A.J. Inflammation and clinical response to treatment in depression: A meta-analysis. Eur. Neuropsychopharmacol. J. Eur. Coll. Neuropsychopharmacol. 2015, 25, 1532–1543. [Google Scholar] [CrossRef]
- Chamberlain, S.R.; Cavanagh, J.; de Boer, P.; Mondelli, V.; Jones, D.N.C.; Drevets, W.C.; Cowen, P.J.; Harrison, N.A.; Pointon, L.; Pariante, C.M.; et al. Treatment-resistant depression and peripheral C-reactive protein. Br. J. Psychiatry J. Ment. Sci. 2019, 214, 11–19. [Google Scholar] [CrossRef]
- Vogelzangs, N.; Beekman, A.T.; van Reedt Dortland, A.K.; Schoevers, R.A.; Giltay, E.J.; de Jonge, P.; Penninx, B.W. Inflammatory and Metabolic Dysregulation and the 2-Year Course of Depressive Disorders in Antidepressant Users. Neuropsychopharmacology 2014, 39, 1624–1634. [Google Scholar] [CrossRef] [PubMed]
- Raison, C.L.; Rutherford, R.E.; Woolwine, B.J.; Shuo, C.; Schettler, P.; Drake, D.F.; Haroon, E.; Miller, A.H. A randomized controlled trial of the tumor necrosis factor antagonist infliximab for treatment-resistant depression: The role of baseline inflammatory biomarkers. JAMA Psychiatry 2013, 70, 31–41. [Google Scholar] [CrossRef]
- Uher, R.; Tansey, K.E.; Dew, T.; Maier, W.; Mors, O.; Hauser, J.; Dernovsek, M.Z.; Henigsberg, N.; Souery, D.; Farmer, A.; et al. An inflammatory biomarker as a differential predictor of outcome of depression treatment with escitalopram and nortriptyline. Am. J. Psychiatry 2014, 171, 1278–1286. [Google Scholar] [CrossRef]
- Jha, M.K.; Minhajuddin, A.; Gadad, B.S.; Greer, T.; Grannemann, B.; Soyombo, A.; Mayes, T.L.; Rush, A.J.; Trivedi, M.H. Can C-reactive protein inform antidepressant medication selection in depressed outpatients? Findings from the CO-MED trial. Psychoneuroendocrinology 2017, 78, 105–113. [Google Scholar] [CrossRef] [PubMed]
- Cervenka, I.; Agudelo, L.Z.; Ruas, J.L. Kynurenines: Tryptophan’s metabolites in exercise, inflammation, and mental health. Science 2017, 357, eaaf9794. [Google Scholar] [CrossRef] [PubMed]
- Sartorius, N. Depression and diabetes. Dialogues Clin. Neurosci. 2018, 20, 47–52. [Google Scholar] [CrossRef]
- Blasco, B.V.; García-Jiménez, J.; Bodoano, I.; Gutiérrez-Rojas, L. Obesity and Depression: Its Prevalence and Influence as a Prognostic Factor: A Systematic Review. Psychiatry Investig. 2020, 17, 715–724. [Google Scholar] [CrossRef]
- Duncan, B.B.; Schmidt, M.I.; Pankow, J.S.; Ballantyne, C.M.; Couper, D.; Vigo, A.; Hoogeveen, R.; Folsom, A.R.; Heiss, G. Low-grade systemic inflammation and the development of type 2 diabetes: The atherosclerosis risk in communities study. Diabetes 2003, 52, 1799–1805. [Google Scholar] [CrossRef]
- Pitsavos, C.; Tampourlou, M.; Panagiotakos, D.B.; Skoumas, Y.; Chrysohoou, C.; Nomikos, T.; Stefanadis, C. Association between Low-Grade Systemic Inflammation and Type 2 Diabetes Mellitus Among Men and Women from the ATTICA Study. Rev. Diabet. Stud. RDS 2007, 4, 98–104. [Google Scholar] [CrossRef]
- Ellulu, M.S.; Patimah, I.; Khaza’ai, H.; Rahmat, A.; Abed, Y. Obesity and inflammation: The linking mechanism and the complications. Arch. Med. Sci. AMS 2017, 13, 851–863. [Google Scholar] [CrossRef]
- Logan, A.C.; Jacka, F.N. Nutritional psychiatry research: An emerging discipline and its intersection with global urbanization, environmental challenges and the evolutionary mismatch. J. Physiol. Anthropol. 2014, 33, 22. [Google Scholar] [CrossRef]
- Mozaffarian, D. Dietary and Policy Priorities for Cardiovascular Disease, Diabetes, and Obesity: A Comprehensive Review. Circulation 2016, 133, 187–225. [Google Scholar] [CrossRef] [PubMed]
- Kopp, W. How Western Diet and Lifestyle Drive the Pandemic of Obesity and Civilization Diseases. Diabetes Metab. Syndr. Obes. Targets Ther. 2019, 12, 2221–2236. [Google Scholar] [CrossRef] [PubMed]
- Giugliano, D.; Ceriello, A.; Esposito, K. The effects of diet on inflammation: Emphasis on the metabolic syndrome. J. Am. Coll. Cardiol. 2006, 48, 677–685. [Google Scholar] [CrossRef] [PubMed]
- Christ, A.; Lauterbach, M.; Latz, E. Western Diet and the Immune System: An Inflammatory Connection. Immunity 2019, 51, 794–811. [Google Scholar] [CrossRef] [PubMed]
- Clemente-Suárez, V.J.; Mielgo-Ayuso, J.; Martín-Rodríguez, A.; Ramos-Campo, D.J.; Redondo-Flórez, L.; Tornero-Aguilera, J.F. The Burden of Carbohydrates in Health and Disease. Nutrients 2022, 14, 3809. [Google Scholar] [CrossRef]
- Firth, J.; Gangwisch, J.E.; Borisini, A.; Wootton, R.E.; Mayer, E.A. Food and mood: How do diet and nutrition affect mental wellbeing? BMJ 2020, 369, m2382. [Google Scholar] [CrossRef]
- Atkinson, F.S.; Foster-Powell, K.; Brand-Miller, J.C. International tables of glycemic index and glycemic load values: 2008. Diabetes Care 2008, 31, 2281–2283. [Google Scholar] [CrossRef]
- Bettiga, A.; Fiorio, F.; Di Marco, F.; Trevisani, F.; Romani, A.; Porrini, E.; Salonia, A.; Montorsi, F.; Vago, R. The Modern Western Diet Rich in Advanced Glycation End-Products (AGEs): An Overview of Its Impact on Obesity and Early Progression of Renal Pathology. Nutrients 2019, 11, 1748. [Google Scholar] [CrossRef]
- Furman, D.; Campisi, J.; Verdin, E.; Carrera-Bastos, P.; Targ, S.; Franceschi, C.; Ferrucci, L.; Gilroy, D.W.; Fasano, A.; Miller, G.W.; et al. Chronic inflammation in the etiology of disease across the life span. Nat. Med. 2019, 25, 1822–1832. [Google Scholar] [CrossRef]
- Stromsnes, K.; Correas, A.G.; Lehmann, J.; Gambini, J.; Olaso-Gonzalez, G. Anti-Inflammatory Properties of Diet: Role in Healthy Aging. Biomedicines 2021, 9, 922. [Google Scholar] [CrossRef] [PubMed]
- van Dooren, F.E.P.; Pouwer, F.; Schalkwijk, C.G.; Sep, S.J.S.; Stehouwer, C.D.A.; Henry, R.M.A.; Dagnelie, P.C.; Schaper, N.C.; van der Kallen, C.J.H.; Koster, A.; et al. Advanced Glycation End Product (AGE) Accumulation in the Skin is Associated with Depression: The Maastricht Study. Depress. Anxiety 2017, 34, 59–67. [Google Scholar] [CrossRef] [PubMed]
- Thorburn, A.N.; Macia, L.; Mackay, C.R. Diet, metabolites, and “western-lifestyle” inflammatory diseases. Immunity 2014, 40, 833–842. [Google Scholar] [CrossRef] [PubMed]
- Myles, I.A. Fast food fever: Reviewing the impacts of the Western diet on immunity. Nutr. J. 2014, 13, 61. [Google Scholar] [CrossRef]
- Minihane, A.M.; Vinoy, S.; Russell, W.R.; Baka, A.; Roche, H.M.; Tuohy, K.M.; Teeling, J.L.; Blaak, E.E.; Fenech, M.; Vauzour, D.; et al. Low-grade inflammation, diet composition and health: Current research evidence and its translation. Br. J. Nutr. 2015, 114, 999–1012. [Google Scholar] [CrossRef] [PubMed]
- Wen, H.; Gris, D.; Lei, Y.; Jha, S.; Zhang, L.; Huang, M.T.-H.; Brickey, W.J.; Ting, J.P.-Y. Fatty acid-induced NLRP3-ASC inflammasome activation interferes with insulin signaling. Nat. Immunol. 2011, 12, 408–415. [Google Scholar] [CrossRef] [PubMed]
- Mozaffarian, D.; Aro, A.; Willett, W.C. Health effects of trans-fatty acids: Experimental and observational evidence. Eur. J. Clin. Nutr. 2009, 63 (Suppl. S2), S5–S21. [Google Scholar] [CrossRef]
- Nishida, C.; Uauy, R. WHO Scientific Update on health consequences of trans fatty acids: Introduction. Eur. J. Clin. Nutr. 2009, 63 (Suppl. S2), S1–S4. [Google Scholar] [CrossRef]
- Calder, P.C. Marine omega-3 fatty acids and inflammatory processes: Effects, mechanisms and clinical relevance. Biochim. Biophys. Acta 2015, 1851, 469–484. [Google Scholar] [CrossRef]
- Serhan, C.N.; Chiang, N.; Van Dyke, T.E. Resolving inflammation: Dual anti-inflammatory and pro-resolution lipid mediators. Nat. Rev. Immunol. 2008, 8, 349–361. [Google Scholar] [CrossRef]
- Calder, P.C. Very long-chain n-3 fatty acids and human health: Fact, fiction and the future. Proc. Nutr. Soc. 2018, 77, 52–72. [Google Scholar] [CrossRef] [PubMed]
- Troesch, B.; Eggersdorfer, M.; Laviano, A.; Rolland, Y.; Smith, A.D.; Warnke, I.; Weimann, A.; Calder, P.C. Expert Opinion on Benefits of Long-Chain Omega-3 Fatty Acids (DHA and EPA) in Aging and Clinical Nutrition. Nutrients 2020, 12, 2555. [Google Scholar] [CrossRef]
- Oh, D.Y.; Talukdar, S.; Bae, E.J.; Imamura, T.; Morinaga, H.; Fan, W.; Li, P.; Lu, W.J.; Watkins, S.M.; Olefsky, J.M. GPR120 is an omega-3 fatty acid receptor mediating potent anti-inflammatory and insulin-sensitizing effects. Cell 2010, 142, 687–698. [Google Scholar] [CrossRef]
- Su, K.-P.; Lai, H.-C.; Yang, H.-T.; Su, W.-P.; Peng, C.-Y.; Chang, J.P.-C.; Chang, H.-C.; Pariante, C.M. Omega-3 fatty acids in the prevention of interferon-alpha-induced depression: Results from a randomized, controlled trial. Biol. Psychiatry 2014, 76, 559–566. [Google Scholar] [CrossRef] [PubMed]
- Borsini, A.; Alboni, S.; Horowitz, M.A.; Tojo, L.M.; Cannazza, G.; Su, K.-P.; Pariante, C.M.; Zunszain, P.A. Rescue of IL-1β-induced reduction of human neurogenesis by omega-3 fatty acids and antidepressants. Brain Behav. Immun. 2017, 65, 230–238. [Google Scholar] [CrossRef] [PubMed]
- Maes, M. Interleukin-1beta and the etiology of depression. Acta Psychiatr. Scand. 2001, 103, 161–162. [Google Scholar] [CrossRef]
- Owen, B.M.; Eccleston, D.; Ferrier, I.N.; Young, A.H. Raised levels of plasma interleukin-1beta in major and postviral depression. Acta Psychiatr. Scand. 2001, 103, 226–228. [Google Scholar] [CrossRef]
- Listenberger, L.L.; Han, X.; Lewis, S.E.; Cases, S.; Farese, R.V.; Ory, D.S.; Schaffer, J.E. Triglyceride accumulation protects against fatty acid-induced lipotoxicity. Proc. Natl. Acad. Sci. USA 2003, 100, 3077–3082. [Google Scholar] [CrossRef]
- Henique, C.; Mansouri, A.; Fumey, G.; Lenoir, V.; Girard, J.; Bouillaud, F.; Prip-Buus, C.; Cohen, I. Increased mitochondrial fatty acid oxidation is sufficient to protect skeletal muscle cells from palmitate-induced apoptosis. J. Biol. Chem. 2010, 285, 36818–36827. [Google Scholar] [CrossRef]
- Ishiyama, J.; Taguchi, R.; Akasaka, Y.; Shibata, S.; Ito, M.; Nagasawa, M.; Murakami, K. Unsaturated FAs prevent palmitate-induced LOX-1 induction via inhibition of ER stress in macrophages. J. Lipid Res. 2011, 52, 299–307. [Google Scholar] [CrossRef]
- Finucane, O.M.; Lyons, C.L.; Murphy, A.M.; Reynolds, C.M.; Klinger, R.; Healy, N.P.; Cooke, A.A.; Coll, R.C.; McAllan, L.; Nilaweera, K.N.; et al. Monounsaturated fatty acid-enriched high-fat diets impede adipose NLRP3 inflammasome-mediated IL-1β secretion and insulin resistance despite obesity. Diabetes 2015, 64, 2116–2128. [Google Scholar] [CrossRef]
- Yahfoufi, N.; Alsadi, N.; Jambi, M.; Matar, C. The Immunomodulatory and Anti-Inflammatory Role of Polyphenols. Nutrients 2018, 10, 1618. [Google Scholar] [CrossRef]
- Kurowska, A.; Ziemichód, W.; Herbet, M.; Piątkowska-Chmiel, I. The Role of Diet as a Modulator of the Inflammatory Process in the Neurological Diseases. Nutrients 2023, 15, 1436. [Google Scholar] [CrossRef]
- Moylan, S.; Berk, M.; Dean, O.M.; Samuni, Y.; Williams, L.J.; O’Neil, A.; Hayley, A.C.; Pasco, J.A.; Anderson, G.; Jacka, F.N.; et al. Oxidative & nitrosative stress in depression: Why so much stress? Neurosci. Biobehav. Rev. 2014, 45, 46–62. [Google Scholar] [CrossRef]
- Nani, A.; Murtaza, B.; Sayed Khan, A.; Khan, N.A.; Hichami, A. Antioxidant and Anti-Inflammatory Potential of Polyphenols Contained in Mediterranean Diet in Obesity: Molecular Mechanisms. Molecules 2021, 26, 985. [Google Scholar] [CrossRef] [PubMed]
- Iddir, M.; Brito, A.; Dingeo, G.; Fernandez Del Campo, S.S.; Samouda, H.; La Frano, M.R.; Bohn, T. Strengthening the Immune System and Reducing Inflammation and Oxidative Stress through Diet and Nutrition: Considerations during the COVID-19 Crisis. Nutrients 2020, 12, 1562. [Google Scholar] [CrossRef] [PubMed]
- Jiang, Q. Natural forms of vitamin E: Metabolism, antioxidant, and anti-inflammatory activities and their role in disease prevention and therapy. Free Radic. Biol. Med. 2014, 72, 76–90. [Google Scholar] [CrossRef]
- Garcia-Martinez, O.; Ruiz, C.; Gutierrez-Ibanez, A.; Illescas-Montes, R.; Melguizo-Rodriguez, L. Benefits of Olive Oil Phenolic Compounds in Disease Prevention. Endocr. Metab. Immune Disord. Drug Targets 2018, 18, 333–340. [Google Scholar] [CrossRef]
- Nielsen, F.H. Magnesium deficiency and increased inflammation: Current perspectives. J. Inflamm. Res. 2018, 11, 25–34. [Google Scholar] [CrossRef] [PubMed]
- Veronese, N.; Pizzol, D.; Smith, L.; Dominguez, L.J.; Barbagallo, M. Effect of Magnesium Supplementation on Inflammatory Parameters: A Meta-Analysis of Randomized Controlled Trials. Nutrients 2022, 14, 679. [Google Scholar] [CrossRef]
- Wang, J.; Um, P.; Dickerman, B.A.; Liu, J. Zinc, Magnesium, Selenium and Depression: A Review of the Evidence, Potential Mechanisms and Implications. Nutrients 2018, 10, 584. [Google Scholar] [CrossRef] [PubMed]
- Botturi, A.; Ciappolino, V.; Delvecchio, G.; Boscutti, A.; Viscardi, B.; Brambilla, P. The Role and the Effect of Magnesium in Mental Disorders: A Systematic Review. Nutrients 2020, 12, 1661. [Google Scholar] [CrossRef]
- Bonaventura, P.; Benedetti, G.; Albarède, F.; Miossec, P. Zinc and its role in immunity and inflammation. Autoimmun. Rev. 2015, 14, 277–285. [Google Scholar] [CrossRef] [PubMed]
- Makki, K.; Deehan, E.C.; Walter, J.; Bäckhed, F. The Impact of Dietary Fiber on Gut Microbiota in Host Health and Disease. Cell Host Microbe 2018, 23, 705–715. [Google Scholar] [CrossRef] [PubMed]
- Ma, Y.; Griffith, J.A.; Chasan-Taber, L.; Olendzki, B.C.; Jackson, E.; Stanek, E.J.; Li, W.; Pagoto, S.L.; Hafner, A.R.; Ockene, I.S. Association between dietary fiber and serum C-reactive protein. Am. J. Clin. Nutr. 2006, 83, 760–766. [Google Scholar] [CrossRef]
- Cummings, J.H.; Macfarlane, G.T. The control and consequences of bacterial fermentation in the human colon. J. Appl. Bacteriol. 1991, 70, 443–459. [Google Scholar] [CrossRef]
- Windey, K.; De Preter, V.; Verbeke, K. Relevance of protein fermentation to gut health. Mol. Nutr. Food Res. 2012, 56, 184–196. [Google Scholar] [CrossRef]
- Desai, M.S.; Seekatz, A.M.; Koropatkin, N.M.; Kamada, N.; Hickey, C.A.; Wolter, M.; Pudlo, N.A.; Kitamoto, S.; Terrapon, N.; Muller, A.; et al. A Dietary Fiber-Deprived Gut Microbiota Degrades the Colonic Mucus Barrier and Enhances Pathogen Susceptibility. Cell 2016, 167, 1339–1353.e21. [Google Scholar] [CrossRef]
- Schroeder, B.O.; Birchenough, G.M.H.; Ståhlman, M.; Arike, L.; Johansson, M.E.V.; Hansson, G.C.; Bäckhed, F. Bifidobacteria or Fiber Protects against Diet-Induced Microbiota-Mediated Colonic Mucus Deterioration. Cell Host Microbe 2018, 23, 27–40.e7. [Google Scholar] [CrossRef]
- Towler, D.A.; Havlin, C.E.; Craft, S.; Cryer, P. Mechanism of awareness of hypoglycemia. Perception of neurogenic (predominantly cholinergic) rather than neuroglycopenic symptoms. Diabetes 1993, 42, 1791–1798. [Google Scholar] [CrossRef]
- Dickinson, S.; Hancock, D.P.; Petocz, P.; Ceriello, A.; Brand-Miller, J. High-glycemic index carbohydrate increases nuclear factor-kappaB activation in mononuclear cells of young, lean healthy subjects. Am. J. Clin. Nutr. 2008, 87, 1188–1193. [Google Scholar] [CrossRef]
- Liu, S.; Manson, J.E.; Buring, J.E.; Stampfer, M.J.; Willett, W.C.; Ridker, P.M. Relation between a diet with a high glycemic load and plasma concentrations of high-sensitivity C-reactive protein in middle-aged women. Am. J. Clin. Nutr. 2002, 75, 492–498. [Google Scholar] [CrossRef]
- Levitan, E.B.; Cook, N.R.; Stampfer, M.J.; Ridker, P.M.; Rexrode, K.M.; Buring, J.E.; Manson, J.E.; Liu, S. Dietary glycemic index, dietary glycemic load, blood lipids, and C-reactive protein. Metabolism 2008, 57, 437–443. [Google Scholar] [CrossRef] [PubMed]
- Esfahani, A.; Wong, J.M.W.; Mirrahimi, A.; Srichaikul, K.; Jenkins, D.J.A.; Kendall, C.W.C. The glycemic index: Physiological significance. J. Am. Coll. Nutr. 2009, 28, 439S–445S. [Google Scholar] [CrossRef] [PubMed]
- Neuhouser, M.L.; Schwarz, Y.; Wang, C.; Breymeyer, K.; Coronado, G.; Wang, C.-Y.; Noar, K.; Song, X.; Lampe, J.W. A low-glycemic load diet reduces serum C-reactive protein and modestly increases adiponectin in overweight and obese adults. J. Nutr. 2012, 142, 369–374. [Google Scholar] [CrossRef] [PubMed]
- Salari-Moghaddam, A.; Saneei, P.; Larijani, B.; Esmaillzadeh, A. Glycemic index, glycemic load, and depression: A systematic review and meta-analysis. Eur. J. Clin. Nutr. 2019, 73, 356–365. [Google Scholar] [CrossRef]
- Firth, J.; Stubbs, B.; Teasdale, S.B.; Ward, P.B.; Veronese, N.; Shivappa, N.; Hebert, J.R.; Berk, M.; Yung, A.R.; Sarris, J. Diet as a hot topic in psychiatry: A population-scale study of nutritional intake and inflammatory potential in severe mental illness. World Psychiatry Off. J. World Psychiatr. Assoc. WPA 2018, 17, 365–367. [Google Scholar] [CrossRef]
- Uribarri, J.; Woodruff, S.; Goodman, S.; Cai, W.; Chen, X.; Pyzik, R.; Yong, A.; Striker, G.E.; Vlassara, H. Advanced glycation end products in foods and a practical guide to their reduction in the diet. J. Am. Diet. Assoc. 2010, 110, 911–916.e12. [Google Scholar] [CrossRef]
- Yeh, W.-J.; Hsia, S.-M.; Lee, W.-H.; Wu, C.-H. Polyphenols with antiglycation activity and mechanisms of action: A review of recent findings. J. Food Drug Anal. 2017, 25, 84–92. [Google Scholar] [CrossRef]
- Chen, H.; Virk, M.S.; Chen, F. Phenolic acids inhibit the formation of advanced glycation end products in food simulation systems depending on their reducing powers and structures. Int. J. Food Sci. Nutr. 2016, 67, 400–411. [Google Scholar] [CrossRef]
- Gruson, E.; Romon, M. Méthodologie des enquêtes alimentaires. Cah. Nutr. Diététique 2007, 42, 276–284. [Google Scholar] [CrossRef]
- Henry, E. Validation d’un Modèle D’enquête Alimentaire Simplifiée, Utilisable en Médecine Générale. Ph.D. Thesis, UHP-Université Henri Poincaré, Nancy, France, 2002. [Google Scholar]
- Johnson, R.K.; Driscoll, P.; Goran, M.I. Comparison of multiple-pass 24-hour recall estimates of energy intake with total energy expenditure determined by the doubly labeled water method in young children. J. Am. Diet. Assoc. 1996, 96, 1140–1144. [Google Scholar] [CrossRef]
- Meerwaldt, R.; Graaff, R.; Oomen, P.H.N.; Links, T.P.; Jager, J.J.; Alderson, N.L.; Thorpe, S.R.; Baynes, J.W.; Gans, R.O.B.; Smit, A.J. Simple non-invasive assessment of advanced glycation endproduct accumulation. Diabetologia 2004, 47, 1324–1330. [Google Scholar] [CrossRef] [PubMed]
- Nubel asbl (Nutrients Belgium) Belgian Food Composition Table 2022. Available online: https://www.nubel.be/foodtable/?lang=fr#?lang_ver=UX46o880 (accessed on 29 May 2023).
- Scientific Opinion on Dietary Reference Values for Carbohydrates and Dietary Fibre|EFSA. Available online: https://www.efsa.europa.eu/en/efsajournal/pub/1462 (accessed on 29 May 2023).
- Foster-Powell, K.; Holt, S.H.A.; Brand-Miller, J.C. International table of glycemic index and glycemic load values: 2002. Am. J. Clin. Nutr. 2002, 76, 5–56. [Google Scholar] [CrossRef] [PubMed]
- Henry, C.J.K. Basal metabolic rate studies in humans: Measurement and development of new equations. Public Health Nutr. 2005, 8, 1133–1152. [Google Scholar] [CrossRef] [PubMed]
- CSS—Conseil Supérieur de la Santé. Recommandations Nutritionnelles Pour la Belgique—Révison 2016. Bruxelles: CSS; 2016. Avis 9285. Available online: https://www.health.belgium.be/fr/avis-9285-recommandations-nutritionnelles-pour-la-belgique-2016 (accessed on 29 May 2023).
- CSS—Conseil Supérieur de la Santé. Recommandations Alimentaires Pour la Population Belge—Révision 2019. Bruxelles: CSS; 2019. Avis n° 9284. Available online: https://www.health.belgium.be/fr/avis-9284-fbdg-2019 (accessed on 29 May 2023).
- Luan, Y.-Y.; Yao, Y.-M. The Clinical Significance and Potential Role of C-Reactive Protein in Chronic Inflammatory and Neurodegenerative Diseases. Front. Immunol. 2018, 9, 1302. [Google Scholar] [CrossRef]
- Pahwa, R.; Goyal, A.; Jialal, I. Chronic Inflammation. In StatPearls; StatPearls Publishing: Treasure Island, FL, USA, 2023. [Google Scholar]
- De Ridder, K.; Lebacq, T.; Ost, C.; Teppers, E.; Brocatus, L. La consommation alimentaire. In Enquête De Consommation Alimentaire 2014–2015; Teppers, E., Tafforeau, J., Eds.; Résumé Des Principaux Résultats; WIV-ISP: Brussel, Belgium, 2016. [Google Scholar]
- Avena, N.M.; Rada, P.; Hoebel, B.G. Evidence for sugar addiction: Behavioral and neurochemical effects of intermittent, excessive sugar intake. Neurosci. Biobehav. Rev. 2008, 32, 20–39. [Google Scholar] [CrossRef]
- DiNicolantonio, J.J.; O’Keefe, J.H.; Wilson, W.L. Sugar addiction: Is it real? A narrative review. Br. J. Sports Med. 2018, 52, 910–913. [Google Scholar] [CrossRef]


| Group | N | Mean | Median | SD | SE |
|---|---|---|---|---|---|
| 0 | 32 | 2.39 | 1.80 | 1.97 | 0.348 |
| 1 | 31 | 1.13 | 0.850 | 0.871 | 0.156 |
| Parameter | q = 0.25 | q = 0.5 | q = 0.75 |
|---|---|---|---|
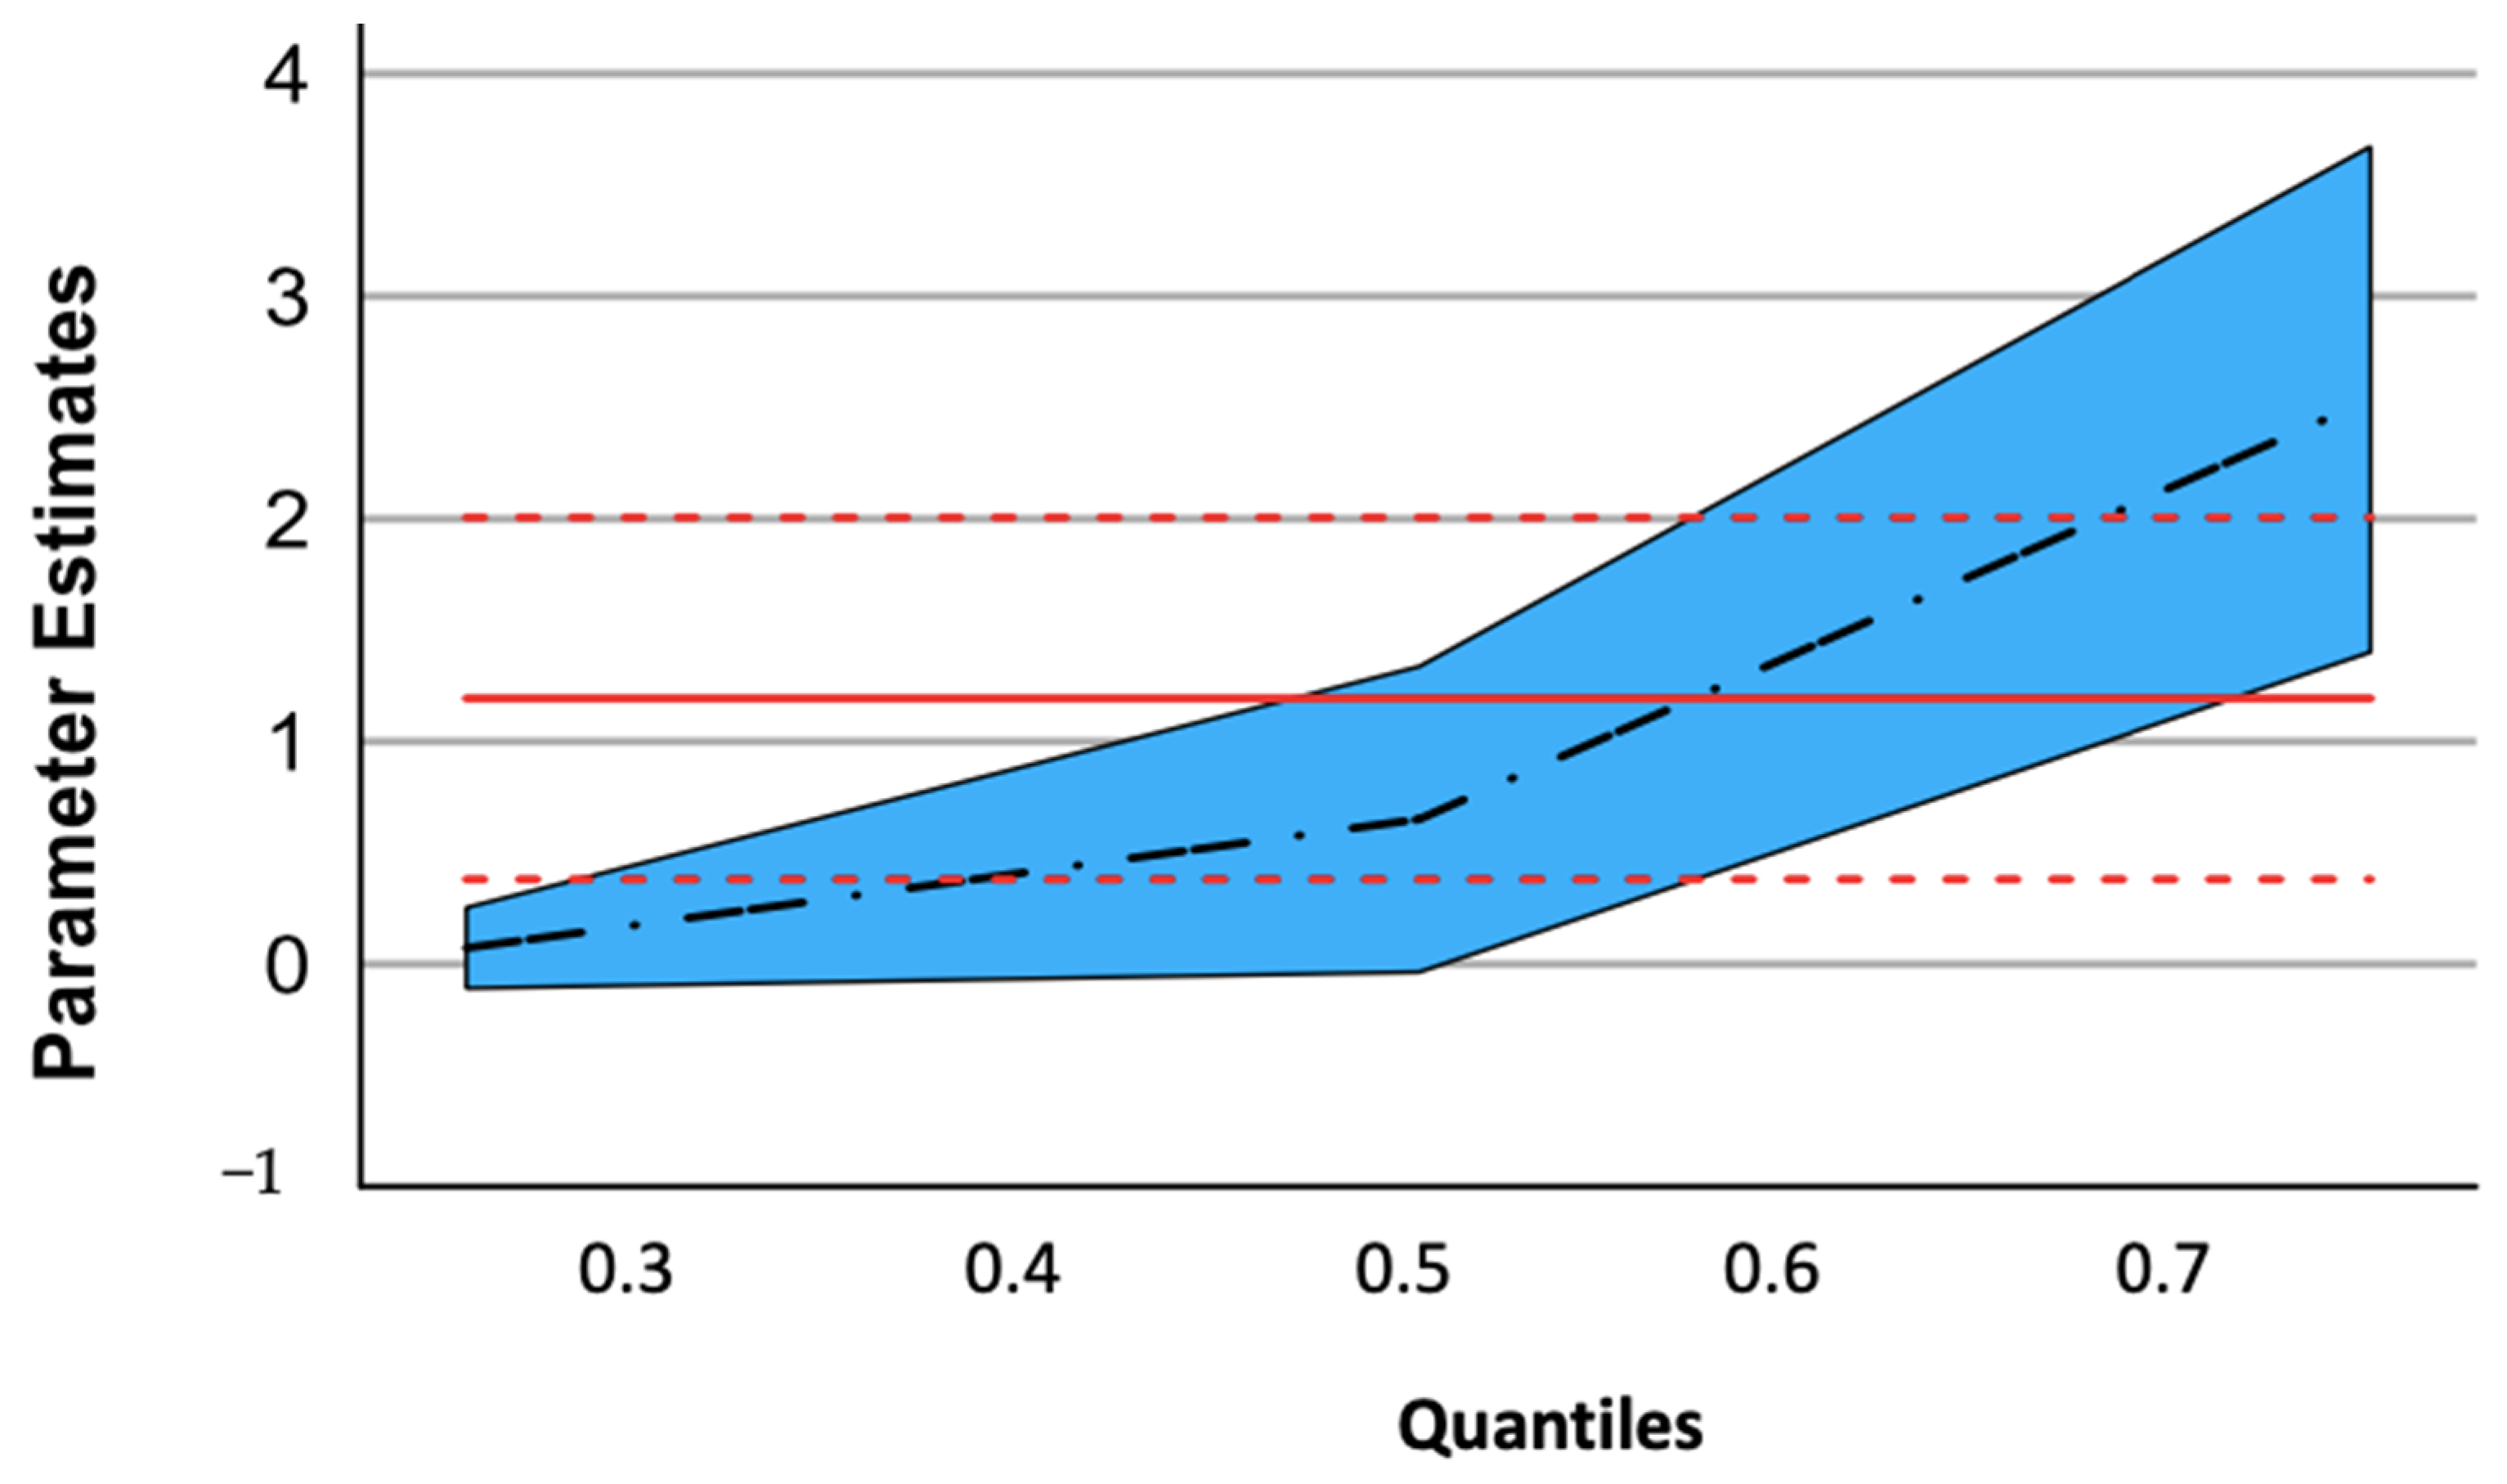
| Patient vs. CTRL | 0.073 | 0.630 | 2.537 |
| p value | 0.345 | 0.065 | <0.001 |
| Confidence interval | −0.128/0.273 | −0.042/1.301 | 1.401/3.673 |
| Macronutrients/ NR | Patient | Gap vs. Nutritional References (NR) | CTRL | GAP vs. Nutritional References (NR) | GAP Patient vs. CTRL | |||
|---|---|---|---|---|---|---|---|---|
| Mean + SD | p-Value | No Difference (no)/Inferior (I)/Superior (S) | Mean + SD | p-Value | No Difference (no)/Inferior (I)/Superior (S) | p-Value | No Difference (no)/Inferior (I)/Superior (S) | |
| %FAT/ <35% | 37.6 ± 4.83 | 0.003 b | S | 41.2 ± 5.77 | <0.001 b | S | 0.009 b | I |
| %SCFA/ <10% | 14.262 ± 3.845 | <0.001 c | S | 14.830 ± 3.455 | <0.001 b | S | 0.283 a | no |
| %TFA/ 0% | 0.709 ± 2.048 | <0.001 c | S | 0.342 ± 0.182 | <0.001 c | S | 0.989 a | no |
| %n-6 PUFA/ 4–8% | 2.127 ± 1.098 | <0.001 c | I | 2.484 ± 1.343 | <0.001 c | I | 0.360 a | no |
| %n-3 PUFA/ 1–2% | 0.330 ± 0.181 | <0.001 c | I | 0.519 ± 0.338 | <0.001 c | I | 0.017 a | I |
| PUFA n-6/n-3 ratio | 7.441 ± 3.970 | 5.932 ± 4.035 | 0.051 a | S (trend) | ||||
| %MUFA/ >10% | 8.756 ± 3.087 | 0.015 b | I | 12.144 ± 5.677 | 0.961 c | no | 0.006 a | I |
| %Free Sugar (FS) <20% | 22.650 ± 13.314 | 0.673 c | S | 14.428 ± 4.760 | <0.001 c | no | <0.001 a | S |
| Fibres/ 25 g/day | 16.891 ± 7.102 | < 0.001 b | I | 22.988 ± 6.397 | 0.048 c | I | 0.001 b | I |
| Micronutrients NR/Day (d) | Patient | Gap vs. Nutritional References (NR) | CTRL | GAP vs. Nutritional References (NR) | GAP Patient vs. CTRL | |||
|---|---|---|---|---|---|---|---|---|
| Mean + SD | p-Value | No Difference (no) /Inferior (I)/Superior (S) | Mean + SD | p-Value | No Difference (no)/Inferior(I) /Superior(S) | p-Value | No Difference (no) /Inferior(I) /Superior(S) | |
| Magnesium (mg)/d M:350 mg F:300 mg | 177.30 ± 72.38 | M: <0.001 b | I | 186 ± 66.3 | M: 0.003 b | I | 0.818 b | no |
| 123.0 ± 58.3 | F: <0.001 b | I | 198.0 ± 51.2 | F: <0.001 b | I | <0.001 b | I | |
| Zinc (mg)/d M:11 mg F:8 mg | 5.00 ± 1.91 | M: <0.001 b | I | 4.00 ± 0.33 | M: <0.001 b | I | 0.460 d | no |
| 2.67 ± 1.06 | F: <0.001 b | I | 4.38 ± 1.4 | F: <0.001 b | I | <0.001 b | I | |
| Vit A (µg)/d M:750 mg F:650 mg | 304 ± 187 | M: <0.001 b | I | 384 ± 209 | M: 0.009 b | I | 0.460 b | no |
| 255 ± 152 | F: <0.001 b | I | 513 ± 305 | F: 0.007 c | I | 0.001 a | I | |
| Vit E (mg)/d M:13 mg F:11 mg | 7.88 ± 5.41 | M: 0.008 b | I | 5.95 ± 2.12 | M: <0.001 b | I | 0.463 b | no |
| 4.42 ± 2.60 | F: <0.001 c | I | 6.95 ± 2.82 | F: <0.001 b | I | 0.003 b | I | |
| Vit C (mg)/d 110 mg | 44.688 ± 36.866 | <0.001 c | I | 74.1 ± 44.4 | <0 .001 c | I | 0.001 a | I |
| AO /(F&V) 550 g/d | 226 ± 182 | <0.001 c | I | 451 ± 199 | 0.003 c | I | <0.001 a | I |
| Food Categories/ NR | Patient | Gap vs. Nutritional References (NR) | CTRL | GAP vs. Nutritional References (NR) | GAP Patient vs. CTRL | |||
|---|---|---|---|---|---|---|---|---|
| Mean + SD | p-Value | No Difference (no)/Inferior(I) /Superior(S) | Mean + SD | p-Value | No Difference (no)/Inferior(I) /Superior(S) | p-Value | No Difference (no)/Inferior(I) /Superior (S) | |
| Fruits & vegetables (F&V) 550 g/day | 226 ± 182 | <0.001 c | I | 451 ± 199 | 0.003 c | I | <0.001 a | I |
| Wholes grains NR:125 g/day | 65.4 ± 63.8 | <0.001 c | I | 68.0 ± 46.3 | <0.001 c | I | 0.502 a | I (trend) |
| Legumes g/week NR:100 g/day | 32.8 ± 72.2 | <0.001 c | I | 166 ± 207 | 0.831 c | no | <0.001 a | I |
| Nutrients | p Value | Spearman Correlation Correlation |
|---|---|---|
| Fat (g) | 0.015 | 0.427 |
| SCFA (g) | 0.034 | 0.375 |
| TFA (g) | 0.006 | 0.476 |
| PUFA n-6 (g) | 0.07 (trend) | 0.324 |
| FreeSugar (FS) (g) | 0.039 | 0.366 |
| F&V (g) | 0.022 | −0.403 |
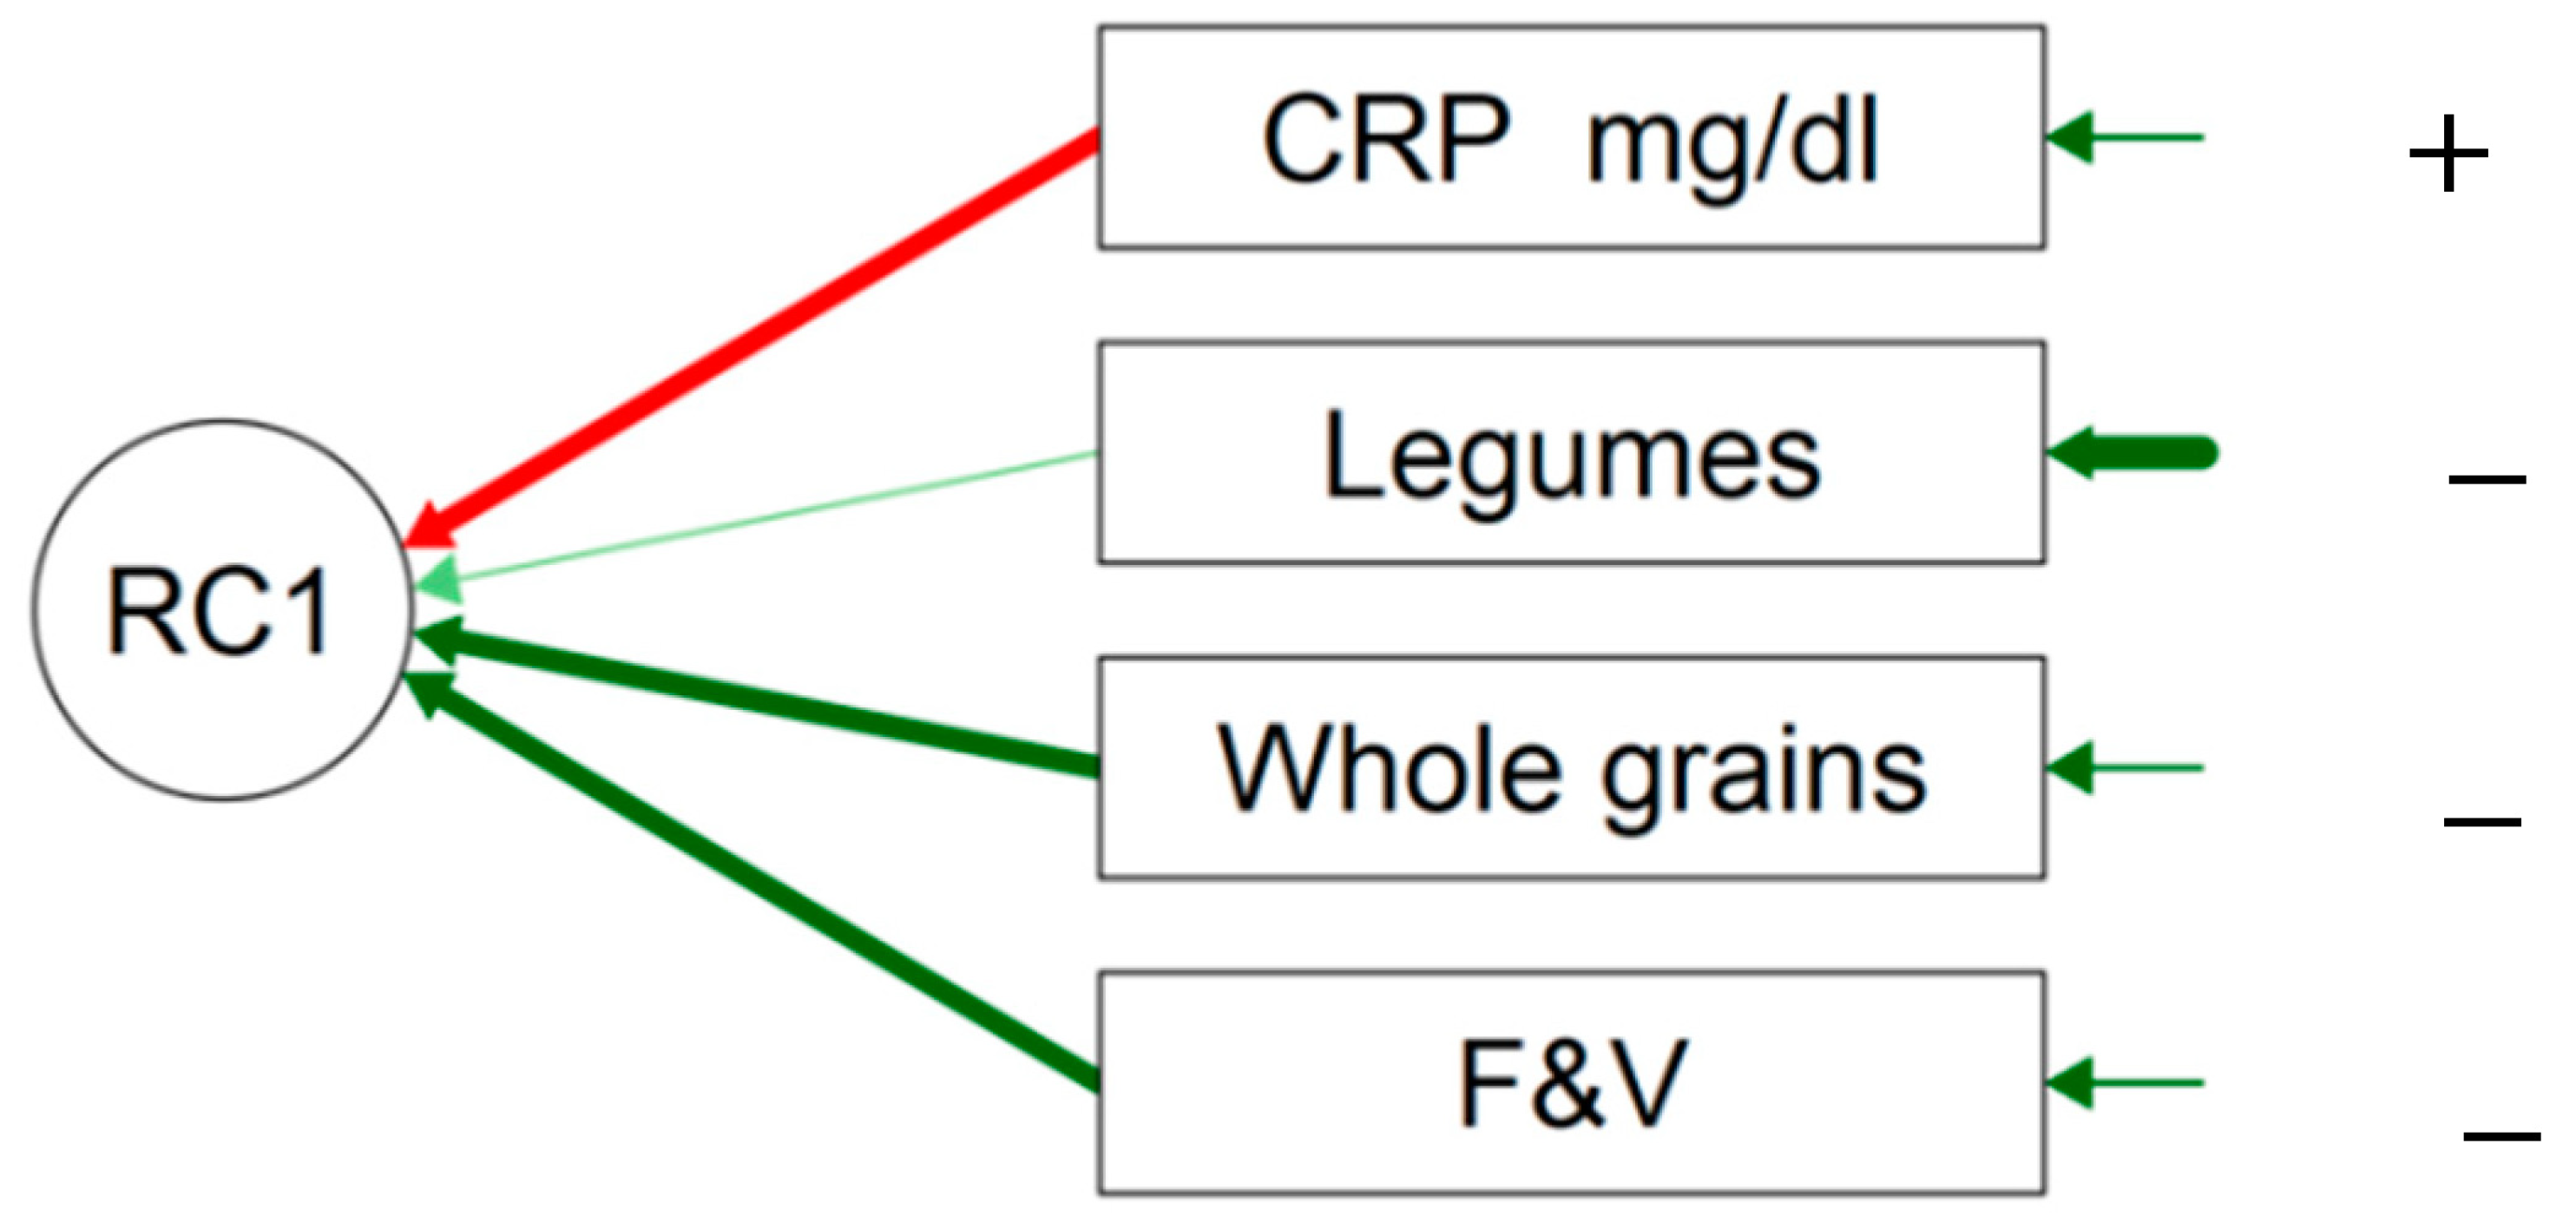
| PC1 | PC2 | Uniqueness | |
|---|---|---|---|
| FAT (g) | 0.910 | 0.168 | |
| SCFA (g) | 0.943 | 0.097 | |
| TFA (g) | 0.742 | 0.311 | |
| FS (g) | 0.506 | 0.412 | 0.574 |
| F&V (g/d) | −0.853 | 0.271 | |
| CRP mg/L | 0.758 | 0.394 |
| PC1 | Uniqueness | |
|---|---|---|
| CRP mg/L | −0.685 | 0.531 |
| legumes(g/w) | 0.588 | 0.654 |
| whole grains (g/d) | 0.595 | 0.646 |
| F&V (g/d) | 0.746 | 0.444 |
Disclaimer/Publisher’s Note: The statements, opinions and data contained in all publications are solely those of the individual author(s) and contributor(s) and not of MDPI and/or the editor(s). MDPI and/or the editor(s) disclaim responsibility for any injury to people or property resulting from any ideas, methods, instructions or products referred to in the content. |
© 2023 by the authors. Licensee MDPI, Basel, Switzerland. This article is an open access article distributed under the terms and conditions of the Creative Commons Attribution (CC BY) license (https://creativecommons.org/licenses/by/4.0/).
Share and Cite
Bernier, V.; Debarge, M.-H.; Hein, M.; Ammendola, S.; Mungo, A.; Loas, G. Major Depressive Disorder, Inflammation, and Nutrition: A Tricky Pattern? Nutrients 2023, 15, 3438. https://doi.org/10.3390/nu15153438
Bernier V, Debarge M-H, Hein M, Ammendola S, Mungo A, Loas G. Major Depressive Disorder, Inflammation, and Nutrition: A Tricky Pattern? Nutrients. 2023; 15(15):3438. https://doi.org/10.3390/nu15153438
Chicago/Turabian StyleBernier, Veronique, Marie-Hélène Debarge, Matthieu Hein, Sarah Ammendola, Anais Mungo, and Gwenole Loas. 2023. "Major Depressive Disorder, Inflammation, and Nutrition: A Tricky Pattern?" Nutrients 15, no. 15: 3438. https://doi.org/10.3390/nu15153438
APA StyleBernier, V., Debarge, M.-H., Hein, M., Ammendola, S., Mungo, A., & Loas, G. (2023). Major Depressive Disorder, Inflammation, and Nutrition: A Tricky Pattern? Nutrients, 15(15), 3438. https://doi.org/10.3390/nu15153438