
Cross-Classification Analysis of Food Products Based on Nutritional Quality and Degree of Processing


Abstract
1. Introduction
2. Materials and Methods
2.1. Data Collection
2.2. Food Classification
2.3. Nutri-Score
2.4. NOVA Classification
2.5. Multiple Traffic Lights System
2.6. Statistical Analysis
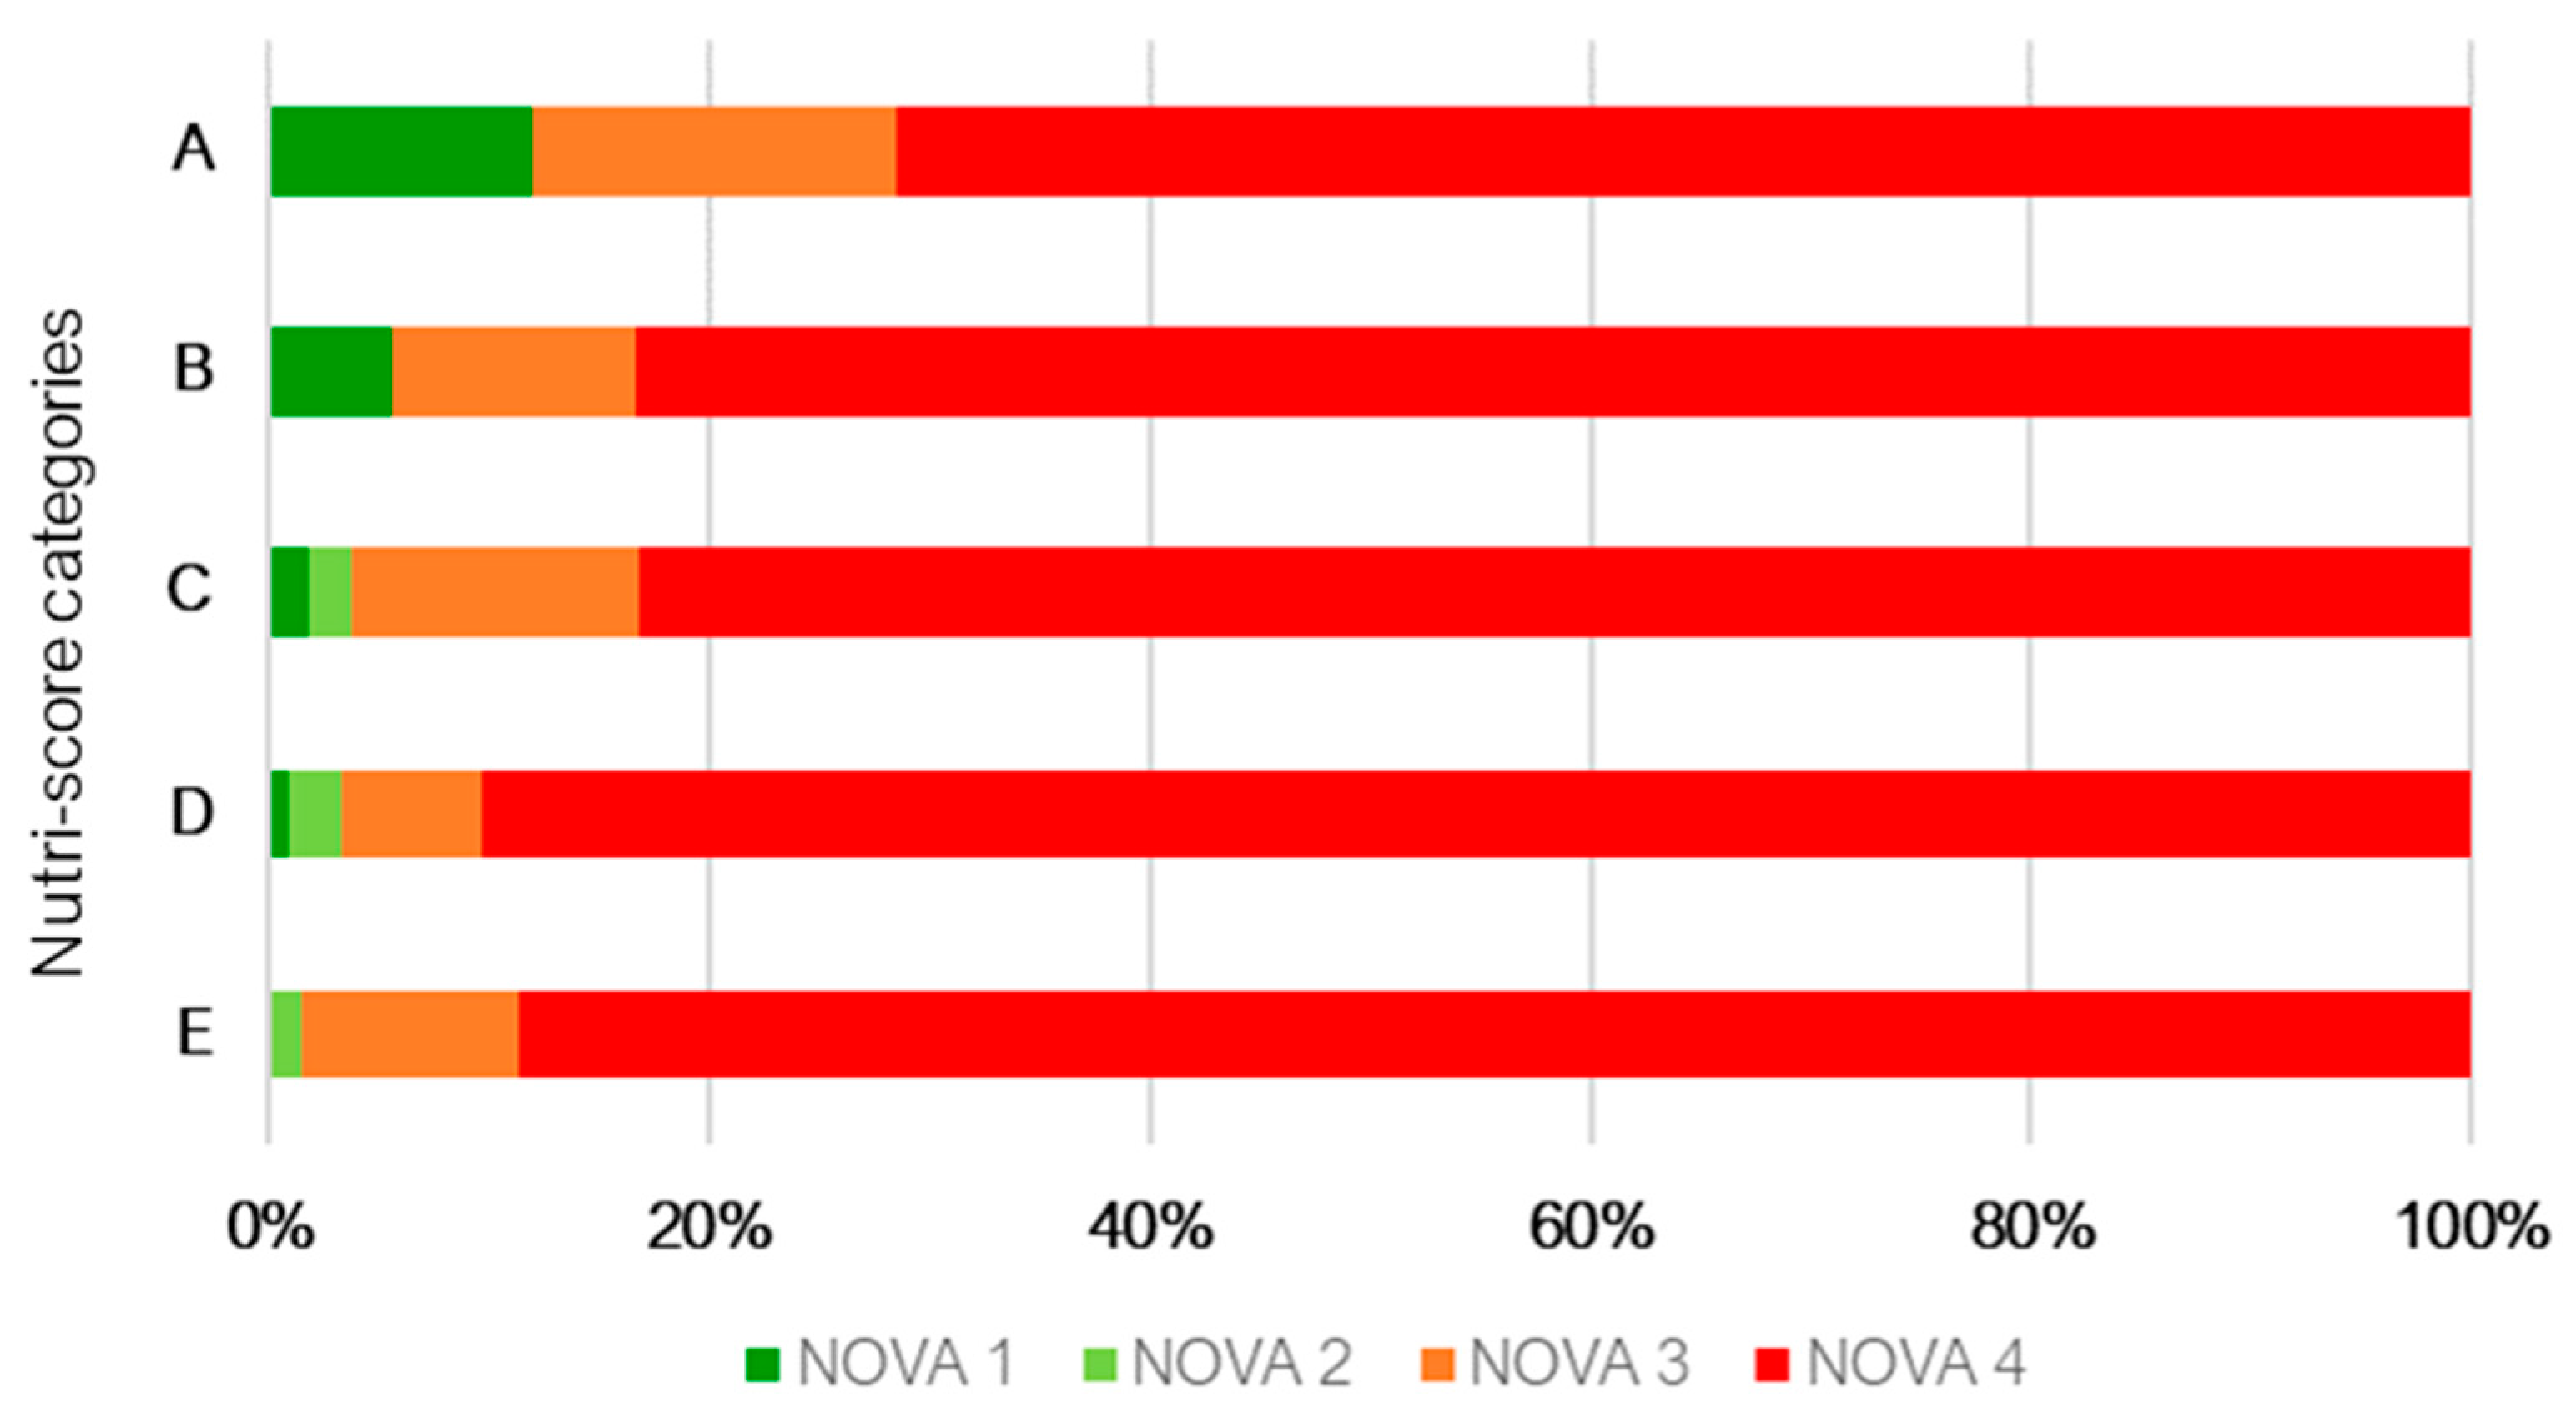
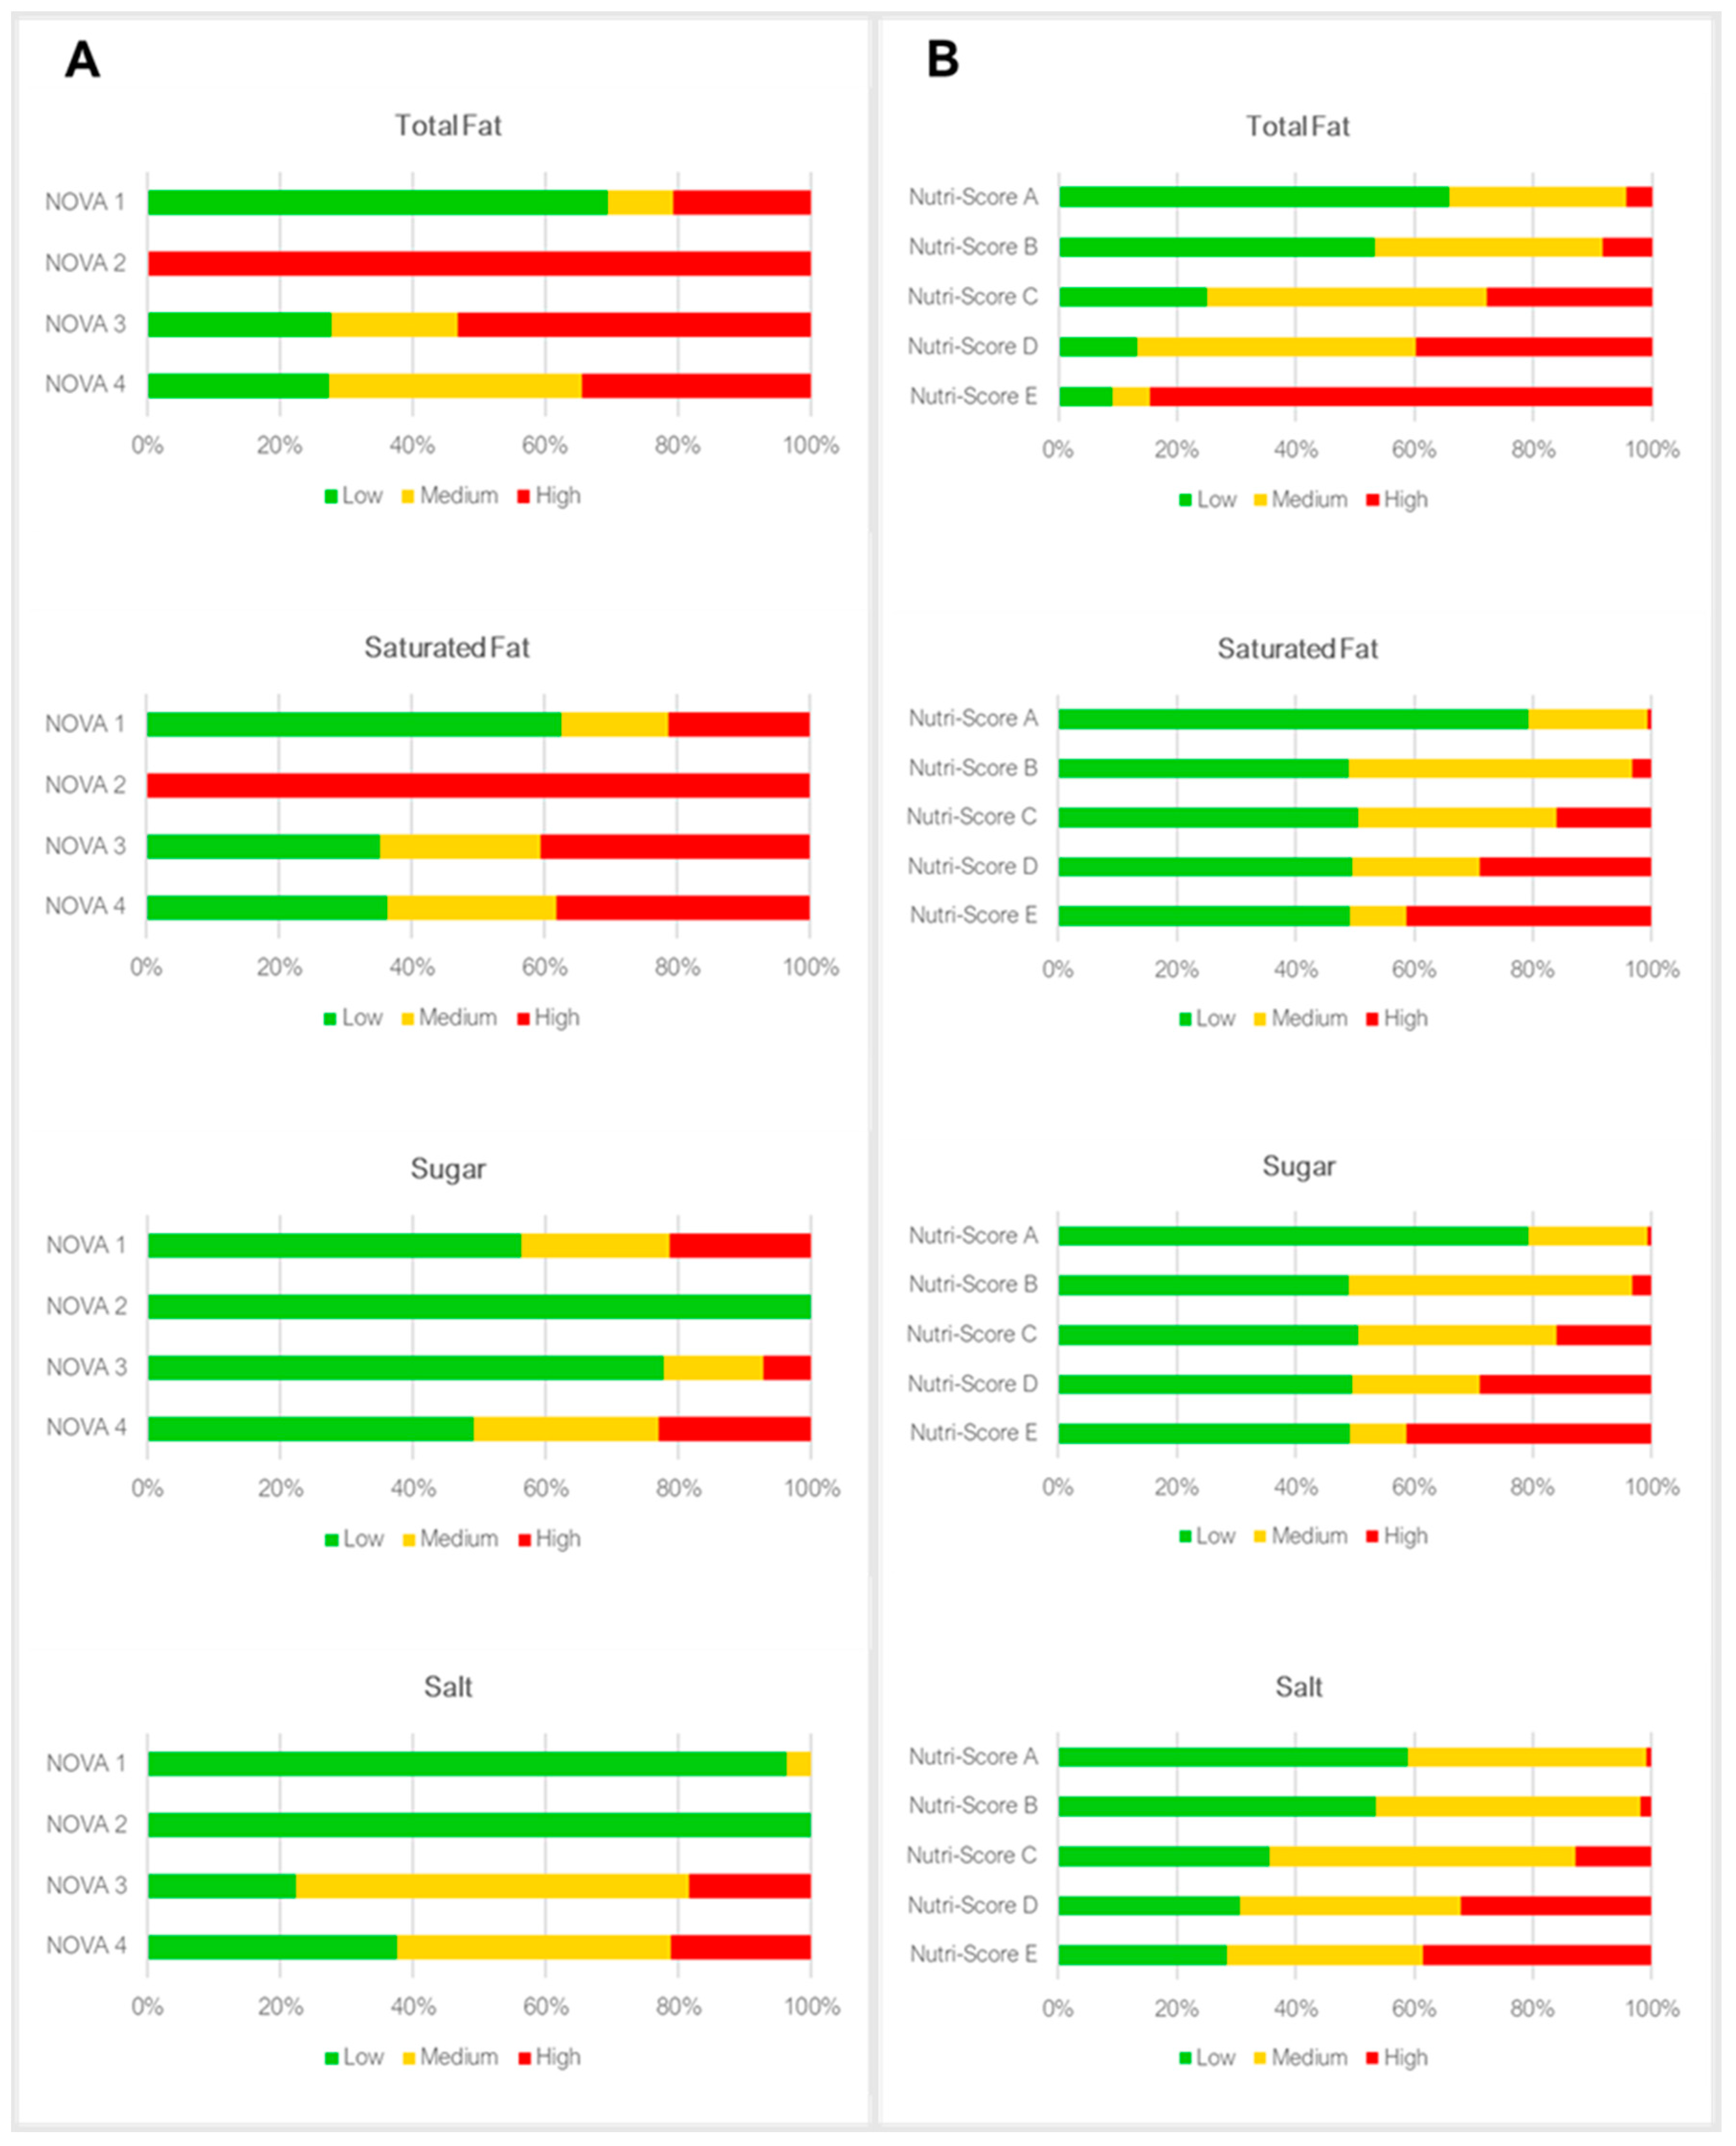
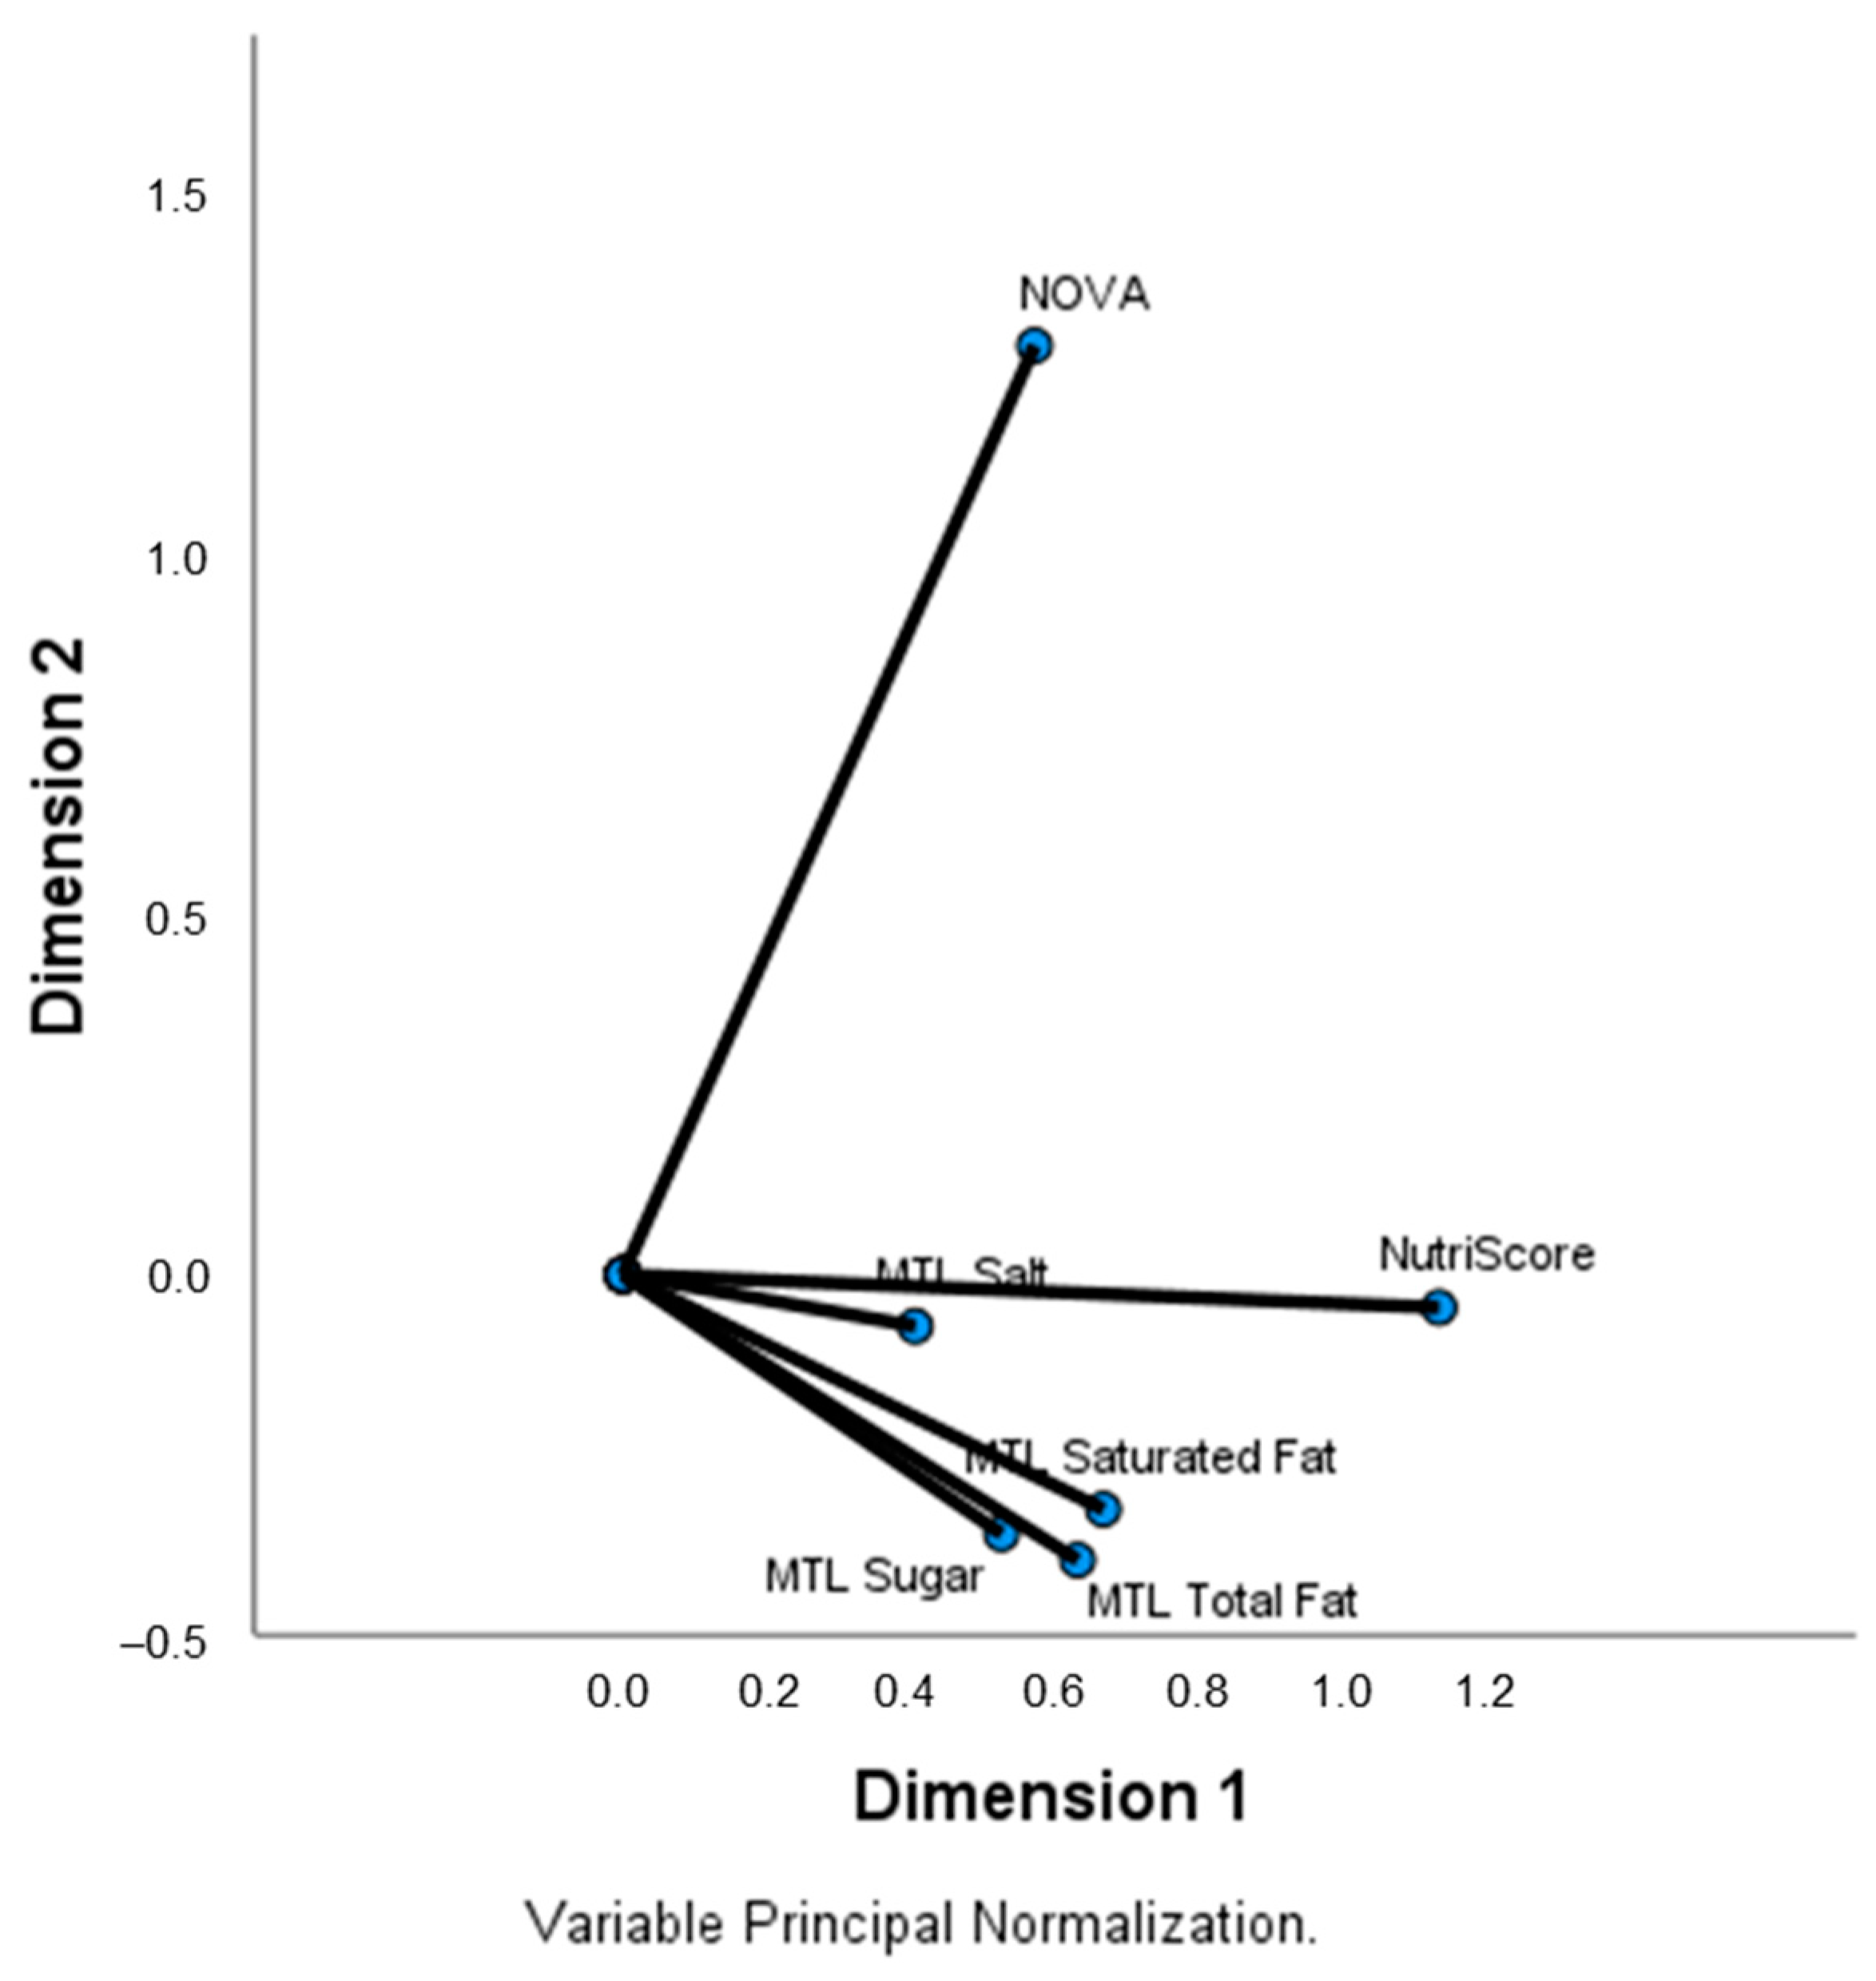
3. Results
4. Discussion
5. Conclusions
Author Contributions
Funding
Institutional Review Board Statement
Informed Consent Statement
Data Availability Statement
Acknowledgments
Conflicts of Interest
Appendix A

| Groups and Subgroups | Foods Included | |
|---|---|---|
| Fruits, vegetables and pulses | ||
| Vegetables | Fresh | Vegetables in natura. |
| Processed | Frozen and canned vegetables, pickles and pates. | |
| Nuts and seeds | Nuts | Various nuts, including almonds, peanuts, walnut and cashew. |
| Seeds | Various seeds, including flaxseed, chia, pumpkin and pine nuts. | |
| Processed nuts | Caramelized nuts, peanut and almond butter, tahini. | |
| Fresh fruit | Fresh fruit | Fruit in natura |
| Fruit jars | Commercial fruit jars intended for infant feeding | |
| Processed fruit | Canned fruit | Canned fruit in sugar syrup. |
| Dehydrated fruit | Dried and dehydrated fruit. | |
| Pulses | Dried and fresh pulses, including beans, chickpeas, green peas, broad beans and lentils. | |
| Soup | ||
| Soups | Vegetable, meat and fish soups | |
| Dairy products | ||
| Milk | Milk | Cow’s milk, goat and sheep milk, fat milk, half-fat and skimmed milk, lactose-free milk, and easy-to-digest milk. |
| Processed milk | Milkshakes, chocolate milk and flavoured milk. | |
| Milk powder, condensed and evaporated | Milk powder, condensed milk and evaporated milk. | |
| Dairy cream | Pasteurized and UHT cream, whipped cream and flavoured cooking cream. | |
| Yogurt and other fermented milk | Solid yogurts and fermented solid milk, liquid yogurts, fat and skimmed yogurts and kefir. | |
| Cheese and Curd | Goat, cow, sheep, fresh, cured, cream and curd cheese and protected designation of origin (PDO) products. | |
| Cereals, derivatives and tubers | ||
| Pasta | Fresh and dry pasta, stuffed pasta, whole and gluten-free pasta. | |
| Rice and other grains | Rice | Common rice, brown and wild rice. |
| Other grains | Various grains, including corn, buckwheat, quinoa, bulgur and oats. | |
| Potatoes and other tubers | Potato, sweet potato, yam, cassava. | |
| Bread and toasts | All kinds of bread of different cereals, including bread, toast, bread, breadcrumbs, and gressinos. | |
| Flour, pasta for bread and pastries | Flours, starches, flakes, semolinas, pasta for bread, pizza dough, broken dough, puff pastry and sanded. | |
| Infant cereals | Dairy and non-dairy flour | |
| Breakfast cereals and cereal bars | Breakfast cereals | Sugary cereals, muesli, granola, bran. |
| Cereal bars | Sugary cereal bars, simple, with fruit, with chocolate. | |
| Meat, seafood and eggs | ||
| Meat | Poultry meat and breeding | Chicken meat, turkey, rabbit, hare, pigeon, quail, duck |
| Red meat | Beef, veal, goat, lamb, lamb, pork, boar, horse, goat. | |
| Entrails | Various entrails include chicken, pig, cow, veal, and sheep. | |
| Cold cuts and other processed meats | Cold cuts and other meats | |
| Seafood | Fresh, dry and canned fish | Fresh, dried, canned fish, fish roe, and dried fish, including codfish and smoked salmon. |
| Crustaceans, molluscs, derivatives and other | Octopus, squid, shrimp, clams, mussels, oysters, including canned. | |
| Processed fish | Fish fingers, whims of the sea, pates, surimi, fish pastes. | |
| Eggs | Chicken eggs, quail, egg powder, liquid egg, egg white. | |
| Oils and fats | ||
| Vegetal oils | Peanut oil, palm, soybean, corn, sunflower and mixtures. | |
| Olive oil | Olive oil | |
| Butter | Salted butter, unsalted butter, lactose-free butter. | |
| Margarines and minarines | Vegetable creams, minarines, margarines, industrial fats | |
| Other fats | Fish oil, lard and sebum | |
| Sweets, cakes and cookies | ||
| Sweets | Added sugar | White sugar, brown, demerara, vanilla. |
| Honey, molasses and syrup | Honey, molasses and syrup | |
| Jellies, jams and candied fruits | Jams, fruit jam, jellies, marmalade, guava jelly, candied fruits. | |
| Sweets, gums and chewing gum | Sweets, jellybeans and gums. | |
| Chocolates and chocolate snacks | Chocolates and chocolate snacks. | |
| Ice cream | Milk and cream ice creams and sorbets | |
| Sweet desserts | Dairy desserts, chocolate mousse, fruit mousses, eggs-based Portuguese desserts and egg creams, gelatine. | |
| Cakes | Cakes, pies, croissants and other pastries with or without cream, including homemade recipes. | |
| Biscuits and commercial cookies | Cookies, water and salt crackers, chocolate and stuffed cookies, cookies with topping, whole cookies and other types. | |
| Artificial sweeteners | ||
| Artificial sweeteners | Aspartame, sucrose, sucralose, stevia, sodium cyclamate. | |
| Snacks, pretzels and pizzas | ||
| Snacks and packed chips | Bread snacks, packed chips, salted popcorn and packaged fried snacks. | |
| Stuffed and fried patties and pizzas | Patties, croquettes, codfish cakes, pies, meatballs, puff pastry and pizzas. | |
| Meat substitutes | ||
| Meat substitutes | Vegetable burger, vegetable sausage, tofu, seitan, veggie pâté. | |
| Milk and dairy products substitutes | ||
| Milk and dairy products substitutes | Coconut, oat and soy drinks, soy yogurt, vegetable yogurt, soy dessert, non-dairy cream. | |
| Adding salt | ||
| Adding salt | Coarse salt, table salt, iodate salt and salt flower. | |
| Others | ||
| Others | Yeasts and gelatines, aromas and essentials, herbs and spices, condiments, sauces and mayonnaises, broths and soups powdered. | |
| Non-alcoholic beverages | ||
| Water | Natural mineral water, carbonated mineral water, and flavoured water. | |
| Tea and infusions | Black and green tea, herbs and fruit infusions. | |
| Coffee | Coffee, decaffeinated, coffee mixes, chicory, substitutes and coffee substitutes. | |
| Natural fruit juices and 100% juices | Natural fruit juices, 100% fruit and vegetable juices | |
| Nectars | Fruit and vegetable nectars, light nectars. | |
| Soft drinks | Soft drinks with and without gas, lemonade, tonic water, energy drinks, concentrated juices. | |
| Other non-alcoholic beverages | Isotonic drinks, non-alcoholic beer and non-alcoholic cocktails. | |
| Alcoholic beverages | ||
| Wine | White, green and red wine. | |
| Generous wines and liqueurs | Porto wine, moscatel, liqueurs, Martini. | |
| Beer | White, black and redhead beer | |
| Distilled beverages | Whisky, brandy, tequila, rum. | |
| Other alcoholic beverages | Cider, sangria, panaché, poncha. | |
References
- GBD Risk Factors Collaborators. Global burden of 87 risk factors in 204 countries and territories, 1990–2019: A systematic analysis for the Global Burden of Disease Study 2019. Lancet 2020, 396, 1223–1249. [Google Scholar] [CrossRef] [PubMed]
- Micha, R.; Shulkin, M.L.; Penalvo, J.L.; Khatibzadeh, S.; Singh, G.M.; Rao, M.; Fahimi, S.; Powles, J.; Mozaffarian, D. Etiologic effects and optimal intakes of foods and nutrients for risk of cardiovascular diseases and diabetes: Systematic reviews and meta-analyses from the Nutrition and Chronic Diseases Expert Group (NutriCoDE). PLoS ONE 2017, 12, e0175149. [Google Scholar] [CrossRef] [PubMed]
- Schulze, M.B.; Martinez-Gonzalez, M.A.; Fung, T.T.; Lichtenstein, A.H.; Forouhi, N.G. Food based dietary patterns and chronic disease prevention. BMJ 2018, 361, k2396. [Google Scholar] [CrossRef] [PubMed]
- Institute for Health Metrics and Evaluation. Global Burden of Disease Study 2019: GBD Results Tool|GHDx. Available online: http://ghdx.healthdata.org/gbd-results-tool (accessed on 2 November 2022).
- World Health Organization. Guiding Principles and Framework Manual for Front-of-Pack Labelling for Promoting Healthy Diets; WHO: Geneva, Switzerland, 2019. [Google Scholar]
- World Health Organization. Tackling NCDs: “Best Buys” and Other Recommended Interventions for the Prevention and Control of Noncommunicable Diseases; WHO: Geneva, Switzerland, 2017. [Google Scholar]
- Kanter, R.; Vanderlee, L.; Vandevijvere, S. Front-of-package nutrition labelling policy: Global progress and future directions. Public Health Nutr. 2018, 21, 1399–1408. [Google Scholar] [CrossRef] [PubMed]
- Jones, A.; Neal, B.; Reeve, B.; Ni Mhurchu, C.; Thow, A.M. Front-of-pack nutrition labelling to promote healthier diets: Current practice and opportunities to strengthen regulation worldwide. BMJ Glob. Health 2019, 4, e001882. [Google Scholar] [CrossRef] [PubMed]
- Goiana-da-Silva, F.; Cruz, E.S.D.; Nobre-da-Costa, C.; Nunes, A.M.; Fialon, M.; Egnell, M.; Galan, P.; Julia, C.; Talati, Z.; Pettigrew, S.; et al. Nutri-Score: The Most Efficient Front-of-Pack Nutrition Label to Inform Portuguese Consumers on the Nutritional Quality of Foods and Help Them Identify Healthier Options in Purchasing Situations. Nutrients 2021, 13, 4335. [Google Scholar] [CrossRef]
- Programa Nacional para a Promoção da Alimentação Saudável. Descodificador de Rótulos. Available online: https://alimentacaosaudavel.dgs.pt/descodificador-de-rotulos/ (accessed on 9 January 2023).
- Food Standards Agency. Guide to Creating a Front of Pack (Fop) Nutrition Label for Pre-Packed Products Sold through Retail Outlets; Department of Health of UK: London, UK, 2016. [Google Scholar]
- Dubois, P.; Albuquerque, P.; Allais, O.; Bonnet, C.; Bertail, P.; Combris, P.; Lahlou, S.; Rigal, N.; Ruffieux, B.; Chandon, P. Effects of front-of-pack labels on the nutritional quality of supermarket food purchases: Evidence from a large-scale randomized controlled trial. J. Acad. Mark. Sci. 2021, 49, 119–138. [Google Scholar] [CrossRef]
- Egnell, M.; Kesse-Guyot, E.; Galan, P.; Touvier, M.; Rayner, M.; Jewell, J.; Breda, J.; Hercberg, S.; Julia, C. Impact of Front-of-Pack Nutrition Labels on Portion Size Selection: An Experimental Study in a French Cohort. Nutrients 2018, 10, 1268. [Google Scholar] [CrossRef]
- Crosetto, P.; Lacroix, A.; Muller, L.; Ruffieux, B. Nutritional and economic impact of five alternative front-of-pack nutritional labels: Experimental evidence. Eur. Rev. Agric. Econ. 2019, 47, 785–818. [Google Scholar] [CrossRef]
- Egnell, M.; Crosetto, P.; d’Almeida, T.; Kesse-Guyot, E.; Touvier, M.; Ruffieux, B.; Hercberg, S.; Muller, L.; Julia, C. Modelling the impact of different front-of-package nutrition labels on mortality from non-communicable chronic disease. Int. J. Behav. Nutr. Phys. Act. 2019, 16, 56. [Google Scholar] [CrossRef]
- Gomez-Donoso, C.; Martinez-Gonzalez, M.A.; Perez-Cornago, A.; Sayon-Orea, C.; Martinez, J.A.; Bes-Rastrollo, M. Association between the nutrient profile system underpinning the Nutri-Score front-of-pack nutrition label and mortality in the SUN project: A prospective cohort study. Clin. Nutr. 2021, 40, 1085–1094. [Google Scholar] [CrossRef] [PubMed]
- Donat-Vargas, C.; Sandoval-Insausti, H.; Rey-Garcia, J.; Ramon Banegas, J.; Rodriguez-Artalejo, F.; Guallar-Castillon, P. Five-color Nutri-Score labeling and mortality risk in a nationwide, population-based cohort in Spain: The Study on Nutrition and Cardiovascular Risk in Spain (ENRICA). Am. J. Clin. Nutr. 2021, 113, 1301–1311. [Google Scholar] [CrossRef] [PubMed]
- Fiolet, T.; Srour, B.; Sellem, L.; Kesse-Guyot, E.; Alles, B.; Mejean, C.; Deschasaux, M.; Fassier, P.; Latino-Martel, P.; Beslay, M.; et al. Consumption of ultra-processed foods and cancer risk: Results from NutriNet-Sante prospective cohort. BMJ 2018, 360, k322. [Google Scholar] [CrossRef] [PubMed]
- Canhada, S.L.; Luft, V.C.; Giatti, L.; Duncan, B.B.; Chor, D.; Fonseca, M.; Matos, S.M.A.; Molina, M.; Barreto, S.M.; Levy, R.B.; et al. Ultra-processed foods, incident overweight and obesity, and longitudinal changes in weight and waist circumference: The Brazilian Longitudinal Study of Adult Health (ELSA-Brasil). Public Health Nutr. 2020, 23, 1076–1086. [Google Scholar] [CrossRef]
- Costa de Miranda, R.; Rauber, F.; de Moraes, M.M.; Afonso, C.; Santos, C.; Rodrigues, S.; Levy, R.B.; Group, U. Consumption of ultra-processed foods and non-communicable disease-related nutrient profile in Portuguese adults and elderly (2015–2016): The UPPER project. Br. J. Nutr. 2021, 125, 1177–1187. [Google Scholar] [CrossRef]
- Lane, M.M.; Davis, J.A.; Beattie, S.; Gomez-Donoso, C.; Loughman, A.; O’Neil, A.; Jacka, F.; Berk, M.; Page, R.; Marx, W.; et al. Ultraprocessed food and chronic noncommunicable diseases: A systematic review and meta-analysis of 43 observational studies. Obes. Rev. 2021, 22, e13146. [Google Scholar] [CrossRef]
- Juul, F.; Vaidean, G.; Parekh, N. Ultra-processed Foods and Cardiovascular Diseases: Potential Mechanisms of Action. Adv. Nutr. 2021, 12, 1673–1680. [Google Scholar] [CrossRef]
- Monteiro, C.A.; Cannon, G.; Moubarac, J.C.; Levy, R.B.; Louzada, M.L.C.; Jaime, P.C. The UN Decade of Nutrition, the NOVA food classification and the trouble with ultra-processing. Public Health Nutr. 2018, 21, 5–17. [Google Scholar] [CrossRef]
- Lawrence, M.A.; Baker, P.I. Ultra-processed food and adverse health outcomes. BMJ 2019, 365, l2289. [Google Scholar] [CrossRef]
- Romero Ferreiro, C.; Lora Pablos, D.; Gomez de la Camara, A. Two Dimensions of Nutritional Value: Nutri-Score and NOVA. Nutrients 2021, 13, 2783. [Google Scholar] [CrossRef]
- European Food Safety Authority (EFSA). The Food Classification and Description System FoodEx 2; Revision 2; EFSA Supporting Publications: Parma, Italy, 2015; pp. 804–890. [Google Scholar]
- Julia, C.; Etile, F.; Hercberg, S. Front-of-pack Nutri-Score labelling in France: An evidence-based policy. Lancet Public Health 2018, 3, e164. [Google Scholar] [CrossRef]
- Hafner, E.; Pravst, I. Evaluation of the Ability of Nutri-Score to Discriminate the Nutritional Quality of Prepacked Foods Using a Sale-Weighting Approach. Foods 2021, 10, 1689. [Google Scholar] [CrossRef] [PubMed]
- Eržen, N.; Rayner, M.; Pravst, I. A comparative evaluation of the use of a food composition database and nutrition declarations for nutrient profiling. J. Food Nutr. Res. 2015, 54, 93–100. [Google Scholar] [CrossRef]
- Monteiro, C.A.; Cannon, G.; Lawrence, M.; Laura Da Costa Louzada, M.; Priscila Pereira, M. Ultra-Processed Foods, Diet Quality, and Health Using the NOVA Classification System; Food and Agriculture Organization of the United Nations: Washington, DC, USA, 2019. [Google Scholar]
- Gibney, M.J. Ultra-Processed Foods: Definitions and Policy Issues. Curr. Dev. Nutr. 2019, 3, nzy077. [Google Scholar] [CrossRef] [PubMed]
- Buckley, J.P.; Kim, H.; Wong, E.; Rebholz, C.M. Ultra-processed food consumption and exposure to phthalates and bisphenols in the US National Health and Nutrition Examination Survey, 2013–2014. Environ. Int. 2019, 131, 105057. [Google Scholar] [CrossRef]
- Serrano, S.E.; Braun, J.; Trasande, L.; Dills, R.; Sathyanarayana, S. Phthalates and diet: A review of the food monitoring and epidemiology data. Environ. Health 2014, 13, 43. [Google Scholar] [CrossRef]
- Fardet, A.; Rock, E. Ultra-processed foods: A new holistic paradigm? Trends Food Sci. Technol. 2019, 93, 174–184. [Google Scholar] [CrossRef]
- Harlan, T.S.; Gow, R.V.; Kornstadt, A.; Alderson, P.W.; Lustig, R.H. The Metabolic Matrix: Re-engineering ultraprocessed foods to feed the gut, protect the liver, and support the brain. Front. Nutr. 2023, 10, 1098453. [Google Scholar] [CrossRef]
- Wang, M.; Du, X.; Huang, W.; Xu, Y. Ultra-processed Foods Consumption Increases the Risk of Hypertension in Adults: A Systematic Review and Meta-analysis. Am. J. Hypertens. 2022, 35, 892–901. [Google Scholar] [CrossRef]
- Moradi, S.; Entezari, M.H.; Mohammadi, H.; Jayedi, A.; Lazaridi, A.V.; Kermani, M.A.H.; Miraghajani, M. Ultra-processed food consumption and adult obesity risk: A systematic review and dose-response meta-analysis. Crit. Rev. Food Sci. Nutr. 2023, 63, 249–260. [Google Scholar] [CrossRef]
- Moradi, S.; Hojjati Kermani, M.A.; Bagheri, R.; Mohammadi, H.; Jayedi, A.; Lane, M.M.; Asbaghi, O.; Mehrabani, S.; Suzuki, K. Ultra-Processed Food Consumption and Adult Diabetes Risk: A Systematic Review and Dose-Response Meta-Analysis. Nutrients 2021, 13, 4410. [Google Scholar] [CrossRef] [PubMed]
- Lane, M.M.; Gamage, E.; Travica, N.; Dissanayaka, T.; Ashtree, D.N.; Gauci, S.; Lotfaliany, M.; O’Neil, A.; Jacka, F.N.; Marx, W. Ultra-Processed Food Consumption and Mental Health: A Systematic Review and Meta-Analysis of Observational Studies. Nutrients 2022, 14, 2568. [Google Scholar] [CrossRef] [PubMed]
- Ben-Avraham, S.; Kohn, E.; Tepper, S.; Lubetzky, R.; Mandel, D.; Berkovitch, M.; Shahar, D.R. Ultra-processed food (UPF) intake in pregnancy and maternal and neonatal outcomes. Eur. J. Nutr. 2023, 62, 1403–1413. [Google Scholar] [CrossRef] [PubMed]
- Cummings, J.R.; Lipsky, L.M.; Schwedhelm, C.; Liu, A.; Nansel, T.R. Associations of ultra-processed food intake with maternal weight change and cardiometabolic health and infant growth. Int. J. Behav. Nutr. Phys. Act. 2022, 19, 61. [Google Scholar] [CrossRef] [PubMed]
- Suksatan, W.; Moradi, S.; Naeini, F.; Bagheri, R.; Mohammadi, H.; Talebi, S.; Mehrabani, S.; Hojjati Kermani, M.A.; Suzuki, K. Ultra-Processed Food Consumption and Adult Mortality Risk: A Systematic Review and Dose-Response Meta-Analysis of 207,291 Participants. Nutrients 2021, 14, 174. [Google Scholar] [CrossRef] [PubMed]
- Taneri, P.E.; Wehrli, F.; Roa-Diaz, Z.M.; Itodo, O.A.; Salvador, D.; Raeisi-Dehkordi, H.; Bally, L.; Minder, B.; Kiefte-de Jong, J.C.; Laine, J.E.; et al. Association Between Ultra-Processed Food Intake and All-Cause Mortality: A Systematic Review and Meta-Analysis. Am. J. Epidemiol. 2022, 191, 1323–1335. [Google Scholar] [CrossRef]
- Fardet, A.; Rock, E. Perspective: Reductionist Nutrition Research Has Meaning Only within the Framework of Holistic and Ethical Thinking. Adv. Nutr. 2018, 9, 655–670. [Google Scholar] [CrossRef]
- De Temmerman, J.; Heeremans, E.; Slabbinck, H.; Vermeir, I. The impact of the Nutri-Score nutrition label on perceived healthiness and purchase intentions. Appetite 2021, 157, 104995. [Google Scholar] [CrossRef]
- Gassler, B.; Faesel, C.K.; Moeser, A. Toward a differentiated understanding of the effect of Nutri-Score nutrition labeling on healthier food choices. Agribusiness 2023, 39, 28–50. [Google Scholar] [CrossRef]
- UFC-Que Choisir: Service des Études et du Lobbying. L’efficacité du Nutri-Score à Améliorer les Recettes Bridée par son Application Volontaire: Étude sur L’évolution Entre 2015 et 2022 de la Qualité Nutritionnelle des Aliments en Lien Avec L’adoption du Nutri-Score; Union Fédéral des Consommateurs (UFC-Que Choisir): Paris, France, 2023. [Google Scholar]
- Martini, D.; Godos, J.; Bonaccio, M.; Vitaglione, P.; Grosso, G. Ultra-Processed Foods and Nutritional Dietary Profile: A Meta-Analysis of Nationally Representative Samples. Nutrients 2021, 13, 3390. [Google Scholar] [CrossRef]
- Bonaccio, M.; Di Castelnuovo, A.; Ruggiero, E.; Costanzo, S.; Grosso, G.; De Curtis, A.; Cerletti, C.; Donati, M.B.; de Gaetano, G.; Iacoviello, L.; et al. Joint association of food nutritional profile by Nutri-Score front-of-pack label and ultra-processed food intake with mortality: Moli-sani prospective cohort study. BMJ 2022, 378, e070688. [Google Scholar] [CrossRef] [PubMed]
- Dicken, S.J.; Batterham, R.L. The Role of Diet Quality in Mediating the Association between Ultra-Processed Food Intake, Obesity and Health-Related Outcomes: A Review of Prospective Cohort Studies. Nutrients 2021, 14, 23. [Google Scholar] [CrossRef] [PubMed]
- Julia, C.; Baudry, J.; Fialon, M.; Hercberg, S.; Galan, P.; Srour, B.; Andreeva, V.A.; Touvier, M.; Kesse-Guyot, E. Respective contribution of ultra-processing and nutritional quality of foods to the overall diet quality: Results from the NutriNet-Sante study. Eur. J. Nutr. 2023, 62, 157–164. [Google Scholar] [CrossRef] [PubMed]


| Total Fat | Saturated Fat | Sugar | Salt | |
|---|---|---|---|---|
| Foods | g/100 g | |||
| Low | ≤3 | ≤1.5 | ≤5 | ≤0.3 |
| Medium | 3–17.5 | 1.5–5 | 5–22.5 | 0.3–1.5 |
| High | >17.5 | >5 | >22.5 | >1.5 |
| Beverages | g/100 mL | |||
| Low | ≤1.5 | ≤0.75 | ≤2.5 | ≤0.3 |
| Medium | 1.5–8.75 | 0.75–2.5 | 2.5–11.25 | 0.3–0.75 |
| High | >8.75 | >2.5 | >11.25 | 0.75 |
| NOVA Classification | Nutri-Score | ||||||||||
|---|---|---|---|---|---|---|---|---|---|---|---|
| Food Group | Food Subgroup | 1 | 2 | 3 | 4 | A | B | C | D | E | FSAm-NPS Score |
| n (%) | n (%) | Median (P25; P75) | |||||||||
| Fruits, vegetables and pulses (n = 146) | Vegetables (n = 31) | 8 (25.8) | 0 (0.0) | 3 (9.7) | 20 (64.5) | 20 (62.5) | 5 (16.1) | 5 (16.1) | 1 (3.2) | 0 (0.0) | −2.0 (−6.0; 1.0) |
| Nuts and seeds (n = 30) | 19 (63.3) | 0 (0.0) | 9 (30.0) | 2 (6.7) | 9 (30.0) | 10 (33.3) | 6 (20.0) | 5 (16.7) | 0 (0.0) | 2.0 (−1.0; 5.5) | |
| Processed fruit (n = 33) | 14 (42.4) | 0 (0.0) | 13 (39.4) | 6 (18.2) | 6 (18.2) | 11 (33.3) | 14 (42.4) | 2 (6.1) | 0 (0.0) | 2.0 (0.0; 4.0) | |
| Pulses (n = 52) | 3 (5.8) | 0 (0.0) | 35 (67.3) | 14 (26.9) | 44 (84.6) | 3 (5.8) | 5 (9.6) | 0 (0.0) | 0 (0.0) | −8.0 (−8.0; −4.0) | |
| Dairy products (n = 452) | Milk (n = 43) | 0 (0.0) | 0 (0.0) | 2 (4.7) | 41 (95.3) | 16 (37.2) | 24 (55.8) | 1 (2.3) | 1 (2.3) | 1 (2.3) | 0.0 (−1.0; 1.0) |
| Dairy cream (n = 17) | 0 (0.0) | 1 (5.9) | 0 (0.0) | 16 (94.1) | 0 (0.0) | 0 (0.0) | 0 (0.0) | 17 (100) | 0 (0.0) | 14.0 (12.5; 14.5) | |
| Yogurt and other fermented milk (n = 244) | 12 (4.9) | 0 (0.0) | 9 (3.7) | 223 (91.4) | 58 (23.8) | 124 (50.8) | 61 (25.0) | 1 (0.4) | 0 (0.0) | 1.0 (0.0; 3.0) | |
| Cheese and Curd (n = 148) | 0 (0.0) | 0 (0.0) | 45 (30.4) | 103 (69.6) | 0 (0.0) | 15 (10.1) | 37 (25.0) | 46 (31.1) | 50 (33.8) | 6.5 (4.0; 11.0) | |
| Cereals, derivatives and tubers (n = 324) | Rice and other grains (n = 15) | 3 (20.0) | 0 (0.0) | 7 (46.7) | 5 (33.3) | 8 (53.3) | 4 (26.7) | 3 (20.0) | 0 (0.0) | 0 (0.0) | −1.0 (−4.0; 2.0) |
| Potatoes and other tubers (n = 5) | 0 (0.0) | 0 (0.0) | 2 (40.0) | 3 (60.0) | 2 (40.0) | 2 (40.0) | 1 (20.0) | 0 (0.0) | 0 (0.0) | 0.0 (−2.5; 3.5) | |
| Bread and toast (n = 96) | 0 (0.0) | 0 (0.0) | 0 (0.0) | 96 (100) | 36 (37.5) | 26 (27.1) | 23 (24.0) | 11 (11.5) | 0 (0.0) | 0.0 (−2.5; 3.5) | |
| Flours, pasta for bread and pastries (n = 14) | 2 (14.3) | 0 (0.0) | 0 (0.0) | 12 (85.7) | 6 (42.9) | 1 (7.1) | 6 (42.9) | 1 (7.1) | 0 (0.0) | 2.0 (−4.0: 8.0) | |
| Breakfast cereals and cereal bars (n = 194) | 7 (3.6) | 0 (0.0) | 1 (0.5) | 186 (95.9) | 34 (17.5) | 20 (10.3) | 72 (37.1) | 62 (32.0) | 6 (3.1) | 9.0 (0.0; 12.0) | |
| Meat, seafood and eggs (n = 459) | Meat (n = 381) | 1 (0.3) | 0 (0.0) | 16 (4.2) | 364 (95.5) | 2 (0.5) | 24 (6.3) | 38 (10.0) | 147 (38.6) | 170 (44.6) | 17.0 (11.0; 23.0) |
| Seafood (n = 78) | 0 (0.0) | 0 (0.0) | 35 (44.9) | 43 (55.1) | 8 (10.3) | 46 (59.0) | 21 (26.9) | 3 (3.8) | 0 (0.0) | 2.0 (0.0; 3.0) | |
| Oils and fats (n = 101) | Vegetal oils (n = 22) | 0 (0.0) | 18 (81.8) | 0 (0.0) | 4 (18.2) | 0 (0.0) | 0 (0.0) | 1 (4.5) | 17 (77.3) | 4 (18.2) | 11.0 (11.0; 13.0) |
| Olive oil (n = 16) | 0 (0.0) | 13 (81.3) | 0 (0.0) | 3 (18.8) | 0 (0.0) | 0 (0.0) | 16 (100.0) | 0 (0.0) | 0 (0.0) | 6.0 (6.0; 6.0) | |
| Butter (n = 40) | 0 (0.0) | 7 (17.5) | 21 (52.5) | 12 (30.0) | 0 (0.0) | 0 (0.0) | 0 (0.0) | 6 (15.0) | 34 (85.0) | 23.0 (19.0; 25.0) | |
| Margarines and minarines (n = 18) | 0 (0.0) | 0 (0.0) | 0 (0.0) | 18 (100) | 0 (0.0) | 0 (0.0) | 6 (33.3) | 8 (44.4) | 4 (22.2) | 14.0 (9.8; 17.5) | |
| Other fats (n = 5) | 0 (0.0) | 0 (0.0) | 0 (0.0) | 5 (100) | 0 (0.0) | 0 (0.0) | 0 (0.0) | 4 (80.0) | 1 (20.0) | 16.0 (13.0; 19.0) | |
| Sweets, cakes and cookies (n = 576) | Sweets (n = 303) | 0 (0.0) | 0 (0.0) | 4 (1.3) | 299 (98.7) | 6 (2.0) | 7 (2.3) | 71 (23.4) | 101 (33.3) | 118 (38.9) | 16.0 (10.0; 22.0) |
| Cakes (n = 37) | 0 (0.0) | 0 (0.0) | 0 (0.0) | 37 (100) | 0 (0.0) | 2 (5.4) | 2 (5.4) | 17 (45.9) | 16 (43.2) | 18.0 (14.5; 20.5) | |
| Biscuits and commercial cookies (n = 236) | 0 (0.0) | 0 (0.0) | 0 (0.0) | 236 (100) | 3 (1.3) | 6 (2.5) | 47 (19.9) | 89 (37.7) | 91 (38.6) | 17.0 (11.0; 22.0) | |
| Snacks, pretzels and pizzas (n = 264) | Snacks and packed chips (n = 167) | 0 (0.0) | 0 (0.0) | 66 (39.5) | 101 (60.5) | 5 (3.0) | 9 (5.4) | 78 (46.7) | 59 (35.3) | 16 (9.6) | 10.0 (8.0; 14.0) |
| Stuffed and fried patties and pizzas (n = 97) | 0 (0.0) | 0 (0.0) | 0 (0.0) | 97 (100) | 6 (6.2) | 30 (30.9) | 37 (38.1) | 23 (23.7) | 1 (1.0) | 4.0 (2.0; 10.5) | |
| Meat substitutes (n = 58) | 0 (0.0) | 0 (0.0) | 2 (3.4) | 56 (96.6) | 25 (43.1) | 9 (15.5) | 14 (24.1) | 9 (15.5) | 1 (1.7) | 0.5 (−2.0; 9.3) | |
| Milk and dairy products substitutes (n = 65) | 2 (3.1) | 0 (0.0) | 5 (7.7) | 58 (89.2) | 17 (26.2) | 37 (56.9) | 1 (1.5) | 2 (3.1) | 8 (12.3) | 0.0 (−1.0; 1.0) | |
| Ready meals (n = 35) | 0 (0.0) | 0 (0.0) | 4 (11.4) | 31 (88.6) | 6 (17.1) | 13 (37.1) | 13 (37.1) | 3 (8.6) | 0 (0.0) | 2.0 (0.0; 5.0) | |
| Others (n = 54) | 0 (0.0) | 0 (0.0) | 0 (0.0) | 54 (100.0) | 2 (3.7) | 0 (0.0) | 27 (50.0) | 17 (31.5) | 8 (14.8) | 10.0 (6.0; 16.0) | |
| Non-alcoholic beverages (n = 148) | Natural fruit juices and 100% juices (n = 23) | 9 (39.1) | 0 (0.0) | 9 (39.1) | 5 (21.7) | 0 (0.0) | 3 (13.0) | 10 (43.5) | 6 (26.1) | 4 (17.4) | 5.0 (3.0; 7.0) |
| Nectars (n = 21) | 0 (0.0) | 0 (0.0) | 0 (0.0) | 21 (100.0) | 0 (0.0) | 0 (0.0) | 4 (19.0) | 2 (9.5) | 15 (71.4) | 11.0 (6.5; 13.0) | |
| Soft drinks (n = 104) | 0 (0.0) | 0 (0.0) | 0 (0.0) | 104 (100.0) | 0 (0.0) | 12 (11.5) | 23 (22.1) | 38 (36.5) | 31 (29.8) | 6.0 (4.0; 11.0) | |
Disclaimer/Publisher’s Note: The statements, opinions and data contained in all publications are solely those of the individual author(s) and contributor(s) and not of MDPI and/or the editor(s). MDPI and/or the editor(s) disclaim responsibility for any injury to people or property resulting from any ideas, methods, instructions or products referred to in the content. |
© 2023 by the authors. Licensee MDPI, Basel, Switzerland. This article is an open access article distributed under the terms and conditions of the Creative Commons Attribution (CC BY) license (https://creativecommons.org/licenses/by/4.0/).
Share and Cite
Abreu, S.; Liz Martins, M. Cross-Classification Analysis of Food Products Based on Nutritional Quality and Degree of Processing. Nutrients 2023, 15, 3117. https://doi.org/10.3390/nu15143117
Abreu S, Liz Martins M. Cross-Classification Analysis of Food Products Based on Nutritional Quality and Degree of Processing. Nutrients. 2023; 15(14):3117. https://doi.org/10.3390/nu15143117
Chicago/Turabian StyleAbreu, Sandra, and Margarida Liz Martins. 2023. "Cross-Classification Analysis of Food Products Based on Nutritional Quality and Degree of Processing" Nutrients 15, no. 14: 3117. https://doi.org/10.3390/nu15143117
APA StyleAbreu, S., & Liz Martins, M. (2023). Cross-Classification Analysis of Food Products Based on Nutritional Quality and Degree of Processing. Nutrients, 15(14), 3117. https://doi.org/10.3390/nu15143117