
Assessment of Nutritional Status by Bioelectrical Impedance in Adult Patients with Celiac Disease: A Prospective Single-Center Study

 , , , and
Abstract
1. Introduction
2. Materials and Methods
2.1. Study Design and Participants
2.2. Anamnesis and Physical Activity Assessment
2.3. Nutritional Status and Body Composition
2.4. Dietary Habits and Intakes
2.5. Data Analysis
3. Results
3.1. Demographic Data and Lifestyle
3.2. Dietary Habits and Intakes
4. Discussion
Supplementary Materials
Author Contributions
Funding
Institutional Review Board Statement
Informed Consent Statement
Data Availability Statement
Conflicts of Interest
References
- Al-Toma, A.; Volta, U.; Auricchio, R.; Castillejo, G.; Sanders, D.S.; Cellier, C.; Mulder, C.J.; Lundin, K.E.A. European Society for the Study of Coeliac Disease (ESsCD) guideline for coeliac disease and other gluten-related disorders. United Eur. Gastroenterol. J. 2019, 7, 583–613. [Google Scholar] [CrossRef] [PubMed]
- Rubio-Tapia, A.; Ludvigsson, J.F.; Brantner, T.L.; Murray, J.A.; Everhart, J.E. The Prevalence of Celiac Disease in the United States. Am. J. Gastroenterol. 2012, 107, 1538–1544. [Google Scholar] [CrossRef] [PubMed]
- Choung, R.S.; Larson, S.A.; Khaleghi, S.; Rubio-Tapia, A.; Ovsyannikova, I.G.; King, K.S.; Larson, J.J.; Lahr, B.D.; Poland, G.A.; Camilleri, M.J.; et al. Prevalence and Morbidity of Undiagnosed Celiac Disease from a Community-Based Study. Gastroenterology 2017, 152, 830–839.e5. [Google Scholar] [CrossRef] [PubMed]
- Singh, P.; Arora, A.; Strand, T.A.; Leffler, D.A.; Catassi, C.; Green, P.H.; Kelly, C.P.; Ahuja, V.; Makharia, G.K. Global Prevalence of Celiac Disease: Systematic Review and Meta-analysis. Clin. Gastroenterol. Hepatol. 2018, 16, 823–836.e2. [Google Scholar] [CrossRef]
- Gasbarrini, G.; Miele, L.; Malandrino, N.; Grieco, A.; Addolorato, G.; Cammarota, G.; Bonvicini, F. Celiac Disease in the 21st Century: Issues of Under- and Over-Diagnosis. Int. J. Immunopathol. Pharmacol. 2009, 22, 1–7. [Google Scholar] [CrossRef]
- Lebwohl, B.; Sanders, D.S.; Green, P.H.R. Coeliac Disease. Lancet 2018, 6, 70–81. [Google Scholar] [CrossRef]
- Kelly, C.P.; Bai, J.C.; Liu, E.; Leffler, D.A. Advances in Diagnosis and Management of Celiac Disease. Gastroenterology 2015, 148, 1175–1186. [Google Scholar] [CrossRef]
- Downey, L.; Houten, R.; Murch, S.; Longson, D.; Guideline Development Group. Recognition, assessment, and management of coeliac disease: Summary of updated NICE guidance. BMJ 2015, 351, h4513. [Google Scholar] [CrossRef]
- Van Wanrooij, R.L.J.; Bouma, G.; Bontkes, H.J.; Neefjes-Borst, A.; Van Grieken, N.C.; Von Blomberg, B.M.E.; Mulder, C.J.J. Outcome of Referrals for Non-Responsive Celiac Disease in a Tertiary Center: Low Incidence of Refractory Celiac Disease in the Netherlands. Clin. Transl. Gastroenterol. 2017, 8, e218. [Google Scholar] [CrossRef]
- Murray, J.A.; Watson, T.; Clearman, B.; Mitros, F. Effect of a gluten-free diet on gastrointestinal symptoms in celiac disease. Am. J. Clin. Nutr. 2004, 79, 669–673. [Google Scholar] [CrossRef]
- Wild, D.; Robins, G.G.; Burley, V.; Howdle, P.D. Evidence of high sugar intake, and low fibre and mineral intake, in the gluten-free diet. Aliment. Pharmacol. Ther. 2010, 32, 573–581. [Google Scholar] [CrossRef]
- Babio, N.; Alcázar, M.; Castillejo, G.; Recasens, M.; Martínez-Cerezo, F.; Gutiérrez-Pensado, V.; Masip, G.; Vaqué, C.; Vila-Martí, A.; Torres-Moreno, M.; et al. Patients with Celiac Disease Reported Higher Consumption of Added Sugar and Total Fat Than Healthy Individuals. J. Pediatr. Gastroenterol. Nutr. 2017, 64, 63–69. [Google Scholar] [CrossRef]
- Romão, B.; Falcomer, A.L.; Palos, G.; Cavalcante, S.; Botelho, R.B.A.; Nakano, E.Y.; Raposo, A.; Shakeel, F.; Alshehri, S.; Mahdi, W.A.; et al. Glycemic Index of Gluten-Free Bread and Their Main Ingredients: A Systematic Review and Meta-Analysis. Foods 2021, 10, 506. [Google Scholar] [CrossRef]
- Tortora, R.; Capone, P.; De Stefano, G.; Imperatore, N.; Gerbino, N.; Donetto, S.; Monaco, V.; Caporaso, N.; Rispo, A. Metabolic syndrome in patients with coeliac disease on a gluten-free diet. Aliment. Pharmacol. Ther. 2015, 41, 352–359. [Google Scholar] [CrossRef]
- Ciccone, A.; Gabrieli, D.; Cardinale, R.; Di Ruscio, M.; Vernia, F.; Stefanelli, G.; Necozione, S.; Melideo, D.; Viscido, A.; Frieri, G.; et al. Metabolic Alterations in Celiac Disease Occurring after Following a Gluten-Free Diet. Digestion 2019, 100, 262–268. [Google Scholar] [CrossRef]
- Rispo, A.; Imperatore, N.; Guarino, M.; Tortora, R.; Alisi, A.; Cossiga, V.; Testa, A.; Ricciolino, S.; Fiorentino, A.; Morisco, F. Metabolic-associated fatty liver disease (MAFLD) in coeliac disease. Liver Int. 2021, 41, 788–798. [Google Scholar] [CrossRef]
- García-Manzanares, A.; Lucendo, A.J.; González-Castillo, S.; Moreno-Fernández, J. Resolution of metabolic syndrome after following a gluten free diet in an adult woman diagnosed with celiac disease. World J. Gastrointest. Pathophysiol. 2011, 2, 49–52. [Google Scholar] [CrossRef]
- Zingone, F.; Maimaris, S.; Auricchio, R.; Caio, G.P.I.; Carroccio, A.; Elli, L.; Galliani, E.; Montagnani, M.; Valiante, F.; Biagi, F. Guidelines of the Italian societies of gastroenterology on the diagnosis and management of coeliac disease and dermatitis herpetiformis. Dig. Liver Dis. 2022, 54, 1304–1319. [Google Scholar] [CrossRef]
- Kostecka, M.; Kostecka-Jarecka, J.; Iłowiecka, K.; Kostecka, J. An Evaluation of Nutritional Status and Problems with Dietary Compliance in Polish Patients with Celiac Disease. Nutrients 2022, 14, 2581. [Google Scholar] [CrossRef]
- Alhosain, A.I.; Alshammari, G.M.; Almoteri, B.L.; Mohammed, M.A.; Binobead, M.A.; Yahya, M.A. Long-Term Effect of Gluten-Free Diets on Nutritional Status, Body Composition, and Associated Factors in Adult Saudi Females with Celiac Disease. Nutrients 2022, 14, 2090. [Google Scholar] [CrossRef]
- Abenavoli, L.; Delibasic, M.; Peta, V.; Turkulov, V.; De Lorenzo, A.; Medić-Stojanoska, M. Nutritional profile of adult patients with celiac disease. Eur. Rev. Med. Pharmacol. Sci. 2015, 19, 4285–4292. [Google Scholar] [PubMed]
- Ballestero-Fernández, C.; Varela-Moreiras, G.; Úbeda, N.; Alonso-Aperte, E. Nutritional Status in Spanish Adults with Celiac Disease Following a Long-Term Gluten-Free Diet Is Similar to Non-Celiac. Nutrients 2021, 13, 1626. [Google Scholar] [CrossRef] [PubMed]
- Pacheco, G.G.; Cortés, E.C.; Castillo-Durán, C. Micronutrient deficiencies and celiac disease in Pediatrics. Arch. Argent. Pediatr. 2014, 112, 457–463. [Google Scholar] [CrossRef]
- Moya, D.A.; Nugent, C.A.; Baker, R.D.; Baker, S.S. Celiac Disease Nutritional Status and Poor Adherence to Follow-up. Clin. Pediatr. 2020, 59, 649–655. [Google Scholar] [CrossRef]
- Oberhuber, G.; Granditsch, G.; Vogelsang, H. The histopathology of coeliac disease: Time for a standardized report scheme for pathologists. Eur. J. Gastroenterol. Hepatol. 1999, 11, 1185–1194. [Google Scholar] [CrossRef]
- Husby, S.; Koletzko, S.; Korponay-Szabó, I.R.; Mearin, M.L.; Phillips, A.; Shamir, R.; Troncone, R.; Giersiepen, K.; Branski, D.; Catassi, C.; et al. ESPGHAN Working Group on Coeliac Disease Diagnosis, ESPGHAN Gastroenterology Committee, European Society for Pediatric Gastroenterology, Hepatology, and Nutrition, European Society for Pediatric Gastroenterology, Hepatology, and Nutrition guidelines for the diagnosis of coeliac disease. J. Pediatr. Gastroenterol. Nutr. 2012, 54, 136–160. [Google Scholar] [CrossRef]
- Fu, L.; Ren, Z.; Liu, X.; Wu, N.; Zhao, K.; Luo, G.; Yang, H.; Zhang, Y.; Yan, T.; Liu, Y.; et al. Reference Data of Phase Angle Using Bioelectrical Impedance Analysis in Overweight and Obese Chinese. Front. Endocrinol. 2022, 13, 924199. [Google Scholar] [CrossRef]
- Ludvigsson, J.F.; Leffler, D.A.; Bai, J.C.; Biagi, F.; Fasano, A.; Green, P.H.R.; Hadjivassiliou, M.; Kaukinen, K.; Kelly, C.P.; Leonard, J.N.; et al. The Oslo definitions for coeliac disease and related terms. Gut 2013, 62, 43–52. [Google Scholar] [CrossRef]
- Biagi, F.; Bianchi, P.I.; Marchese, A.; Trotta, L.; Vattiato, C.; Balduzzi, D.; Brusco, G.; Andrealli, A.; Cisarò, F.; Astegiano, M.; et al. A score that verifies adherence to a gluten-free diet: A cross-sectional, multicentre validation in real clinical life. Br. J. Nutr. 2012, 108, 1884–1888. [Google Scholar] [CrossRef]
- Lee, P.H.; Macfarlane, D.J.; Lam, T.H.; Stewart, S.M. Validity of the international physical activity questionnaire short form (IPAQ-SF): A systematic review. Int. J. Behav. Nutr. Phys. Act. 2011, 8, 115. [Google Scholar] [CrossRef]
- Craig, C.L.; Marshall, A.L.; Sjöström, M.; Bauman, A.E.; Booth, M.L.; Ainsworth, B.E.; Pratt, M.; Ekelund, U.; Yngve, A.; Sallis, J.F.; et al. International physical activity questionnaire: 12-country reliability and validity. Med. Sci. Sports Exerc. 2003, 35, 1381–1395. [Google Scholar] [CrossRef]
- World Health Organization (WHO). Obesity: Preventing and Managing the Global Epidemic: Report of a WHO Consultation on Obesity; World Health Organization: Geneva, Switzerland, 1997; p. 276. [Google Scholar]
- Stewart, A.; Marfell-Jones, M.; Olds, T.; De Ridder, H. International Standards for Anthropometric Assessment (ISAK); International Society for the Advancement of Kinanthropometry: Lower Hutt, New Zealand, 2011. [Google Scholar]
- Kyle, U.G.; Bosaeus, I.; De Lorenzo, A.D.; Deurenberg, P.; Elia, M.; Gómez, J.M.; Heitmann, B.L.; Kent-Smith, L.; Melchior, J.-C.; Pirlich, M.; et al. Bioelectrical impedance analysis—Part II: Utilization in clinical practice. Clin. Nutr. 2004, 23, 1430–1453. [Google Scholar] [CrossRef]
- Yanovski, S.Z.; Hubbard, V.S.; Heymsfield, S.B.; Lukaski, H.C. Bioelectrical impedance analysis in body composition measurement: National Institutes of Health Technology Assessment Conference Statement. Am. J. Clin. Nutr. 1996, 64, 524S–532S. [Google Scholar] [CrossRef]
- Dittmar, M.; Reber, H.; Kahaly, G.J. Bioimpedance phase angle indicates catabolism in Type 2 diabetes. Diabet. Med. 2015, 32, 1177–1185. [Google Scholar] [CrossRef]
- Capristo, E.; Mingrone, G.; Addolorato, G.; Greco, A.V.; Corazza, G.R.; Gasbarrini, G. Differences in metabolic variables between adult coeliac patients at diagnosis and patients on a gluten-free diet. Scand. J. Gastroenterol. 1997, 32, 1222–1229. [Google Scholar] [CrossRef]
- Vereczkei, Z.; Farkas, N.; Hegyi, P.; Imrei, M.; Földi, M.; Szakács, Z.; Kiss, S.; Solymár, M.; Nagy, R.; Bajor, J. It Is High Time for Personalized Dietary Counseling in Celiac Disease: A Systematic Review and Meta-Analysis on Body Composition. Nutrients 2021, 13, 2947. [Google Scholar] [CrossRef]
- Setavand, Z.; Ekramzadeh, M.; Honar, N. Evaluation of malnutrition status and clinical indications in children with celiac disease: A cross-sectional study. BMC Pediatr. 2021, 21, 147. [Google Scholar] [CrossRef]
- Churruca, I.; Miranda, J.; Lasa, A.; Bustamante, M.Á.; Larretxi, I.; Simon, E. Analysis of Body Composition and Food Habits of Spanish Celiac Women. Nutrients 2015, 7, 5515–5531. [Google Scholar] [CrossRef]
- Di Vincenzo, O.; Marra, M.; Di Gregorio, A.; Pasanisi, F.; Scalfi, L. Bioelectrical impedance analysis (BIA)-derived phase angle in sarcopenia: A systematic review. Clin. Nutr. 2021, 40, 3052–3061. [Google Scholar] [CrossRef]
- Katsura, N.; Yamashita, M.; Ishihara, T. Extracellular water to total body water ratio may mediate the association between phase angle and mortality in patients with cancer cachexia: A single-center, retrospective study. Clin. Nutr. ESPEN 2021, 46, 193–199. [Google Scholar] [CrossRef]
- Lee, Y.; Kwon, O.; Shin, C.S.; Lee, S.M. Use of Bioelectrical Impedance Analysis for the Assessment of Nutritional Status in Critically Ill Patients. Clin. Nutr. Res. 2015, 4, 32–40. [Google Scholar] [CrossRef] [PubMed]
- Lukaski, H.C.; Kyle, U.G.; Kondrup, J. Assessment of adult malnutrition and prognosis with bioelectrical impedance analysis: Phase Angle and Impedance Ratio. Curr. Opin. Clin. Nutr. Metab. Care 2017, 20, 330–339. [Google Scholar] [CrossRef] [PubMed]
- Suárez-González, M.; García, C.B.; Treviño, S.J.; Cabo, T.I.; Martín, J.J.D. Influence of nutrition education in paediatric coeliac disease: Impact of the role of the registered dietitian: A prospective, single-arm intervention study. J. Hum. Nutr. Diet. 2020, 33, 775–785. [Google Scholar] [CrossRef] [PubMed]
- Barone, M.; Della Valle, N.; Rosania, R.; Facciorusso, A.; Trotta, A.; Cantatore, F.P.; Falco, S.; Pignatiello, S.; Viggiani, M.T.; Amoruso, A.; et al. A comparison of the nutritional status between adult celiac patients on a long-term, strictly gluten-free diet and healthy subjects. Eur. J. Clin. Nutr. 2016, 70, 23–27. [Google Scholar] [CrossRef]
- Cheng, J.; Brar, P.S.; Lee, A.R.; Green, P.H. Green Body mass index in celiac disease: Beneficial effect of a gluten free diet. J. Clin. Gastroenterol. 2010, 44, 267–271. [Google Scholar] [CrossRef]
- Ukkola, A.; Mäki, M.; Kurppa, K.; Collin, P.; Huhtala, H.; Kekkonen, L.; Kaukinen, K. Changes in body mass index on a gluten-free diet in coeliac disease: A nationwide study. Eur. J. Intern. Med. 2012, 23, 384–388. [Google Scholar] [CrossRef]
- Hori, T.; Nakamura, S.; Yamagami, H.; Yasui, S.; Hosoki, M.; Hara, T.; Mitsui, Y.; Masuda, S.; Kurahashi, K.; Yoshida, S.; et al. Phase angle and extracellular water-to-total body water ratio estimated by bioelectrical impedance analysis are associated with levels of hemoglobin and hematocrit in patients with diabetes. Heliyon 2023, 9, e14724. [Google Scholar] [CrossRef]
- Naik, R.D.; Seidner, D.L.; Adams, D.W. Nutritional Consideration in Celiac Disease and Nonceliac Gluten Sensitivity. Gastroenterol. Clin. N. Am. 2018, 47, 139–154. [Google Scholar] [CrossRef]
- Vici, G.; Belli, L.; Biondi, M.; Polzonetti, V. Gluten free diet and nutrient deficiencies: A review. Clin. Nutr. 2016, 35, 1236–1241. [Google Scholar] [CrossRef]
- Dickey, W.; Kearney, N. Overweight in Celiac Disease: Prevalence, Clinical Characteristics, and Effect of a Gluten-Free Diet. Am. J. Gastroenterol. 2006, 101, 2356–2359. [Google Scholar] [CrossRef]
- Valletta, E.; Fornaro, M.; Cipolli, M.; Conte, S.; Bissolo, F.; Danchielli, C. Celiac disease and obesity: Need for nutritional follow-up after diagnosis. Eur. J. Clin. Nutr. 2010, 64, 1371–1372. [Google Scholar] [CrossRef]


| Demographic Characteristics | CeD Patients | Controls | CeD vs. Controls |
|---|---|---|---|
| p (chi-squared test) | |||
| Age (mean ± SD) | 34 ± 13 | 34 ± 11 | |
| Females (n, %) | 16 (67%) | 17 (61%) | |
| CeD familiarity (n, %) | 5 (21%) | 0 (0%) | |
| Comorbidities (n, %) | 8 (33%) | 7 (25%) | |
| Lifestyle | |||
| Smoking (n, %) | |||
| 13 (54%) 6 (25%) 5 (21%) | 20 (72%) 4 (14%) 4 (14%) | p = 0.43 |
| Alcohol consumption (n, %) | |||
| 8 (34%) 14 (58%) 1 (4%) 1 (4%) | 9 (32%) 18 (64%) 1 (4%) 0 (0%) | p = 0.99 |
| Sugary drinks (n, %) | |||
| 14 (58%) 9 (38%) 0 (0%) 1 (4%) | 14 (50%) 12 (42%) 1 (4%) 1 (4%) | p = 0.91 |
| Sugary foods (n, %) | |||
| 1 (4%) 6 (25%) 5 (21%) 12 (50%) | 0 (0%) 7 (25%) 8 (29%) 13 (46%) | p = 0.93 |
| Physical activity levels (n, %) | |||
| 12 (50%) 8 (33%) 3 (13%) 1 (4%) | 12 (42%) 10 (36%) 5 (18%) 1 (4%) | p = 0.94 |
| CeD T0 n = 24 | Controls n = 28 | CeD vs. Controls | ||
|---|---|---|---|---|
| p (Mann–Whitney) | p (t-test) | |||
| Fat Mass (kg) | 12.9 (5.7–25) | 14.6 (5.9–30.3) | 0.63 | |
| Fat-Free Mass (kg) | 45.6 (37.6–70.5) | 49.1 (38.7–64.5) | 0.09 | |
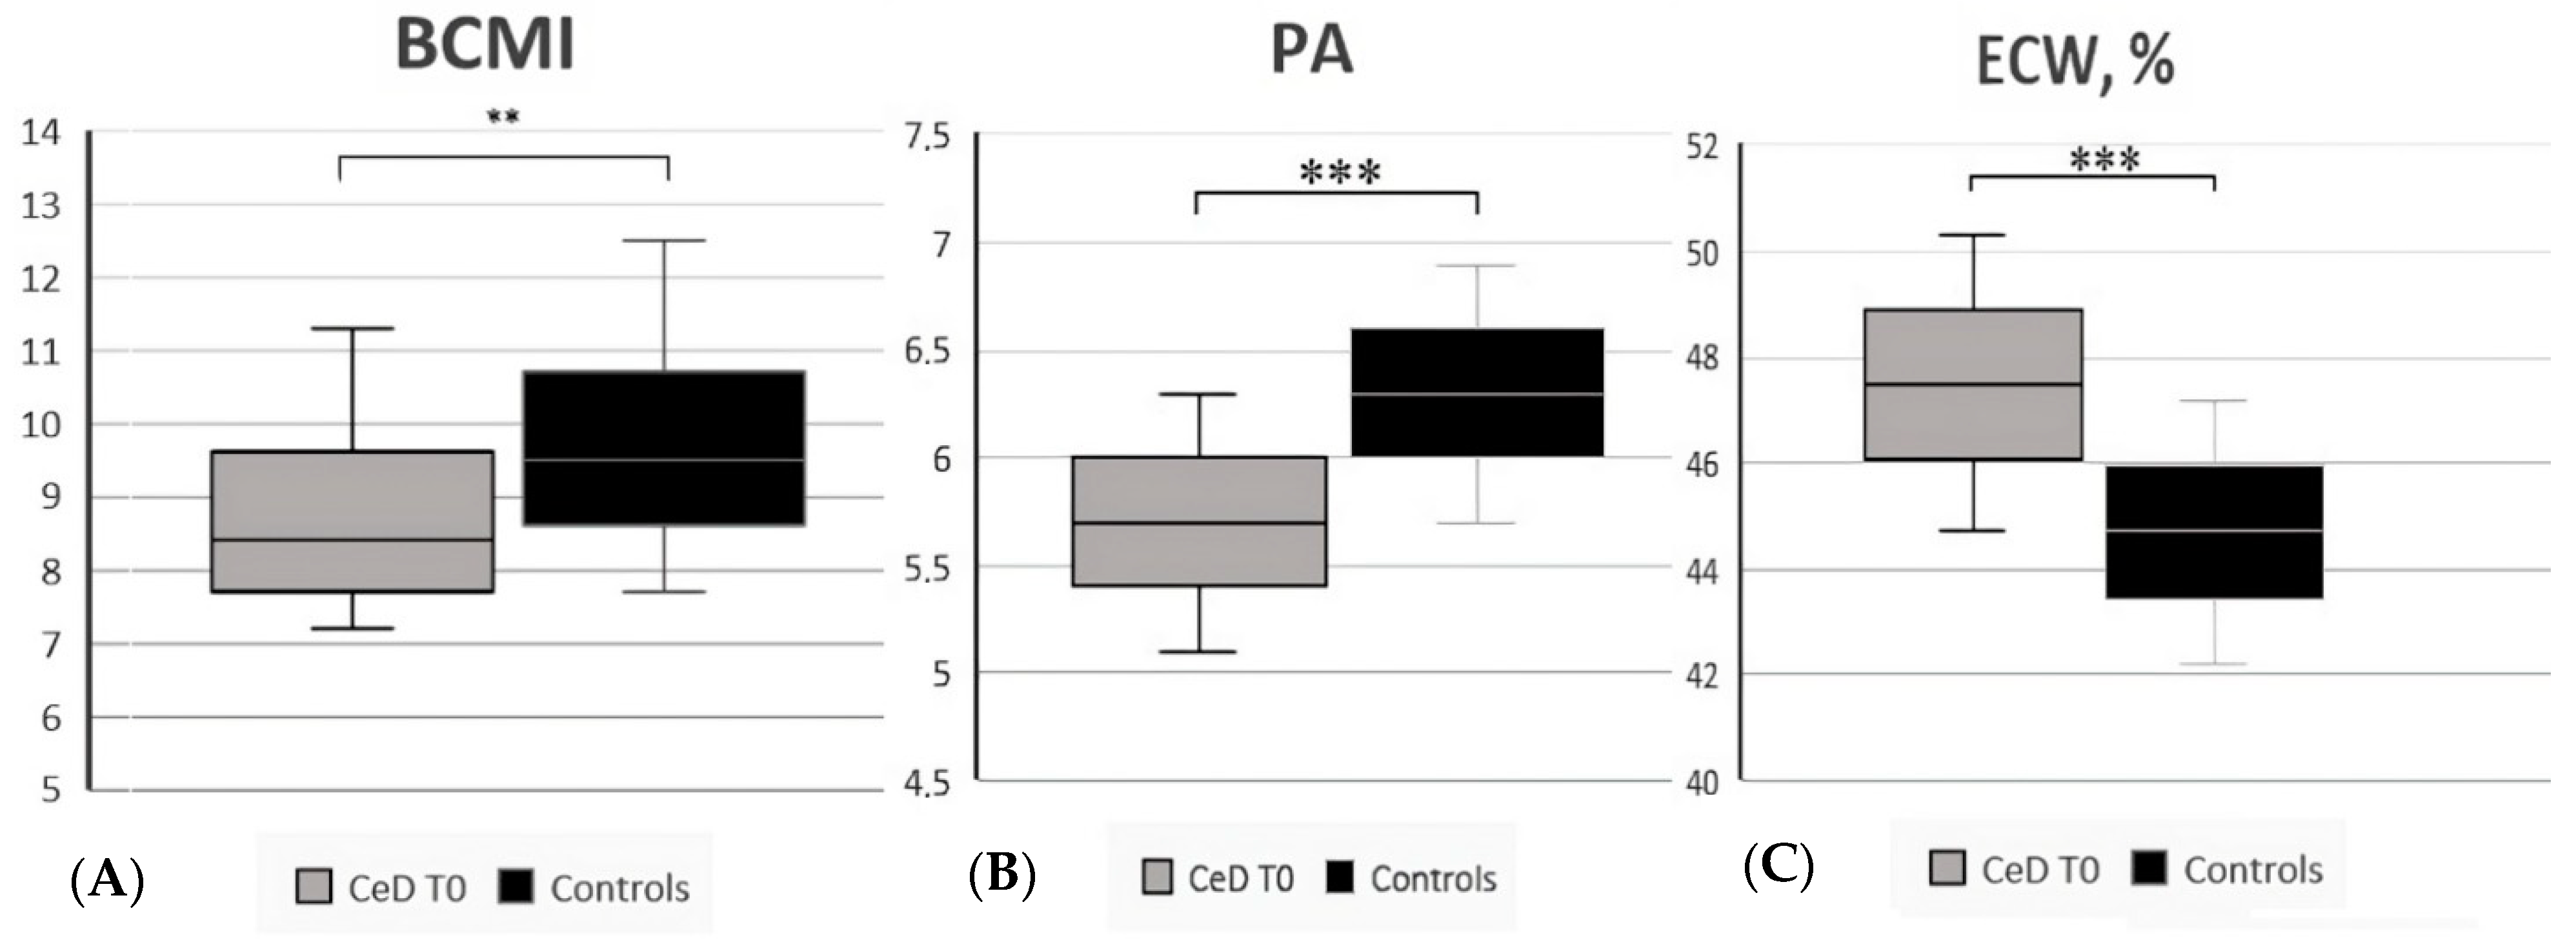
| Body Cell Mass Index | 8.4 (7.2–11.3) | 9.5 (7.7–12.5) | 0.006 | |
| Fat Mass (%) | 22.1 (9.9–37.1) | 21.7 (11.7–34.9) | 0.85 | |
| Fat-Free Mass (%) | 77.9 (62.9–90.1) | 78.3 (65.1–88.3) | 0.94 | |
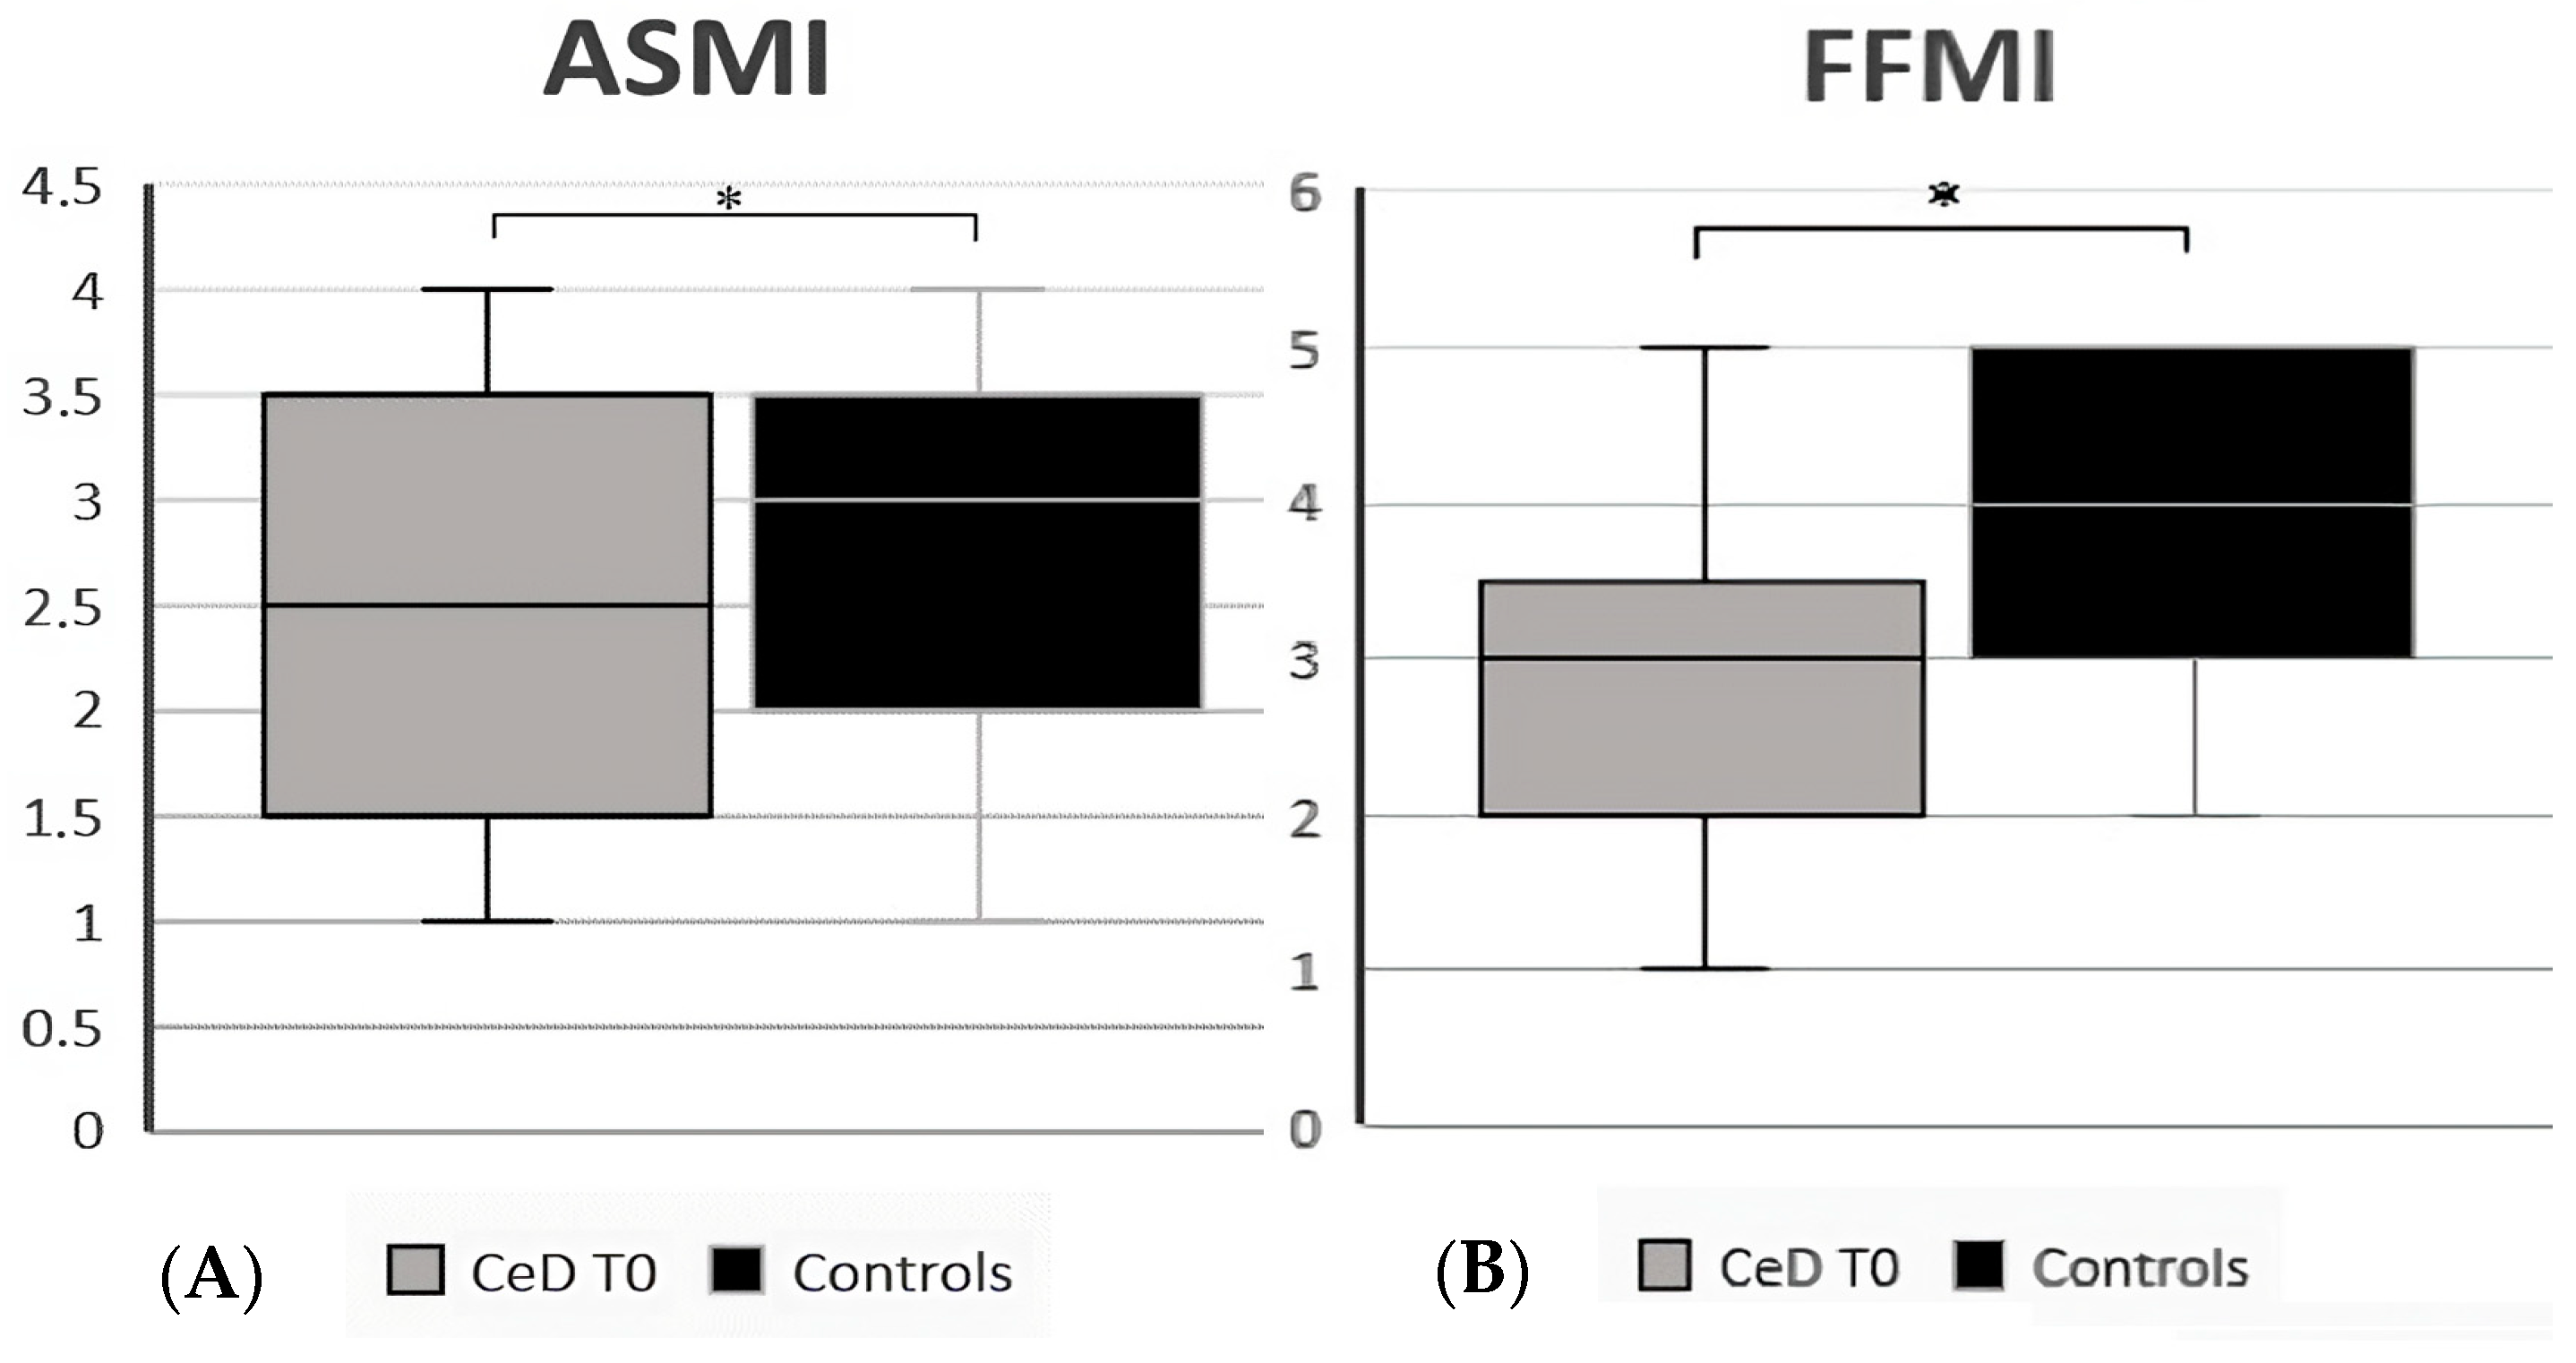
| Fat-Free Mass Index | 3 (1–5) | 4 (2–5) | 0.02 | |
| Appendicular Skeletal Muscle Index | 2.5 (1–4) | 3 (1–4) | 0.02 | |
| Body Mass Index (mean ± SD) | 21.9 ± 3.2 | 22.8 ± 2.5 | 0.2 | |
| Phase Angle (°, mean ± SD) | 5.7 ± 0.6 | 6.3 ± 0.6 | <0.001 | |
| Total Body Water | 33.4 (27.3–51.8) | 36 (28.2–47.4) | 0.09 | |
| Extracellular Water (L) | 16 (12.8–27.7) | 16.5 (13.2–20.7) | 0.60 | |
| Extra-Cellular Water (%, mean ± SD) | 47.5 ± 2.8 | 44.7 ± 2.5 | <0.001 | |
| Waist (cm, mean ± SD) | 78.7 ± 11.1 | 77.1 ± 6.6 | 0.53 | |
| Abdominal Fat (%, mean ± SD) | 2.9 ± 1.8 | 2.7 ± 1.1 | 0.53 | |
| Handgrip Value | 28.1 (16.5–48.7) | 32.5 (20.1–54.8) | 0.19 | |
| Muscle Quality Index (mean ± SD) | 1.2 (0.9–1.8) | 1.2 (0.9–3.3) | 0.81 | |
Disclaimer/Publisher’s Note: The statements, opinions and data contained in all publications are solely those of the individual author(s) and contributor(s) and not of MDPI and/or the editor(s). MDPI and/or the editor(s) disclaim responsibility for any injury to people or property resulting from any ideas, methods, instructions or products referred to in the content. |
© 2023 by the authors. Licensee MDPI, Basel, Switzerland. This article is an open access article distributed under the terms and conditions of the Creative Commons Attribution (CC BY) license (https://creativecommons.org/licenses/by/4.0/).
Share and Cite
Maniero, D.; Lorenzon, G.; Marsilio, I.; D’Odorico, A.; Savarino, E.V.; Zingone, F. Assessment of Nutritional Status by Bioelectrical Impedance in Adult Patients with Celiac Disease: A Prospective Single-Center Study. Nutrients 2023, 15, 2686. https://doi.org/10.3390/nu15122686
Maniero D, Lorenzon G, Marsilio I, D’Odorico A, Savarino EV, Zingone F. Assessment of Nutritional Status by Bioelectrical Impedance in Adult Patients with Celiac Disease: A Prospective Single-Center Study. Nutrients. 2023; 15(12):2686. https://doi.org/10.3390/nu15122686
Chicago/Turabian StyleManiero, Daria, Greta Lorenzon, Ilaria Marsilio, Anna D’Odorico, Edoardo Vincenzo Savarino, and Fabiana Zingone. 2023. "Assessment of Nutritional Status by Bioelectrical Impedance in Adult Patients with Celiac Disease: A Prospective Single-Center Study" Nutrients 15, no. 12: 2686. https://doi.org/10.3390/nu15122686
APA StyleManiero, D., Lorenzon, G., Marsilio, I., D’Odorico, A., Savarino, E. V., & Zingone, F. (2023). Assessment of Nutritional Status by Bioelectrical Impedance in Adult Patients with Celiac Disease: A Prospective Single-Center Study. Nutrients, 15(12), 2686. https://doi.org/10.3390/nu15122686