Article

Association of NAFLD with FGF21 Polygenic Hazard Score, and Its Interaction with Protein Intake Level in Korean Adults

1
Department of Nutritional Science and Food Management, Ewha Womans University, Seoul 03760, Republic of Korea
2
Graduate Program in System Health Science & Engineering, Ewha Womans University, Seoul 03760, Republic of Korea
*
Author to whom correspondence should be addressed.
Nutrients 2023, 15(10), 2385; https://doi.org/10.3390/nu15102385
Submission received: 17 April 2023 / Revised: 15 May 2023 / Accepted: 18 May 2023 / Published: 19 May 2023

Abstract

:
Fibroblast growth factor 21 (FGF21) is a hormone that participates in the regulation of energy homeostasis and is induced by dietary protein restriction. Preclinical studies have suggested that FGF21 induction exerts a protective effect against non-alcoholic fatty liver disease (NAFLD), while human studies have revealed elevated levels of and potential resistance to FGF21 in patients with NAFLD. However, whether the FGF21 pathway also contributes to NAFLD risk at the genetic level remains uncertain. A few attempts to investigate the impact of individual genetic variants at the loci encoding FGF21 and its receptors on NAFLD risk have failed to establish a clear association due to a limited effect size. Therefore, this study aimed to (1) develop a polygenic hazard score (PHS) for FGF21-related loci that are associated with NAFLD risk and (2) investigate the effect of its interaction with protein intake level on NAFLD risk. Data on 3501 participants of the Korean Genome Epidemiology Study (Ansan–Ansung) were analyzed. Eight single-nucleotide polymorphisms of fibroblast growth factor receptors and beta-klotho were selected for PHS determination using forward stepwise analysis. The association between the PHS and NAFLD was validated (p-trend: 0.0171 for men and <0.0001 for women). Moreover, the association was significantly modulated by the protein intake level in all participants as well as women (p-interaction = 0.0189 and 0.0131, respectively) but not in men. In particular, the women with the lowest PHS values and a protein intake lower than the recommended nutrient intake (RNI) exhibited a greater NAFLD risk (HR = 2.021, p-trend = 0.0016) than those with an intake equal to or greater than the RNI; however, those with higher PHS values had a high risk, regardless of protein intake level. These findings demonstrate the contribution of FGF21-related genetic variants and restricted protein intake to NAFLD incidence.

1. Introduction

Non-alcoholic fatty liver disease (NAFLD) comprises a range of liver conditions caused by extra fat buildup in the liver without significant consumption of alcohol or lipid-causing drugs, viral infection, and/or inherited genetic diseases [1]. Its prevalence has been gradually increasing, currently affecting approximately 30% of the global adult population [2]. The prevention and treatment of NAFLD is an important public health concern, since NAFLD is closely associated with the risks of other metabolic disorders, including obesity, hyperlipidemia, and diabetes, and potentially leads to severe liver damage, such as cirrhosis or hepatocellular carcinoma [3]. Considering the tight association between metabolic dysregulation and fatty liver diseases, an attempt has recently been made to rename NAFLD to metabolic associated fatty liver disease (MAFLD) [4,5]. NAFLD often develops in people with obesity and diabetes; nevertheless, approximately 40% of patients with NAFLD in Korea are non-obese or lean [6]. Therefore, NAFLD is possibly not only attributed to metabolic stress-induced physiological dysfunction but also to other causes, such as genetic susceptibility [7]. Previous genome-wide association studies (GWAS) and candidate gene studies have identified genetic loci associated with NAFLD incidence, such as patatin-like phospholipase domain-containing 3 (PNPLA3), transmembrane 6 superfamily member 2 (TM6SF2), glucokinase regulator (GCKR), and lysophospholipase-like 1 (LYPLAL1) [8,9,10,11]. Most of these loci encode proteins that are directly involved in lipid metabolism, especially lipogenesis and cholesterol metabolism [7], exhibiting functional relevance.
The fibroblast growth factor 21 (FGF21) pathway is a metabolic pathway that has emerged as a promising target for therapeutic potentials against NAFLD [12]. FGF21, one of the fibroblast growth factor family members, is a stress-inducible hormone that functions in the regulation of metabolic homeostasis and energy balance [13,14,15]. It acts through binding to a heterodimeric receptor complex comprising beta-klotho and FGF receptors, including FGFR1, FGFR2, and FGFR3 [16,17,18,19]. The FGF21 gene is widely expressed in metabolism-related organs, such as the liver, adipose tissue, and pancreas, while plasma FGF21 is mainly derived from the liver [20]. Pharmacological delivery of FGF21 has been reported to reduce hepatic fat accumulation [21,22] and demonstrate beneficial effects against obesity-related metabolic complications, including insulin resistance and hyperlipidemia [23,24]. However, plasma FGF21 levels are significantly higher in patients with NAFLD than in healthy individuals and are positively associated with the degree of the liver steatosis score in patients with NAFLD [25,26,27], indicating that the high-circulating FGF21 levels in patients with NAFLD does not appear to alleviate the condition; possibly due to resistance toward FGF21 [28]. This resistance highlights the potential importance of its receptors. The FGF21 signal is received predominantly by beta-klotho and FGF receptors. Alteration of receptor expression by alternative splicing and translational initiation potentially modulates FGF21 signaling [29,30]. Therefore, genetic or environmental factors possibly influence FGF21 expression, and its receptors may collectively contribute to the incidence and management of NAFLD.
Food-intake pattern, especially macronutrient distribution, is a key environmental factor for FGF21-pathway induction. Prolonged fasting is known to increase the expression and serum level of FGF21 [31,32,33]. The FGF21 response is likely due to protein restriction rather than energy restriction during fasting. The FGF21, FGFR, and KLB genes in the liver have been found to undergo upregulation upon isocaloric, low-protein feeding in animal models [34,35,36]. This phenomenon has also been observed in human intervention studies, as demonstrated by a meta-analysis on circulating FGF21 levels [37]. Previous animal experiments and nutritional intervention studies have also found restricted dietary protein intake to positively affect the transcriptional levels of FGF21 and its receptors [34,38,39]. Protein-restriction-stimulated FGF21 levels result in increased intracellular glucose uptake and energy consumption, possibly to compensate for the restriction [38,39], although the effects vary depending on the level of restriction [34,40]. Although FGF21 pathway-related macronutrients are various, studies dealing with the relation between protein and gene variant-related FGF21 are not enough. Therefore, we focused our attention on the protein intake rather than carbohydrate intake.
Currently, knowledge regarding the genetic contribution of FGF21 and its receptor loci to NAFLD risk remains limited. Only a few single-nucleotide polymorphisms (SNPs) at the FGF21 locus, such as rs838133, have had their associations with macronutrient preference and metabolic parameters investigated [41,42]. However, the results were based on cross-sectional cohorts and did not establish an association between FGF21 SNPs and NAFLD. Moreover, an approach based on individual SNPs has a limited effect size and power to analyze the association with disease risk and interactions with environmental factors [43].
Therefore, in this study, we hypothesized that genetic variations of the FGF21 pathway are collectively associated with NAFLD risk, with the associations potentially modulated by protein intake level, which is a strong FGF21-pathway stimulus. To investigate these associations, we (1) developed a polygenic hazard score (PHS) via the discovery and combination of multiple-loci SNPs related to the FGF21 pathway based on a longitudinal cohort of the Korean population, (2) analyzed the risk of NAFLD incidence based on the PHS, and (3) explored the possible modifying effect of protein intake.

2. Materials and Methods

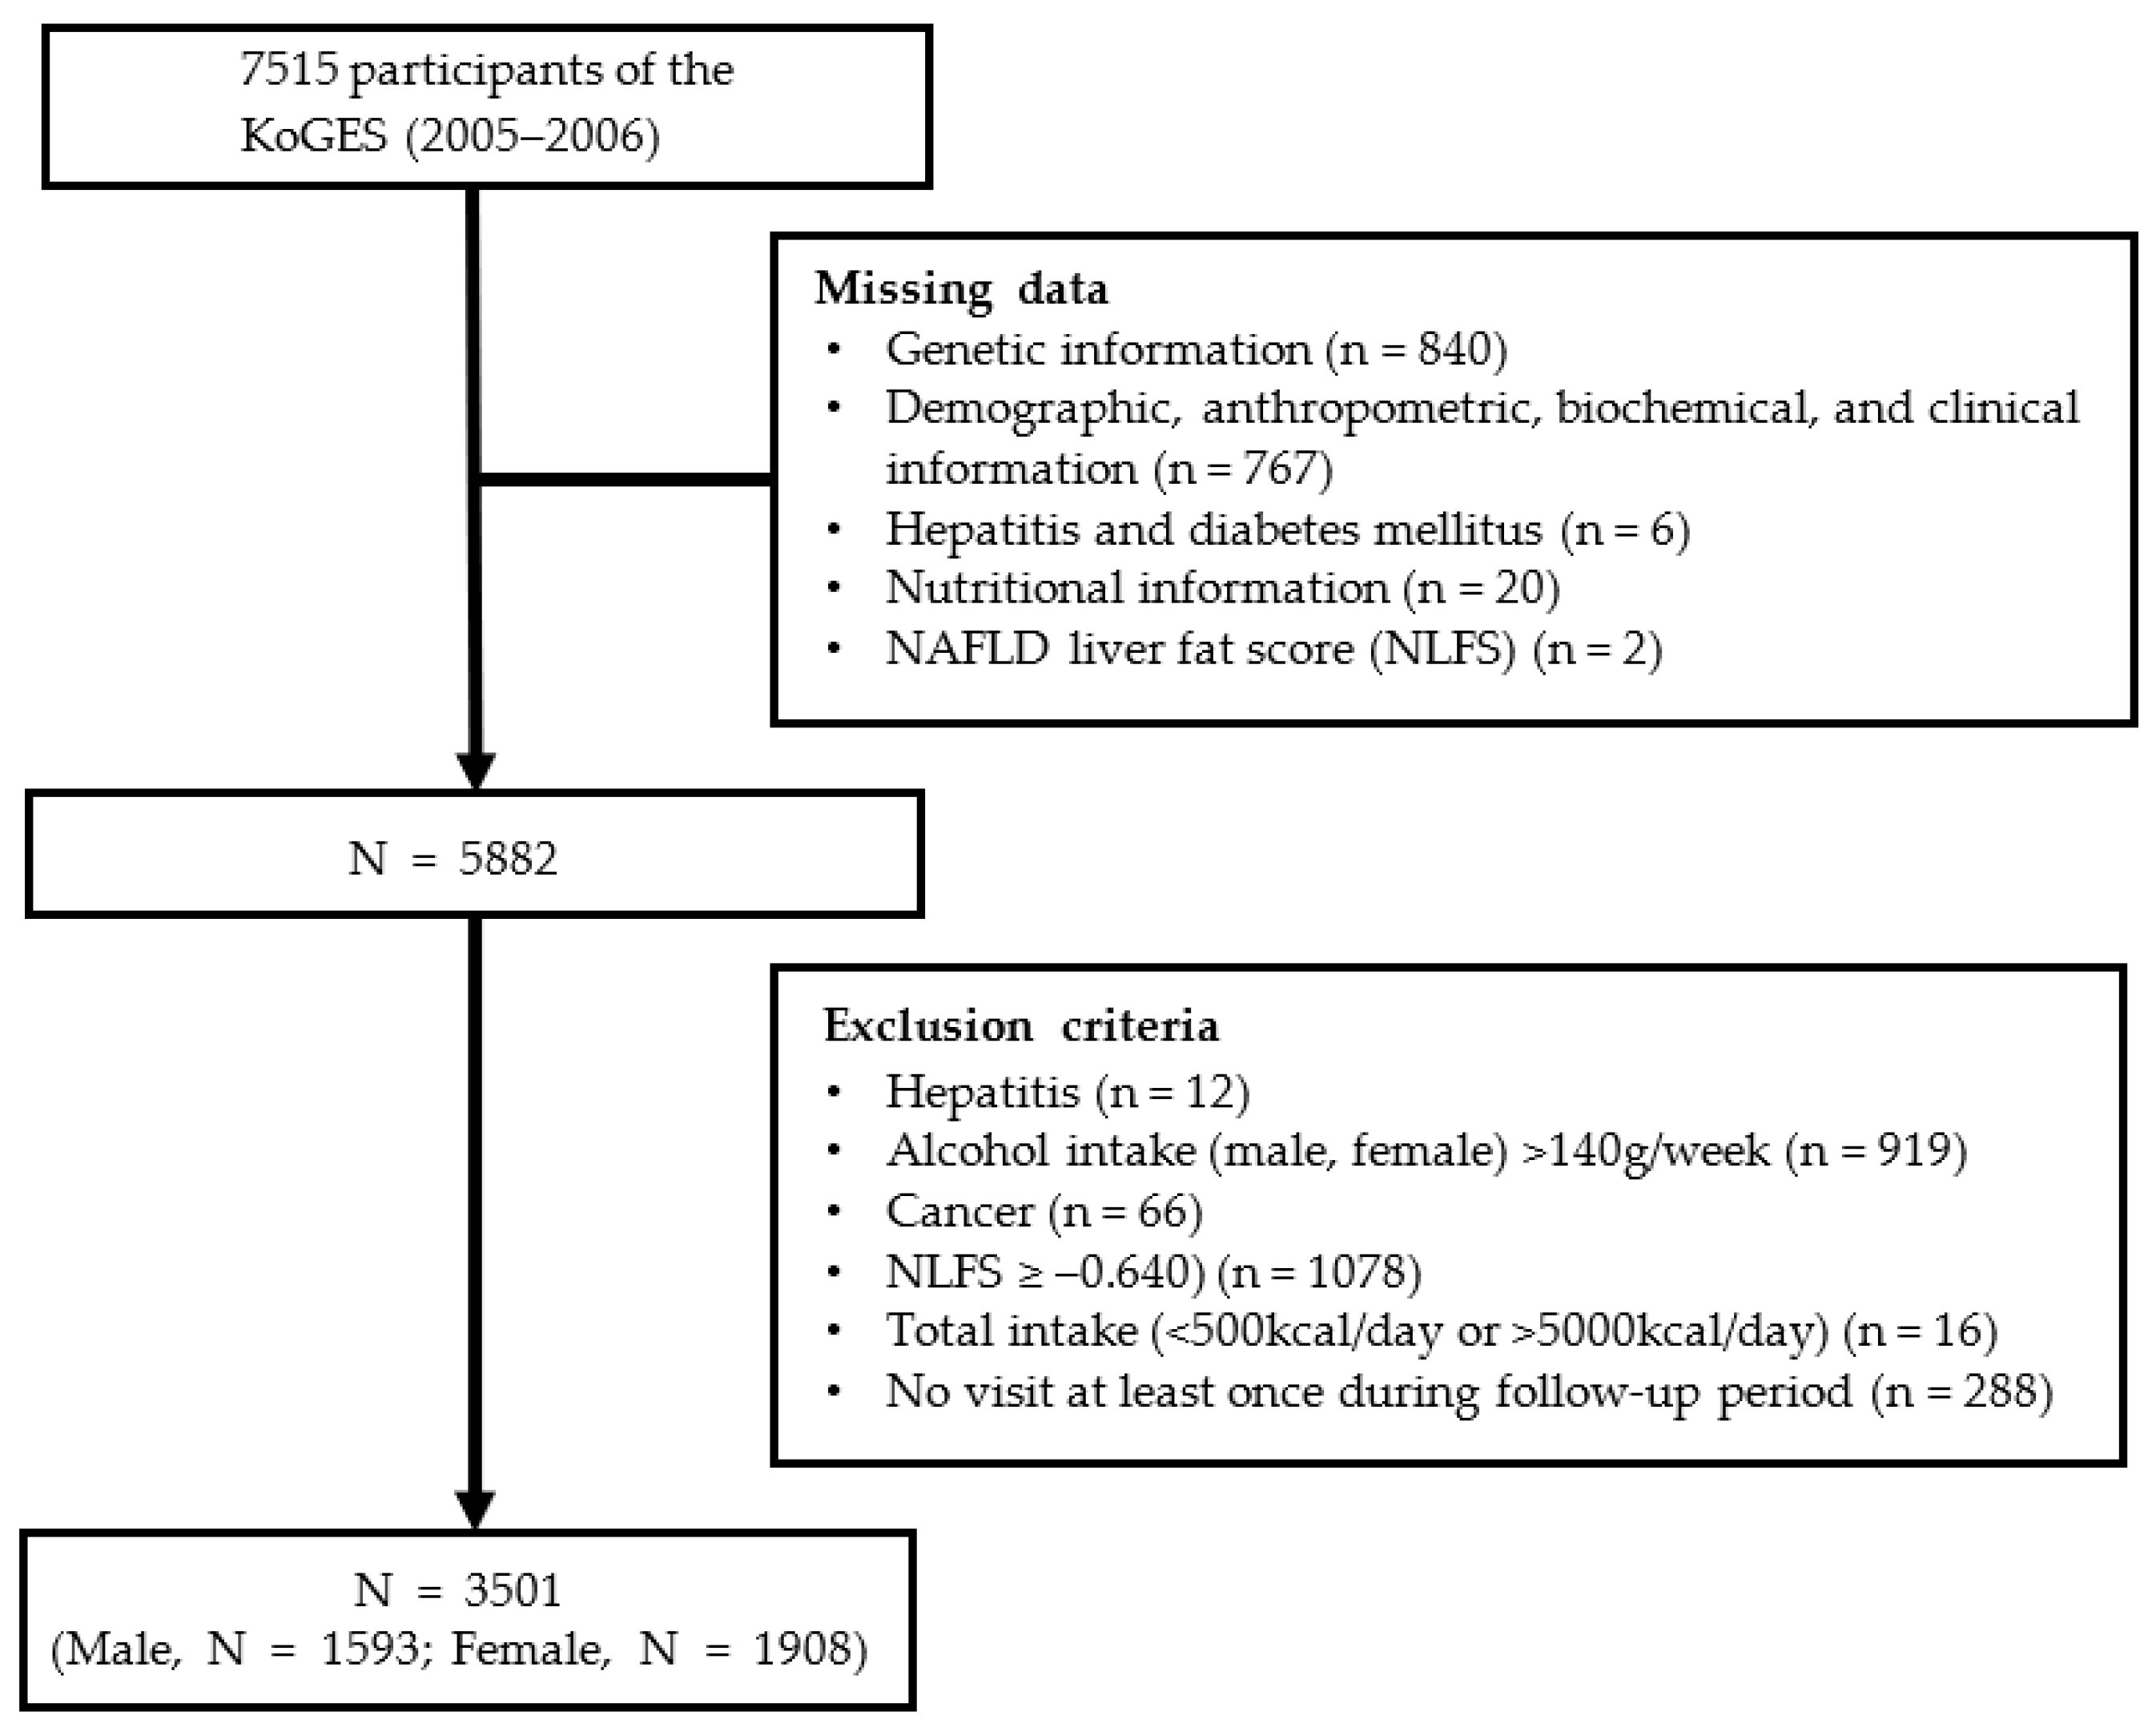
2.1. Study Participants

This study used data from the prospective, population-based Ansan and Ansung cohorts, which are part of the Korean Genome Epidemiology Study [44]. This data set was provided by the Center for Genome Science, National Institute of Health, Korea Disease Control and Prevention Agency, Republic of Korea. The Ansan–Ansung cohort study is a longitudinal study that investigates the genetic and environmental causes of common metabolic and cardiovascular diseases. The cohort survey was performed biennially until 2012. As the third survey (2005–2006) provided the most detailed dietary information of the participants, we used the third survey as a baseline and included data up to the sixth survey (2011–2012) for analysis.
During the baseline survey, 7515 people aged 40–69 years living in Ansan and Ansung were enrolled in the study conducted by Korea University and Ajou University. All study participants were informed, and they provided informed consent prior to commencing the study. A total of 4014 participants were excluded before the investigation for the following reasons: (1) lack of information regarding their genetic information (n = 840), clinical data (n = 767), nutritional data (n = 20), hepatitis and diabetes status (n = 6), and NAFLD liver fat score (NLFS)-based diagnosis (n = 2) in the third survey (2005–2006); (2) hepatitis diagnosis (n = 78); (3) alcohol consumption >140 g per week (n = 919); (4) the presence of cancer, including liver cancer (n = 66); (5) NLFS ≥ –0.640 (n = 1080) in the third survey (2005–2006); (6) total caloric consumption <500 or >5000 kcal/day (n = 16); and (7) lack of visit during the follow-up period (n = 288). Finally, 3501 participants were included in this study, as shown in Figure 1. The study was approved by the Institutional Review Board of Ewha Womans University, Seoul, Republic of Korea (IRB approval number: ewha-202105-0003-01).

2.2. Demographic, Anthropometric, and Biochemical Data of the Study Population

Data, including age, sex, educational background, physical activity, smoking, drinking, and disease history, were collected via a questionnaire. Body mass index (BMI) was calculated using the equation: weight (kg) divided by the square of the height (m2). Waist circumference was measured at the middle area between the ribs and iliac crest, and the average of triplicate measurements was determined. Blood pressure was measured once from the right arm in a sitting position.
Blood samples were obtained from fasting participants to measure fasting glucose and insulin, glycated hemoglobin (Hba1c), total cholesterol (TCh), triglyceride (TG), lipoprotein (high-density lipoprotein cholesterol [HDL-C] and low-density lipoprotein cholesterol [LDL-C]), and liver enzyme (aspartate aminotransferase [AST] and alanine aminotransferase [ALT]) levels.
Smoking, diabetes mellitus (DM), and educational status variables were collected as well as frequency and amount of alcohol consumption. Smoking was classified into “never-smoker”, “former smoker”, and “current smoker”. Participants diagnosed with DM were either clinically diagnosed or had Hba1c and plasma glucose levels ≥6.5% and ≥200 mg/dL, respectively, after a 2 h oral glucose tolerance test or a fasting plasma blood glucose level ≥126 mg/dL (https://www.diabetes.or.kr/pro/; accessed on 1 September 2021). Educational status was categorized into “elementary school or below”, “middle school”, “high school”, and “college or above”. Physical activity was evaluated as follows: 0 metabolic equivalent (MET) for no activity, 1.5 MET for motionless activity, 3 MET for light activity, 5 MET for intermediate activity, and 7 MET for strong activity [45].

2.3. Dietary Assessment

Dietary intake was evaluated using a semi-quantitative food frequency questionnaire (FFQ) containing 106 food items [46]. In the FFQ, participants recorded the average frequency and amount of intake over the past year. Caloric, protein, carbohydrate, and fat intakes were calculated as percentages and amounts in grams per day using previously calculated individual nutrient intakes. To determine the criteria for low and high protein intakes, protein-intake level was divided into two and three groups based on the Korean recommended nutrient intake (RNI, from the 2020 Korean Dietary Reference Intake [47]) and intake tertiles, respectively.

2.4. NAFLD Diagnosis Using the NLFS

Since results from the liver biopsy did not exist in the Ansan–Ansung study data, NAFLD diagnostic criteria was used instead. Among the various NAFLD diagnostic criteria, the NLFS was utilized for NAFLD diagnosis [48]. The following equation was applied:
NLFS = –2.89 + 1.18 × metabolic syndrome (yes = 1/no = 0) + 0.45 × DM (yes = 2/no = 0) + 0.15 × fasting insulin (mU/L) + 0.04 × AST (U/L) − 0.94 × (AST/ALT).
An NLFS value ≥ –0.640 indicated NAFLD.

2.5. Quality Control, Genotyping, and Genetic-Variant Selection

Genetic data from the Ansan–Ansung study were obtained using an Affymetrix Genome-wide SNP Array 5.0 (Affymetrix Inc., Santa Clara, CA, USA) [49]. The quality control (QC) exclusion criteria before imputation were as follows: a minor allele frequency (MAF) < 0.01, Hardy-Weinberg equilibrium (HWE) < 10−6, cell rate < 95%, non-autosomal SNPs, and SNPs without strand information or genomic position [50]. Imputation was performed using 1000 Genome Imputation Project Phase-1 v3 [51]. The QC exclusion criteria after imputation were as follows: imputed SNPs with an estimated r2 (rsq) < 0.3, MAF < 0.01, and HWE < 10−6. A total of 6,461,358 variants remained after QC. Before QC, 3 FGF21 SNPs, 8 FGFR1 SNPs, 204 FGFR2 SNPs, 1 FGFR3 SNP, and 10 KLB SNPs were called from the loci encoding FGF21 and its 4 receptors (not shown). FGFR4 reportedly exhibited a weak interaction with FGF21; therefore, it was excluded from the investigation [19]. After QC, 2 FGF21, 3 FGFR1, 57 FGFR2, and 4 KLB SNPs remained. Regarding FGFR3, no SNP with a value ≥ 0.01 was detected when the MAF cutoff was applied.

2.6. PHS Development and Calculation for NAFLD

QC and the PHS were calculated using Plink version 1.9 (https://zzz.bwh.harvard.edu/plink/index.shtml; accessed on 1 September 2021). Before calculating the PHS, forward stepwise analysis was used to determine the best combination that reflected post-QC NAFLD risk. We determined the area under the curve (AUC) of the receiver operating characteristic (ROC) curve via forward stepwise analysis to confirm the SNP combination’s suitability. The AUC of the ROC curve, as calculated using Proc logistic in SAS, was 0.5693. The PHS was calculated as the participant’s genotype for eight selected SNPs and parameter estimates (β) from a Cox proportional hazards regression.

2.7. Expression Quantitative Trait Loci (eQTL) Analysis of Eight SNPs Using Genotype-Tissue Expression (GTEx)

eQTL analysis was performed using GTEx Projects (release version 8) [52]. We sought to determine whether the multiple SNP-affected tissues were related to NAFLD.

2.8. Statistical Analysis

All statistical analyses were performed using SAS software version 9.4 (SAS Institute, Inc., Cary, NC, USA), except for QC and PHS. Continuous and categorical variables are expressed as frequencies (%) and mean values (± standard deviations). For baseline analyses, the Mann–Whitney Wilcoxon test and chi-squared test were used to compare continuous and categorical variables, respectively. Cox Proportional Hazard Regression (Cox regression) was used to assess NAFLD incidence after adjusting for confounding variables. The probability in regression analysis was adjusted for sex, age, BMI, ALT level, physical activity, smoking status, educational level, hypertension, DM, hyperlipidemia, menopause (only for women), alcohol consumption, and total caloric intake according to previous studies [53,54,55,56]. The interaction between the PHS and NAFLD was examined using Cox regression, including the interaction term and the Wald test. The p-values for the trends across protein intake levels (equal to or above/below the RNI and tertiles) were calculated using a multivariable logistic regression model, with protein intake levels as continuous variables. The p-values for the trends between the PHS and NAFLD were determined using the generalized linear model after adjusting for the abovementioned confounding factors.

3. Results

3.1. Baseline Characteristics and Nutritional Intake

Table 1 shows the participants’ characteristics after categorizing them into non-incident (non-NAFLD group) and incident (NAFLD group) NAFLD groups at baseline. Among the 3501 participants, 1521 developed NAFLD within the follow-up period. The mean age was higher in the NAFLD group than in the non-NAFLD group. In terms of physique-related and biochemical information, the NAFLD group exhibited higher fasting blood glucose, insulin, AST, ALT, TCh, TG, LDL-C, and NLFS levels than the non-NAFLD group. Nevertheless, it is noteworthy that the mean biochemical-variable values spanned the normal reference-value range in both groups, except for TG, whose mean slightly exceeded the normal range in both groups (not shown). The number of patients with DM and hyperlipidemia, excluding those with hypertension, was higher in the NAFLD group than in the non-NAFLD group. Lifestyle and dietary habits, exercise, and carbohydrate intake (%) were more pronounced in the NAFLD group than in the non-NAFLD group.

3.2. SNP Selection for PHS

To calculate the PHS of the NAFLD-associated FGF21 pathway, 226 SNPs at the loci of FGF21 and its receptors were initially obtained from the FGF21, FGFR1, FGFR2, FGFR3, and KLB loci. After removing those with MAFs < 0.01, 179 SNPs were retained (Table S1). The composition of the PHS for NAFLD was determined using forward stepwise analysis. A total of eight SNPs (KLB rs2608819, FGFR1 rs881301, and FGFR2 [rs9420328, rs4751832, rs7913828, rs2420941, rs1649181, and rs17101702]) were selected (Table 2).
The locations of the SNPs relevant to the genes are presented in Figure 2. The AUC value was verified using the ROC curve (AUC = 0.5693). The SNPs’ β-adjusted values and risk alleles for NAFLD incidence are shown in Table 2.

3.3. Association between the PHS and NAFLD Incidence

We validated the PHS with the rate of NAFLD incidence. Among all participants, those with higher PHS values exhibited significantly higher hazard risks of NAFLD (p-trend < 0.0001); a similar trend was observed in male (p-trend = 0.0171) and female (p-trend < 0.0001) participants, as expected (Table 3).
In women, compared with the first quartile, all other PHS quartiles indicated a significantly higher risk, whereas in men, the third and fourth quartiles, but not the second, exhibited a higher risk. The increased hazard ratio (HR) was relatively greater in women than in men.

3.4. Association between the PHS and NAFLD Incidence by Protein Intake

Subsequently, we verified the association between protein intake and NAFLD risk prior to investigating the interaction. Table 4 shows the association between protein intake and the HR for NAFLD when protein intake level was divided into tertiles (low, medium, and high) or into two groups (intake ≥ or <RNI). Protein intake was not significantly associated with NAFLD risk after adjusting for confounding factors. In women, the unadjusted model and model 1 revealed that low protein intake appeared to be associated with the HR for NAFLD; however, the significance of this association disappeared in models 2 and 3.
Furthermore, we sought to determine whether the association between the FGF21-related PHS and NAFLD risk varied with protein intake. The results showed that protein intake modified the association in women only (Table 5). Protein intake affected NAFLD risk in a varied manner depending on the PHS quartile (p-interaction = 0.0131 and 0.0361).
In women only, with the lowest PHS values, NAFLD risk was significantly higher in the low-protein-intake group than in the high-protein-intake group (HR = 2.921, p-trend <0.0001). In contrast, women with the highest PHS values exhibited a marginally elevated risk in the medium-protein-intake group (HR = 1.435, p-trend = 0.0203). When categorizing protein intake based on the RNI, a differential effect of protein intake level was more pronounced. Women with the lowest PHS values had a high risk of NAFLD when consuming a protein level lower than the RNI (HR = 2.021, p-trend = 0.0016) compared with those with an intake ≥ the RNI, whereas those with higher PHS values exhibited a high risk, regardless of protein intake level. The results revealed the contribution of FGF21-related genetic variants and restricted protein intake to NAFLD incidence.

3.5. Potential Effects of Genetic Variants on Gene Expression

eQTL analysis was performed to determine whether the selected SNPs potentially affected gene expression in various tissues. eQTL information for only three of the eight SNPs (FGFR1 rs881301, FGFR2 rs9420328, and FGFR2 rs2420941) were available to demonstrate whether an SNP influences the expression level of one’s corresponding gene in GTEx (Figure 3). Intriguingly, the C allele of FGFR1 rs881301 (an NAFLD risk allele, shown in Table 2) was shown to significantly increase FGFR1 expression in various tissues, with the highest significance occurring in whole blood (p value = 1.92 × 10−41) and the lowest in musculoskeletal and brain hypothalamus tissues (p values = 3.2 × 10⁻⁵ and 2.01 × 10⁻³, respectively). However, the NAFLD risk alleles FGFR2 rs9410328 and FGFR2 rs242041 (C and T alleles, respectively) did not significantly affect the expression of their corresponding genes in musculoskeletal and brain hypothalamus tissues, except for a marginal effect of rs9410328 in musculoskeletal tissue. The results indicate that some of the SNPs, such as FGFR1 rs881301, but not all, may be functionally linked to NAFLD risk via gene-expression alteration.

4. Discussion

In this study, we developed a FGF21-related PHS to explore the genetic contribution of the FGF21 pathway to NAFLD incidence and sought to ascertain whether the association between the PHS and NAFLD risk is modulated by dietary protein intake level. A few previous studies have demonstrated the genetic contribution of FGF21 pathways to the metabolic condition. For example, Kaess et al. investigated the association of 63 common SNPs in 5 loci involved in the pathway with metabolic phenotypes, including LDL-C, HDL-C, TG, and BMI, and found FGFR2 polymorphism (rs2071616) to be associated with LDL-C in the European population, a phenomenon that was validated by two other European cohorts [57]. Ji et al. reported that SNPs in the KLB gene were correlated with BMI (rs7670903) and hepatic inflammation (rs7674434 and rs12152703) in the Han Chinese population [58]. Although these results suggest that genetic variants linked to the FGF21 pathways are potentially involved in NAFLD pathogenesis, the evidence was based on cross-sectional studies, and the effect size of individual SNPs was limited. In our study, the PHS was developed by selecting 8 out of 226 SNPs at the FGF21 gene and its receptor genes.
The association between PHS and NAFLD risk was confirmed by showing a positive association with NAFLD incidence in both gender (p-trend = 0.0171 and <0.0001 in males and females, respectively, Table 3). The combination of SNPs in the PHS might be related to elevation of the FGF21 pathway. Although how the SNPs impact the risk of NAFLD needs to be further elucidated, GTEx analysis indicated that at least some of the SNPs such as rs881301 at the FGFR1 locus were significantly associated with upregulation of the corresponding gene in various tissues (Figure 3). Since FGFR1 expression was reported to be positively correlated with FGF21 expression [25,26], the eQTL result was in line with the fact that serum level as well as hepatic expression level of FGF21 were positively associated with the intrahepatic steatosis grade and hepatic triglyceride levels, respectively [25,26,27].
Interestingly, inadequate protein intake (<RNI) compared with adequate intake (≥RNI) in women significantly increased NAFLD risk in participants with the lowest PHS values (HR 2.021) but not in those with the highest PHS values (p-interaction = 0.0361, Table 5). These results imply that inadequate protein intake may contribute to NAFLD incidence in people with low genetic risk potentially via FGF21-pathway induction, while those with high genetic risk already have relatively elevated FGF21-pathway activity, regardless of protein intake level. FGF21-pathway stimulation upon protein restriction has been well documented in both human and animal models [34,35,36], exhibiting the upregulation of not only FGF21 but also its receptors. In addition, several GWAS analyses have revealed that gene variants in FGF21 and its receptors are related to diet composition [59,60,61]. FGF21-gene variants such as rs838133 and rs838145 are associated with high carbohydrate intake and low protein or fat intake, respectively [59,60]. The results indicate a potential link between the FGF21 pathway and dietary macronutrient distribution. In addition, fructose consumption, which was not accessed in this study, might be a candidate modulator of the association between the FGF21 pathway and the risk of NAFLD. Dietary factors, including fructose consumption, have been extensively studied for their contribution to the risk of NAFLD [62]. Intriguingly, a recent study has indicated that fructose ingestion can stimulate the level of circulating FGF21 [63]. To gain a deeper understanding of this relationship, further studies are required.
The protein-intake-modified association between the PHS and NAFLD risk was more evidently observed in women only. However, the reason for the significant interaction in women remains unclear. It could be due to the sex-differential expression of receptors and response to FGF21. A recent animal study thoroughly investigated the effects of sex and genetic background on metabolic, physiologic, and molecular responses to protein restriction [38]. In fact, FGF21’s response to a low-protein diet was sexually dimorphic. Female mice exhibited a significant gain in fat mass in the low-protein group but no differences in body weight and lean mass. In contrast, male mice displayed dramatic loss of body weight and lean mass but no change in fat mass. FGF21 could be responsible for these metabolic changes. Hormonal changes in women related to conditions such as polycystic ovary syndrome (PCOS) are another potential factor in the development of NAFLD. Recent research, including a meta-analysis of 15 studies, has shown a strong association between PCOS and the risk of NAFLD, independent of BMI [64]. This association has also been confirmed in a study involving Korean women [65]. Since our dataset did not have information about hormonal changes in the participants, further studies are needed to address and minimize the potential bias that might have contribute to the observed difference in women.
This study has certain limitations. First, it was conducted with a limited number of participants from one ethnic population. Genetic association studies are susceptible to population stratification where differences in allele frequency between cases and controls emanate from systematic differences in ancestry. This study’s findings require validation using a larger, independent cohort involving other ethnic populations. In addition, the analysis was limited to a relatively old collection of data. Validation of the findings on recent data will be beneficial. Second, we ascertained participants’ NAFLD statuses using the NFLS, which is a predictive equation for diagnosing NAFLD [48]. Although ultrasound and biopsy are the gold standards for NAFLD diagnosis, the NFLS possesses high sensitivity and specificity, and this was confirmed in the Korean population [66]. Third, PHS development using multiple SNPs in a specific pathway is a promising approach for predicting the risk of complex diseases. It is based on common SNPs in the genes related to the FGF21 pathway accessible from the Affymetrix Genome-wide SNP Array 5.0. However, we cannot exclude the possibility of additional SNPs that were not available on the array but potentially contributed to NAFLD risk. Fourth, we lacked details regarding prescribed drugs that may affect liver health. Finally, we cannot rule out unmeasured or residual confounding variables.
Notwithstanding, to the best of our knowledge, this is the first study to investigate the genetic contribution of the FGF21 pathway to NAFLD risk using the PHS and establish its modification by dietary intake in Korean adults. In conclusion, in women only, genetic variants in the genes encoding FGF21 and its receptors were collectively associated with NAFLD risk. Moreover, protein intake less than the RNI increased NAFLD risk in the participants with the lowest PHS values; however, it did not affect the NAFLD incidence rate in those with higher PHS values. Further investigation is required to validate these findings.

Supplementary Materials

The following supporting information can be downloaded at: https://www.mdpi.com/article/10.3390/nu15102385/s1, Table S1: Information of SNPs in FGF21, FGFR1, FGFR2 and KLB genes.

Author Contributions

Conceptualization, Y.J.P. and H.J.L.; formal analysis and data curation, J.S.; investigation, H.J.L.; writing—original draft preparation, H.J.L. and Y.J.P.; writing—review and editing, Y.J.P. and J.S.; supervision and funding acquisition, Y.J.P.; All authors have read and agreed to the published version of the manuscript.

Funding

This study was supported by Basic Science Research Programs through the National Research Foundation (NRF) funded by the Korean government (2021R1A2C2012578).

Institutional Review Board Statement

The study was approved by the Institutional Review Board of Ewha Womans University, Seoul, Republic of Korea (IRB approval number: ewha-202105-0003-01).

Informed Consent Statement

Written informed consent has been obtained from the patients to publish this paper.

Data Availability Statement

The KoGES data are available upon request from the National Research Institute of Health [37]. The GTEx dataset is available from the NIH dbGAP, study number phs000424.v8.p2.

Acknowledgments

This study was conducted with bioresources from National Biobank of Korea, the Korea Disease Control and Prevention Agency, Republic of Korea (KBN-2021-035). H.J.L and J.S. were supported by the BK21 FOUR (Fostering Outstanding Universities for Research) funded by the Ministry of Education (MOE, Republic of Korea) and the National Research Foundation of Korea (NRF-5199990614253, Education Research Center for 4IR-Based Health Care).

Conflicts of Interest

The authors declare no conflict of interest.

References

  1. Chalasani, N.; Younossi, Z.; Lavine, J.E.; Diehl, A.M.; Brunt, E.M.; Cusi, K.; Charlton, M.; Sanyal, A.J. The diagnosis and management of non-alcoholic fatty liver disease: Practice guideline by the American Association for the Study of Liver Diseases, American College of Gastroenterology, and the American Gastroenterological Association. Am. J. Gastroenterol. 2012, 107, 811–826. [Google Scholar] [CrossRef] [PubMed]
  2. Le, M.H.; Yeo, Y.H.; Li, X.; Li, J.; Zou, B.; Wu, Y.; Ye, Q.; Huang, D.Q.; Zhao, C.; Zhang, J.; et al. 2019 Global NAFLD Prevalence: A Systematic Review and Meta-analysis. Clin. Gastroenterol. Hepatol. 2022, 20, 2809–2817.e28. [Google Scholar] [CrossRef] [PubMed]
  3. Loomba, R.; Friedman, S.L.; Shulman, G.I. Mechanisms and disease consequences of nonalcoholic fatty liver disease. Cell 2021, 184, 2537–2564. [Google Scholar] [CrossRef] [PubMed]
  4. Tilg, H.; Effenberger, M. From NAFLD to MAFLD: When pathophysiology succeeds. Nat. Rev. Gastroenterol. Hepatol. 2020, 17, 387–388. [Google Scholar] [CrossRef]
  5. Eslam, M.; Newsome, P.N.; Sarin, S.K.; Anstee, Q.M.; Targher, G.; Romero-Gomez, M.; Zelber-Sagi, S.; Wai-Sun Wong, V.; Dufour, J.F.; Schattenberg, J.M.; et al. A new definition for metabolic dysfunction-associated fatty liver disease: An international expert consensus statement. J. Hepatol. 2020, 73, 202–209. [Google Scholar] [CrossRef]
  6. Ye, Q.; Zou, B.; Yeo, Y.H.; Li, J.; Huang, D.Q.; Wu, Y.; Yang, H.; Liu, C.; Kam, L.Y.; Tan, X.X.E.; et al. Global prevalence, incidence, and outcomes of non-obese or lean non-alcoholic fatty liver disease: A systematic review and meta-analysis. Lancet Gastroenterol. Hepatol. 2020, 5, 739–752. [Google Scholar] [CrossRef]
  7. Eslam, M.; Valenti, L.; Romeo, S. Genetics and epigenetics of NAFLD and NASH: Clinical impact. J. Hepatol. 2018, 68, 268–279. [Google Scholar] [CrossRef]
  8. Romeo, S.; Kozlitina, J.; Xing, C.; Pertsemlidis, A.; Cox, D.; Pennacchio, L.A.; Boerwinkle, E.; Cohen, J.C.; Hobbs, H.H. Genetic variation in PNPLA3 confers susceptibility to nonalcoholic fatty liver disease. Nat. Genet. 2008, 40, 1461–1465. [Google Scholar] [CrossRef]
  9. Sliz, E.; Sebert, S.; Würtz, P.; Kangas, A.J.; Soininen, P.; Lehtimäki, T.; Kähönen, M.; Viikari, J.; Männikkö, M.; Ala-Korpela, M.; et al. NAFLD risk alleles in PNPLA3, TM6SF2, GCKR and LYPLAL1 show divergent metabolic effects. Hum. Mol. Genet. 2018, 27, 2214–2223. [Google Scholar] [CrossRef]
  10. Kozlitina, J. Genetic Risk Factors and Disease Modifiers of Nonalcoholic Steatohepatitis. Gastroenterol. Clin. N. Am. 2020, 49, 25–44. [Google Scholar] [CrossRef]
  11. Trépo, E.; Valenti, L. Update on NAFLD genetics: From new variants to the clinic. J. Hepatol. 2020, 72, 1196–1209. [Google Scholar] [CrossRef] [PubMed]
  12. Geng, L.; Lam, K.S.L.; Xu, A. The therapeutic potential of FGF21 in metabolic diseases: From bench to clinic. Nat. Rev. Endocrinol. 2020, 16, 654–667. [Google Scholar] [CrossRef] [PubMed]
  13. Kharitonenkov, A.; Shiyanova, T.L.; Koester, A.; Ford, A.M.; Micanovic, R.; Galbreath, E.J.; Sandusky, G.E.; Hammond, L.J.; Moyers, J.S.; Owens, R.A.; et al. FGF-21 as a novel metabolic regulator. J. Clin. Investig. 2005, 115, 1627–1635. [Google Scholar] [CrossRef] [PubMed]
  14. Inagaki, T.; Dutchak, P.; Zhao, G.; Ding, X.; Gautron, L.; Parameswara, V.; Li, Y.; Goetz, R.; Mohammadi, M.; Esser, V.; et al. Endocrine regulation of the fasting response by PPARα-mediated induction of fibroblast growth factor 21. Cell Metab. 2007, 5, 415–425. [Google Scholar] [CrossRef] [PubMed]
  15. Kim, K.H.; Lee, M.S. FGF21 as a Stress Hormone: The Roles of FGF21 in Stress Adaptation and the Treatment of Metabolic Diseases. Diabetes Metab. J. 2014, 38, 245–251. [Google Scholar] [CrossRef] [PubMed]
  16. Ogawa, Y.; Kurosu, H.; Yamamoto, M.; Nandi, A.; Rosenblatt, K.P.; Goetz, R.; Eliseenkova, A.V.; Mohammadi, M.; Kuro-o, M. BetaKlotho is required for metabolic activity of fibroblast growth factor 21. Proc. Natl. Acad. Sci. USA 2007, 104, 7432–7437. [Google Scholar] [CrossRef]
  17. Suzuki, M.; Uehara, Y.; Motomura-Matsuzaka, K.; Oki, J.; Koyama, Y.; Kimura, M.; Asada, M.; Komi-Kuramochi, A.; Oka, S.; Imamura, T. βKlotho is required for fibroblast growth factor (FGF) 21 signaling through FGF receptor (FGFR) 1c and FGFR3c. Mol. Endocrinol. 2008, 22, 1006–1014. [Google Scholar] [CrossRef]
  18. Wu, X.; Ge, H.; Lemon, B.; Vonderfecht, S.; Weiszmann, J.; Hecht, R.; Gupte, J.; Hager, T.; Wang, Z.; Lindberg, R.; et al. FGF19-induced hepatocyte proliferation is mediated through FGFR4 activation. J. Biol. Chem. 2010, 285, 5165–5170. [Google Scholar] [CrossRef]
  19. Yang, C.; Jin, C.; Li, X.; Wang, F.; McKeehan, W.L.; Luo, Y. Differential specificity of endocrine FGF19 and FGF21 to FGFR1 and FGFR4 in complex with KLB. PLoS ONE 2012, 7, e33870. [Google Scholar] [CrossRef]
  20. Markan, K.R.; Naber, M.C.; Ameka, M.K.; Anderegg, M.D.; Mangelsdorf, D.J.; Kliewer, S.A.; Mohammadi, M.; Potthoff, M.J. Circulating FGF21 is liver derived and enhances glucose uptake during refeeding and overfeeding. Diabetes 2014, 63, 4057–4063. [Google Scholar] [CrossRef]
  21. Bartesaghi, S.; Wallenius, K.; Hovdal, D.; Liljeblad, M.; Wallin, S.; Dekker, N.; Barlind, L.; Davies, N.; Seeliger, F.; Winzell, M.S.; et al. Subcutaneous delivery of FGF21 mRNA therapy reverses obesity, insulin resistance, and hepatic steatosis in diet-induced obese mice. Mol. Ther. Nucleic Acids 2022, 28, 500–513. [Google Scholar] [CrossRef] [PubMed]
  22. Queen, N.J.; Bates, R.; Huang, W.; Xiao, R.; Appana, B.; Cao, L. Visceral adipose tissue-directed FGF21 gene therapy improves metabolic and immune health in BTBR mice. Mol. Ther. Methods Clin. Dev. 2021, 20, 409–422. [Google Scholar] [CrossRef] [PubMed]
  23. Camporez, J.P.; Jornayvaz, F.R.; Petersen, M.C.; Pesta, D.; Guigni, B.A.; Serr, J.; Zhang, D.; Kahn, M.; Samuel, V.T.; Jurczak, M.J.; et al. Cellular mechanisms by which FGF21 improves insulin sensitivity in male mice. Endocrinology 2013, 154, 3099–3109. [Google Scholar] [CrossRef] [PubMed]
  24. Xu, J.; Lloyd, D.J.; Hale, C.; Stanislaus, S.; Chen, M.; Sivits, G.; Vonderfecht, S.; Hecht, R.; Li, Y.S.; Lindberg, R.A.; et al. Fibroblast growth factor 21 reverses hepatic steatosis, increases energy expenditure, and improves insulin sensitivity in diet-induced obese mice. Diabetes 2009, 58, 250–259. [Google Scholar] [CrossRef] [PubMed]
  25. Li, H.; Fang, Q.; Gao, F.; Fan, J.; Zhou, J.; Wang, X.; Zhang, H.; Pan, X.; Bao, Y.; Xiang, K.; et al. Fibroblast growth factor 21 levels are increased in nonalcoholic fatty liver disease patients and are correlated with hepatic triglyceride. J. Hepatol. 2010, 53, 934–940. [Google Scholar] [CrossRef]
  26. Rusli, F.; Deelen, J.; Andriyani, E.; Boekschoten, M.V.; Lute, C.; van den Akker, E.B.; Müller, M.; Beekman, M.; Steegenga, W.T. Fibroblast growth factor 21 reflects liver fat accumulation and dysregulation of signalling pathways in the liver of C57BL/6J mice. Sci. Rep. 2016, 6, 30484. [Google Scholar] [CrossRef]
  27. Yilmaz, Y.; Eren, F.; Yonal, O.; Kurt, R.; Aktas, B.; Celikel, C.A.; Ozdogan, O.; Imeryuz, N.; Kalayci, C.; Avsar, E. Increased serum FGF21 levels in patients with nonalcoholic fatty liver disease. Eur. J. Clin. Investig. 2010, 40, 887–892. [Google Scholar] [CrossRef]
  28. Fisher, F.M.; Chui, P.C.; Antonellis, P.J.; Bina, H.A.; Kharitonenkov, A.; Flier, J.S.; Maratos-Flier, E. Obesity is a fibroblast growth factor 21 (FGF21)-resistant state. Diabetes 2010, 59, 2781–2789. [Google Scholar] [CrossRef]
  29. Gong, S.G. Isoforms of receptors of fibroblast growth factors. J. Cell. Physiol. 2014, 229, 1887–1895. [Google Scholar] [CrossRef]
  30. Yan, G.; Fukabori, Y.; McBride, G.; Nikolaropolous, S.; McKeehan, W.L. Exon switching and activation of stromal and embryonic fibroblast growth factor (FGF)-FGF receptor genes in prostate epithelial cells accompany stromal independence and malignancy. Mol. Cell. Biol. 1993, 13, 4513–4522. [Google Scholar] [CrossRef]
  31. Nygaard, E.B.; Ørskov, C.; Almdal, T.; Vestergaard, H.; Andersen, B. Fasting decreases plasma FGF21 in obese subjects and the expression of FGF21 receptors in adipose tissue in both lean and obese subjects. J. Endocrinol. 2018, 239, 73–80. [Google Scholar] [CrossRef] [PubMed]
  32. Gälman, C.; Lundåsen, T.; Kharitonenkov, A.; Bina, H.A.; Eriksson, M.; Hafström, I.; Dahlin, M.; Amark, P.; Angelin, B.; Rudling, M. The circulating metabolic regulator FGF21 is induced by prolonged fasting and PPARα activation in man. Cell Metab. 2008, 8, 169–174. [Google Scholar] [CrossRef] [PubMed]
  33. Dushay, J.; Chui, P.C.; Gopalakrishnan, G.S.; Varela-Rey, M.; Crawley, M.; Fisher, F.M.; Badman, M.K.; Martinez-Chantar, M.L.; Maratos-Flier, E. Increased fibroblast growth factor 21 in obesity and nonalcoholic fatty liver disease. Gastroenterology 2010, 139, 456–463. [Google Scholar] [CrossRef] [PubMed]
  34. Hill, C.M.; Laeger, T.; Albarado, D.C.; McDougal, D.H.; Berthoud, H.R.; Münzberg, H.; Morrison, C.D. Low protein-induced increases in FGF21 drive UCP1-dependent metabolic but not thermoregulatory endpoints. Sci. Rep. 2017, 7, 8209. [Google Scholar] [CrossRef]
  35. Xu, C.; Markova, M.; Seebeck, N.; Loft, A.; Hornemann, S.; Gantert, T.; Kabisch, S.; Herz, K.; Loske, J.; Ost, M.; et al. High-protein diet more effectively reduces hepatic fat than low-protein diet despite lower autophagy and FGF21 levels. Liver Int. 2020, 40, 2982–2997. [Google Scholar] [CrossRef]
  36. Laeger, T.; Henagan, T.M.; Albarado, D.C.; Redman, L.M.; Bray, G.A.; Noland, R.C.; Münzberg, H.; Hutson, S.M.; Gettys, T.W.; Schwartz, M.W.; et al. FGF21 is an endocrine signal of protein restriction. J. Clin. Investig. 2014, 124, 3913–3922. [Google Scholar] [CrossRef]
  37. Qian, Z.; Zhang, Y.; Yang, N.; Nie, H.; Yang, Z.; Luo, P.; Wei, X.; Guan, Y.; Huang, Y.; Yan, J.; et al. Close association between lifestyle and circulating FGF21 levels: A systematic review and meta-analysis. Front. Endocrinol. 2022, 13, 984828. [Google Scholar] [CrossRef]
  38. Green, C.L.; Pak, H.H.; Richardson, N.E.; Flores, V.; Yu, D.; Tomasiewicz, J.L.; Dumas, S.N.; Kredell, K.; Fan, J.W.; Kirsh, C.; et al. Sex and genetic background define the metabolic, physiologic, and molecular response to protein restriction. Cell Metab. 2022, 34, 209–226.e205. [Google Scholar] [CrossRef]
  39. Maida, A.; Zota, A.; Sjøberg, K.A.; Schumacher, J.; Sijmonsma, T.P.; Pfenninger, A.; Christensen, M.M.; Gantert, T.; Fuhrmeister, J.; Rothermel, U.; et al. A liver stress-endocrine nexus promotes metabolic integrity during dietary protein dilution. J. Clin. Investig. 2016, 126, 3263–3278. [Google Scholar] [CrossRef]
  40. Wu, Y.; Li, B.; Li, L.; Mitchell, S.E.; Green, C.L.; D’Agostino, G.; Wang, G.; Wang, L.; Li, M.; Li, J.; et al. Very-low-protein diets lead to reduced food intake and weight loss, linked to inhibition of hypothalamic mTOR signaling, in mice. Cell Metab. 2021, 33, 888–904.e886. [Google Scholar] [CrossRef]
  41. Frayling, T.M.; Beaumont, R.N.; Jones, S.E.; Yaghootkar, H.; Tuke, M.A.; Ruth, K.S.; Casanova, F.; West, B.; Locke, J.; Sharp, S.; et al. A Common Allele in FGF21 Associated with Sugar Intake Is Associated with Body Shape, Lower Total Body-Fat Percentage, and Higher Blood Pressure. Cell Rep. 2018, 23, 327–336. [Google Scholar] [CrossRef]
  42. Søberg, S.; Sandholt, C.H.; Jespersen, N.Z.; Toft, U.; Madsen, A.L.; von Holstein-Rathlou, S.; Grevengoed, T.J.; Christensen, K.B.; Bredie, W.L.P.; Potthoff, M.J.; et al. FGF21 Is a Sugar-Induced Hormone Associated with Sweet Intake and Preference in Humans. Cell Metab. 2017, 25, 1045–1053.e1046. [Google Scholar] [CrossRef] [PubMed]
  43. Chatterjee, N.; Shi, J.; García-Closas, M. Developing and evaluating polygenic risk prediction models for stratified disease prevention. Nat. Rev. Genet. 2016, 17, 392–406. [Google Scholar] [CrossRef]
  44. Kim, Y.; Han, B.G. Cohort Profile: The Korean Genome and Epidemiology Study (KoGES) Consortium. Int. J. Epidemiol. 2017, 46, e20. [Google Scholar] [CrossRef]
  45. Jang, M.; Won, C.; Choi, H.; Kim, S.; Park, W.; Kim, D.; Jeong, S.; Kim, B. Effects of physical activity on fractures in adults: A community-based Korean cohort study. Korean J. Sport. Med. 2017, 35, 97–102. [Google Scholar] [CrossRef]
  46. Ahn, Y.; Kwon, E.; Shim, J.E.; Park, M.K.; Joo, Y.; Kimm, K.; Park, C.; Kim, D.H. Validation and reproducibility of food frequency questionnaire for Korean genome epidemiologic study. Eur. J. Clin. Nutr. 2007, 61, 1435–1441. [Google Scholar] [CrossRef]
  47. Korean Nutrition Society. 2020 Dietary Reference Intakes for Koreans: Energy and Macronutrients; Ministry of Health and Welfare: Sejong, Republic of Korea, 2020.
  48. Kotronen, A.; Peltonen, M.; Hakkarainen, A.; Sevastianova, K.; Bergholm, R.; Johansson, L.M.; Lundbom, N.; Rissanen, A.; Ridderstråle, M.; Groop, L.; et al. Prediction of non-alcoholic fatty liver disease and liver fat using metabolic and genetic factors. Gastroenterology 2009, 137, 865–872. [Google Scholar] [CrossRef] [PubMed]
  49. Jang, S.N.; Kawachi, I.; Chang, J.; Boo, K.; Shin, H.G.; Lee, H.; Cho, S.I. Marital status, gender, and depression: Analysis of the baseline survey of the Korean Longitudinal Study of Ageing (KLoSA). Soc. Sci. Med. 2009, 69, 1608–1615. [Google Scholar] [CrossRef] [PubMed]
  50. Cho, Y.S.; Go, M.J.; Kim, Y.J.; Heo, J.Y.; Oh, J.H.; Ban, H.J.; Yoon, D.; Lee, M.H.; Kim, D.J.; Park, M.; et al. A large-scale genome-wide association study of Asian populations uncovers genetic factors influencing eight quantitative traits. Nat. Genet. 2009, 41, 527–534. [Google Scholar] [CrossRef]
  51. Abecasis, G.R.; Auton, A.; Brooks, L.D.; DePristo, M.A.; Durbin, R.M.; Handsaker, R.E.; Kang, H.M.; Marth, G.T.; McVean, G.A. An integrated map of genetic variation from 1,092 human genomes. Nature 2012, 491, 56–65. [Google Scholar] [CrossRef]
  52. Consortium, G. The Genotype-Tissue Expression (GTEx) project. Nat. Genet. 2013, 45, 580–585. [Google Scholar] [CrossRef]
  53. Lee, J.H.; Lee, H.S.; Ahn, S.B.; Kwon, Y.J. Dairy protein intake is inversely related to development of non-alcoholic fatty liver disease. Clin. Nutr. 2021, 40, 5252–5260. [Google Scholar] [CrossRef] [PubMed]
  54. Zhang, S.; Meng, G.; Zhang, Q.; Liu, L.; Wu, H.; Gu, Y.; Wang, Y.; Zhang, T.; Wang, X.; Zhang, J.; et al. Inflammatory potential of diet and risk of nonalcoholic fatty liver disease: A prospective cohort study. Eur. J. Clin. Nutr. 2022, 76, 1125–1132. [Google Scholar] [CrossRef] [PubMed]
  55. Cheng, Y.; Zhang, K.; Chen, Y.; Li, Y.; Li, Y.; Fu, K.; Feng, R. Associations between Dietary Nutrient Intakes and Hepatic Lipid Contents in NAFLD Patients Quantified by ¹H-MRS and Dual-Echo MRI. Nutrients 2016, 8, 527. [Google Scholar] [CrossRef]
  56. Alferink, L.J.; Kiefte-de Jong, J.C.; Erler, N.S.; Veldt, B.J.; Schoufour, J.D.; de Knegt, R.J.; Ikram, M.A.; Metselaar, H.J.; Janssen, H.; Franco, O.H.; et al. Association of dietary macronutrient composition and non-alcoholic fatty liver disease in an ageing population: The Rotterdam Study. Gut 2019, 68, 1088–1098. [Google Scholar] [CrossRef] [PubMed]
  57. Kaess, B.M.; Barnes, T.A.; Stark, K.; Charchar, F.J.; Waterworth, D.; Song, K.; Wang, W.Y.; Vollenweider, P.; Waeber, G.; Mooser, V.; et al. FGF21 signalling pathway and metabolic traits—Genetic association analysis. Eur. J. Hum. Genet. 2010, 18, 1344–1348. [Google Scholar] [CrossRef] [PubMed]
  58. Ji, F.; Liu, Y.; Hao, J.G.; Wang, L.P.; Dai, M.J.; Shen, G.F.; Yan, X.B. KLB gene polymorphism is associated with obesity and non-alcoholic fatty liver disease in the Han Chinese. Aging 2019, 11, 7847–7858. [Google Scholar] [CrossRef]
  59. Tanaka, T.; Ngwa, J.S.; van Rooij, F.J.; Zillikens, M.C.; Wojczynski, M.K.; Frazier-Wood, A.C.; Houston, D.K.; Kanoni, S.; Lemaitre, R.N.; Luan, J.; et al. Genome-wide meta-analysis of observational studies shows common genetic variants associated with macronutrient intake. Am. J. Clin. Nutr. 2013, 97, 1395–1402. [Google Scholar] [CrossRef]
  60. Chu, A.Y.; Workalemahu, T.; Paynter, N.P.; Rose, L.M.; Giulianini, F.; Tanaka, T.; Ngwa, J.S.; CHARGE Nutrition Working Group; Qi, Q.; Curhan, G.C.; et al. Novel locus including FGF21 is associated with dietary macronutrient intake. Hum. Mol. Genet. 2013, 22, 1895–1902. [Google Scholar] [CrossRef]
  61. Meddens, S.F.W.; de Vlaming, R.; Bowers, P.; Burik, C.A.P.; Linner, R.K.; Lee, C.; Okbay, A.; Turley, P.; Rietveld, C.A.; Fontana, M.A.; et al. Genomic analysis of diet composition finds novel loci and associations with health and lifestyle. Mol. Psychiatry 2021, 26, 2056–2069. [Google Scholar] [CrossRef]
  62. Jensen, T.; Abdelmalek, M.F.; Sullivan, S.; Nadeau, K.J.; Green, M.; Roncal, C.; Nakagawa, T.; Kuwabara, M.; Sato, Y.; Kang, D.H.; et al. Fructose and sugar: A major mediator of non-alcoholic fatty liver disease. J. Hepatol. 2018, 68, 1063–1075. [Google Scholar] [CrossRef] [PubMed]
  63. Dushay, J.R.; Toschi, E.; Mitten, E.K.; Fisher, F.M.; Herman, M.A.; Maratos-Flier, E. Fructose ingestion acutely stimulates circulating FGF21 levels in humans. Mol. Metab. 2015, 4, 51–57. [Google Scholar] [CrossRef] [PubMed]
  64. Falzarano, C.; Lofton, T.; Osei-Ntansah, A.; Oliver, T.; Southward, T.; Stewart, S.; Andrisse, S. Nonalcoholic Fatty Liver Disease in Women and Girls With Polycystic Ovary Syndrome. J. Clin. Endocrinol. Metab. 2022, 107, 258–272. [Google Scholar] [CrossRef] [PubMed]
  65. Won, Y.B.; Seo, S.K.; Yun, B.H.; Cho, S.; Choi, Y.S.; Lee, B.S. Non-alcoholic fatty liver disease in polycystic ovary syndrome women. Sci. Rep. 2021, 11, 7085. [Google Scholar] [CrossRef]
  66. Jung, J.Y.; Shim, J.J.; Park, S.K.; Ryoo, J.H.; Choi, J.M.; Oh, I.H.; Jung, K.W.; Cho, H.; Ki, M.; Won, Y.J.; et al. Serum ferritin level is associated with liver steatosis and fibrosis in Korean general population. Hepatol. Int. 2019, 13, 222–233. [Google Scholar] [CrossRef]
Figure 1. A flow chart of the study population.
Nutrients 15 02385 g001
Figure 2. Eight SNPs of FGF21-related loci. The horizontal black lines represent (a) KLB, (b) FGFR1, and (c) FGFR2 loci. The black blocks on the line represent exons. The SNPs used to calculate the PHS are shown their locations in each locus.
Nutrients 15 02385 g002
Figure 3. Expression quantitative trace loci (eQTL) analysis of genetic variants. The effect of genetic variables involved in gene expression in other tissues is shown using an eQTL violin plot. Each plot shows the density distribution of each genotype in (ac) FGFR1 rs881301, (d,e) FGFR2 rs9420328, and (f,g) FGFR2 rs2420941. The white line on the black box plot represents the median value of the expression of each SNP in the genotype. The data were verified using the GTEx Portal website, and the data included tissue-specific information.
Nutrients 15 02385 g003
Table 1. Study participants’ baseline characteristics according to NAFLD incidence.
Variables in the Third SurveyNon-Incident NAFLDIncident NAFLDp
Number, n (%)1980 (56.6)1521 (43.4)-
Age (years)55.0 ± 8.756.1 ± 8.60.0001
BMI (kg/m2)25.5 ± 3.225.3 ± 3.20.0916
Waist circumference (cm)83.9 ± 9.083.0 ± 8.60.0025
Systolic blood pressure (mmHg)115.8 ± 17.1114.2 ± 16.00.0076
Diastolic blood pressure (mmHg)76.9 ± 10.576.3 ± 10.00.0492
Fasting Blood Glucose (mg/dL)87.8 ± 8.393.3± 13.6<0.0001
Insulin (µIU/mL)6.2 ± 2.07.4 ± 2.6<0.0001
Total cholesterol (mg/dL)188.4 ± 31.7194.8 ± 34.4<0.0001
Triglyceride (mg/dL)107.8 ± 57.7151.9 ± 103.3<0.0001
HDL-C (mg/dL)47.0 ± 10.342.3 ± 9.2<0.0001
LDL-C (mg/dL)120.0 ± 28.4122.3 ± 31.00.0166
AST (U/L)23.1 ± 6.724.0 ± 6.8<0.0001
ALT(U/L)18.4 ± 7.521.8 ± 9.4<0.0001
Alcohol intake (g/week)17.0 ± 32.616.8 ± 32.10.4577
Smoking status, n (%)--0.8330
Never smoker1266 (64.0)986 (64.9)-
Former smoker354 (17.9)269 (17.7)-
Current smoker359 (18.1)265 (17.4)-
Education level, n (%)--<0.0001
Elementary or below612 (31.0)593 (39.4)-
Junior high school412 (20.8)316 (20.8)-
High school698 (35.3)440 (29.0)-
College or above254 (12.8)170 (11.2)-
Physical activity, METs-hr/wk335.5 ± 105.8337.7 ± 110.20.6882
NLFS−1.9 ± 0.7−1.6 ± 0.6<0.0001
Diabetes mellitus, n (%)62 (3.1)126 (8.3)<0.0001
Hypertension, n (%)364 (18.4)234 (15.4)0.0194
Hyperlipidemia, n (%)685 (34.6)877 (57.7)<0.0001
Total calorie intake (kcal/day)1776.8 ± 530.01762.7 ± 566.30.0749
Protein (g/day)58.4 ± 22.758.3 ± 25.20.1218
CHO (g/day)322.5 ± 88.7322.2 ± 92.80.4375
Fat (g/day)28.1 ± 17.026.7 ± 17.10.0005
Protein (%) (1)12.9 ± 2.312.9 ± 2.40.3370
CHO (%) (1)72.5 ± 6.473.1 ± 6.50.0024
Fat (%) (1)13.5 ± 5.112.8 ± 5.1<0.0001
p-values were calculated by Mann–Whitney Wilcoxon test for continuous variables and chi-squared test for categorical variables. Significance was set at p < 0.05. Abbreviations: BMI, body mass index; HDL-C, high density lipoprotein cholesterol; LDL-C, low density lipoprotein cholesterol; AST, aspartate aminotransferase; ALT, alanine aminotransferase; MET-hr/wk, metabolic equivalent of task-hour/week; CHO, carbohydrate; NLFS, non-alcoholic fatty liver disease liver fat score. (1) Percentages of energy intake from CHO, protein and fat were calculated as follows: CHO intake and protein intake (g/day) × 4 kcal/total energy intake (kcal/day) × 100%, fat intake (g/day) × 9 kcal/total energy intake (kcal/day) × 100%.
Table 2. HRs for NAFLD and information of SNPs in PHS.
GeneSNP IDCHRPosition (hg19)Major AlleleMinor AlleleRisk AlleleMAFHWEβ Adjusted (1)HR (95%CI) (1)SE (1)p(1)
KLBrs26088194chr4:39429811CTT0.17260.68200.11841.126 (0.840–1.509)0.14950.4286
FGFR1rs8813018chr8:38332318TCC0.32440.90340.09761.103 (0.929–1.309)0.08760.2653
FGFR2rs942032810chr10:123140661ACC0.09960.95270.22601.254 (0.724–2.170)0.28000.4196
rs475183210chr10:123023263GCG0.31240.53610.20471.227 (1.024–1.470)0.09210.0263
rs791382810chr10:123095255GAG0.30980.82290.26291.301 (1.068–1.583)0.10030.0088
rs242094110chr10:123229626TGT0.43380.76180.16761.183 (1.018–1.374)0.07640.0283
rs164918110chr10:123375856CTC0.01051.00000.35011.419 (0.922–2.184)0.22000.1115
rs1710170210chr10:123003707GCG0.10350.00160.04081.042 (0.705–1.539)0.19910.8375
Abbreviation: SNP, single-nucleotide polymorphism; CHR, chromosome; MAF, major allele frequency; HWE, Hardy–Weinberg equilibrium; HR, hazard ratio; 95% CI, 95% confidence interval; SE, standard error; NAFLD, non-alcoholic fatty liver disease; PHS, polygenic hazard score. (1) Adjusted for sex (male or female), age (years, continuous), BMI (continuous), ALT, physical activity, smoking status (never smoker, former smoker, or current smoker), education level (elementary or below, junior high school, high school, and college or above), diabetes mellitus (yes or no), hypertension (yes or no), hyperlipidemia (yes or no), alcohol intake (g/week, continuous) and total calorie intake (kcal/day, continuous).
Table 3. Adjusted HRs for NAFLD according to PHS.
CasesHR (95% CI)p-Trend
All (1)
First quartile8641.00<0.0001
Second quartile8401.280 (1.098–1.488)
Third quartile9191.279 (1.103–1.483)
Fourth quartile8781.572 (1.359–1.819)
Male (2)
First quartile3961.000.0171
Second quartile3821.155 (0.915–1.457)
Third quartile4121.248 (1.002–1.555)
Fourth quartile4031.455 (1.169–1.812)
Female (3)
First quartile4681.00<0.0001
Second quartile4581.357 (1.104–1.669)
Third quartile4911.336 (1.093–1.634)
Fourth quartile4911.648 (1.353–2.007)
(1) Adjusted for sex (male or female), age (years, continuous), BMI (continuous), ALT, physical activity, smoking status (never smoker, former smoker, or current smoker), education level (elementary or below, junior high school, high school, and college or above), diabetes mellitus (yes or no), hypertension (yes or no), hyperlipidemia (yes or no), alcohol intake (g/week, continuous) and total calorie intake (kcal/day, continuous). (2) Male was adjusted for (1) except for sex. (3) Female was adjusted for (1) plus menopause except for sex.
Table 4. Association between protein intake and NAFLD incidence using Cox regression.
Protein Intake (g/Day)pp-TrendProtein Intake (g/Day)pp-Trend
LowMediumHigh<RNI≥RNI
All (1)
unadjusted1.084 (0.960–1.226)1.012 (0.894–1.147)1.000.37190.17561.088 (0.984–1.204)1.000.09920.1326
model 10.988 (0.867–1.125)0.990 (0.873–1.124)1.000.98090.55721.061 (0.957–1.176)1.000.26130.1305
model 20.935 (0.820–1.066)0.962 (0.847–1.092)1.000.59960.71731.026 (0.925–1.138)1.000.63140.4391
model 30.982 (0.810–1.191)0.990 (0.850–1.152)1.000.98300.81251.121 (0.9778–1.285)1.000.09980.1066
Male (2)
unadjusted0.901 (0.748–1.087)1.010 (0.841–1.213)1.000.42640.11160.939 (0.807–1.093)1.000.41860.2141
model 10.932 (0.769–1.131)1.069 (0.889–1.286)1.000.37750.50330.971 (0.832–1.133)1.000.70860.7556
model 20.942 (0.776–1.143)1.080 (0.898–1.300)1.000.37790.44000.965 (0.827–1.127)1.000.65690.6636
model 31.109 (0.830–1.481)1.186 (0.949–1.483)1.000.29540.69731.064 (0.864–1.310)1.000.56040.5315
Female (3)
unadjusted1.304 (1.106–1.539)1.140 (0.962–1.351)1.000.00670.00031.238 (1.082–1.417)1.000.00190.0010
model 11.127 (0.948–1.339)1.064 (0.896–1.263)1.000.39920.03311.134 (0.988–1.303)1.000.07420.0403
model 21.049 (0.881–1.249)1.050 (0.883–1.248)1.000.82730.20021.069 (0.929–1.230)1.000.35040.2388
model 31.161 (0.900–1.498)1.117 (0.908–1.374)1.000.48930.16281.145 (0.956–1.371)1.000.14170.2438
The data were presented as HR (95% CI). (1) model 1: adjusted for sex, age, BMI, and ALT; model 2: further adjusted for physical activity, smoking status (never smoker, former smoker, or current smoker), education level (elementary or below, junior high school, high school, and college or above), diabetes mellitus, hypertension, hyperlipidemia, and alcohol intake (g/week); and model 3: further adjusted for total calorie intake (kcal/day). (2) Male was adjusted for (1) except for sex. (3) Female was adjusted for (1) plus menopause except for sex.
Table 5. Interaction between the PHS and NAFLD incidence by protein intake using Cox regression.
PHS Protein Intake (g/Day)p-
Trend
p-
Interaction
Protein Intake (g/Day)p-Trendp-
Interaction
CasesLowMediumHigh<RNI≥RNI
All (1) 0.0189 0.8363
First quartile8641.244 (0.800–1.934)0.861 (0.603–1.229)1.000.0105-1.494 (1.087–2.054)1.000.0287-
Second quartile8400.830 (0.559–1.232)0.908 (0.667–1.237)1.000.6085-1.045 (0.788–1.386)1.000.8925-
Third quartile9190.873 (0.603–1.263)0.843 (0.628–1.132)1.000.4591-1.004 (0.774–1.302)1.000.8165-
Fourth quartile8781.062 (0.740–1.524)1.464 (1.103–1.945)1.000.0366-1.075 (0.835–1.384)1.000.3938-
Male (2) 0.2071 0.1090
First quartile3961.087 (0.571–2.072)1.125 (0.688–1.840)1.000.8071-1.060 (0.668–1.684)1.000.6988-
Second quartile3821.858 (0.964–3.582)1.794 (1.084–2.970)1.000.1571-1.252 (0.794–1.974)1.000.4704-
Third quartile4120.721 (0.402–1.292)0.823 (0.527–1.286)1.000.6315-0.854 (0.575–1.269)1.000.7186-
Fourth quartile4031.529 (0.900–2.598)1.614 (1.060–2.458)1.000.3049-1.397 (0.937–2.083)1.000.1200-
Female (3) 0.0131 0.0361
First quartile4682.921 (1.523–5.602)1.803 (1.054–3.083)1.00<0.0001-2.021 (1.276–3.200)1.000.0016-
Second quartile4580.649 (0.392–1.075)0.835 (0.553–1.261)1.000.5836-0.920 (0.636–1.330)1.000.5114-
Third quartile4911.171 (0.711–1.927)0.861 (0.571–1.299)1.000.4094-1.176 (0.830–1.666)1.000.8531-
Fourth quartile4911.016 (0.627–1.646)1.435 (0.986–2.089)1.000.0203-0.877 (0.629–1.222)1.000.4348-
The data were presented as HR (95% CI). (1) Adjusted for sex, age, BMI, ALT, physical activity, smoking status (never smoker, former smoker, or current smoker), education level (elementary or below, junior high school, high school, and college or above), diabetes mellitus, hypertension, hyperlipidemia, alcohol intake (g/week), and total calorie intake (kcal/day). (2) Male was adjusted for (1) except for sex. (3) Female was adjusted for (1) plus menopause except for sex.
Disclaimer/Publisher’s Note: The statements, opinions and data contained in all publications are solely those of the individual author(s) and contributor(s) and not of MDPI and/or the editor(s). MDPI and/or the editor(s) disclaim responsibility for any injury to people or property resulting from any ideas, methods, instructions or products referred to in the content.

