Article

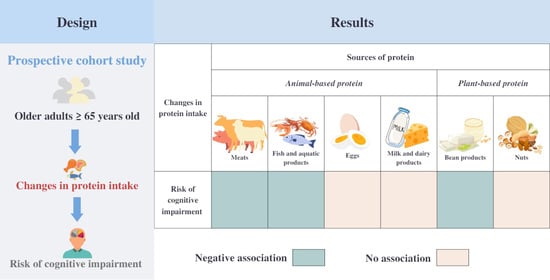
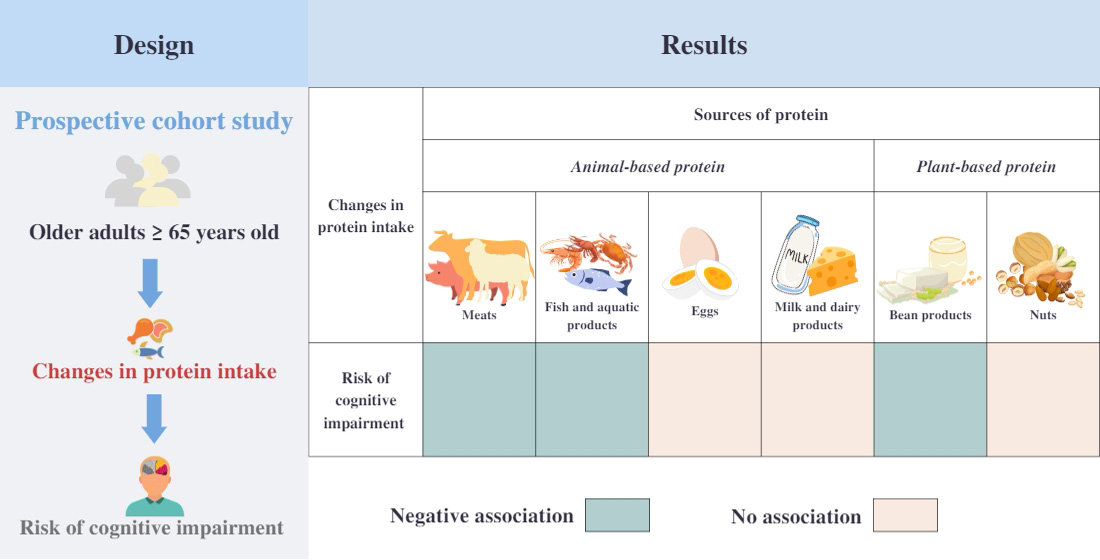
Association between Changes in Protein Intake and Risk of Cognitive Impairment: A Prospective Cohort Study

1
Postdoctoral Research Station in Basic Medicine, Hebei Medical University, Shijiazhuang 050017, China
2
School of Nursing, Nanjing Medical University, Nanjing 210029, China
3
International Education College, Hebei Medical University, Shijiazhuang 050017, China
4
School of Nursing, Hebei Medical University, Shijiazhuang 050017, China
5
Postdoctoral Research Station in Biology, Hebei Medical University, Shijiazhuang 050017, China
6
Department of Epidemiology and Statistics, School of Public Health, Hebei Medical University, Shijiazhuang 050017, China
*
Author to whom correspondence should be addressed.
Nutrients 2023, 15(1), 2; https://doi.org/10.3390/nu15010002
Submission received: 19 November 2022 / Revised: 11 December 2022 / Accepted: 16 December 2022 / Published: 20 December 2022
(This article belongs to the Section Proteins and Amino Acids)

Abstract

:
Little is known about the role of change in protein intake in affecting cognitive function among older adults. Therefore, we aimed to investigate the associations between the change in protein intake from various food groups and cognitive impairment among older adults in a prospective cohort study. A total of 6951 participants without cognitive impairment or dementia were included in this study. The frequency of protein intake from various food groups was measured by a food frequency questionnaire at baseline and follow-up. Multivariable Cox hazard models with time as the underlying time metric applied to calculate the hazard ratios (HRs) and 95% confidence intervals (CIs). During the 37,535 person-years of follow-up, 1202 (17.3%) participants developed cognitive impairment. The improvement in overall protein intake was negatively associated with cognitive impairment with multivariable-adjusted HR of 0.98 (95% CI = 0.97–0.99). Compared with participants with stable change, those with an extreme decline in animal-based protein intake had a 48% higher risk of cognitive impairment. The associations of changes in protein from six food groups with cognitive impairment were in a similar direction to the main result. Protective associations between improving protein intake and a reduced risk of cognitive impairment were observed.

Graphical Abstract

1. Introduction

Cognitive impairment is an increasingly significant public health issue. The World Health Organization (WHO) has estimated that the number of people with dementia was 50 million in 2020, and the prevalence will double every 20 years [1]. In 2050, there will be 152 million individuals living with dementia worldwide [2]. Dementia will bring a huge burden to individuals, their families, and health and social care systems [3]. Cognitive impairment has a significant impact on depression, falls, disability, hospitalization, and death among older adults [4]. This situation has attracted considerable attention from the World Health Organization (WHO), which stated that to preserve autonomy and avoid the development of chronic degenerative diseases among older adults, maintaining their normal cognitive function should be prioritized [5].
The Lancet commission concluded that 40% of worldwide dementias can be prevented or delayed by lifestyle factors, including diet and nutrition [3]. Recent systematic reviews suggest that high adherence to some specific diet patterns such as the Mediterranean diet, the Dietary Approach to Stop Hypertension (DASH) diet, and an anti-inflammatory diet might improve cognitive function [6]. However, it is necessary to have a deeper investigation of the components of diet instead of the whole combination, since the consumption of macronutrients can influence cognitive function [7]. Protein is a critical nutrient for normal cognitive functioning [8]. Regarding dietary protein intake, several studies have investigated its association with cognitive function, and the conclusion has been inconsistent. Some studies concluded that protein intake was positively associated with cognitive function [9], whereas some reported null results [7]. Therefore, there is an increasing need to investigate the association between protein intake and cognitive function.
The evidence to support the role of specific protein food groups on cognitive function is still limited [10]. Animal-based and plant-based protein intake has been shown to have diverse associations with well-known risk factors of cognitive impairment, such as hypertension, cardiovascular disease, diabetes, and obesity [11,12]. This implies cognitive impairment may have various associations with protein intake from different food sources. Given the inconsistency and paucity of data, we aimed to investigate the role of protein intake from different food sources on cognitive function in older adults.
Most prospective cohort studies only applied baseline measurements to predict the risk of cognitive impairment at follow-up [9], ignoring dynamic characteristics of protein intake over time, which could potentially introduce measurement errors. From a public health perspective, capturing changes in protein intake is critical because they reflect the risks associated with individuals making lifestyle changes [13,14]. No study to date has been conducted to investigate the association between change in protein intake and cognitive decline. Therefore, the present study aimed to examine the association between change in protein intake from different food groups and cognitive impairment in the older population using the Chinese Longitudinal Healthy Longevity Survey (CLHLS) database.

2. Materials and Methods

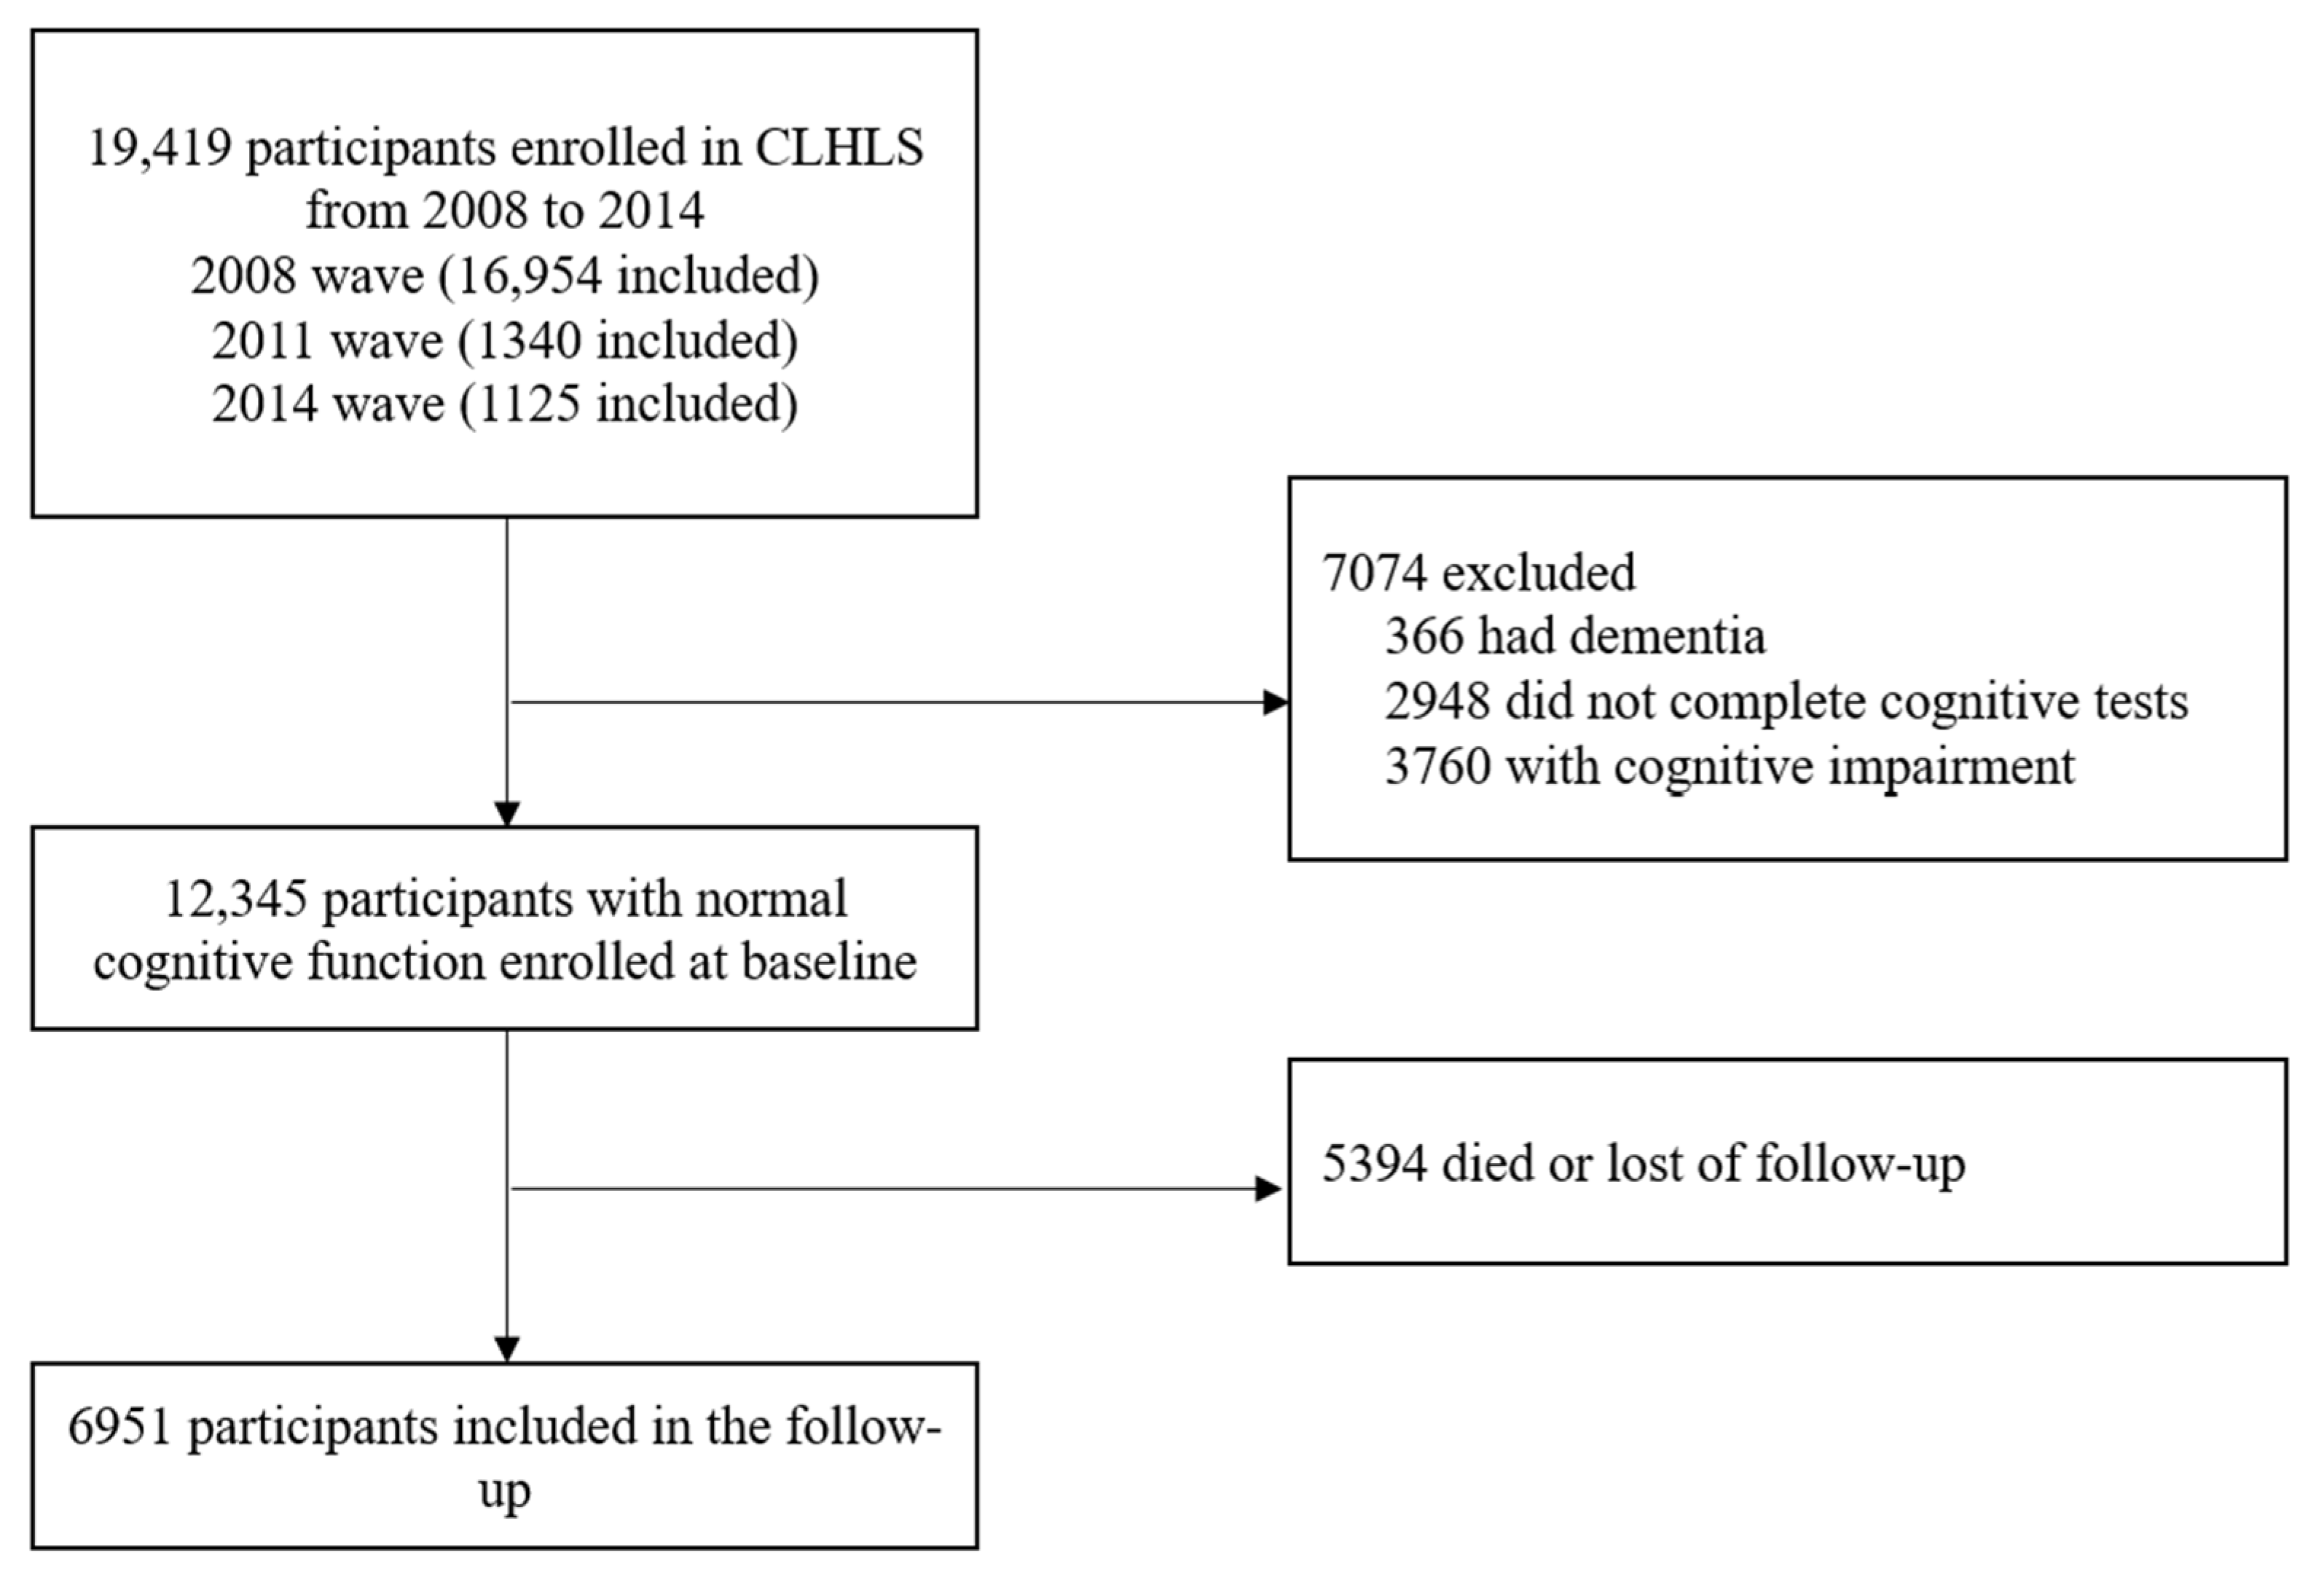
2.1. Study Design, Participants and Procedures

Participants were selected from older adults enrolled in the population-based cohort study titled the CLHLS. The CLHLS was a nationwide prospective cohort study that enrolled individuals aged 65 and older. The sample of CLHLS was randomly selected from 806 cities and counties in 23 provinces of China by using multi-stage stratified sampling, covering about half of the cities and counties in each province [15]. Follow-up surveys were conducted every 3 or 4 years. More detailed information on study design and data quality assessment of the CLHLS has been presented in previous studies [16]. All baseline and follow-up surveys were conducted through face-to-face interviews.
In this study, we included participants from the CLHLS who had normal cognitive function at baseline. The baseline exclusion criteria were people with clinically diagnosed dementia, those with cognitive impairment, missing data regarding the cognitive test, relocation, or death during the follow-up period.
Since the information of egg and nuts intake were first objectively measured in the fifth wave (2008–09), participants in the 2008 to 2009, 2011 to 2012, and 2014 waves, were enrolled in this study. Among 19,419 participants enrolled in the CLHLS from 2008 to 2014, 7074 were excluded since they had dementia or cognitive impairment or had no complete cognitive tests. After we deleted 5394 that died or were lost in follow-up cases, our sample consisted of 6951 participants with normal cognitive function (Figure 1).

2.2. Measurement of Protein Intake

The simplified food frequency questionnaire (FFQ) was measured by asking: “How often do you currently consume this food?” The reproducibility and validity of the Chinese food frequency questionnaire have been described previously [17]. Trained personnel were responsible for collecting information on protein food groups that are commonly consumed in China. We divided the protein groups into two categories, including animal-based protein food groups (eggs, fish and aquatic products, meats, and milk and dairy products), and plant-based protein food groups (bean products, nuts) [18]. Food groups were measured by five options, including “almost every day”, “not every day, but at least once per week”, “not every week, but at least once per month”, “not every month, but occasionally”, or “rarely or never”, and the recorded questionnaires were scored between 5 and 1. We computed the animal-based protein intake and plant-based protein intake by summing up food groups accordingly and respectively. Follow-up scores minus baseline scores were identified as changes in protein intake.
The absolute change scores of protein intake were calculated using protein intake at baseline and the first follow-up. According to the distribution of change scores among participants, change patterns included extreme decline (<15th percentile), moderate decline (15–30th percentile), mild decline (30–45th percentile), stable (45–55th percentile), mild improvement (55–70th percentile), moderate improvement (70–85th percentile), and extreme improvement (>85th percentile).

2.3. Cognitive Assessment

Cognitive impairment was measured by the Chinese version of the Mini-Mental State Examination (MMSE), adapted and validated from the scale developed by Folstein and colleagues [19]. The Chinese MMSE is reliable and valid for measuring cognitive function among older Chinese adults [20,21], and the validity and reliability of CMMSE were measured and verified in each wave of CLHLS. The reliability of the MMSE scale is high (Cronbach’s a = 0.96) [22]. The Chinese version of MMSE took into account the cultural and socioeconomic status of older adults in China, so that all the questions in the test could be easily understood and answered by survey participants with normal cognitive function [20]. All questions had to be answered by surveyed participants. The CMMSE has made was modified based on the socio-cultural differences of the Chinese population [21,23]. In particular, previous research has shown that participants are more likely to be unable to answer relatively difficult tasks when they exhibit poor health and/or existing cognitive limitations [24]. Therefore, based on previous research, we categorized “unable to answer” responses as incorrect answers. This approach has been widely used in previous studies and did not introduce potential bias [25]. CMMSE measured five aspects of cognitive function (orientation, reaction, attention & calculation, recall, and language) by 24 items. The total score ranged from 0 to 30, and a higher score indicated better cognitive function. Since participants’ average years of schooling in this study was 2.8 ± 5.0 years, we used education-based MMSE cut-off points to screen cognitive impairment, which has been widely used in older adults with low educational levels [26]. The cut-off points of CMMSE defined cognitive impairment were <18, respondents with no formal schooling, <21, respondents with 1 to 6 years of schooling, and <25, respondents with more than six years of schooling [27].

2.4. Covariates

Demographic variables, chronic medical conditions, and physical performance are associated with cognitive function in older adults. All multivariate models included the following covariates [28]: age at enrollment, sex, educational level (years of education), residence (urban, rural), socioeconomic status (favorable, unfavorable), marital status (married, divorced/widowed/never), living pattern (living with family members, alone or at nursing home), current smoking behavior (yes, no), current alcohol use (yes, no), current regular physical exercise condition (yes, no), activity of daily living (ADL), the instrumental activity of daily living (IADL), body mass index (BMI), and chronic medical illness including hypertension, diabetes, heart disease, stroke or cardiovascular disease (CVD), cataract, digestive system diseases, arthritis, and Parkinson’s disease.
ADL was measured at each wave using six items (dressing, bathing, indoor transferring, toileting, continence, and feeding). Participants were asked if they needed assistance with each of the six activities. The Katz Index of Independence was applied to assess ADL Disabled, respondents who needed assistance in performing one of the ADLs were considered as ADL disabled [29]. IADL was composed of eight items (shopping, visiting neighbors, washing clothes, making food, walking 1 km, crouching and standing (repeated three times), carrying 5 kg weight, and taking public transport) [30]. According to the Lawton scale, respondents were categorized as having an IADL disability if they needed help performing at least one of the eight items. Items were rated on a three-point scale ranging from 1 (complete independence) to 3 (complete dependence). The higher scores respondents obtained, the greater functional dependence they would have, and would need more external care from the family members or nursing staff.
We calculated BMI as the weight in kilograms (kg) divided by the square of the height in meters (m2), categorized into underweight (BMI < 18.5 kg/m2), normal (18.5 ≤ BMI < 24 kg/m2), overweight (BMI ≥ 24 kg/m2) [31].

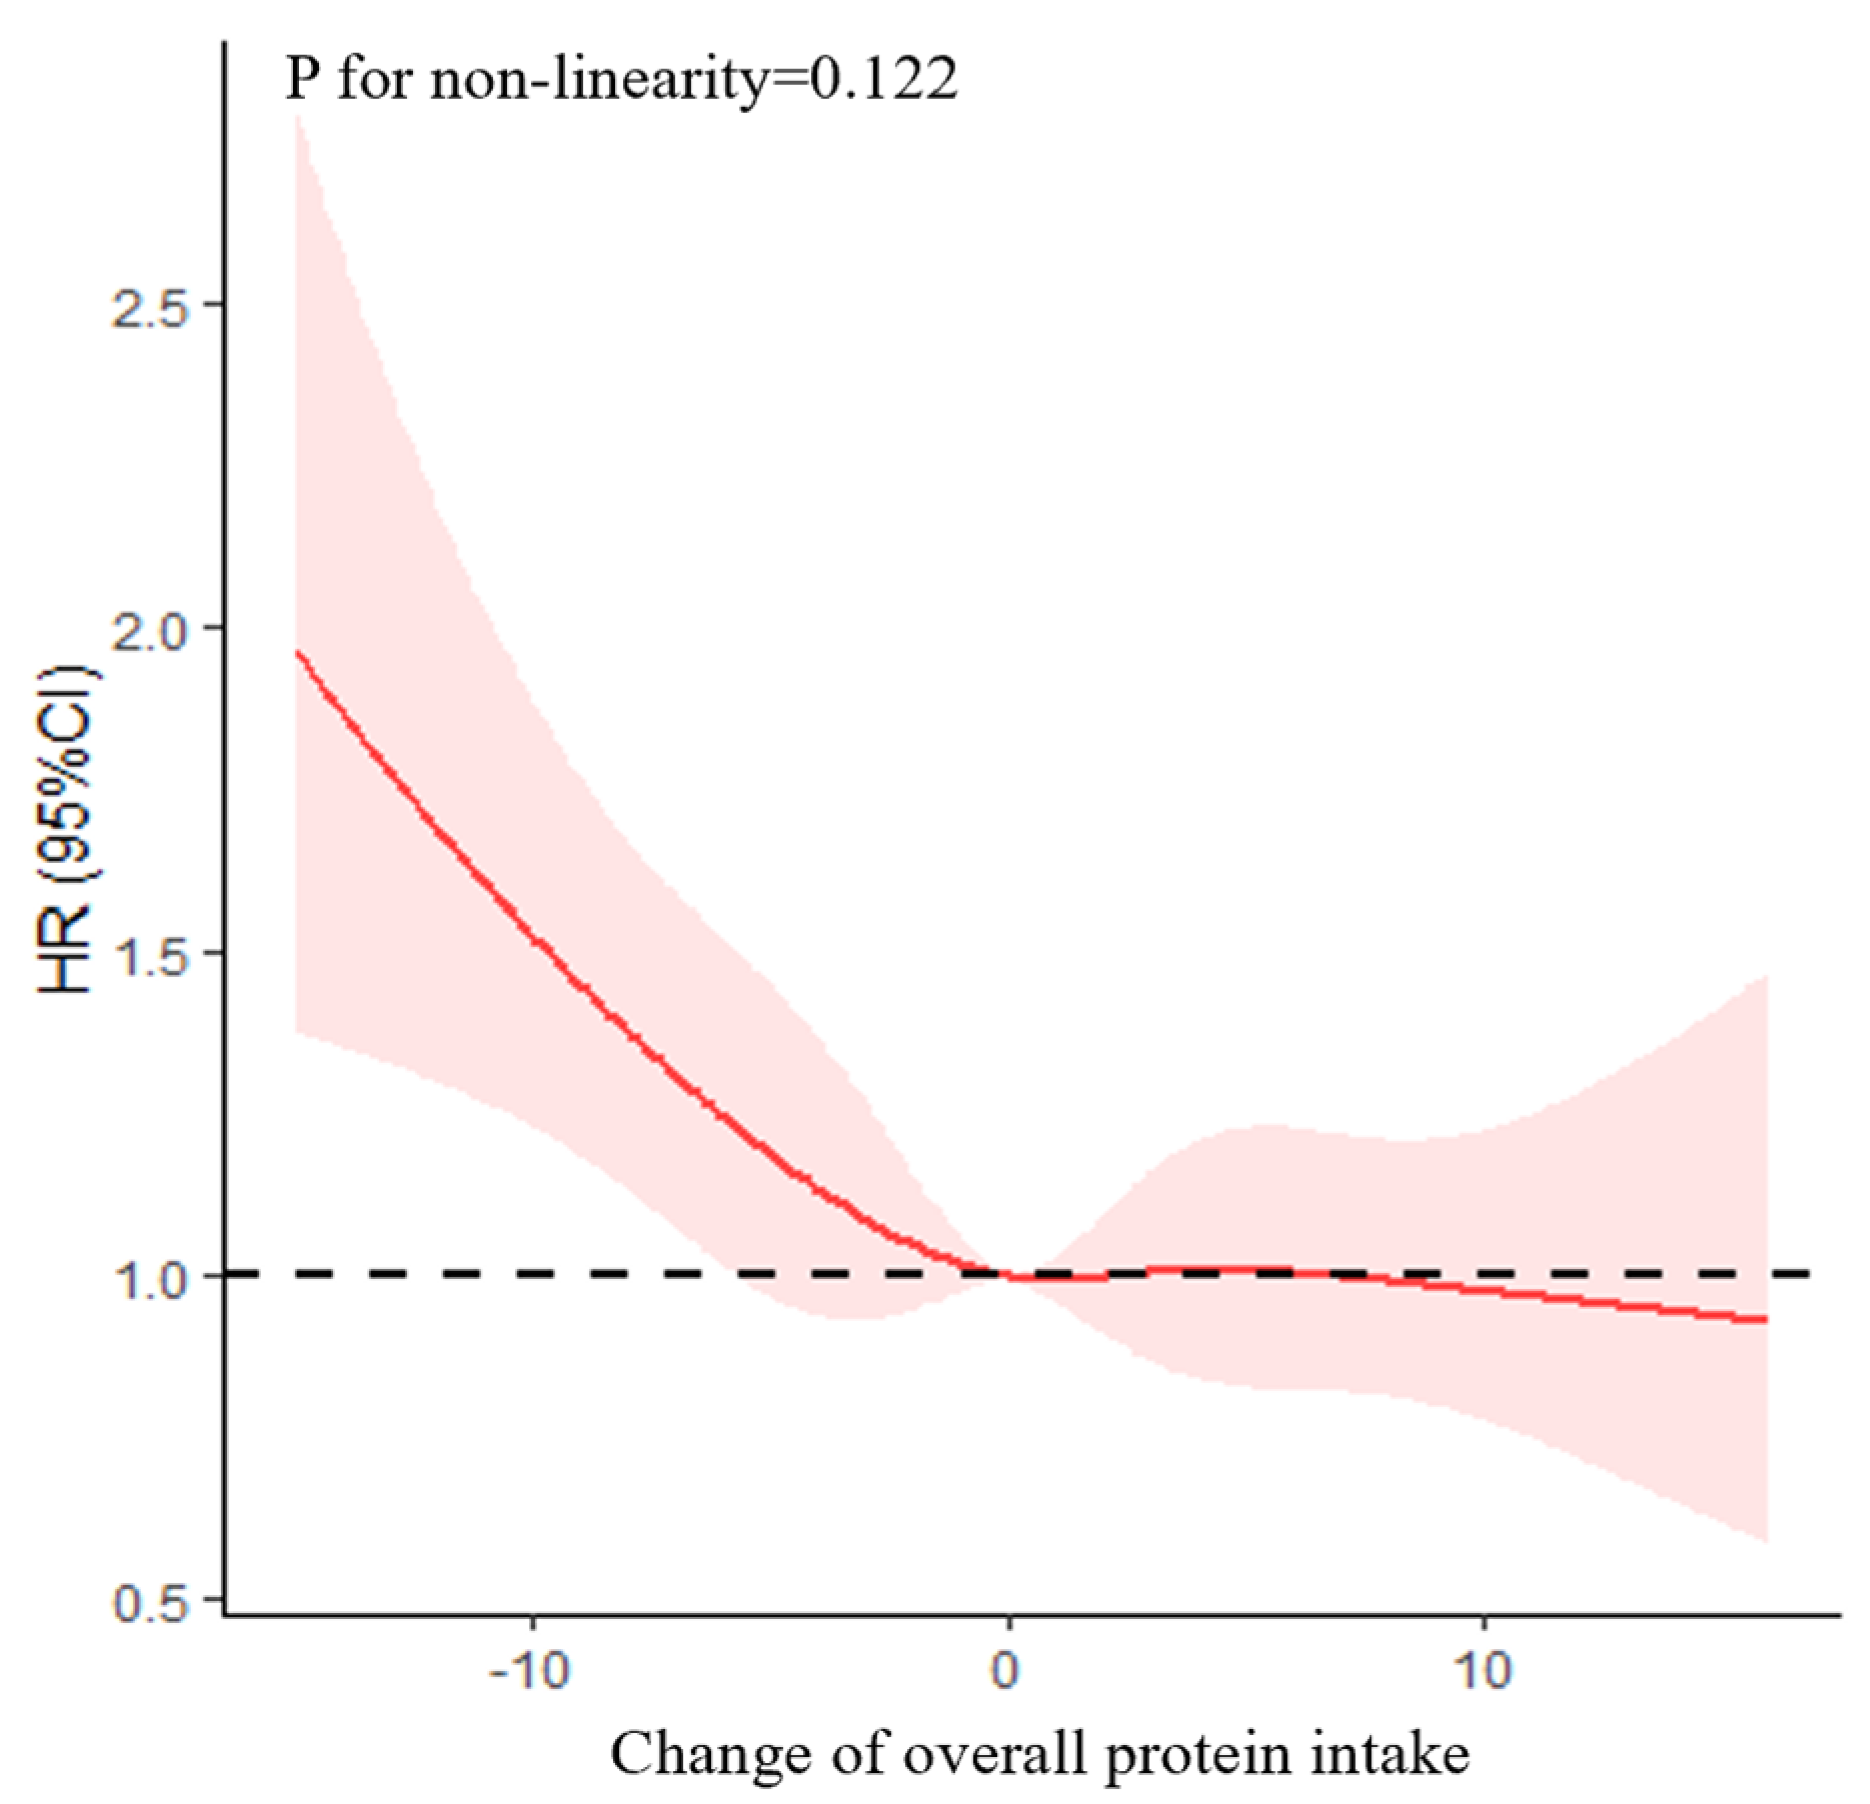
2.5. Statistical Analysis

Descriptive statistics including the Pearson chi-squared test and Student’s t-test were used to summarize the baseline characteristics. “Person-years” were calculated from the time of the baseline survey of participants to the earliest of the following events: the first occurrence of cognitive impairment, death; lost to follow-up, or time of the last survey. We applied Cox hazard models with time as the underlying time metric to calculate the hazard ratios (HRs) and 95% confidence intervals (CIs) for analyzing the association between changes in protein intake (continuous and categorical) and cognitive impairment.
Demographic variables, functional ability, and chronic medical illness were listed as possible covariates. The association between changes in protein intake and cognitive impairment was investigated in three models. Model 1 adjusted for sex and age, Model 2, further adjusted for residence, years of schooling, marital status, economic status, living pattern based on Model 1, and Model 3, further adjusted for smoking, alcohol drinking, ADL, IADL, BMI, and chronic disease (hypertension, diabetes, heart disease, stroke or CVD, cataract, digestive system diseases, arthritis, and Parkinson’s disease) based on Model 2. Adjusted hazard ratios for reversion and 95% confidence intervals were calculated. In addition, we also considered changes in time-varying variables (marital status, economic status, living pattern, smoking, alcohol drinking, ADL, IADL, BMI, and chronic disease) in the Cox hazard models.
Possible non-linear relationships by non-parametrically restricted cubic splines were analyzed between the continuous change points of protein intake and cognitive impairment [32,33]. Four knots were placed at the 15th, 30th, 70th, and 85th percentiles, and we used 0 (no change) as a reference point to test the potential non-linear association of the change in protein intake with cognitive impairment.
We also performed stratified analyses to evaluate potential effect modifications by baseline age (younger elderly at 65–79 years, octogenarian at 80–89 years, nonagenarian and centenarian at ≥90 years), sex (male or female), residence (urban, rural), socioeconomic status (favorable, unfavorable), living pattern (living with family members, alone or at nursing home), current regular physical exercise condition (yes, no), IADL disability (yes, no), and BMI (underweight, normal weight, overweight). We assessed the potential effect modifications by creating a cross-product of the stratifying variable with changes in protein intake in the fully adjusted model.
Analyses were performed with R 4.2.1 (R Foundation for Statistical Computing, Vienna, Austria) and IBM SPSS v26.0 (IBM, Armonk, NY, USA). Statistical tests were two-sided, and p values of less than 0.05 were considered to indicate statistical significance.

3. Results

Table 1 shows the participant baseline characteristics for those grouped according to the presence or absence of conversion to cognitive impairment at follow-up. During the 37,535 person-years of follow-up, 1202 (17.3%) participants developed cognitive impairment. There was a mean age of 79.7 ± 10.3 years old at baseline, and males accounted for 49.7% of total participants. In total, 2520 (36.3%) participants were urban residents, 3554 (51.2%) were married, 5889 (84.9%) had favorable economic status, and 5665 (84.9%) participants lived with family members. Most demographic variables showed significant differences between converter and non-converters. There were significant differences in change in protein intake (total, animal, and plant) between the two groups with p values of <0.001, 0.001, and 0.005, respectively.
As shown in Figure 2, after multivariable adjustment, the non-linearity association between change in overall protein intake and cognitive impairment was insignificant (p = 0.122). As shown in Table 2, after multivariable adjustment, the HR of cognitive impairment was 0.98 (95% CI = 0.97–0.99, p = 0.001). The associations between change patterns of protein intake and cognitive impairment have been shown in Supplementary Figure S1.
Change in animal-based protein intake was non-linearly correlated to the risk of cognitive impairment, with an S-shaped relationship (p for non-linear trend = 0.019) (Figure 3). After multivariable adjustment, the HR of cognitive impairment was 0.98 (95% CI = 0.97–0.99, p = 0.005) (Table 3). Compared with participants with stable change, those who in an extreme decline in animal-based protein intake had a 48% higher risk of cognitive impairment with HR of 1.48 (95% CI = 1.15–1.91, p = 0.002), and there was a non-statistically significant increase in risk for cognitive impairment in other groups (p > 0.05) (Supplementary Figure S2).
In the animal-based protein group, only the change in fish and aquatic products was non-linearly correlated to the risk of cognitive impairment, with a U-shaped relationship (p for non-linear trend = 0.018). Compared with participants with stable change, only those in an extreme decline in fish and aquatic products intake had a 50% higher risk of cognitive impairment with HR of 1.50 (95% CI = 1.16–1.93, p = 0.002).
There was no significant association between changes in eggs and milk intake and risk of cognitive impairment (p > 0.050).
Model 1 was adjusted for age (continuous), and gender, Model 2 was adjusted for model 1 plus residence, years of schooling, marital status, economic status, and living pattern, and Model 3 was adjusted for model 2 tobacco smoking, alcohol drinking, regular exercise, ADL, IADL, and chronic disease (hypertension, diabetes, heart disease, stroke or CVD, cataract, digestive system disease, arthritis, Parkinson’s disease).
The improvement in plant-based protein intake was negatively associated with the risk of cognitive impairment with an HR of 0.96 (95% CI = 0.93–0.99, p = 0.010). The non-linearity association between the change in plant-based protein intake and cognitive impairment was insignificant (p = 0.902) (Figure 4).
In the plant-based protein group, both changes in bean products and nut intake were non-linearly correlated to the risk of cognitive impairment, with a U-shaped relationship (p for non-linear trend = 0.006), and a reverse U-shaped relationship (p for non-linear trend = 0.004), respectively. For the change in bean products intake (Supplementary Figure S3), compared with participants with stable intake, participants with extreme and moderate decline intake had a higher risk of cognitive impairment with HRs of 1.37 (95% CI = 1.09–1.72, p = 0.006), and 1.26 (95% CI = 1.01–1.58, p = 0.038), respectively. For the change in nut intake, compared with participants with stable intake, participants with mild decline, mild improvement, and moderate improvement intake had a lower risk of cognitive impairment with HRs of 0.81 (95% CI = 0.67–0.97, p = 0.025), 0.70 (95% CI = 0.56–0.87, p = 0.001), and 0.58 (95% CI = 0.44–0.77, p < 0.001), respectively.
After adjusting for changes in time-varying variables, all the associations were similar to the main results (Supplementary Tables S1 and S2). Improvements in total, animal-based, and plant-based protein intake were all negatively associated with the risk of cognitive impairment with HRs of 0.95 (95% CI = 0.92–0.99, p = 0.008), 0.98 (95% CI = 0.96–0.997, p = 0.021), and 0.96 (95% CI = 0.93–0.99, p = 0.007).
In the subgroup analyses of change in overall protein intake (Table 4), the HRs of cognitive impairment were 0.97 (95% CI = 0.95–0.99, p = 0.001) in the octogenarian, and 0.98 (95% CI = 0.97–0.99, p = 0.001) in participants living with family members. The negative associations were also significant in people who did not do exercise and who were IADL disabled with HRs of 0.97 (95% CI = 0.96–0.99, p < 0.001), and 0.98 (95% CI = 0.97–0.99, p = 0.005), respectively. The association between the change in overall protein intake and cognitive impairment was only significant in people in the underweight group with HR of 0.97 (95% CI = 0.95–0.99, p = 0.005).
In the subgroup analyses for change in animal-based protein intake, the negative associations were significant in males, urban residents, participants with favorable economic status, participants lived with family members, participants who did not do regular exercise, IADL disabled participants, and underweight participants.
In the subgroup analyses for change in plant-based protein intake, the negative associations were significant in rural residents, participants with unfavorable economic status, participants lived with family members, participants who did not do regular exercise, and IADL abled participants.

4. Discussion

In this population-based cohort study, we found that an increase of protein intake was negatively associated with the presence of cognitive impairment after adjusting potential confounders. Meanwhile, an extreme decline in protein intake for most food groups significantly increased the risk of cognitive impairment in subsequent years. This study also shows that changes in animal and plant-based protein intake might have a different impact on different groups of older adults.
In terms of overall protein, more protein consumption was negatively associated with cognitive impairment. Our findings are consistent with some previous studies. Li et al. (2020) found a positive association between dietary protein intake with cognitive function in adults aged 60 years or older [9]. Glenn et al. (2019) reported that protein intake could maximize the ability to maintain physical activity, and therefore be beneficial for cognitive function [34]. A Harvard study followed more than 77,000 men and women for 20 years, and compared with consuming carbohydrates, eating protein was associated with lower odds of developing cognitive decline later in life [35]. Proteins are the building blocks for muscles, and inadequate protein intake might increase the risk of frailty and sarcopenia, which are closely related to cognitive impairment [36].
In addition, an extreme decline in protein intake could significantly increase the risk of developing cognitive impairment, and a mild or moderate decline and improvement in protein intake were not significantly associated with cognitive impairment in most food groups (meats, fish and aquatic products, eggs, and bean products). To the best of our knowledge, no study has investigated the association between an extreme decline in protein intake and cognitive function in older adults. Even though older adults usually have an age-associated reduction in food intake, their demand for protein increases with age [37,38]. Older adults need more dietary protein to counteract inflammation and catabolism associated with chronic and acute diseases that often occur with aging, and they have a declining anabolic response to protein intake [39]. Therefore, improvement in protein intake might only maintain the current level of cognitive function among older adults during a five-year follow-up. To maintain normal cognitive function with aging, older adults should consume more protein than before instead of keeping the same consumption level. However, it should be noted that currently, regarding to cognitive function, there is no specific recommendation for protein intake for older adults [34]. Additional research is needed to develop definite conclusions of protein intake for maintaining optimal cognitive function in older adults.
Our study also suggested that plant-based protein has a prior impact on cognitive function than animal-based protein, since the HR of plant-based protein intake for lowering the risk of cognitive impairment was also lower than animal-based protein intake, and this result was in line with previous studies [35,40]. Meanwhile, among various protein food groups, only an increase in nut intake decreased the risk of cognitive impairment among older adults. Unlike protein from “red” meats, plant-based protein is not associated with adverse neural consequences due to low-grade systemic inflammation, and therefore was associated with better global cognition in older adults [41]. Tryptophan is an essential amino acid that plays a key role in the microbiota-gut-brain axis, and its metabolites support the development of the central and enteric nervous systems [42]. Tryptophan must be obtained through animal or plant-based protein sources. Some evidence suggested that tryptophan from animal sources appears less readily absorbed by synthetic neurotransmitters than those from plant sources, due to stronger competition with other amino acids [43]. Additionally, the change in milk and dairy products intake was not significantly associated with cognitive impairment in this study. Available evidence on the associations between dairy food consumption and cognitive performance is scarce and inconclusive [44]. Supplementation en Vitamines et Mineraux Antioxidants (SU.VI.MAX) cohorts revealed that total dairy product intake was not associated with cognitive function, and milk consumption was negatively associated with verbal memory performance [45]. By contrast, the Maine-Syracuse Longitudinal Study showed that older adults who consumed the highest amounts of dairy products had better global cognition, executive function, and visuospatial memory compared with those who rarely consumed dairy products [46]. Further investigation of the effects of dairy product intake on cognitive function is required.
Our subgroup analysis showed that the change in protein intake was only effective in older males. Previous studies have shown that regarding physical function, older males benefited more on increasing protein intake than older females [47]. Ogata et al. (2015) found that the association between dairy product intake and short-term memory was only significant among males after adjusting for genetic and family environmental factors [48]. Previous studies summarized that females require a higher baseline starting point protein intake (~1.6 g/kg/day) than males (~1.2 g/kg/day) due to increased protein oxidation [49,50,51]. However, the underlying mechanism of gender difference in the relationship between the change in protein intake and cognitive function was still unclear [52]. Certainly, more studies need to be conducted to ascertain what gender differences in protein metabolism exist and how these differences result in different cognitive outcome.
Another interesting point in this study is that the impact of animal and plant-based protein intake varied by socioeconomic status. The negative associations between the change in animal-based protein intake and cognitive impairment were only significant in older adults with favorable economic status or living in an urban area. In contrast, the negative associations between the change in animal-based protein intake and cognitive impairment were only significant in older adults with unfavorable economic status or living in a rural area. Socioeconomic status such as household income, might play a role in older adults’ dietary preferences and choices of food quality [53]. Consumption frequencies for plant-based protein were significantly associated with lower socioeconomic status in Malaysia and Indonesia [54]. Seafood, meats and dairy products were mostly consumed by the rich [55]. The findings suggest clinical professionals should consider a socio-economic-stratified intervention while promoting protein intake in Chinese older adults.
The improvement in protein intake was not significantly protective for older adults’ cognitive impairment unless they were IADL disabled, and did not do physical exercise. Physical exercise is considered to be the most effective method for maintaining a healthy mind [56]. We hypothesized that if an older adult kept doing regular physical exercise, the impact of a change in protein intake would not be that obvious on cognitive function. In addition, as for the IADL disabled, our findings are consistent with earlier evidence showing that older people who are IADL-disabled have a higher risk of developing cognitive impairment [57], and maintaining high protein intake at an early age is important. These findings suggest that improving protein intake, especially among older adults who are IADL-disabled and without regular exercise, should be viewed as a public health intervention to address cognitive benefits.
To our knowledge, this is the first longitudinal study to examine the association between changes in protein intake from different food groups with the risk of cognitive impairment. However, there still exists some imitations. First, data on cognitive status was self-reported; therefore, it is possible that false-positive results of cognitive impairment and normal cognitive function existed in baseline and follow-ups [58]. Studies that apply objective measurements are needed in the future. Second, the collected dietary information from FFQ lacks quantitative information, which precluded assess to detailed quantitative dietary intake of protein and measurement of macronutrients. This made it impossible to adjust for energy intake in the analyses. However, several key energy intake determinants were considered, such as age, sex, physical activity, ADL, IADL and BMI [59,60]. In addition, the food groups covered the most common sources of dietary protein intake among Chinese older adults [61]. Nevertheless, more specific dietary protein intake information is required in future investigations. Third, cases of death and subjects being lost to follow-up before the first follow-up were deleted, which suggests that these cases were not random and may bias the results. Finally, because the current research design was based on the results of the survey at two-time points, it is unclear whether protein intake maintained cognitive status or whether cognitive status affected protein intake. We did a sensitivity analysis, which directly modeled the changes in protein intake between baseline and the first follow-up and cognitive status in the second follow-up. Only a change in fish and aquatic products intake was significantly negatively associated with cognitive impairment (Supplementary Table S3). Since follow-up surveys were conducted every 3 or 4 years in CLHLS, it is necessary to increase the frequency of the time points to examine the relationship between cognitive status and change in protein intake in future research.

5. Conclusions

In conclusion, among Chinese older adults, we observed a negative association between improvement in protein intake and risk of cognitive impairment, and extreme decline in protein intake increased the risk of cognitive impairment. Unlike other studies, our investigation highlights the role of improvement and decline in protein intake on cognitive performance in older adults. In addition, the impact of protein intake from different food groups on cognitive function may be affected by the characteristics of older adults. Clinical trials modifying significant protein intake should be conducted to improve the cognitive functions of older adults.

Supplementary Materials

The following supporting information can be downloaded at https://www.mdpi.com/article/10.3390/nu15010002/s1. Figure S1: Association between change patterns of overall protein intake and cognitive impairment. Figure S2: Association between change patterns of animal-based protein intake and cognitive impairment. Figure S3: Association between change patterns of plant-based protein intake and cognitive impairment. Table S1: The associations between changes in variables and cognitive impairment. Table S2: The association between the change in different types of protein intake and cognitive impairment. Table S3: The association between the change in different types of protein intake between baseline and the first follow-up and cognitive impairment in the second follow-up.

Author Contributions

Conceptualization, Q.T. and X.X.; methodology, Q.T. and X.X.; formal analysis, X.X. and Y.Y.; investigation, L.N.; writing—original draft preparation, X.X., Y.Y. and L.N.; writing—review and editing, X.Y. and X.D.; funding acquisition, X.X. All authors have read and agreed to the published version of the manuscript.

Funding

This study was funded by the National Natural Science Foundation of China (Grant nos. 72204075), Hebei Provincial Postdoctoral Science Foundation (Grant nos. B2022003032), Postdoctoral Research Funding of Hebei Medical University, and Hebei Province Social Science Development Research Project (Grant nos. 20220202303).

Institutional Review Board Statement

The studies involving human participants were reviewed and the CLHLS study was approved by the Institutional Review Board of Duke University (Pro00062871) and the Biomedical Ethics Committee of Peking University (IRB00001052-13074).

Informed Consent Statement

Written informed consent has been obtained from the patient(s) to publish this paper.

Data Availability Statement

The datasets analyzed for this study can be found in The Chinese Longitudinal Healthy Longevity Survey (CLHLS)-Longitudinal Data repository, https://opendata.pku.edu.cn/dataset.xhtml?persistentId=doi:10.18170/DVN/WBO7LK (accessed on 28 November 2022).

Conflicts of Interest

The authors declare no conflict of interest. The funders had no role in the design of the study, in the collection, analyses, or interpretation of data, in the writing of the manuscript, or in the decision to publish the results.

References

  1. World Health Organization. Dementia. 2019. Available online: https://www.who.int/news-room/fact-sheets/detail/dementia (accessed on 28 November 2022).
  2. Alzheimer’s Disease International. Dementia Statistics. 2019. Available online: https://www.alz.co.uk/research/statistics (accessed on 28 November 2022).
  3. Livingston, G.; Huntley, J.; Sommerlad, A.; Ames, D.; Ballard, C.; Banerjee, S.; Brayne, C.; Burns, A.; Cohen-Mansfield, J.; Cooper, C.; et al. Dementia prevention, intervention, and care: 2020 report of the Lancet Commission. Lancet 2020, 396, 413–446. [Google Scholar] [CrossRef] [PubMed]
  4. Patnode, C.D.; Perdue, L.A.; Rossom, R.C.; Rushkin, M.C.; Redmond, N.; Thomas, R.G.; Lin, J.S. Screening for cognitive impairment in older adults: Updated evidence report and systematic review for the US preventive services task force. JAMA 2020, 323, 764–785. [Google Scholar] [CrossRef] [PubMed] [Green Version]
  5. World Health Organization. Risk Reduction of Cognitive Decline and Dementia. 2019. Available online: https://www.who.int/publications/i/item/risk-reduction-of-cognitive-decline-and-dementia (accessed on 9 December 2022).
  6. Chen, X.; Maguire, B.; Brodaty, H.; O’Leary, F. Dietary patterns and cognitive health in older adults: A systematic review. J. Alzheimer’s Dis. 2019, 67, 583–619. [Google Scholar] [CrossRef] [PubMed]
  7. Coelho-Júnior, H.J.; Calvani, R.; Landi, F.; Picca, A.; Marzetti, E. Protein intake and cognitive function in older adults: A systematic review and meta-analysis. Nutr. Metab. Insights 2021, 14, 11786388211022373. [Google Scholar] [CrossRef] [PubMed]
  8. Wu, G. Dietary protein intake and human health. Food Funct. 2016, 7, 1251–1265. [Google Scholar] [CrossRef] [Green Version]
  9. Li, Y.; Li, S.; Wang, W.; Zhang, D. Association between dietary protein intake and cognitive function in adults aged 60 years and older. J. Nutr. Health Aging 2020, 24, 223–229. [Google Scholar] [CrossRef]
  10. Gao, R.; Yang, Z.; Yan, W.; Du, W.; Zhou, Y.; Zhu, F. Protein intake from different sources and cognitive decline over 9 years in community-dwelling older adults. Front. Public Health 2022, 10, 1016016. [Google Scholar] [CrossRef]
  11. Richter, C.K.; Skulas-Ray, A.C.; Champagne, C.M.; Kris-Etherton, P.M. Plant protein and animal proteins: Do they differentially affect cardiovascular disease risk? Adv. Nutr. 2015, 6, 712–728. [Google Scholar] [CrossRef] [Green Version]
  12. Shang, X.; Scott, D.; Hodge, A.; English, D.R.; Giles, G.G.; Ebeling, P.R.; Sanders, K.M. Dietary protein from different food sources, incident metabolic syndrome and changes in its components: An 11-year longitudinal study in healthy community-dwelling adults. Clin. Nutr. 2017, 36, 1540–1548. [Google Scholar] [CrossRef]
  13. Sotos-Prieto, M.; Bhupathiraju, S.N.; Mattei, J.; Fung, T.T.; Li, Y.; Pan, A.; Willett, W.C.; Rimm, E.B.; Hu, F.B. Association of changes in diet quality with total and cause-specific mortality. N. Engl. J. Med. 2017, 377, 143–153. [Google Scholar] [CrossRef]
  14. Xu, X.Y.; Wang, S.S.; Niu, L.; Leung, I.S.H.; Tian, Q.B. Association of leisure activity changes and reversion from mild cognitive impairment to normal cognitive function among older adults: A prospective cohort study. Front. Public Health 2022, 10, 1035762. [Google Scholar] [CrossRef] [PubMed]
  15. Yi, Z. Introduction to the Chinese Longitudinal Healthy Longevity Survey (CLHLS). In Healthy Longevity in China: Demographic, Socioeconomic, and Psychological Dimension; Yi, Z., Poston, D.L., Vlosky, D.A., Gu, D., Eds.; Springer: Dordrecht, The Netherlands, 2008; pp. 23–38. [Google Scholar]
  16. Zeng, Y.; Feng, Q.; Hesketh, T.; Christensen, K.; Vaupel, J.W. Survival, disabilities in activities of daily living, and physical and cognitive functioning among the oldest-old in China: A cohort study. Lancet 2017, 389, 1619–1629. [Google Scholar] [CrossRef] [PubMed]
  17. Zhao, W.-H.; Huang, Z.-P.; Zhang, X.; He, L.; Willett, W.; Wang, J.-L.; Hasegawa, K.; Chen, J.-S. Reproducibility and validity of a Chinese food frequency questionnaire. Biomed. Environ. Sci. 2010, 23, 1–38. [Google Scholar] [CrossRef]
  18. Zhang, Y.; Jin, X.; Lutz, M.W.; Ju, S.-Y.; Liu, K.; Guo, G.; Zeng, Y.; Yao, Y. Interaction between APOE ε4 and dietary protein intake on cognitive decline: A longitudinal cohort study. Clin. Nutr. 2021, 40, 2716–2725. [Google Scholar] [CrossRef]
  19. Folstein, M.F.; Folstein, S.E.; McHugh, P.R. “Mini-mental state”. A practical method for grading the cognitive state of patients for the clinician. J. Psychiatr. Res. 1975, 12, 189–198. [Google Scholar] [CrossRef]
  20. Jia, X.; Wang, Z.; Huang, F.; Su, C.; Du, W.; Jiang, H.; Wang, H.; Wang, J.; Wang, F.; Su, W.; et al. A comparison of the Mini-Mental State Examination (MMSE) with the Montreal Cognitive Assessment (MoCA) for mild cognitive impairment screening in Chinese middle-aged and older population: A cross-sectional study. BMC Psychiatry 2021, 21, 485. [Google Scholar] [CrossRef]
  21. Zhang, Z.; Gu, D.; Hayward, M.D. Early life influences on cognitive impairment among oldest old Chinese. J. Gerontol. Ser. B 2008, 63, S25–S33. [Google Scholar] [CrossRef]
  22. Zhu, A.; Chen, H.; Shen, J.; Wang, X.; Li, Z.; Zhao, A.; Shi, X.; Yan, L.; Zeng, Y.; Yuan, C.; et al. Interaction between plant-based dietary pattern and air pollution on cognitive function: A prospective cohort analysis of Chinese older adults. Lancet Reg. Health West. Pac. 2022, 20, 100372. [Google Scholar] [CrossRef]
  23. Yi, Z.; Vaupel, J.W. Functional capacity and self–evaluation of health and life of oldest old in China. J. Soc. Issues 2002, 58, 733–748. [Google Scholar] [CrossRef]
  24. Xu, H.; Dupre, M.E.; Gu, D.; Wu, B. The impact of residential status on cognitive decline among older adults in China: Results from a longitudinal study. BMC Geriatr. 2017, 17, 107. [Google Scholar] [CrossRef]
  25. Herzog, A.R.; Wallace, R.B. Measures of cognitive functioning in the AHEAD Study. J. Gerontol. Ser. B 1997, 52B, 37–48. [Google Scholar] [CrossRef] [PubMed]
  26. Cui, G.H.; Yao, Y.H.; Xu, R.F.; Tang, H.D.; Jiang, G.X.; Wang, Y.; Wang, G.; Chen, S.D.; Cheng, Q. Cognitive impairment using education-based cutoff points for CMMSE scores in elderly Chinese people of agricultural and rural Shanghai China. Acta Neurol. Scand. 2011, 124, 361–367. [Google Scholar] [CrossRef] [PubMed]
  27. Zhu, X.; Qiu, C.; Zeng, Y.; Li, J. Leisure activities, education, and cognitive impairment in Chinese older adults: A population-based longitudinal study. Int. Psychogeriatr. 2017, 29, 727–739. [Google Scholar] [CrossRef] [PubMed]
  28. Zhang, X.; Dupre, M.E.; Qiu, L.; Zhou, W.; Zhao, Y.; Gu, D. Urban-rural differences in the association between access to healthcare and health outcomes among older adults in China. BMC Geriatr. 2017, 17, 151. [Google Scholar] [CrossRef]
  29. Katz, S.; Ford, A.B.; Moskowitz, R.W.; Jackson, B.A.; Jaffe, M.W. Studies of illness in the aged: The index of ADL: A standardized measure of biological and psychosocial function. JAMA 1963, 185, 914–919. [Google Scholar] [CrossRef]
  30. Gu, D.; Brown, B.L.; Qiu, L. Self-perceived uselessness is associated with lower likelihood of successful aging among older adults in China. BMC Geriatr. 2016, 16, 172. [Google Scholar] [CrossRef] [Green Version]
  31. Hou, Q.; Guan, Y.; Yu, W.; Liu, X.; Wu, L.; Xiao, M.; Lü, Y. Associations between obesity and cognitive impairment in the Chinese elderly: An observational study. Clin. Interv. Aging 2019, 14, 367–373. [Google Scholar] [CrossRef] [Green Version]
  32. Malloy, E.J.; Spiegelman, D.; Eisen, E.A. Comparing measures of model selection for penalized splines in Cox models. Comput. Stat. Data Anal. 2009, 53, 2605–2616. [Google Scholar] [CrossRef] [Green Version]
  33. Durrleman, S.; Simon, R. Flexible regression models with cubic splines. Stat. Med. 1989, 8, 551–561. [Google Scholar] [CrossRef]
  34. Glenn, J.M.; Madero, E.N.; Bott, N.T. Dietary protein and amino acid intake: Links to the maintenance of cognitive health. Nutrients 2019, 11, 1315. [Google Scholar] [CrossRef]
  35. Yeh, T.-S.; Yuan, C.; Ascherio, A.; Rosner, B.A.; Blacker, D.; Willett, W.C. Long-term dietary protein intake and subjective cognitive decline in US men and women. Am. J. Clin. Nutr. 2022, 115, 199–210. [Google Scholar] [CrossRef] [PubMed]
  36. Morais, J.A.; Chevalier, S.; Gougeon, R. Protein turnover and requirements in the healthy and frail elderly. J. Nutr. Health Aging 2006, 10, 272–283. [Google Scholar] [PubMed]
  37. Otsuka, R.; Kato, Y.; Nishita, Y.; Tange, C.; Tomida, M.; Nakamoto, M.; Imai, T.; Ando, F.; Shimokata, H. Age-related changes in energy intake and weight in community-dwelling middle-aged and elderly Japanese. J. Nutr. Health Aging 2016, 20, 383–390. [Google Scholar] [CrossRef] [PubMed]
  38. Bauer, J.; Biolo, G.; Cederholm, T.; Cesari, M.; Cruz-Jentoft, A.J.; Morley, J.E.; Phillips, S.; Sieber, C.; Stehle, P.; Teta, D.; et al. Evidence-based recommendations for optimal dietary protein intake in older people: A position paper from the PROT-AGE study group. J. Am. Med. Dir. Assoc. 2013, 14, 542–559. [Google Scholar] [CrossRef] [PubMed]
  39. Walrand, S.; Guillet, C.; Salles, J.; Cano, N.; Boirie, Y. Physiopathological mechanism of sarcopenia. Clin. Geriatr. Med. 2011, 27, 365–385. [Google Scholar] [CrossRef]
  40. Mazza, E.; Fava, A.; Ferro, Y.; Moraca, M.; Rotundo, S.; Colica, C.; Provenzano, F.; Terracciano, R.; Greco, M.; Foti, D.; et al. Impact of legumes and plant proteins consumption on cognitive performances in the elderly. J. Transl. Med. 2017, 15, 109. [Google Scholar] [CrossRef] [Green Version]
  41. Vallianou, N.G.; Bountziouka, V.P.; Georgousopoulou, E.; Evangelopoulos, A.A.; Bonou, M.S.; Vogiatzakis, E.D.; Barbetseas, J.D.; Avgerinos, P.C.; Panagiotakos, D.B. Influence of protein intake from haem and non-haem animals and plant origin on inflammatory biomarkers among apparently-healthy adults in Greece. J. Health Popul. Nutr. 2013, 31, 446–454. [Google Scholar] [CrossRef] [Green Version]
  42. Roth, W.; Zadeh, K.; Vekariya, R.; Ge, Y.; Mohamadzadeh, M. Tryptophan metabolism and gut-brain homeostasis. Int. J. Mol. Sci. 2021, 22, 2973. [Google Scholar] [CrossRef]
  43. Schernhammer, E.S.; Feskanich, D.; Niu, C.; Dopfel, R.; Holmes, M.D.; Hankinson, S.E. Dietary correlates of urinary 6-sulfatoxymelatonin concentrations in the Nurses’ Health Study cohorts. Am. J. Clin. Nutr. 2009, 90, 975–985. [Google Scholar] [CrossRef] [Green Version]
  44. Dalile, B.; Kim, C.; Challinor, A.; Geurts, L.; Gibney, E.R.; Galdos, M.V.; La Fata, G.; Layé, S.; Mathers, J.C.; Vauzour, D.; et al. The EAT-Lancet reference diet and cognitive function across the life course. Lancet Planet. Health 2022, 6, e749–e759. [Google Scholar] [CrossRef]
  45. Hercberg, S.; Preziosi, P.; Briançon, S.; Galan, P.; Triol, I.; Malvy, D.; Roussel, A.-M.; Favier, A. A primary prevention trial using nutritional doses of antioxidant vitamins and minerals in cardiovascular diseases and cancers in a general population: The SU.VI.MAX study--design, methods, and participant characteristics. SUpplementation en VItamines et Minéraux AntioXydants. Control. Clin. Trials 1998, 19, 336–351. [Google Scholar] [CrossRef] [PubMed]
  46. Crichton, G.E.; Elias, M.F.; Dore, G.A.; Robbins, M.A. Relation between dairy food intake and cognitive function: The Maine-Syracuse Longitudinal Study. Int. Dairy J. 2012, 22, 15–23. [Google Scholar] [CrossRef] [PubMed] [Green Version]
  47. Oktaviani, L.W.; Hsu, H.-C.; Chen, Y.-C. Effects of health-related behaviors and changes on successful aging among Indonesian older people. Int. J. Environ. Res. Public Health 2022, 19, 5952. [Google Scholar] [CrossRef] [PubMed]
  48. Ogata, S.; Tanaka, H.; Omura, K.; Honda, C.; Hayakawa, K. Association between intake of dairy products and short-term memory with and without adjustment for genetic and family environmental factors: A twin study. Clin. Nutr. 2016, 35, 507–513. [Google Scholar] [CrossRef] [PubMed]
  49. Humayun, M.A.; Elango, R.; Ball, R.O.; Pencharz, P.B. Reevaluation of the protein requirement in young men with the indicator amino acid oxidation technique. Am. J. Clin. Nutr. 2007, 86, 995–1002. [Google Scholar] [CrossRef] [Green Version]
  50. Morton, R.W.; Murphy, K.T.; McKellar, S.R.; Schoenfeld, B.J.; Henselmans, M.; Helms, E.; Aragon, A.A.; Devries, M.C.; Banfield, L.; Krieger, J.W.; et al. A systematic review, meta-analysis and meta-regression of the effect of protein supplementation on resistance training-induced gains in muscle mass and strength in healthy adults. Br. J. Sport. Med. 2018, 52, 376–384. [Google Scholar] [CrossRef] [Green Version]
  51. Tarnopolsky, M. Protein requirements for endurance athletes. Nutrition 2004, 20, 662–668. [Google Scholar] [CrossRef]
  52. Wohlgemuth, K.J.; Arieta, L.R.; Brewer, G.J.; Hoselton, A.L.; Gould, L.M.; Smith-Ryan, A.E. Sex differences and considerations for female specific nutritional strategies: A narrative review. J. Int. Soc. Sport. Nutr. 2021, 18, 27. [Google Scholar] [CrossRef]
  53. Lin, Y.; Bolca, S.; Vandevijvere, S.; Van Oyen, H.; Van Camp, J.; De Backer, G.; Foo, L.H.; De Henauw, S.; Huybrechts, I. Dietary sources of animal and plant protein intake among Flemish preschool children and the association with socio-economic and lifestyle-related factors. Nutr. J. 2011, 10, 97. [Google Scholar] [CrossRef] [Green Version]
  54. Khusun, H.; Februhartanty, J.; Anggraini, R.; Mognard, E.; Alem, Y.; Noor, M.I.; Karim, N.; Laporte, C.; Poulain, J.-P.; Monsivais, P.; et al. Animal and plant protein food sources in Indonesia differ across socio-demographic groups: Socio-cultural research in protein transition in Indonesia and Malaysia. Front. Nutr. 2022, 9, 762459. [Google Scholar] [CrossRef]
  55. Sobhani, S.R.; Eini-Zinab, H.; Rezazadeh, A. Socioeconomic Status and Changes in Iranian Household Food Basket Using National Household Budget and Expenditure Survey Data, 1991–2017. Iran. J. Public Health 2022, 51, 919–928. [Google Scholar] [CrossRef]
  56. van Praag, H. Exercise and the brain: Something to chew on. Trends Neurosci. 2009, 32, 283–290. [Google Scholar] [CrossRef] [PubMed] [Green Version]
  57. Makino, K.; Lee, S.; Bae, S.; Shinkai, Y.; Chiba, I.; Shimada, H. Relationship between instrumental activities of daily living performance and incidence of mild cognitive impairment among older adults: A 48-month follow-up study. Arch. Gerontol. Geriatr. 2020, 88, 104034. [Google Scholar] [CrossRef] [PubMed]
  58. Chung, J.-Y.; Yoon, H.-J.; Kim, H.; Choi, K.Y.; Lee, J.J.; Lee, K.H.; Seo, E.H. Reversion from mild cognitive impairment to normal cognition: False-positive error or true restoration thanks to cognitive control ability? Neuropsychiatr. Dis. Treat. 2019, 15, 3021–3032. [Google Scholar] [CrossRef] [PubMed] [Green Version]
  59. Jakes, R.W.; Day, N.E.; Luben, R.; Welch, A.; Bingham, S.; Mitchell, J.; Hennings, S.; Rennie, K.; Wareham, N.J. Adjusting for energy intake—What measure to use in nutritional epidemiological studies? Int. J. Epidemiol. 2004, 33, 1382–1386. [Google Scholar] [CrossRef] [Green Version]
  60. Rhee, J.J.; Cho, E.; Willett, W.C. Energy adjustment of nutrient intakes is preferable to adjustment using body weight and physical activity in epidemiological analyses. Public Health Nutr. 2014, 17, 1054–1060. [Google Scholar] [CrossRef] [Green Version]
  61. Halkjær, J.; Olsen, A.; Bjerregaard, L.J.; Deharveng, G.; Tjønneland, A.; Welch, A.A.; Crowe, F.L.; Wirfält, E.; Hellstrom, V.; Niravong, M.; et al. Intake of total, animal and plant proteins, and their food sources in 10 countries in the European Prospective Investigation into Cancer and Nutrition. Eur. J. Clin. Nutr. 2009, 63, S16–S36. [Google Scholar] [CrossRef]
Figure 1. Flow diagram of sample selection.
Nutrients 15 00002 g001
Figure 2. Association between change in overall protein intake and cognitive impairment based on a restricted cubic spline model after adjusting for age (continuous), gender, residence, years of schooling, marital status, economic status, living pattern, tobacco smoking, alcohol drinking, regular exercise, ADL, IADL, BMI, and chronic disease (hypertension, diabetes, heart disease, stroke or CVD, cataract, digestive system disease, arthritis, Parkinson’s disease). The red line represents the HR, the shade of pink represents the 95% CI, and the dotted line represents the reference HR of one.
Nutrients 15 00002 g002
Figure 3. Association between changes in protein intake and cognitive impairment based on restricted cubic spline model after adjusting for age (continuous), gender, residence, years of schooling, marital status, economic status, living pattern, tobacco smoking, alcohol drinking, regular exercise, ADL, IADL, BMI, and chronic disease (hypertension, diabetes, heart disease, stroke or CVD, cataract, digestive system disease, arthritis, Parkinson’s disease). (a) Change in animal-based protein intake; (b) change in meats intake; (c) change in fish and aquatic products intake; (d) change in eggs intake; (e) change in milk and dairy products intake. The red lines represent the HRs, the shades of pink represent the 95% CIs, and the dotted lines represent the reference HRs of one.
Nutrients 15 00002 g003
Figure 4. Association between changes in protein intake and cognitive impairment based on restricted cubic spline model after adjusted for age (continuous), gender, residence, years of schooling, marital status, economic status, living pattern, tobacco smoking, alcohol drinking, regular exercise, ADL, IADL, BMI, and chronic disease (hypertension, diabetes, heart disease, stroke or CVD, cataract, digestive system disease, arthritis, Parkinson’s disease). (a) Change in plant-based protein intake; (b) change in bean products intake; (c) change in nuts intake. The red lines represent the HRs, the shades of pink represent the 95% CIs, and the dotted lines represent the reference HRs of one.
Nutrients 15 00002 g004
Table 1. Baseline characteristics of older people according to cognitive impairment status.
TotalCognitive ImpairmentNormalp Value
Number of participants695112025749
Age in years79.7 ± 10.386.7 ± 9.478.2 ± 9.8<0.001 ***
Participants per age group <0.001 ***
  Younger elderly3521 (50.7)270 (22.5)3251 (56.5)
  Octogenarian2092 (30.1)444 (36.9)1648 (28.7)
  Nonagenarian and centenarian1338 (19.2)488 (40.6)850 (14.8)
Male3456 (49.7)410 (34.1)3046 (53.0)<0.001 ***
Years of schooling2.8 ± 5.01.5 (5.0)3.1 ± 5.0<0.001 ***
Urban residence2520 (36.3)391 (32.5)2129 (37.0)0.003 **
Marital status <0.001 ***
  Married3554 (51.2)341 (28.4)3213 (56.0)
  Divorced/widowed/never3387 (48.8) 2527 (44.0)
Economic status 0.024 *
  Favorable5889 (84.9)992 (82.7)4897 (85.3)
  Unfavorable1048 (15.1)207 (17.3)841 (14.7)
Living pattern <0.001 ***
  Living with family members5665 (81.6)930 (77.4)4735 (82.5)
  Alone or at nursing home1276 (18.4)272 (22.6)1004 (17.5)
ADL6.1 ± 0.66.2 (1.0)6.1 ± 0.5<0.001 ***
ADL disabled303 (4.4)100 (8.3)203 (3.5)<0.001 ***
IADL10.1 ± 3.611.8 ± 4.513.1 ± 5.0<0.001 ***
IADL disabled2947 (42.4)786 (65.4)2161 (37.6)<0.001 ***
Smoke at present1582 (22.8)178 (14.8)1404 (24.4)<0.001 ***
Drink alcohol at present1451 (20.9)191 (15.9)1260 (21.9)<0.001 ***
Exercise at present2343 (33.8)317 (26.4)2026 (35.4)<0.001 ***
BMI (kg/m2)20.9 ± 3.520.1 ± 3.621.1 ± 3.4<0.001 ***
BMI group <0.001 ***
  Underweight1600 (23.0)377 (31.4)1223 (21.3)
  Normal3952 (56.9)670 (55.8)3282 (57.1)
  Overweight1393 (20.1)153 (12.8)1240 (21.6)
Chronic disease
  Hypertension1633 (24.0)273 (23.3)1360 (24.1)0.573
  Diabetes208 (3.0)19 (1.6)189 (3.3)0.001 **
  Heart disease637 (9.3)85 (7.2)552 (9.8)0.007 **
  Stroke or CVD352 (5.1)51 (4.3)301 (5.3)0.191
  Cataract520 (7.6)111 (9.4)409 (7.2)0.011 *
  Digestive system diseases336 (5.3)46 (4.2)290 (5.6)0.075
  Arthritis1440 (21.0)259 (21.9)1181 (20.8)0.410
  Parkinson’s disease22 (0.3)6 (0.5)16 (0.3)0.252
* p < 0.05 ** p < 0.01 *** p < 0.001.
Table 2. The association between all variables and cognitive impairment.
VariablesHR (95% CI)p Value
Age in years1.07 (1.06–1.09)<0.001 ***
Sex 0.030 *
  Female[1]
  Male0.84 (0.71–0.98)
Years of schooling0.93 (0.90–0.95)<0.001 ***
Location of residence 0.545
  Rural[1]
  Urban0.96 (0.84–1.10)
Marital status 0.001 **
  Divorced/widowed/never[1]
  Married0.75 (0.63–0.89)
Economic status 0.348
Unfavorable[1]
Favorable0.92 (0.78–1.09)
Living pattern 0.545
  Alone or at nursing home[1]
  Living with family members1.04 (0.89–1.23)
ADL1.03 (0.96–1.11)0.402
IADL1.03 (1.02–1.05)<0.001 ***
BMI1.001 (0.998–1.004)0.638
Smoke at present 0.859
  No[1]
  Yes1.02 (0.84–1.10)
Drink at present 0.482
  No[1]
  Yes0.48 (0.78–1.12)
Exercise at present 0.053
  No[1]
  Yes0.87 (0.75–1.002)
Hypertension 0.270
  No[1]
  Yes0.92 (0.78–1.07)
Diabetes 0.701
  No[1]
  Yes0.91 (0.56–1.48)
Heart disease 0.701
  No[1]
  Yes0.95 (0.74–1.22)
Stroke or CVD 0.535
  No[1]
  Yes1.11 (0.80–1.28)
Cataract 0.899
  No[1]
  Yes1.02 (0.81–1.28)
Digestive system diseases 0.375
  No[1]
  Yes0.87 (0.63–1.19)
Arthritis 0.305
  No[1]
  Yes1.08 (0.93–1.26)
Parkinson’s disease 0.799
  No[1]
  Yes1.11 (0.49–2.51)
Change in overall protein intake0.98 (0.97–0.99)0.001 **
* p < 0.05 ** p < 0.01 *** p < 0.001.
Table 3. The association between the change in different types of protein intake and cognitive impairment.
HR (95% CI)p Value
Animal-based protein
Model 10.98 (0.97–0.99)0.005 **
Model 20.98 (0.96–0.99)0.002 **
Model 30.98 (0.96–0.99)0.003 **
Meats
Model 10.95 (0.91–0.995)0.030 *
Model 20.95 (0.91–0.99)0.018 *
Model 30.95 (0.91–0.995)0.030 *
Fish and aquatic products
Model 10.95 (0.91–0.98)0.005 **
Model 20.94 (0.91–0.98)0.003 **
Model 30.94 (0.90–0.98)0.005 **
Eggs
Model 10.96 (0.92–1.001)0.054
Model 20.97 (0.93–1.01)0.093
Model 30.96 (0.92–1.001)0.052
Milk and dairy products
Model 10.997 (0.96–1.03)0.843
Model 20.99 (0.96–1.03)0.728
Model 30.99 (0.95–1.03)0.592
Plant-based protein
Model 10.96 (0.94–0.99)0.007 **
Model 20.96 (0.94–0.99)0.008 **
Model 30.96 (0.93–0.99)0.010 *
Bean products
Model 10.96 (0.93–0.995)0.023 *
Model 20.96 (0.93–0.99)0.020 *
Model 30.96 (0.92–0.996)0.031 *
Nuts
Model 10.97 (0.93–1.01)0.096
Model 20.97 (0.93–1.01)0.106
Model 30.98 (0.93–1.02)0.250
* p < 0.05 ** p < 0.01.
Table 4. The association between change in protein intake and cognitive impairment in subgroups.
Overall ProteinAnimal-Based ProteinPlant-Based Protein
No of Converters/Person YearsConversion RateHR (95% CI)p ValueHR (95% CI)p ValueHR (95% CI)p Value
Age
  Younger elderly270/22,5347.70.98 (0.96–1.01)0.1350.98 (0.95–1.02)0.2800.96 (0.91–1.01)0.128
  Octogenarian444/10,08321.20.97 (0.95–0.99)0.001 **0.96 (0.94–0.98)0.001 **0.96 (0.92–1.004)0.073
  Nonagenarian and centenarian488/500436.50.99 (0.97–1.01)0.2250.99 (0.96–1.01)0.2910.98 (0.93–1.02)0.323
Sex
  Male410/18,93811.90.97 (0.95–0.99)0.005 **0.96 (0.94–0.99)0.009 **0.96 (0.91–1.003)0.064
  Female792/18,69822.70.99 (0.97–1.001)0.0520.98 (0.97–1.002)0.0760.98 (0.95–1.01)0.172
Location of residence
  Urban391/13,58215.50.98 (0.96–1.003)0.0950.98 (0.96–0.99)0.011 *0.98 (0.94–1.03)0.480
  Rural811/24,06018.30.98 (0.97–0.99)0.003 **0.98 (0.95–1.002)0.0760.96 (0.93–0.99)0.021 *
Economic status
  Favorable992/31,97716.80.98 (0.97–0.99)0.001 **0.98 (0.96–0.99)0.005 **1.02 (0.95–1.09)0.619
  Unfavorable207/557519.80.99 (0.96–1.02)0.5430.98 (0.94–1.02)0.2810.96 (0.93–0.99)0.010 *
Living pattern
  Living with family members930/31,15716.40.98 (0.97–0.99)0.001 **0.97 (0.96–0.99)0.003 **0.97 (0.94–0.99)0.019 *
  Alone or at nursing home272/644321.30.99 (0.96–1.02)0.4890.99 (0.95–1.02)0.4950.99 (0.93–1.05)0.699
Exercise at present
  Yes317/13,28413.50.999 (0.98–1.02)0.9620.997 (0.97–1.03)0.8251.01 (0.96–1.06)0.792
  No883/24,28919.30.97 (0.96–0.99)<0.001 ***0.97 (0.95–0.99)0.001 **0.95 (0.92–0.99)0.004 **
IADL disabled
  Yes786/13,37926.70.98 (0.97–0.99)0.005 **0.98 (0.96–0.995)0.014 *0.96 (0.93–0.996)0.031 *
  No416/24,25810.40.98 (0.96–1.001)0.0610.98 (0.95–1.003)0.0780.97 (0.93–1.02)0.230
BMI
  Underweight377/814423.60.97 (0.95–0.99)0.005 **0.96 (0.94–0.99)0.005 **0.96 (0.91–1.01)0.147
  Normal670/21,61717.00.99 (0.97–1.003)0.1270.99 (0.97–1.01)0.2430.98 (0.94–1.01)0.156
  Overweight153/787011.00.98 (0.94–1.01)0.1490.96 (0.92–1.01)0.1140.98 (0.91–1.05)0.524
Converters: participants who converted from normal cognitive function to cognitive impairment. * p < 0.05 ** p < 0.01 *** p < 0.001. Adjusted for age (continuous), gender, residence, years of schooling, marital status, economic status, living pattern, tobacco smoking, alcohol drinking, regular exercise, ADL, IADL, BMI, chronic disease (hypertension, diabetes, heart disease, stroke or CVD, cataract, digestive system disease, arthritis, Parkinson’s disease).
Disclaimer/Publisher’s Note: The statements, opinions and data contained in all publications are solely those of the individual author(s) and contributor(s) and not of MDPI and/or the editor(s). MDPI and/or the editor(s) disclaim responsibility for any injury to people or property resulting from any ideas, methods, instructions or products referred to in the content.

