Article

Metabolomics Analysis Reveals the Effects of Compound Fuzhuan Brick Tea (CFBT) on Regulating Dyslipidemia and Metabolic Disorders in Mice Induced by High-Fat Diet

1
Key Laboratory of Tea Science of Ministry of Education, Hunan Agricultural University, Changsha 410128, China
2
College of Biological Science and Agriculture, Qiannan Normal University for Nationalities, Duyun 558000, China
3
School of Crop Production Technology, Institute of Agriculture Technology, Suranaree University of Technology, Nakhorn Ratchasima 30000, Thailand
*
Authors to whom correspondence should be addressed.
Nutrients 2022, 14(6), 1128; https://doi.org/10.3390/nu14061128
Submission received: 16 January 2022 / Revised: 2 March 2022 / Accepted: 4 March 2022 / Published: 8 March 2022
(This article belongs to the Section Nutrition and Metabolism)

Abstract

:
Background: It is well known that obesity induced by high-fat diet (HFD) poses a serious threat to people’s health. Fuzhuan brick tea, one of the most popular beverages, is reported to possess a significant effect on regulating lipid metabolism, attributed to its many bioactive ingredients. However, the efficacy and mechanism of compound Fuzhuan brick tea (CFBT) made from Fuzhuan brick tea and other six Chinese herbal medicines are still not well defined. Methods: Sixty mice were divided into six groups: normal control group (CK), high-fat model group (NK), positive control group with anti-hyperlipidemic drug (YK), CFBT at low-(FL), medium-(FM) and high-(FH) dosage. Intervening for 30 days, conventional indexes analysis combined with metabolomics were performed to evaluate the changes in biochemical indexes and liver metabolic profiles in mice submitted to HFD. Results: CFBT treatment was able to ameliorate obesity, serum biochemical parameters, antioxidant activity and hepatic steatosis. In addition, significant alterations in the liver tissue metabolic profiles were observed, with most of these associated with inflammation, glucose and lipid metabolism. Conclusions: This study provides evidence that consumption of CFBT is capable of preventing dyslipidemia, reducing weight gain, restoring liver injury, as well as improving metabolic disorders.

1. Introduction

The continuous ingestion of a high-energy and high-fat diet (HFD) may cause harmful activation of the immune system and induce lipid metabolism disorder, which may lead to chronic metabolic diseases such as diabetes, hypertension, cardiovascular disease and obesity [1,2]. The prevalence of obesity has doubled in more than 70 countries and has continued to increase in most other countries over the past several decades [3], becoming a significant global public health problem [4,5,6]. The disorder of fat metabolism in obese individuals is mainly manifested by the increase in plasma free fatty acids, cholesterol, triglycerides, total fat and other lipid profiles. When suffering from obesity, the reduction in mobilization and utilization of free fatty acids is accompanied by the elevation of free fatty acids and lipid volume in the blood, and patients with carbohydrate-induced hypertriglyceridemia are prone to obesity. Obesity is closely associated with hyperlipidemia. The level of triglyceride in the blood of obese patients is increased. Meanwhile, the fasting and postprandial insulin of obese patients will be increased, which may be responsible for the increase in fat synthesis and the decrease in fat decomposition. Therefore, obese patients are usually accompanied by high blood lipids. There are two types of hyperlipidemias: primary hyperlipidemia is related to genetic factors and abnormalities of enzymes, receptors or apolipoproteins involved in lipoprotein metabolism and transport due to genetic defects; secondary hyperlipidemia is mostly caused by metabolic disorders (diabetes, obesity, hypertension, liver and kidney diseases, etc.). With the continuous innovation and development of plant natural products and medical research, natural drugs and high-efficiency health care products made of plant functional ingredients have strong biological activity [7,8], which can achieve high efficiency in treating diseases, but also have side effects on the human body [9].
Many conventional treatments for the prevention of obesity have proved to be ineffective; considerable attention has been focused on tea consumption because it is rich in several bioactive substances, such as tea polyphenols, catechins, caffeine, tea polysaccharides and other potential biologically active compounds [10,11], which are able to effectively reduce the content of triglycerides (TG) and cholesterol, promote the excretion of TG from feces [12], and improve oxidase activity [13]. Numerous reports have shown that the beneficial components of tea can promote a reduction in body weight by regulating the expression of multiple genes in adipose tissue of obese mice induced by HFD [14,15,16,17], decrease glucose concentration and leptin level [18], and modify the gut microbiota [19]. Li Qiuhua et al. found that stir-fried tea (HT) could decrease the levels of liver and serum TG and that the degree of hepatic steatosis and adipocyte hypertrophy was accompanied by weight loss. Meanwhile, HT treatment was seen to have a potential protective effect on obese mice induced by a HFD via activating AMPK/ACC/CPT1 pathway and plays a significant protective role to a certain extent [20]. Similarly, another study reported that green tea extract (GTE) intake could decrease body weight, prevent the accumulation of liver fat and ameliorate hyperglycemia and insulin resistance in HFD-fed mice. Moreover, these anti-obesity mechanisms suggested that GTE supplementation may improve fatty liver and weight gain in hyperlipidemic mice by activating sirtuin 1 and amp-activated protein kinase pathways [21]. In addition, the daily consumption of tea has been reported to effectively inhibit intestinal lipid absorption, reduce liver fat tissue content and pancreatic lipase activity and improve free fatty acid induced liver cell insulin resistance related metabolic abnormalities, thereby regulating blood lipid levels and preventing obesity or type 2 diabetes caused by HFD [22,23], as well as reducing a variety of diseases and health risks [24,25,26,27,28].
Metabonomics provide a new perspective for drug discovery [29], drug toxicity evaluation [30], disease diagnosis [31], pathogenetic mechanisms and several related topics, as its aim is the quantitative and qualitative analysis of the dynamic metabolic response of biological systems to biological stimulation and genetic modification [32]. Moreover, metabonomic is highly effective for identifying metabolic changes caused by environmental chemical exposure and screening molecular biomarkers. Fuzhuan brick tea, a popular post-fermented tea consumed as a daily beverage by a large number of people from Hunan Province in China, has been widely applied in food, medical and cosmetic industries due to its unique quality, flavor [33] and complex chemical substances [34,35] formed by special processing technology [36], as well as its remarkable health care effects. In our previous paper, a compound teabag with Fuzhuan brick tea as the main raw material was developed, which had a unique flavor and high safety [37]. In recent years, some studies have revealed the efficiency of Fuzhuan brick tea [38,39], but there are few reports on CFBT. In this study, metabonomics and regular serum biochemical detection methods were used to analyze the biochemical abnormalities of mice induced by HFD and evaluate the therapeutic effect of CFBT.

2. Materials and Methods

2.1. CFBT Preparation and Extraction

All the plant materials were obtained from Hunan Changsha Dekang Biotechnology Co., Ltd. (Changsha, China). CFBT is made of Fuzhuan brick tea (Camellia sinensis), hawthorn (Crataegus pinnatifida Bge.), dandelion root (Taraxacum mongolicum Hand.-Mazz.), mint leaves (Mentha canadensis L.), fennel (Foeniculum vulgare Mill.), Orange peel (Citrus reticulata Bla.) and chamomile (Matricaria chamomilla L.), with a weight ratio of 5:5:5:6:3:5:4. An appropriate amount of CFBT samples were ground and extracted in boiling water at a ratio of 1:10 for 30 min, and then filtered with two layers of industrial gauze after the tea infusion was slightly cold. The tea dregs were extracted again for 20 min in water (1:8, w/v), and the tea infusion extracted twice was mixed and filtered by vacuum. The filtrate was concentrated to a certain concentration with a rotary evaporator. After being frozen at −80 °C for 12 h, the samples were freeze-dried for 28 h. Finally, the dried powder was collected and stored at −80 °C before use.

2.2. Animal Experimental Design

Sixty 5-week-old SPF male Kunming mice (license number SCXK (Xiang) 2016-0002) weighted 32 ± 2 g were purchased from Hunan Slack Jingda Experimental Animal Co., Ltd. (Changsha, China). The mice were kept in a room with a 12 h day and night cycle at a temperature of 20–26 °C and a relative humidity of 50–60%. After 7 days of adaptive feeding, the mice were randomly divided into 6 groups with 10 mice in each group, and they were labeled. The normal control group (CK) was fed a normal diet, while other groups were fed a high-fat diet (1.5% cholesterol, 0.5% bile salt, 5.0% egg yolk powder, 10.0% lard, and 83.0% normal diet). The CK and model control groups (NK) were given the same volume of mineral water, while the mice fed a high-fed diet were treated with Xuezhikang capsule (YK, 91.0 mg/kg), CFBT at low-(FL, 247.5 mg/kg), medium-(FM, 495.0 mg/kg) and high-dosage (FH, 990.0 mg/kg) for 4 consecutive weeks. During the experiment, the food intake and activity status of the mice were observed and recorded every day, and the mice were weighed every week.

2.3. Serum Collection and Biochemical Analysis

The blood samples were collected in a 2 mL EP tube after the experiment and kept at room temperature for 30 min to avoid vibration, and then were centrifuged at 3500× g at 4 °C for 10 min to obtain the upper serum. The serum total cholesterol (TC), triglyceride (TG), low-density lipoprotein cholesterol (LDL-C), high-density lipoprotein cholesterol (HDL-C), glucose, insulin, alanine aminotransferase (ALT) and aspartate aminotransferase (AST) were determined by using kits purchased from Nanjing Jiancheng Institute of Bioengineering (Nanjing, China).

2.4. Preparation of Liver Tissue Homogenate

The mice liver tissues were rinsed in normal saline to remove blood. After drying, 0.2 g was weighed and added with normal saline to grind on ice bath to prepare 10% liver tissue homogenate and centrifuged at 3500× g at 4 °C for 10 min, and then the supernatant was collected and subpackaged. Superoxide dismutase (SOD) and malondialdehyde (MDA) in liver homogenate were determined with kits according to the manufacturer’s instructions (provided by Nanjing Jiancheng Institute of Bioengineering, Nanjing, China).

2.5. Histopathology Examination

About 0.5 g of liver tissue was immersed in 10% formalin solution for 48 h, embedded in paraffin and sliced into 5μm thickness. The slices were placed in xylene for 20 min and dehydrated in 100%, 95%, 85% and 75% ethanol for 5 min successively. Then, the slices were rinsed with distilled water for 5 min and stained with hematoxylin and eosin (H&E) for 1 min, respectively. The dried slices were placed in xylene for 10 min and sealed with neutral gum. The H&E staining images were captured at 40-times magnification.

2.6. Samples Preparation for Metabolomics

A 50 mg fresh tissue sample was homogenized with 1000 μL ice cold methanol/water (70%, v/v), then the cold steel balls were added to the mixture and homogenized at 30 Hz for 3 min. After the mixture was vortexed for 1 min, and centrifuged at 12,000× g for 10 min at 4 °C. Subsequently, the collected supernatant was used for LC-MS/MS analysis.

2.7. HPLC-MS Analysis

LC-ESI-MS/MS system (UPLC, Shim-pack UFLC SHIMADZU CBM A system, https://www.shimadzu.com/, accessed on 17 September 2019; MS, QTRAP® 6500 + System, https://sciex.com/, accessed on 17 September 2019) was used to analyze the samples. The samples were injected into a 2 μL of ACQUITY UPLC HSS T3 C18 column (1.8 µm, 2.1 mm × 100 mm, Waters); Solvent system was water (0.04% acetic acid, mobile phase A): acetonitrile (0.04% acetic acid, mobile phase B); Gradient program was shown in Table 1. Mass spectra were analyzed and obtained by using a triple quadrupole-linear ion trap mass spectrometer (QTRAP® 6500 + LC-MS/MS System) equipped with an ESI Turbo Ion-Spray interface with positive and negative ion mode and controlled by Analyst 1.6.3 software (Sciex). The temperature of source was set at 500 °C. Ion spray voltage (IS) was set at 5500 V (positive) and −4500 V (negative). The ion source gas I (GSI), gas II (GSII) and curtain gas (CUR) were set at 55, 60, and 25.0 psi, respectively. A total of 10 and 100 μmol/L polypropylene glycol solutions were used for instrument tuning and mass calibration in QQQ and LIT modes, respectively.

2.8. Data Processing and Statistical Analysis

All data were submitted to one-way analysis of variance using the statistical software SAS 9.0. Data are presented as means ± SE. p-value > 0.05 means the difference is not significant, p-value < 0.05 is accepted as significant, and p-value < 0.01 is considered to be a significant difference.
All of the LC/MS data were processed by using MVDB V2.0 database (Wuhan Metware Biotechnology Co., Ltd., Wuhan, China) and public database. After the metabolites were quantitatively analyzed by triple quadrupole mass spectrometry multi reaction monitoring mode (MRM), the qualitative and quantitative analysis of mass spectrometry was performed by the Software Analyst 1.6.1, including baseline filtration, peak identification, integration, retention time correction, peak alignment and mass spectrometry fragment attribution analysis. The data was normalized and annotated according to the obtained retention time, mass-to-charge ratio and peak intensity, and further confirmed the use of standards for most substances. Firstly, the principal component analysis (PCA) of unsupervised pattern recognition was used to analyze the detected metabolites to obtain a preliminary understanding of the overall metabolite difference between the samples of each group and the degree of variability between the samples within the group. In addition, partial least squares-discriminant analysis (PLS-DA) with supervised pattern recognition was used to distinguish the overall difference of metabolites between groups to find different metabolites. Cross-partial least squares discriminant analysis (OPLS-DA) was used to remove irrelevant differences to screen different variables to find differences between samples in each group, which was extensively used to select the biomarkers by a variable importance in projection (VIP). The validity of the models against overfitting was estimated by the parameter R2Y values, and the predictive ability was described by Q2 values. Furthermore, the differential metabolites were screened by multidimensional statistics VIP value (VIP > 1), one-dimensional Statistics (p < 0.05) and fold change transformed by Log2. The metabolites with VIP > 1, p < 0.05, log2FC ≥ 2 or log2FC ≤ 0.5 were selected as differential metabolites.

3. Results

3.1. The Effects of CFBT on Body Weight and Liver Weight

To investigate the efficiency of reducing blood lipids of CFBT on HFD-induced mice, male mice were given by HFD and treated with 247.5 mg/kg, 495.0 mg/kg and 990.0 mg/kg of CFBT for 30 consecutive days. After the experiment, the mice were weighed, and the organs were removed for weighing. A significant increase was observed in the body weight of mice fed with HFD and drank water (p < 0.01) (Figure 1A), indicating that the high-fat model mice were successfully constructed, which was dramatically different from the CK group and other experimental groups (p < 0.01) (Figure 1A). As shown in Figure 1B, the body weight gain in the NK group was 1.9-fold higher than that of CK group. Meanwhile, 30 days of treatment with low-, medium-, and high- dose CFBT or lipid-lowering drugs significantly controlled the weight gain of mice, which were significantly reduced by 29.6%, 39.2%, 50.8% and 41.7%, respectively, compared to the NK group. Similarly, there was an increase in the liver weight of mice exposed to the HFD, while the liver weight of mice in the CK group and other experimental groups was significantly lower than that of the NK group (p < 0.05) (Figure 1C). The results showed that CFBT and Xuezhikang capsule treatment were able to prevent the increase in body weight and liver weight in mice, and the effect of preventing weight gain was more obvious with the increase in dosage of CFBT.

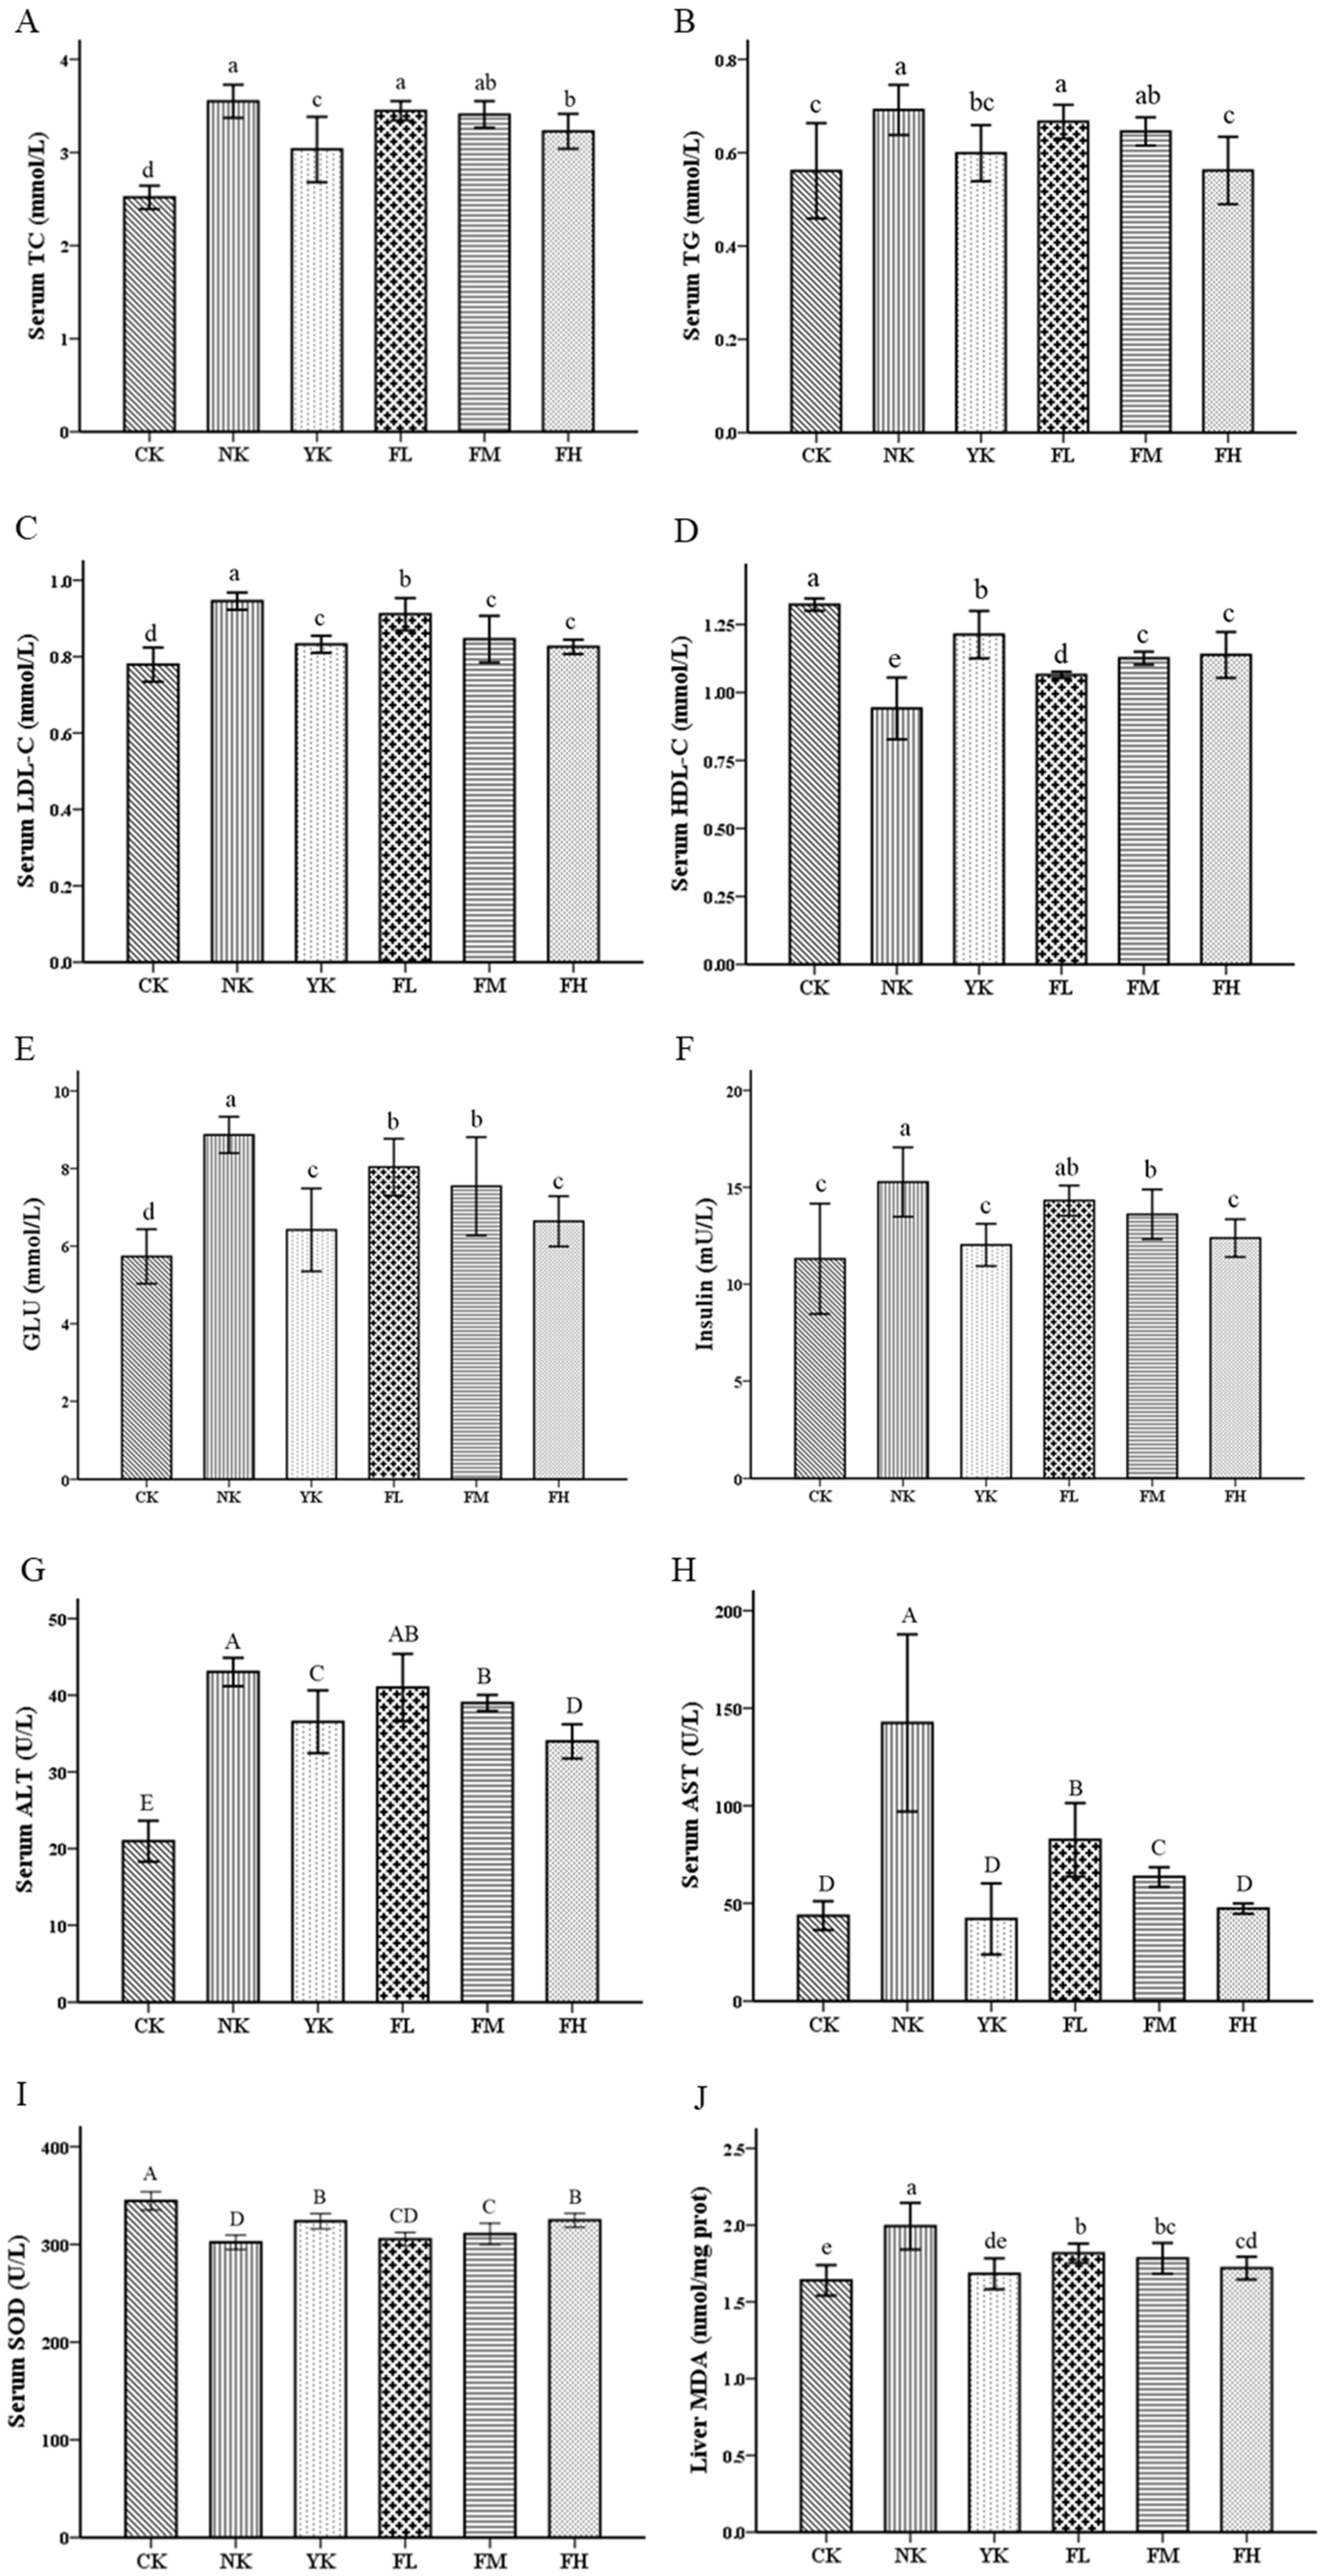
3.2. CFBT Improves Serum Biomarkers and Oxidative Stress

To evaluate the lipid profile, the serum samples of mice were analyzed. There was a significant increase in the levels of serum TC, TG and LDL-C in the NK group (p < 0.05) (Figure 2A–C), while the level of HDL-C was lower compared to CK group (p < 0.05) (Figure 2D). On the contrary, the levels of serum TC, TG and LDL-C of mice ingested with different dosages of CFBT were generally lower than those of the NK group, and the level of serum HDL-C increased to a significant level (p < 0.05) (Figure 2A–D). However, there was no significant difference in serum levels between YK group and each CFBT group, especially compared with the high-dose group, indicating that CFBT and Xuezhikang capsule treatment could effectively reduce serum lipids of mice fed with HFD. Regarding glucose and insulin levels, there was a marked increase, as expected, in the NK group when compared with the CK group (p < 0.05), while treatment with CFBT and Xuezhikang were able to prevent the increase in serum glucose and insulin (Figure 2E,F), again suggesting a potential antihyperlipidemic and antidiabetic effect.
When mice were exposed to HFD, the levels of serum ALT and AST in the NK group were significantly increased compared with the CK group, indicating that the long-term intake of HFD caused some damage to the normal liver function of mice (p < 0.01). The serum ALT and AST levels were compared between the groups that ingested CFBT and the group fed with HFD and mineral water; a marked reduction in the consumption of different doses of CFBT was observed (p < 0.01) (Figure 2G,H). Furthermore, the higher the dosage of CFBT consumed by mice, the more similarities in the level of ALT and AST were observed to that of CK group (Figure 2G,H). The same was found in the YK group (Figure 2G,H). It was suggested that CFBT and Xuezhikang treatment was able to prevent the increase in serum AST and ALT levels and effectively inhibit the adverse effects of HFD on the liver of mice.
After ingestion of HFD, the serum SOD activity of the liver of mice was significantly lower than that of the CK group (p < 0.01), which suggested that the consumption of HFD could cause the decrease in serum SOD in the liver of mice (Figure 2I). When mice were fed with CFBT and Xuezhikang, SOD levels showed a significantly increased trend (p < 0.01). Ingestion of HFD increased the level of serum MDA, which led to an increase inlipid peroxidation and oxidative damage. It was seen that the NK group had a marked increase in MDA level compared to the CK group (p < 0.05), whereas CFBT and Xuezhikang treatment prevented the increase in MDA level and alleviated the reaction of liver lipid oxidation (Figure 2J).

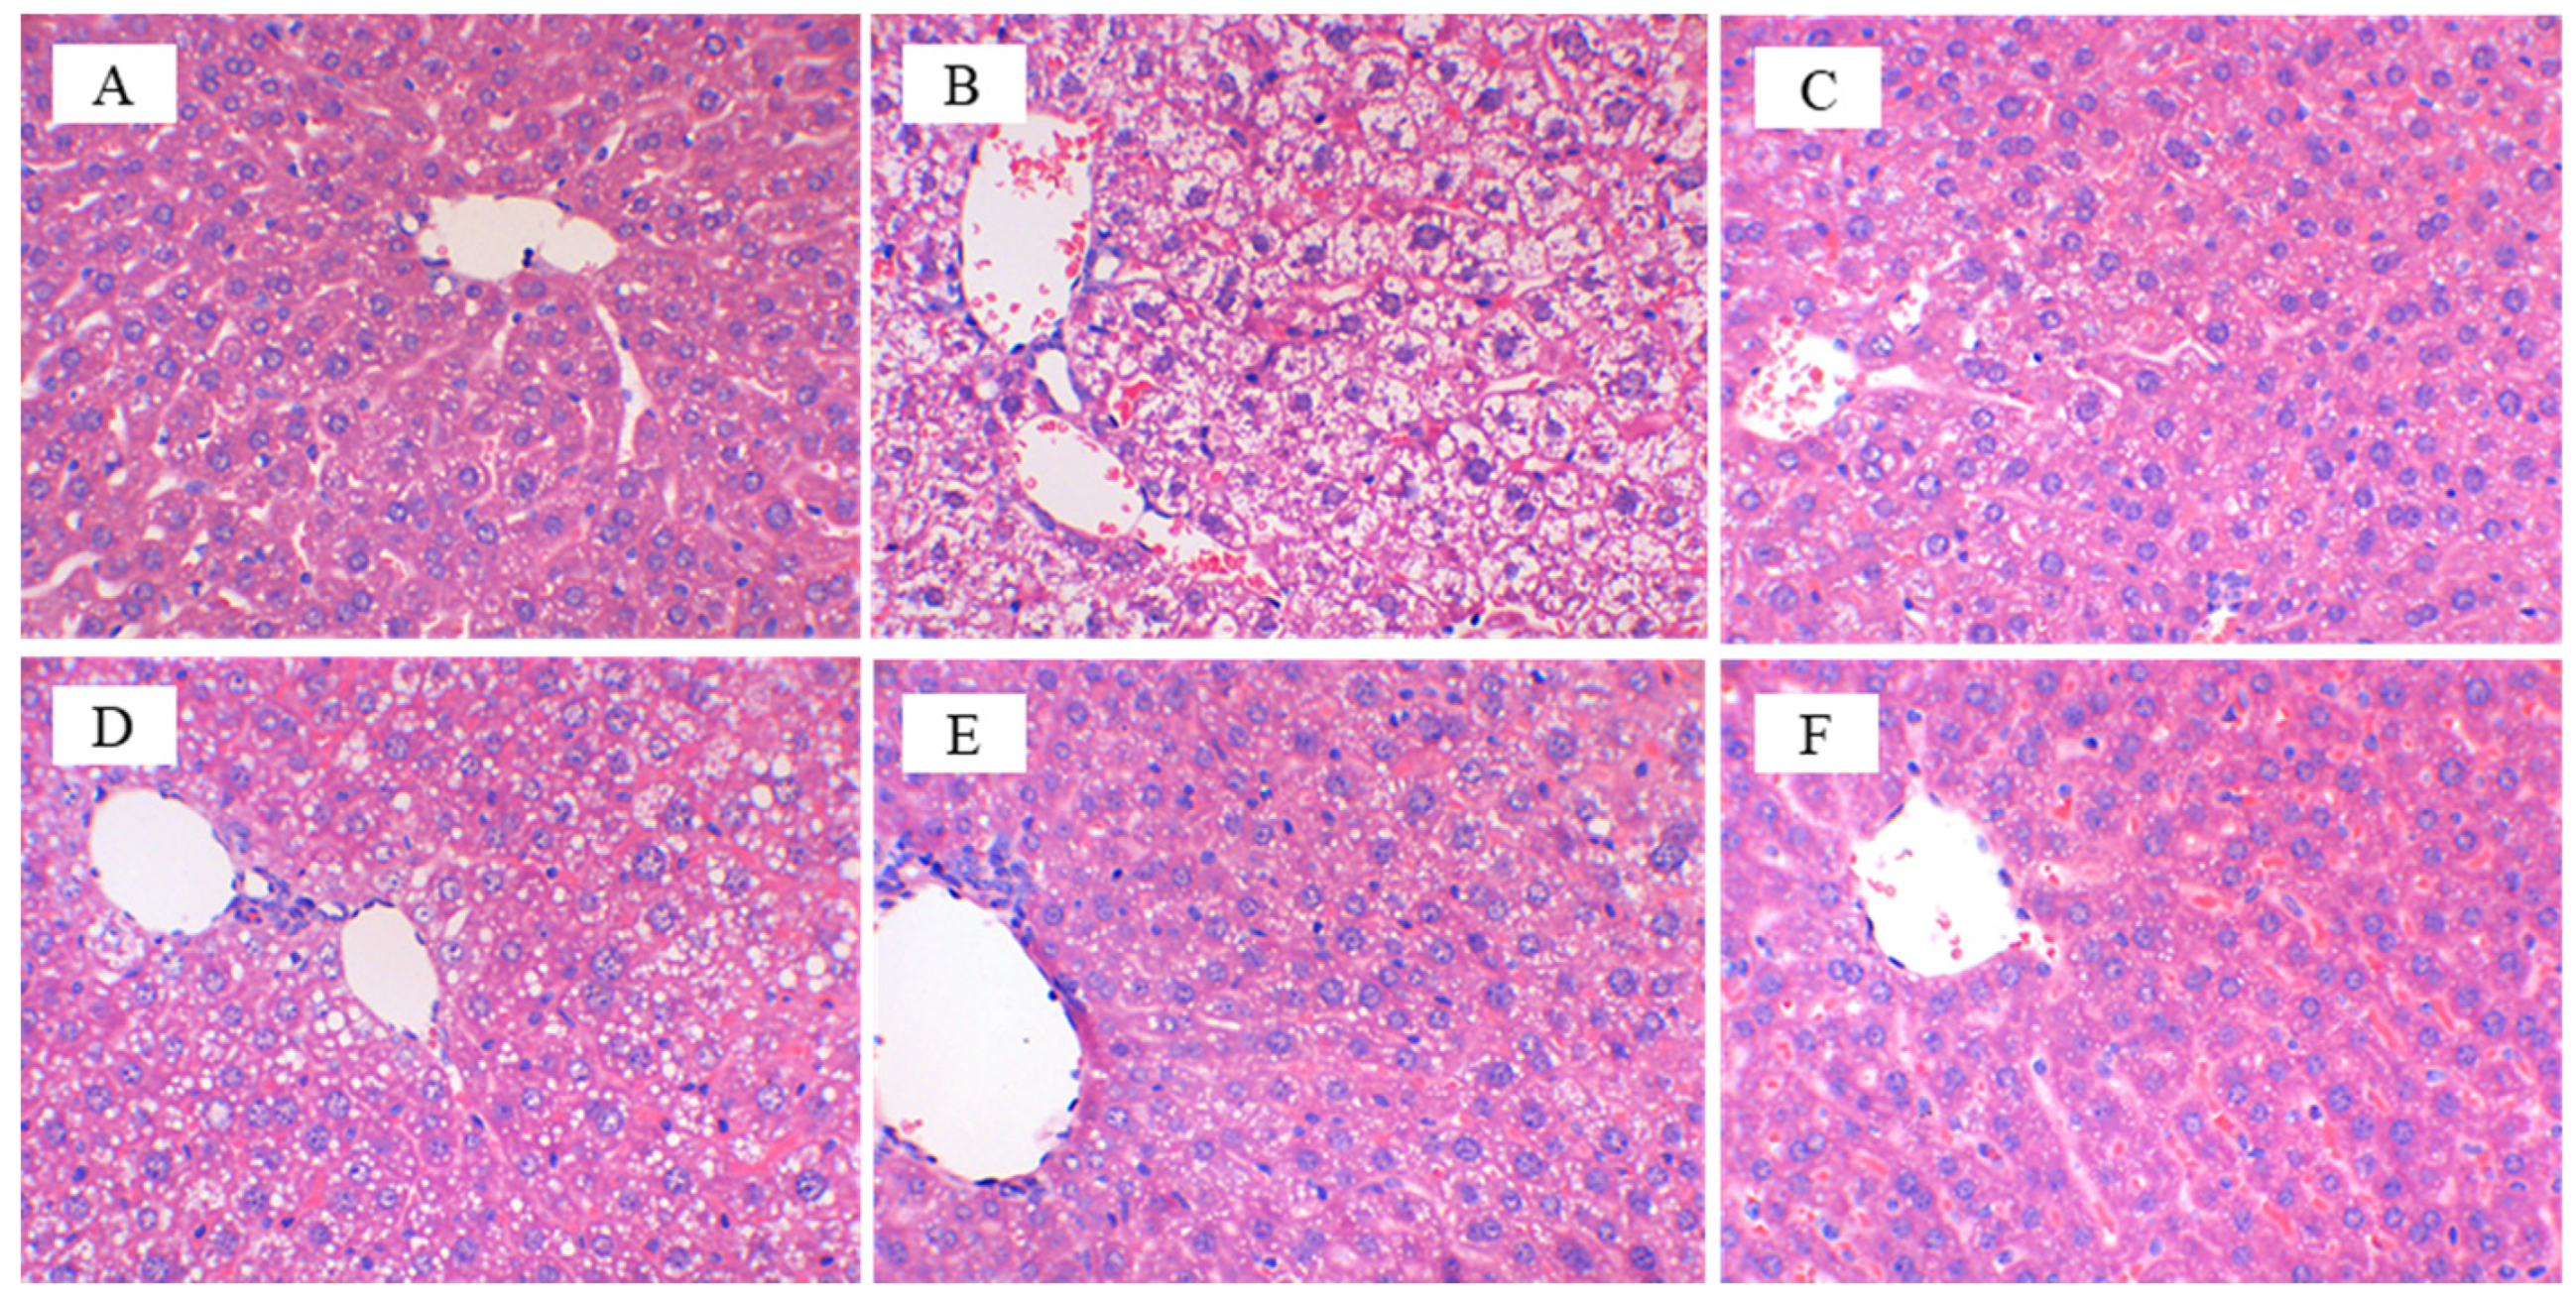
3.3. CFBT Prevents Liver Injury on HFD Mice

Morphological analyses of mice liver showed that mice that ingested only a normal diet and mineral water maintained a normal hepatocyte structure and size (Figure 3A), while in the NK group, which was exposed to HFD and mineral water, hepatocytes became larger and severe fatty lesions were present with the accumulation of lipid droplets in the cytoplasm (Figure 3B). When the mice received CFBT (Figure 3E,F), the morphology of hepatocytes was similar to that of the CK group; the lipid droplets did not assemble and the liver cells were normal, especially in the FH group. Similarly, this result was observed in the YK group fed with a positive drug Xuezhikang capsule (Figure 3C). We could conclude that the consumption of medium- and high-doses of CFBT and positive drugs had the ability to alleviate liver steatosis in mice and protect and restore the liver to a certain extent, but the effect of low-dose CFBT was not significantly obvious (Figure 3D).

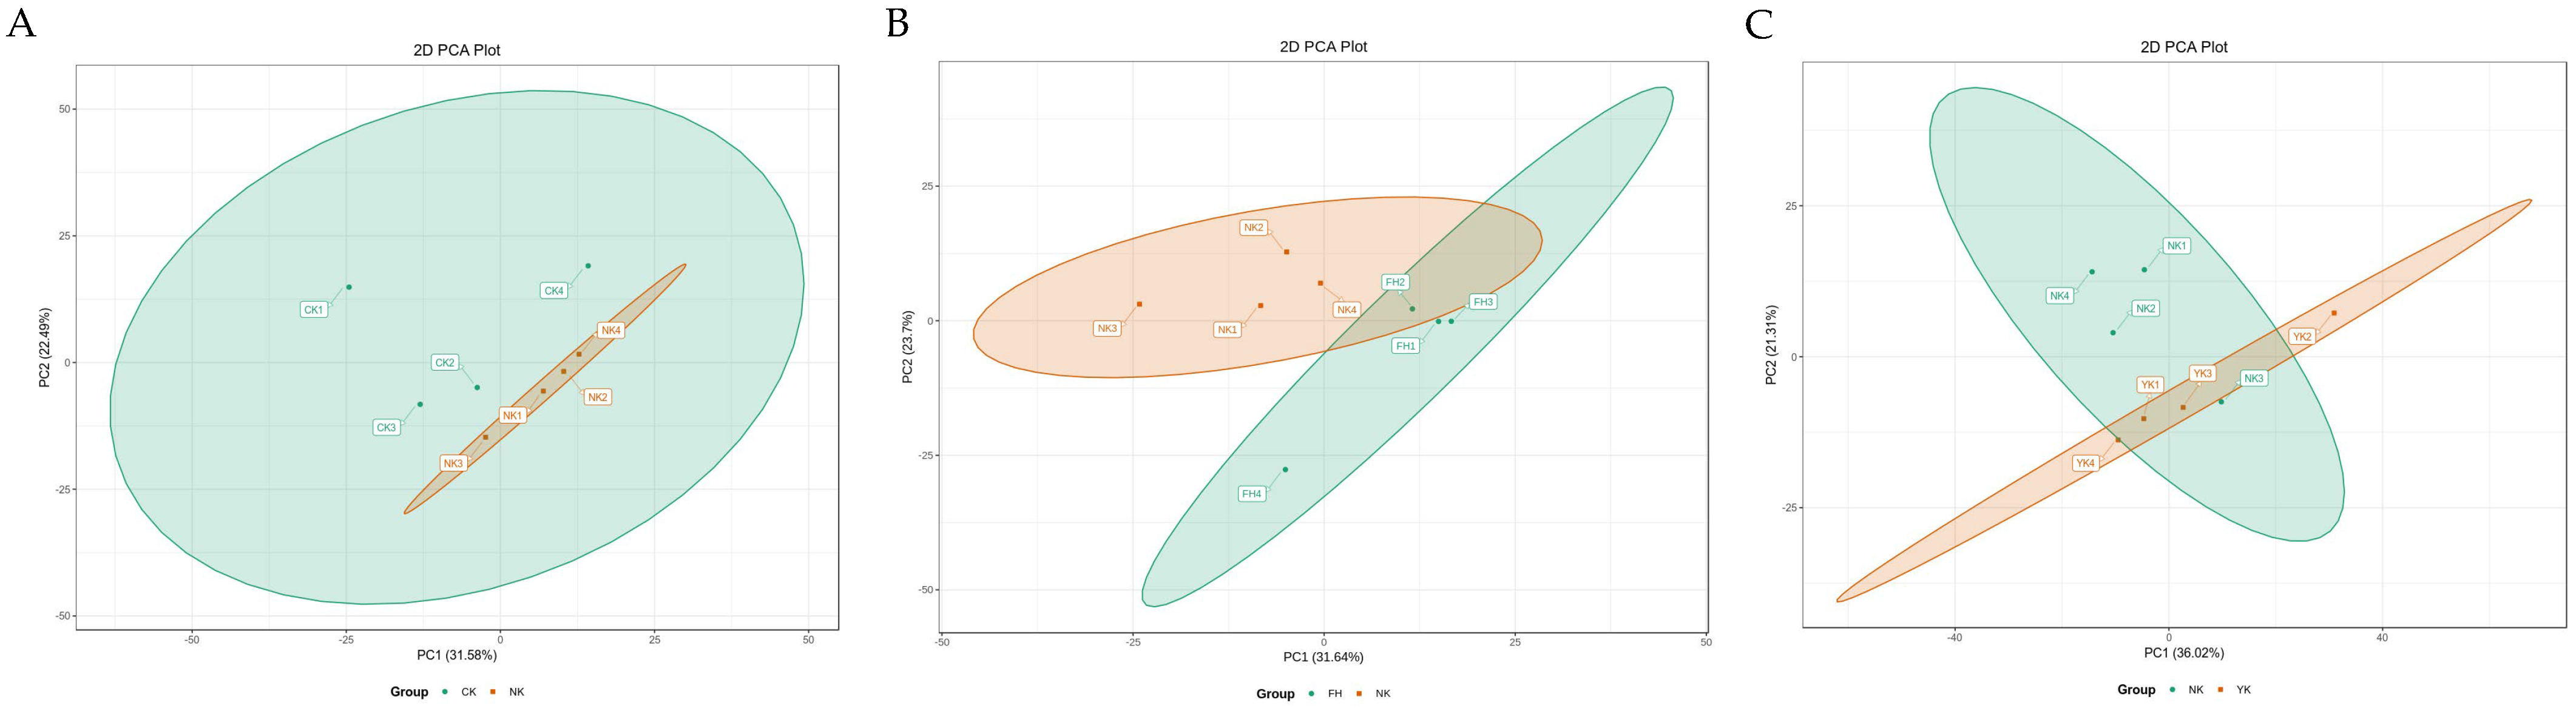
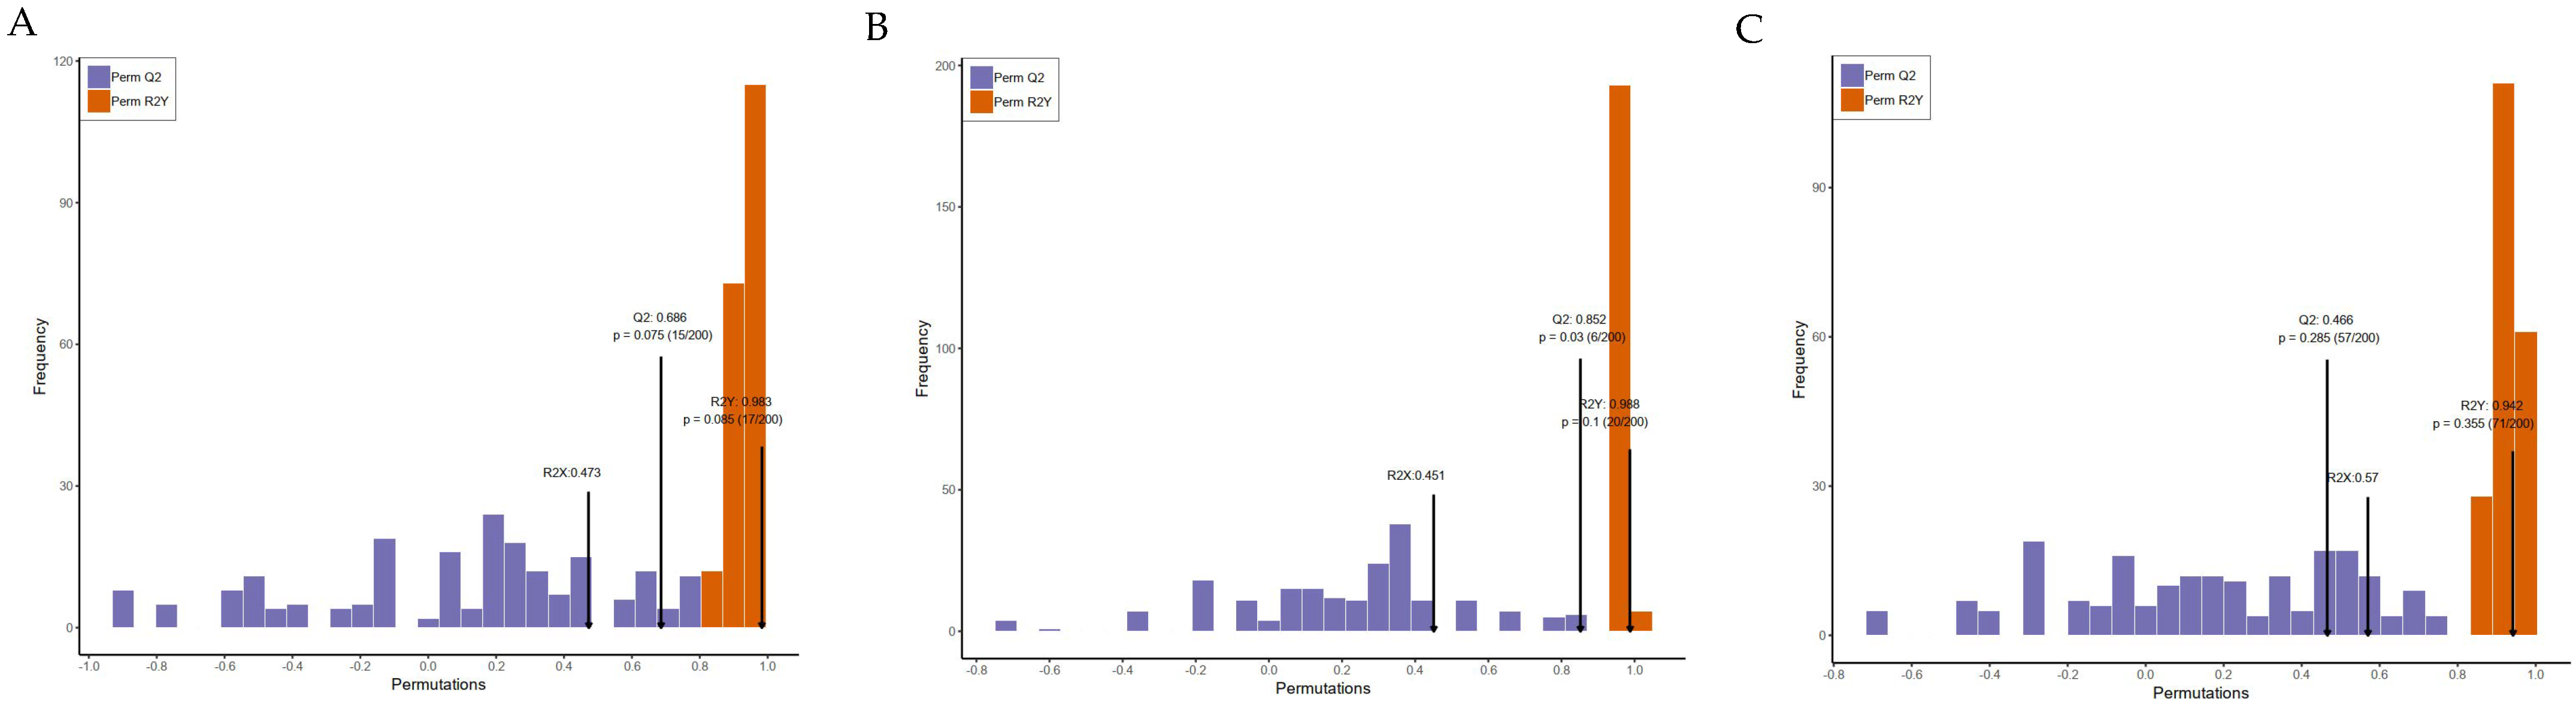
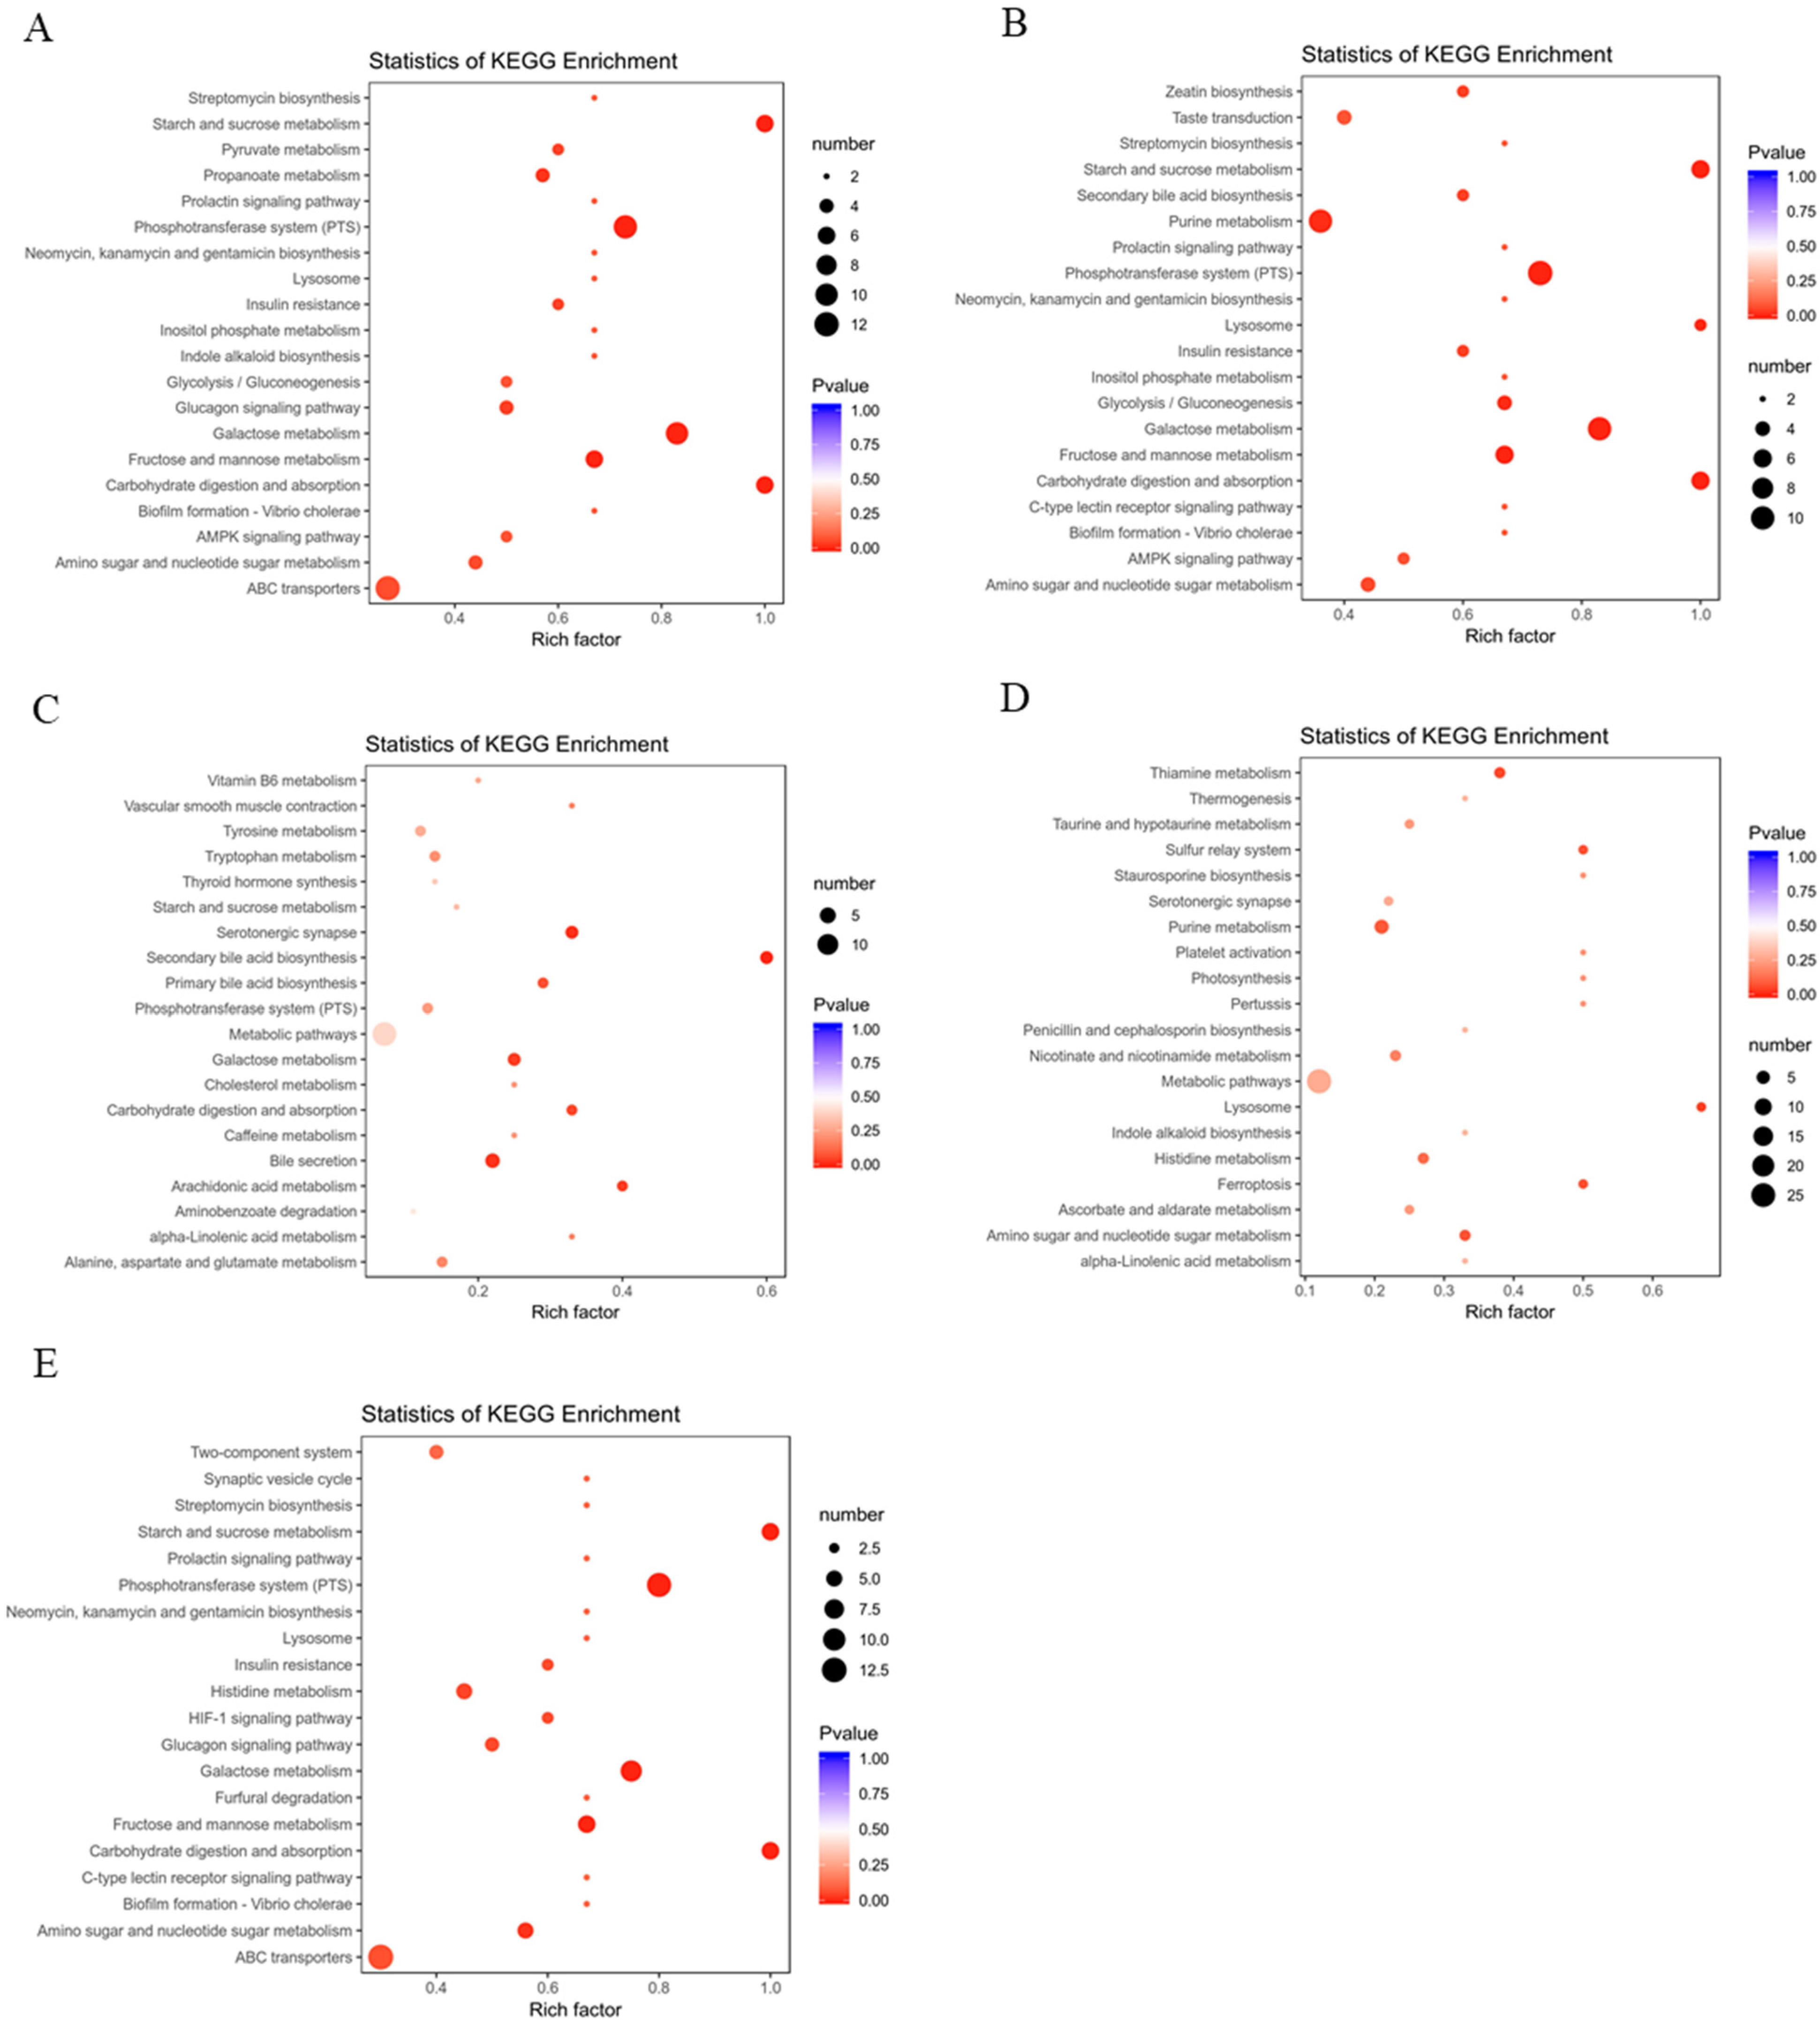
3.4. Metabolic Effects of CFBT on HFD Mice

Multivariate statistical analysis was used to “simplify and reduce the dimensionality” of high-dimensional and complex data on the basis of preserving the original information to the greatest extent, and a reliable mathematical model was established to summarize the characteristics of the metabolic spectrum of samples. Principal coordinate analysis (PCA) was used to evaluate the differences in the metabolites in each group. The PCA plot of samples showed the obvious separation between the CK group and NK group (Figure 4A), with 31.58% and 22.49% variation explained by the first two (PC1 and PC2) principal components, respectively, suggesting that the metabolic activities of mice induced by HFD in the NK group were systematically maladjusted compared with those in the CK group. FH and YK groups were divided into distinctive clusters with the NK group (Figure 4B,C), indicating that CFBT and Xuezhikang treatment were able to regulate metabolic disorders in the liver of mice induced by HFD.
Orthogonal partial least squares discriminant analysis (OPLS-DA) of potential structures was conducted to reveal detailed and statistically significant changes in metabolites caused a by high-fat diet and related to treatment. The OPLS-DA model further showed that the R2 and Q2 parameters of each group were relatively high with good predictive ability and reliability (Figure 5), which was able to manifest the change trend in metabolites among groups. Subsequently, variable importance projection (VIP) of the obtained multivariate analysis OPLS-DA model was used for preliminary analysis and screening of differential metabolites. Simultaneously, the differential metabolites could be further screened by combining the p-value or fold change in univariate analysis. A total of 602 metabolites were identified in the liver tissue of mice by using the widely targeted metabolomics technique (Table 2).
Compared with the CK group, the most important metabolites identified in the NK group to be up-regulated were taurodeoxycholic acid sodium salt and taurochenodesoxycholic acid, D-sorbitol, D-fructose, D-galactose, D-glucose, D-mannose, D-trehalose, D-glucose 6-phosphate, D-sedoheptuiose 7-phosphate, D-fructose 6-phosphate-disodium salt, N-Acetylglucosamine 1-phosphate, lysopg 18:1, lysope 18:1 and lysopc 20:2. The significantly down-regulated metabolites observed in the NK group were octadecatrienoic acid, eicosapentaenoic acid, eicosatetraenoic acid, Docosahexaenoic acid, 12-Hydroxyeicosane tetraenoic acid, and Punicic acid, etc., which were mainly enriched in the pathways of starch and sucrose metabolism, phosphotransferase system (PTS), pyruvate metabolism, galactose metabolism, carbohydrate digestion and absorption, and fructose and mannose metabolism (Figure 6A). In NK vs. FH group, we found that tauroursodeoxycholic acid, taurochenodesoxycholic acid, glycoursodeoxycholic acid, D-sorbitol, D-fructose, D-galactose, D-glucose, D-mannose, D-sucrose, and D-trehalose, etc. were significantly down-regulated and most chemical compounds in the the FH group: eicosapentaenoic acid, eicosatetraenoic acid, docosahexaenoic acid, and 12-hydroxyeicosane tetraenoic acid, were significantly up-regulated compared to the NK group, which were annotated in the pathways of starch and sucrose metabolism, PTS, galactose metabolism, fructose and mannose metabolism, carbohydrate digestion and absorption and AMPK signaling pathway (Figure 6B). Moreover, it showed that the positive drug Xuezhikang capsule was able to reduce hyodeoxycholic acid, glycocholic acid, deoxycholic acid, chenodeoxycholic acid, taurodeoxycholic acid sodium salt, which were enriched in primary and secondary bile acid biosynthesis, galactose metabolism, carbohydrate digestion and absorption, and bile secretion; interestingly, the increased content of D-sucrose, dulcitol, maltotriose and the decreased content of thromboxane B2, prostaglandin D2, eicosapentaenoic acid, eicosatetraenoic acid, eicosatrienoic acid, docosahexaenoic acid in pathways of glucose metabolism and arachidonic acid metabolism compared to the NK group (Figure 6C). In CK vs. FH group, the FH group showed the higher D-fructose 6-phosphate-disodium salt, D-fructose-1,6-biphos-phate-trisodium salt, 3′-sialyllactose, hydroxyphenyllactic acid, D-mannose 6-phosphate, D-fructose 6-phosphate, N-acetylglucosamine 1-phosphate, 3′-sialyllactose, galactaric acid, D-mannose 6-phosphate, lactobionic acid, maltotriose, N-Acetyl-D-glucosamine, raffinose, D(-)-threose, docosahexaenoic acid, Cis-11,14-eicosadienoic acid (C20:2) and the lower taurodeoxycholic, D-sucrose, formononetin, lactose, eicosapentaenoic acid, eicosatetraenoic acid, stearidonic acid, 2-methylbutyroylcarnitine in the pathways of purine metabolism, amino sugar and nucleotide sugar metabolism, and ascorbate and aldarate metabolism compared to the CK group (Figure 6D). In CK vs. YK group, the mice in YK group had the lower hyodeoxycholic acid, glycocholic acid, deoxycholic acid, chenodeoxycholic acid, chenodeoxycholic acid, L-fucose, L-rhamnose, formononetin, thromboxane B2, prostaglandin D2, eicosapentaenoic acid, eicosatetraenoic acid, eicosatrienoic acid, 3-methylglutaric acid, tetradecanedioic acid and the higher D-sorbitol, D-fructose, D-galactose, D-glucose, lactobionic acid, etc., which were annotated into the metabolic pathways of phosphotransferase system, starch and sucrose metabolism, galactose metabolism, fructose and mannose metabolism, carbohydrate digestion and absorption, amino sugar and nucleotide sugar metabolism and ABC transporters (Figure 6E).

4. Discussion

Obesity is characterized by the increased storage of triglycerides in expanded adipose tissue and is the result of an imbalance between energy intake and energy consumption. Generally, obesity is associated with many risk factors, such as hyperlipidemia, hypertension, cardiovascular disease, type-2 diabetes mellitus and insulin resistance [40,41,42]. CFBT, a folk Chinese medicine formula, has been widely applied by local people to lose weight, but its remedial mechanisms are still not well defined. The clinical trial of CFBT is the research plan we will pursue in the future. However, CFBT is just a health care medicine, which may involve a long therapeutic cycle, and the curative effect in clinic may not be as effective as that in animal experiments. In addition, another limitation of this study, in respect to clinical application, is the need to involve large-scale volunteers who we could not find in a short time. Therefore, we investigated the anti-obesity and hypolipidemic effects of CFBT on hyperlipidemic mice to determine whether CFBT could reverse dyslipidemia and metabolic abnormalities induced by HFD. Our results clearly illustrated that CFBT prevented body weight gain in mice and it is believed that it would also reduce the accumulation of fat in the body. In particular, a high dose of CFBT could significantly suppress the body weight in obese mice after a month of treatment. A study on the anti-obesity effect of Fuzhuan brick tea also showed that ingestion of Fuzhuan brick tea could reduce HFD-induced obesity significantly [43]; it was similar to this study. Clinically, four plasma lipid indexes are detected to diagnose hyperlipidemia, which is usually accompanied by an increase in the level of TC, TG, LDL and a decrease in HDL level. Many studies on the relationship between serum lipid and lipoprotein levels, atherosclerosis and coronary heart disease have been reported [44,45]. Our data demonstrated that CFBT or Xuezhikang treatment was attributed to effectively improve the balance of blood lipid, reduce the content of TC, TG and LDL in serum, and increase the content of HDL when compared with their counterparts. Similar results were found in Pu’er tea [46], a kind of dark tea, and active components of tea [47]. In terms of glucose concentration and insulin level, the mice that were submitted to an HFD presented a significant increase compared to the mice treated with a normal diet; whereas, the levels of blood glucose and insulin were decreased after all CFBT administration, indicating that CFBT treatment may maintain blood lipid homeostasis responsible for glucose and lipid metabolism via an antihyperlipidemic action.
In addition, the effects of CFBT treatment on liver physiological and biochemical indexes of mice fed with HFD were also investigated. Previous studies have shown that Fuzhuan brick tea can prevent liver steatosis and liver injury induced by HFD [48]. In our study, the liver weight of the NK group was significantly higher than that of the CK group, which was due to the hepatomegaly caused by HFD. After intragastric administration of different doses of CFBT or Xuezhikang, the liver weight of mice decreased, and the symptoms of liver enlargement and pathological changes were alleviated. From the macroscopic and microscopic observation, the liver of the NK group showed severe fatty lesions, while the liver lesions of mice were improved after different doses of CFBT treatment. It is well known that the level of ALT and AST is positively correlated with the degree of liver abnormality [49,50]. In the clinic, the value of AST/ALT is commonly used to reflect the damage of liver cells. Our results suggested that the serum levels of AST, ALT and the ratio of AST/ALT of HFD-induced mice were significantly higher than that of healthy mice, which indicated that ingestion of HFD could affect the liver function of normal mice and cause serious damage to liver cells. CFBT-treated mice displayed significantly lower serum levels of ALT and AST, indicating that CFBT could protect and restore liver cells. We also found that consumption of HFD could reduce SOD activity, exacerbate liver lipid oxidation and increase MDA content, while CFBT or Xuezhikang treatment was able to increase the activity of SOD and decrease the level of MDA. A similar study reported that the extract of Fuzhuan brick tea contributed to antioxidant activity and may also directly act as instant tea products [51]. Therefore, CFBT could be considered as an effective antioxidant to benefit health.
The metabolome in mice induced by HFD were further evaluated and it was found that the metabolism of phospholipids, fatty acids, bile acids, and glycolipids in hyperlipidemia mice was significantly disturbed. Lysophospholipid is a compound that catalyzes the fatty acid hydrolysis of phospholipid molecules by phospholipase A, which can be used as a clinical diagnostic indicator to reveal pathophysiological changes. In our study, LysoPG (18:1), LysoPE (18:1) and LysoPA (18:0) in liver tissue of hyperlipidemic mice submitted to HFD in the NK group were significantly increased compared to the CK group. Previous studies related to metabolomics have been demonstrated that significantly increased plasma. LysoPC (16:0), lysoPC (18:0), lysoPC (18:1) and lysoPC (22:5) were identified in the rat model of atherosclerosis induced by HFD [52,53], which were consistent with the results of our study. Some altered Lysophospholipids in mice that received HFD were significantly correlated with the pathogenesis of hyperlipidemia and could be recognized as potential biomarkers, while there was a complex interaction between blood lipid levels and Lysophospholipids [54]. In combination with conventional biochemical indexes of blood lipids, lysophospholipids such as lysoPG (18:1), lysoPE (18:1) and lysoPA (18:0) showed a significant positive correlation with body weight gain, liver weight and serum level of TC, TG, LDL, AST, ALT and MDA, which were accompanied by negative correlations to the serum level of HDL and SOD.
Bile acids have recently been reported to play an important role in regulating lipid metabolism and energy metabolism of the host as a signal molecule [55], contributing to lipid digestion and absorption, affecting the secretion of bile and regulating the level of cholesterol [56]. Evidently, the content of total bile acid in serum of hyperlipidemia population was positively correlated with the levels of TC and TG [57], which was consistent with the increased serum TC and TG levels in mice exposed to HFD were accompanied by the significantly increased hepatic bile acid metabolites, taurodeoxycholic acid sodium salt (TDCAS) and taurochenoxycholic acid (TCDCA), in our findings. CFBT treatment was able to decrease tauroursodeoxycholic acid (TUDCA), TCDCA and glycooursodeoxycholic acid (GUDCA), while Xuezhikang reduced hyodeoxycholic acid (HDCA), glycocholic acid (GCA), deoxycholic acid (DCA) and chenodeoxycholic acid (CDCA). Consequently, CFBT and Xuezhikang accelerated the absorption and metabolism of bile acids to lipids.
The phosphotransferase system (PTS) is involved in the transport of many sugars to bacteria, such as glucose, mannose, fructose and cellobiose [58]. Our results suggested that most of the increased carbohydrate metabolites (e.g., D-fructose, D-galactose, D-glucose, D-mannose, D- glucose 6-phosphate, L-erythrulose, etc.) in the liver of mice that consumed HFD were in the metabolic pathways of galactose, starch, sucrose, fructose and mannose, while CFBT and Xuezhikang treatment depressed carbohydrate digestion and absorption. Fatty acids were capable of inhibiting the oxidation of HDL-C and enhance the anti-atherosclerotic function of HDL-C [59]. Docosahexaenoic acid (DHA) and eicosapentaenoic acid (EPA) were able to act together with eicosatetraenoic acid (12-HETE) to produce anti-inflammatory molecules such as lipoxin. The balance between these antagonistic compounds determined the development process of chronic inflammatory diseases, including hyperlipidemia, diabetes and atherosclerosis [60]. The significantly decreased levels of EPA, DHA and 12-HETE in the NK group, as was observed in this study, broke the dynamic balance between compounds, resulting in hyperlipidemia, atherosclerosis, as well as cardiovascular and cerebrovascular diseases. Consumption of CFBT increased the levels of these metabolites and inhibited the occurrence of related diseases such as hyperlipidemia; however, Xuezhikang treatment was not responsible for the similar effects on these metabolites as CFBT treatment.

5. Conclusions

In summary, this study revealed the effects of CFBT exposure on serum biochemical indexes and liver metabolism in mice induced by HFD. Significant biochemical indexes and histological changes related to dyslipidemia and oxidative stress were observed in the conventional serum of hyperlipidemic mice exposed to CFBT. Significant alterations in the liver metabolic profiles were observed to be attributed to CFBT treatment, most of which were related to liver inflammation and lipid metabolism. These results showed that CFBT consumption had the ability to reduce lipid digestion, restore dyslipidemia and liver injury, as well as regulate the metabolic level caused by a high-fat diet. Therefore, our findings highlight the latent health risk of CFBT exposure to hyperlipidemia and provide insights for further investigations into its metabolic mechanism.

Author Contributions

Methodology, writing of the original draft, reviewing, and editing, X.Z. (Xiaolu Zhou); Software, and formal analysis, B.G.; Supervision, and validation, X.Z. (Xuwen Zhang); Funding acquisition, and project administration, K.W.; Investigation, and data curation, C.Z.; Project administration, and resources, D.F. All authors have read and agreed to the published version of the manuscript.

Funding

This work was supported by grants from Changsha Science and Technology Bureau Project (kq1706109) and The Key R&D Program of Hunan Province (2020WK2017).

Institutional Review Board Statement

All procedures were carried out in strict accordance with the laboratory animal care and guidelines for use of Hunan Agricultural University, and this experiment was approved by the animal experiment ethics committee of Hunan Agricultural University (Changsha, China).

Data Availability Statement

The data that support the findings of this study are available from the corresponding author upon reasonable request.

Conflicts of Interest

The authors declare that there are no known conflict of interest or personal relationships that could have appeared to influence the work reported in this paper.

References

  1. Marie, N.; Tom, F.; Margaret, R.; Blake, T.; Nicholas, G.; Christopher, M.; Erin, C.M.; Stan, B.; Cristiana, A.; Semaw, F.A.; et al. Global, regional, and national prevalence of overweight and obesity in children and adults during 1980–2013: A systematic analysis for the Global Burden of Disease Study 2013. Lancet 2014, 384, 766–781. [Google Scholar]
  2. Lee, S.J.; Joo, Y.J.; Kim, R.Y.; Hwang, J.; Lim, S.M.; Yoon, S.J.; Kim, J.Y. Obesity May Connect Insulin Resistance to Decreased Neuronal Viability in Human Diabetic Brain. Obesity 2020, 28, 1626–1630. [Google Scholar] [CrossRef]
  3. Afshin, A.; Forouzanfar, M.H.; Reitsma, M.B.; Sur, P.; Estep, K.; Lee, A.; Marczak, L.; Mokdad, A.H.; Moradi-Lakeh, M.; Naghavi, M.; et al. Health Effects of Overweight and Obesity in 195 Countries over 25 Years. N. Engl. J. Med. 2017, 377, 13–27. [Google Scholar] [PubMed]
  4. Swinburn, B.A.; Gary, S.; Kevin, D.H.; Klim, M.; Diane, T.F.; Marjory, L.M.; Steven, L.G. The global obesity pandemic: Shaped by global drivers and local environments. Lancet 2011, 378, 804–814. [Google Scholar] [CrossRef]
  5. Popkin, B.M.; Adair, L.S.; Ng, S.W. Global nutrition transition and the pandemic of obesity in developing countries. Nutr. Rev. 2012, 70, 3–21. [Google Scholar] [CrossRef] [Green Version]
  6. Ivo, P.; Andreea, D.; Michaela, S.; Barak, Z.; Beata, W.K.; Lubomira, F.; Hrvoje, P.; Ian, B.; Reneta, P. Clinical Management of High and Very High Risk Patients with Hyperlipidaemia in Central and Eastern Europe: An Observational Study. Adv. Ther. 2019, 36, 608–620. [Google Scholar]
  7. Vengerovskii, A.I.; Yakimova, T.V.; Nasanova, O.N. Influence of medicinal plant extracts on the functions and antioxidant protection of erythrocytes in rats with experimental diabetes mellitus. Eksp. Klin. Farmakol. 2016, 79, 29–33. [Google Scholar]
  8. Danielle, T.; Sunelle, R.; Namrita, L. A review on traditionally used South African medicinal plants, their secondary metabolites and their potential development into anticancer agents. J. Ethnopharmacol. 2020, 261, 113101. [Google Scholar]
  9. Zheng, J.P.; Zhang, J.; Guo, Y.L.; Cui, H.R.; Lin, A.Z.; Hu, B.F.; Gao, Q.H.; Chen, Y.Z.; Liu, H.T. Improvement on metabolic syndrome in high fat diet-induced obese mice through modulation of gut microbiota by sangguayin decoction. J. Ethnopharmacol. 2020, 246, 112225. [Google Scholar] [CrossRef]
  10. Meng, X.H.; Li, N.; Zhu, H.T.; Wang, D.; Yang, C.R.; Zhang, Y.J. Plant Resources, Chemical Constituents, and Bioactivities of Tea Plants from the Genus Camellia Section Thea. J. Agric. Food Chem. 2019, 67, 5318–5349. [Google Scholar] [CrossRef]
  11. Wang, Y.J.; Kan, Z.P.; Thompson, H.J.; Ling, T.J.; Ho, C.T.; Li, D.X.; Wan, X.C. Impact of Six Typical Processing Methods on the Chemical Composition of Tea Leaves Using a Single Camellia sinensis Cultivar, Longjing 43. J. Agric. Food Chem. 2019, 67, 5423–5436. [Google Scholar] [CrossRef] [PubMed]
  12. Lee, P.S.; Nagabhushanam, K.; Ho, C.T.; Pan, M.H. Green tea changes serum and liver metabolomic profiles in mice with high-fat diet-induced obesity. Mol. Nutr. Food Res. 2015, 59, 784–794. [Google Scholar] [CrossRef]
  13. Kuo, K.L.; Weng, M.S.; Chiang, C.T.; Tsai, Y.J.; Lin-Shiau, S.Y.; Lin, J.K. Comparative studies on the hypolipidemic and growth suppressive effects of oolong, black, pu-erh, and green tea leaves in rats. J. Agric. Food Chem. 2005, 53, 480–489. [Google Scholar] [CrossRef] [PubMed]
  14. Lee, M.; Kim, C.; Kim, Y. Green Tea (–)-Epigallocatechin-3-Gallate Reduces Body Weight with Regulation of Multiple Genes Expression in Adipose Tissue of Diet-Induced Obese Mice. Ann. Nutr. Metab. 2009, 54, 151–157. [Google Scholar] [CrossRef] [PubMed]
  15. Chantre, P.; Lairon, D. Recent findings of green tea extract AR25 (Exolise) and its activity for the treatment of obesity. Phytomedicine 2002, 9, 3–8. [Google Scholar] [CrossRef] [PubMed]
  16. Eva, M.R.K.; Manuela, P.G.M.L.; Ilse, N.; Margriet, S.W.P. Effects of green tea on weight maintenance after body-weight loss. Br. J. Nutr. 2004, 91, 431–437. [Google Scholar]
  17. Margriet, S.W.P.; Manuela, P.G.M.L.; Eva, M.R.K. Body weight loss and weight maintenance in relation to habitual caffeine intake and green tea supplementation. Obes. Res. 2005, 13, 1195–1204. [Google Scholar]
  18. Mohamed, H.H.; Chahira, S.; Karima, D.; Sami, F.; Robert, D.; Maude, L.G.; André, B. Tea decoctions prevent body weight gain in rats fed high-fat diet; black tea being more efficient than green tea. J. Nutr. Int. Metab. 2016, 6, 33–40. [Google Scholar]
  19. Zhu, J.; Cai, R.T.; Tan, Y.X.; Wu, X.Q.; Wen, Q.; Liu, Z.H.; Ouyang, S.H.; Yin, Z.N.; Yang, H.W. Preventive consumption of green tea modifies the gut microbiota and provides persistent protection from high-fat diet-induced obesity. J. Funct. Foods 2020, 64, 103621. [Google Scholar] [CrossRef]
  20. Li, Q.; Lai, X.; Sun, L.; Cao, J.; Ling, C.; Zhang, W. Antiobesity and anti-inflammation effects of Hakka stir-fried tea of different storage years on high-fat diet-induced obese mice model via activating the AMPK/ACC/CPT1 pathway. Food Nutr. Res. 2020, 64, 1–13. [Google Scholar] [CrossRef]
  21. Bae, U.J.; John, P.; Woon, P.I.; Chae, B.M.; Oh, M.R.; Jung, S.J.; Ryu, G.S.; Chae, S.W.; Park, B.H. Epigallocatechin-3-Gallate-Rich Green Tea Extract Ameliorates Fatty Liver and Weight Gain in Mice Fed a High Fat Diet by Activating the Sirtuin 1 and AMP Activating Protein Kinase Pathway. Am. J. Chin. Med. 2018, 46, 617–632. [Google Scholar] [CrossRef] [PubMed]
  22. Satoshi, U.; Yoshimasa, T.; Akiko, S.; Aruto, Y.; Hiroaki, Y. Prevention of diet-induced obesity by dietary black tea polyphenols extract in vitro and in vivo. Nutrition 2010, 27, 287–292. [Google Scholar]
  23. Tong, T.T.; Ren, N.; Soomi, P.; Wu, J.F.; Guo, N.; Kang, H.; Kim, E.; Wu, Y.Y.; He, P.M.; Tu, Y.Y.; et al. Theaflavins Improve Insulin Sensitivity through Regulating Mitochondrial Biosynthesis in Palmitic Acid-Induced HepG2 Cells. Molecules 2018, 23, 3382. [Google Scholar] [CrossRef] [PubMed] [Green Version]
  24. Yung, L.M.; Leung, F.P.; Wong, W.T.; Tian, X.Y.; Yung, L.H.; Chen, Z.Y.; Yao, X.Q.; Huang, Y. Tea polyphenols benefit vascular function. Inflammopharmacology 2008, 16, 230–234. [Google Scholar] [CrossRef] [PubMed]
  25. Tung, Y.C.; Hsieh, T.H.; Yang, M.J.; Hung, W.L.; Ho, C.T.; Pan, M.H. The effects of the extract of oolong tea and its metabolites from Andraca theae in high fat diet induced obese Wistar rat. Food Sci. Hum. Welln. 2018, 7, 120–124. [Google Scholar]
  26. Lin, J.K.; Lin-Shiau, S.Y. Mechanisms of hypolipidemic and anti-obesity effects of tea and tea polyphenols. Mol. Nutr. Food Res. 2006, 50, 211–217. [Google Scholar] [CrossRef] [PubMed]
  27. Chen, N.; Rebecca, B.; Edward, H.; Paul, A.L.; David, C.S.; Michael, L.M.; Markandeya, J.; Andrew, J.S.; Denovan, P.B.; John, D.W.; et al. Green tea, black tea, and epigallocatechin modify body composition, improve glucose tolerance, and differentially alter metabolic gene expression in rats fed a high-fat diet. Nutr. Res. 2009, 29, 784–793. [Google Scholar] [CrossRef]
  28. Chung, M.Y.; Hea, J.P.; Jose, E.M.; Sung, I.K.; Richard, S.B. Green tea extract protects against nonalcoholic steatohepatitis in ob/ob mice by decreasing oxidative and nitrative stress responses induced by proinflammatory enzymes. J. Nutr. Biochem. 2012, 23, 361–367. [Google Scholar] [CrossRef] [Green Version]
  29. Marina, V.B.; Adriane, G.R.; Isabella, C.C.; Lycia, B.G.; Samuel, S.V.; Manuella, L. Mate tea reduces high fat diet-induced liver and metabolic disorders in mice. Biomed. Pharmacother 2019, 109, 1547–1555. [Google Scholar]
  30. Monique, C.; Du, T.L.; Ilse, D.P. Metabolomics describes previously unknown toxicity mechanisms of isoniazid and rifampicin. Toxicol. Lett. 2020, 322, 104–110. [Google Scholar]
  31. Htun, K.T.; Pan, J.; Pasanta, D.; Tungjai, M.; Udomtanakunchai, C.; Chancharunee, S.; Kaewjaeng, S.; Kim, H.J.; Kaewkhao, J.; Kothan, S.; et al. Identification of Metabolic Phenotypes in Young Adults with Obesity by 1H NMR Metabolomics of Blood Serum. Life 2021, 11, 574. [Google Scholar] [CrossRef] [PubMed]
  32. Preter, V.D. Metabonomics and systems biology. Methods Mol. Biol. 2015, 1277, 245–255. [Google Scholar] [PubMed]
  33. Li, Q.; Li, Y.D.; Luo, Y.; Xiao, L.Z.; Wang, K.B.; Huang, J.A.; Liu, Z.H. Characterization of the key aroma compounds and microorganisms during the manufacturing process of Fu brick tea. Food Sci. Technol. 2020, 127, 109355. [Google Scholar] [CrossRef]
  34. Xiao, Y.; Zhong, K.; Bai, J.R.; Wu, Y.P.; Gao, H. Insight into effects of isolated Eurotium cristatum from Pingwu Fuzhuan brick tea on the fermentation process and quality characteristics of Fuzhuan brick tea. J. Sci. Food Agric. 2020, 100, 3598–3607. [Google Scholar] [CrossRef]
  35. Zhu, M.Z.; Li, N.; Zhou, F.; Ouyang, J.; Lu, D.M.; Xu, W.; Li, J.; Lin, H.Y.; Zhang, Z.; Xiao, J.B.; et al. Microbial bioconversion of the chemical components in dark tea. Food Chem. 2020, 312, 126043. [Google Scholar] [CrossRef]
  36. Xu, J.; Hu, F.; Wang, W.; Wan, X.; Bao, G. Investigation on biochemical compositional changes during the microbial fermentation process of Fu brick tea by LC–MS based metabolomics. Food Chem. 2015, 186, 176–184. [Google Scholar] [CrossRef]
  37. Zhou, X.L.; Chen, C.J.; Ran, L.S.; Yang, Y.; Song, J.Y.; Zhou, C.B.; Fu, D.H. Formulation optimization and safety evaluation of the compound fuzhuan tea bag. Mod. Food Sci. Technol. 2020, 36, 210–219. [Google Scholar]
  38. Jing, N.N.; Liu, X.X.; Jin, M.L.; Yang, X.B.; Hu, X.; Li, C.Y.; Zhao, K. Fubrick tea attenuates high-fat diet induced fat deposition and metabolic disorder by regulating gut microbiota and caffeine metabolism. Food Funct. 2020, 11, 6971–6986. [Google Scholar] [CrossRef]
  39. Chen, G.J.; Xie, M.H.; Wan, P.; Chen, D.; Dai, Z.Q.; Ye, H.; Hu, B.; Zeng, X.X.; Liu, Z.H. Fuzhuan Brick Tea Polysaccharides Attenuate Metabolic Syndrome in High-Fat Diet Induced Mice in Association with Modulation in the Gut Microbiota. J. Agric. Food Chem. 2018, 66, 2783–2795. [Google Scholar] [CrossRef]
  40. Zobel, E.H.; Hansen, T.W.; Rossing, P.; Von, S.B.J. Global Changes in Food Supply and the Obesity Epidemic. Curr. Obes. Rep. 2016, 5, 449–455. [Google Scholar] [CrossRef]
  41. Naqvi, S.; Imani, S.; Hosseinifard, H.; Wen, Q.L.; Shahzad, M.N.; Ijaz, I.; Deng, Y.C.; Guo, M.a.n.; Xu, Y. Associations of serum low-density lipoprotein and systolic blood pressure levels with type 2 diabetic patients with and without peripheral neuropathy: Systemic review, meta-analysis and meta-regression analysis of observational studies. BMC Endocr. Disord. 2019, 19, 125. [Google Scholar] [CrossRef] [PubMed] [Green Version]
  42. Al-Lahou, B.; Ausman, L.M.; Penalvo, J.L.; Huggins, G.S.; Al-Hooti, S.; Al-Zenki, S.; Zhang, F.F. Dietary Patterns Associated with the Prevalence of Cardiovascular Disease Risk Factors in Kuwaiti Adults. J. Acad. Nutr. Diet. 2020, 120, 424–436. [Google Scholar] [CrossRef] [PubMed]
  43. Chen, G.J.; Xie, M.H.; Dai, Z.Q.; Wan, P.; Ye, H.; Zeng, X.X.; Sun, Y. Kudingcha and Fuzhuan Brick Tea Prevent Obesity and Modulate Gut Microbiota in High-Fat Diet Fed Mice. Mol. Nutr. Food Res. 2018, 62, 1700485. [Google Scholar] [CrossRef] [PubMed]
  44. Yoshihiro, K.; Makoto, W.; Aya, H.; Kyoko, H. Small-Dense Low-Density Lipoprotein Cholesterol: A Subclinical Marker for the Primary Prevention of Coronary Heart Disease. J. Atheroscler. Thromb. 2020, 27, 641–643. [Google Scholar]
  45. Takaeko, Y.J.; Matsui, S.; Kajikawa, M.; Maruhashi, T.; Yamaji, T.; Harada, T.; Han, Y.M.; Hashimoto, H.; Kihara, Y.; Hida, E. Relationship between high-density lipoprotein cholesterol levels and endothelial function in women: A cross-sectional study. BMJ Open 2020, 10, e038121. [Google Scholar] [CrossRef]
  46. Lu, C.; Hwang, L.S. Polyphenol contents of Pu-Erh teas and their abilities to inhibit cholesterol biosynthesis in Hep G2 cell line. Food Chem. 2008, 111, 67–71. [Google Scholar] [CrossRef]
  47. Li, Y.; Rahman, S.U.; Huang, Y.Y.; Zhang, Y.F.; Ming, P.F.; Zhu, L.; Chu, X.Y.; Li, J.C.; Feng, S.B.; Wang, X.C.; et al. Green tea polyphenols decrease weight gain, ameliorate alteration of gut microbiota, and mitigate intestinal inflammation in canines with high-fat-diet-induced obesity. J. Nutr. Biochem. 2020, 78, 108324. [Google Scholar] [CrossRef]
  48. Foster, M.T.; Gentile, C.L.; Cox-York, K.; Wei, Y.; Wang, D.; Estrada, A.L.; Reese, L.; Miller, T.; Pagliassotti, M.J.; Weir, T.L. Fuzhuan tea consumption imparts hepatoprotective effects and alters intestinal microbiota in high saturated fat diet-fed rats. Mol. Nutr. Food Res. 2016, 60, 1213–1220. [Google Scholar] [CrossRef]
  49. Zarzour, R.H.A.; Ahmad, M.; Asmawi, M.Z.; Kaur, G.; Saeed, M.A.A.; Al-Mansoub, M.A.; Saghir, S.A.M.; Usman, N.S.; Al-Dulaimi, D.W.; Yam, M.F. Phyllanthus Niruri Standardized Extract Alleviates the Progression of Non-Alcoholic Fatty Liver Disease and Decreases Atherosclerotic Risk in Sprague-Dawley Rats. Nutrients 2017, 9, 766. [Google Scholar] [CrossRef] [Green Version]
  50. Panelli, M.F.; Pierine, D.T.; de Souza, S.L.B.; Ferron, A.J.T.; Garcia, J.L.; Santos, K.C.D.; Corrêa, C.R. Bark of Passiflora edulis Treatment Stimulates Antioxidant Capacity, and Reduces Dyslipidemia and Body Fat in db/db Mice. Antioxidants 2018, 7, 120. [Google Scholar] [CrossRef] [Green Version]
  51. Zhang, Q.A.; Zhang, X.L.; Yan, Y.Y.; Fan, X.H. Antioxidant Evaluation and Composition Analysis of Extracts from Fuzhuan Brick Tea and Its Comparison with Two Instant Tea Products. J. AOAC Int. 2017, 100, 653–660. [Google Scholar] [CrossRef] [PubMed]
  52. Zhang, F.X.; Jia, Z.H.; Gao, P.; Kong, H.W.; Li, X.; Chen, J.; Yang, Q.; Yin, P.Y.; Wang, J.S.; Lu, X.; et al. Metabonomics study of atherosclerosis rats by ultra fast liquid chromatography coupled with ion trap-time of flight mass spectrometry. Talanta 2009, 79, 836–844. [Google Scholar] [CrossRef] [PubMed]
  53. Ma, N.; Yang, Y.J.; Liu, X.W.; Kong, X.J.; Li, X.H.; Qin, Z.; Jiao, Z.H.; Li, J.Y. UPLC-Q-TOF/MS-based metabonomic studies on the intervention effects of aspirin eugenol ester in atherosclerosis hamsters. Sci. Rep. 2017, 7, 10544. [Google Scholar] [CrossRef] [PubMed] [Green Version]
  54. Zhao, Y.Y.; Miao, H.; Cheng, X.L.; Wei, F. Lipidomics: Novel insight into the biochemical mechanism of lipid metabolism and dysregulation-associated disease. Chem. Biol. Int. 2015, 240, 220–238. [Google Scholar] [CrossRef] [PubMed]
  55. Jadhav, K.; Xu, Y.; Xu, Y.Y.; Li, Y.Y.; Xu, J.S.; Zhu, Y.D.; Adorini, L.; Lee, Y.K.; Kasumov, T.; Yin, L.Y.; et al. Reversal of metabolic disorders by pharmacological activation of bile acid receptors TGR5 and FXR. Mol. Metab. 2018, 9, 134–140. [Google Scholar] [CrossRef]
  56. Hylemon, P.B.; Takabe, K.; Dozmorov, M.; Nagahashi, M.; Zhou, H.P. Bile acids as global regulators of hepatic nutrient metabolism. Liver Res. 2017, 1, 10–16. [Google Scholar] [CrossRef]
  57. Rebecca, M.H.; Gianella, C.C.; Marie-Louise, R. Dietary procyanidins selectively modulate intestinal farnesoid X receptor-regulated gene expression to alter enterohepatic bile acid recirculation: Elucidation of a novel mechanism to reduce triglyceridemia. Mol. Nutr. Food Res. 2016, 60, 727–736. [Google Scholar]
  58. Jeckelmann, J.; Erni, B. The mannose phosphotransferase system (Man-PTS)—Mannose transporter and receptor for bacteriocins and bacteriophages. BBA Biomembr. 2020, 1862, 183412. [Google Scholar] [CrossRef]
  59. Sherratt, S.C.R.; Mason, R.P. Eicosapentaenoic acid inhibits oxidation of high density lipoprotein particles in a manner distinct from docosahexaenoic acid. Biochem. Biophys. Res. Commun. 2018, 496, 335–338. [Google Scholar] [CrossRef]
  60. Das, U.N. Essential fatty acids: Biochemistry, physiology and pathology. Biotechnol. J. 2006, 1, 420–439. [Google Scholar] [CrossRef]
Figure 1. CFBT prevents the increase in body weight and liver weight. (A) Body weight, (B) body weight gain and (C) liver weight. CK, control group; NK, high-fat diet group; YK, high-fat diet with positive drug Xuezhikang; FL, high-fat diet with low-dosage CFBT; FM, high-fat diet with medium-dosage CFBT; FH, high-fat diet with high-dosage CFBT. All data are presented as the mean ± SD (n = 10/group). Different lowercase letters above the bars showed significant difference at 0.05 level among the same data series; different capital letters showed highly significant difference at 0.01 level among the same data series.
Nutrients 14 01128 g001
Figure 2. CFBT improves serum biochemical indexes. (A) Serum total cholesterol (TC), (B) serum triglyceride (TG), (C) serum low-density lipoprotein cholesterol (LDL-C), (D) serum high-density lipoprotein cholesterol (HDL-C), (E) serum glucose (GLU), (F) serum insulin, (G) serum alanine aminotransferase (ALT), (H) serum aspartate aminotransferase (AST), (I) liver superoxide dismutase (SOD) and (J) liver malondialdehyde (MDA). CK, control group; NK, high-fat diet group; YK, high-fat diet with positive drug Xuezhikang; FL, high-fat diet with low-dosage CFBT; FM, high-fat diet with medium-dosage CFBT; FH, high-fat diet with high-dosage CFBT. All data are presented as the mean ± SD (n = 10/group). Different lowercase letters above the bars showed significant difference at 0.05 level among the same data series; different capital letters showed highly significant difference at 0.01 level among the same data series.
Nutrients 14 01128 g002
Figure 3. Effects of CFBT intervention on Hematoxylin-eosin staining of liver tissues. (A) Normal control group (CK); (B) High-fat model group (NK); (C) Positive control group (YK); (D) Low-dose CFBT (FL); (E) Medium-dose CFBT (FM); (F) High-dose CFBT (FH).
Nutrients 14 01128 g003
Figure 4. PCA plots of samples from CK group, NK group and YK group. (A) CK group vs. NK group; (B) NK group vs. FH group; (C) NK group vs. YK group.
Nutrients 14 01128 g004
Figure 5. OPLS-DA model verification from CK, NK and YK groups. (A) CK group vs. NK group; (B) NK group vs. FH group; (C) NK group vs. YK group.
Nutrients 14 01128 g005
Figure 6. Changes in metabolites and related pathways in the liver of mice caused by HFD according to the KEGG pathway database. (A) CK group vs. NK group; (B) NK group vs. FH group; (C) NK group vs. YK group; (D) CK group vs. FH group; (E) CK group vs. YK group.
Nutrients 14 01128 g006
Table 1. Elution gradient.
Time (min) Flow Rate (mL/min)Temperature (°C)Mobile Phase A (V)Mobile Phase B (V)
0.00.440955
11.00.440595
12.00.440595
12.10.440955
14.00.440955
Table 2. Significant changes in potential metabolites were identified by LC—MS in mice liver induced by HFD.
MetabolitesCK vs. NKNK vs. FHCK vs. FHCK vs. YKNK vs. YK
Log2FCFC Log2FCFCLog2FCFCLog2FCFCLog2FCFC
Taurodeoxycholic
acid sodium salt
1.43↑2.69 −1.90↓0.27
Tauroursodeoxycholic
Acid
−1.88↓0.27
Taurochenodesoxycholic
Acid
1.00↑2.01−1.90↓0.27
Hyodeoxycholic
Acid
−1.07↓0.48−1.88↓0.27
Glycoursodeoxycholic
Acid
−1.39↓0.38
Glycocholic Acid−1.22↓0.43 −2.24↓0.21−1.02↓0.49
Deoxycholic Acid 1.04↑2.06 −1.60↓0.33−1.46↓0.36
Chenodeoxycholic Acid 1.06↑2.09 −1.54↓0.34−1.43↓0.37
Taurodeoxycholic Acid
sodium salt
−1.53↓0.35
D-Sorbitol1.04↑2.06−1.42↓0.37 1.77↑3.40
D-Fructose1.03↑2.04−1.27↓0.41 1.37↑2.59
D-Galactose1.18↑2.26−1.43↓0.37 1.71↑3.28
D-Glucose1.24↑2.36−1.53↓0.35 1.79↑3.46
D-Mannose1.31↑2.48−1.56↓0.34 1.67↑3.17
D-Sucrose −3.89↓0.07−1.30↓0.414.67↑25.43
D-Trehalose4.12↑17.37−3.78↓0.07 5.08↑33.73
D-Glucose 6-Phosphate2.73↑6.65−1.75↓0.30 3.64↑12.49
L-Fucose −1.35↓0.39
L-Rhamnose −1.08↓0.47
Maltose 5.48↑44.70
D-Sedoheptuiose 7-Phosphate1.00↑2.00 1.30↑2.47
D-Glucopyranose −1.59↓0.33
D-Fructose 6-Phosphate
-Disodium Salt
2.76↑6.77−1.62↓0.321.14↑2.203.71↑13.13
D-Fructose−1,6-Biphos-
phate-Trisodium Salt
2.15↑4.45−2.01↓0.25 2.75↑6.70
N-Acetylglucosamine
1-Phosphate
1.06↑2.08
3′-Sialyllactose3.14↑8.84−2.11↓0.231.03↑2.043.08↑8.45
Galactaric Acid 1.17↑2.25
Hydroxyphenyllactic Acid1.47↑2.78 1.13↑2.19
MARMESIN−1.57↓0.341.16↑2.23
L-Erythrulose1.58↑2.99−1.68↓0.31 2.19↑4.55
D-Mannose 6-phosphate2.75↑6.72−1.67↓0.311.07↑2.113.73↑13.31
D-Fructose 6-phosphate2.71↑6.56−1.72↓0.30 3.59↑12.06
Formononetin−12.99↓0.0011.32↑2561.81−1.67↓0.31−12.99↓0.00
D-Sucrose3.56↑11.80 1.11↑2.16
Lactobionic Acid 2.24↑4.742.32↑4.99
Dulcitol 2.64↑6.241.01↑2.02
Lactose −1.37↓0.393.35↑10.20
Maltotriose12.40↑5418.78−5.19↓0.037.21↑147.9914.06↑17110.831.66↑3.16
N-Acetyl-D-Glucosamine 1.12↑2.18
Raffinose12.57↑6062.72−5.88↓0.026.69↑103.2214.18↑18620.561.62↑3.07
D-Mannitol −1.83↓0.28 2.41↑5.33
D(-)-Threose 1.31↑2.48
Octadecatrienoic Acid−1.41↓0.38
Thromboxane B2 −2.36↓0.19−2.58↓0.17
Prostaglandin D2 −3.44↓0.09−3.20↓0.11
Eicosapentaenoic Acid−3.27↓0.101.30↑2.46−1.98↓0.25−4.98↓0.03−1.71↓0.31
Eicosatetraenoic Acid−4.52↓0.042.83↑7.09−1.69↓0.31−6.83↓0.01−2.32↓0.20
Eicosatrienoic Acid −1.92↓0.26−1.71↓0.31
Docosahexaenoic Acid−4.79↓0.042.71↑6.54−2.08↑0.24−6.82↓0.01−2.04↓0.24
12-Hydroxyeicosane tetraenoic acid−2.29↓0.201.48↑2.79 −3.09↓0.12
Lysopc 16:1 −1.09↓0.47
Lysopg 18:11.34↑2.53
Lysope 18:11.29↑2.44
Lysopc 20:2 1.15↑2.21
Lysopa 18:01.79↑3.47 2.15↑4.422.03↑4.08
Cis-11,14-Eicosadienoic
Acid (C20:2)
1.20↑2.30 1.28↑2.441.152.21
Arachidic Acid(C20:0)−1.37↓0.39 −1.76↓0.30
3-Methylglutaric Acid −1.38↓0.39
Tetradecanedioic Acid−1.30↓0.41 −1.96↓0.26
Hexadecanedioic Acid −1.78↓0.29
PE(18:1(9Z)/0:0)1.37↑2.58 1.40↑2.65
Punicic Acid−2.21↓0.221.26↑2.39 −2.61↓0.16
Stearidonic Acid−1.56↓0.34 −1.67↓0.31 1.71↑1.71
p-Mentha-1,3,8-triene−1.05↓0.48 1.63↑1.63
2,2-Dimethyl Succinic Acid −1.31↓0.40
2-Methylbutyroylcarnitine −1.56↓0.34−1.63↓0.32
The significant regulation of potential metabolites in the liver of mice induced by HFD shown in Table 2. Metabolites with “↑/↓” means increased or decreased. FC means “Fold Change”.
Publisher’s Note: MDPI stays neutral with regard to jurisdictional claims in published maps and institutional affiliations.

