
Dietary Patterns and Their Association with Sociodemographic and Lifestyle Factors in Filipino Adults


Abstract
:1. Introduction
2. Materials and Methods
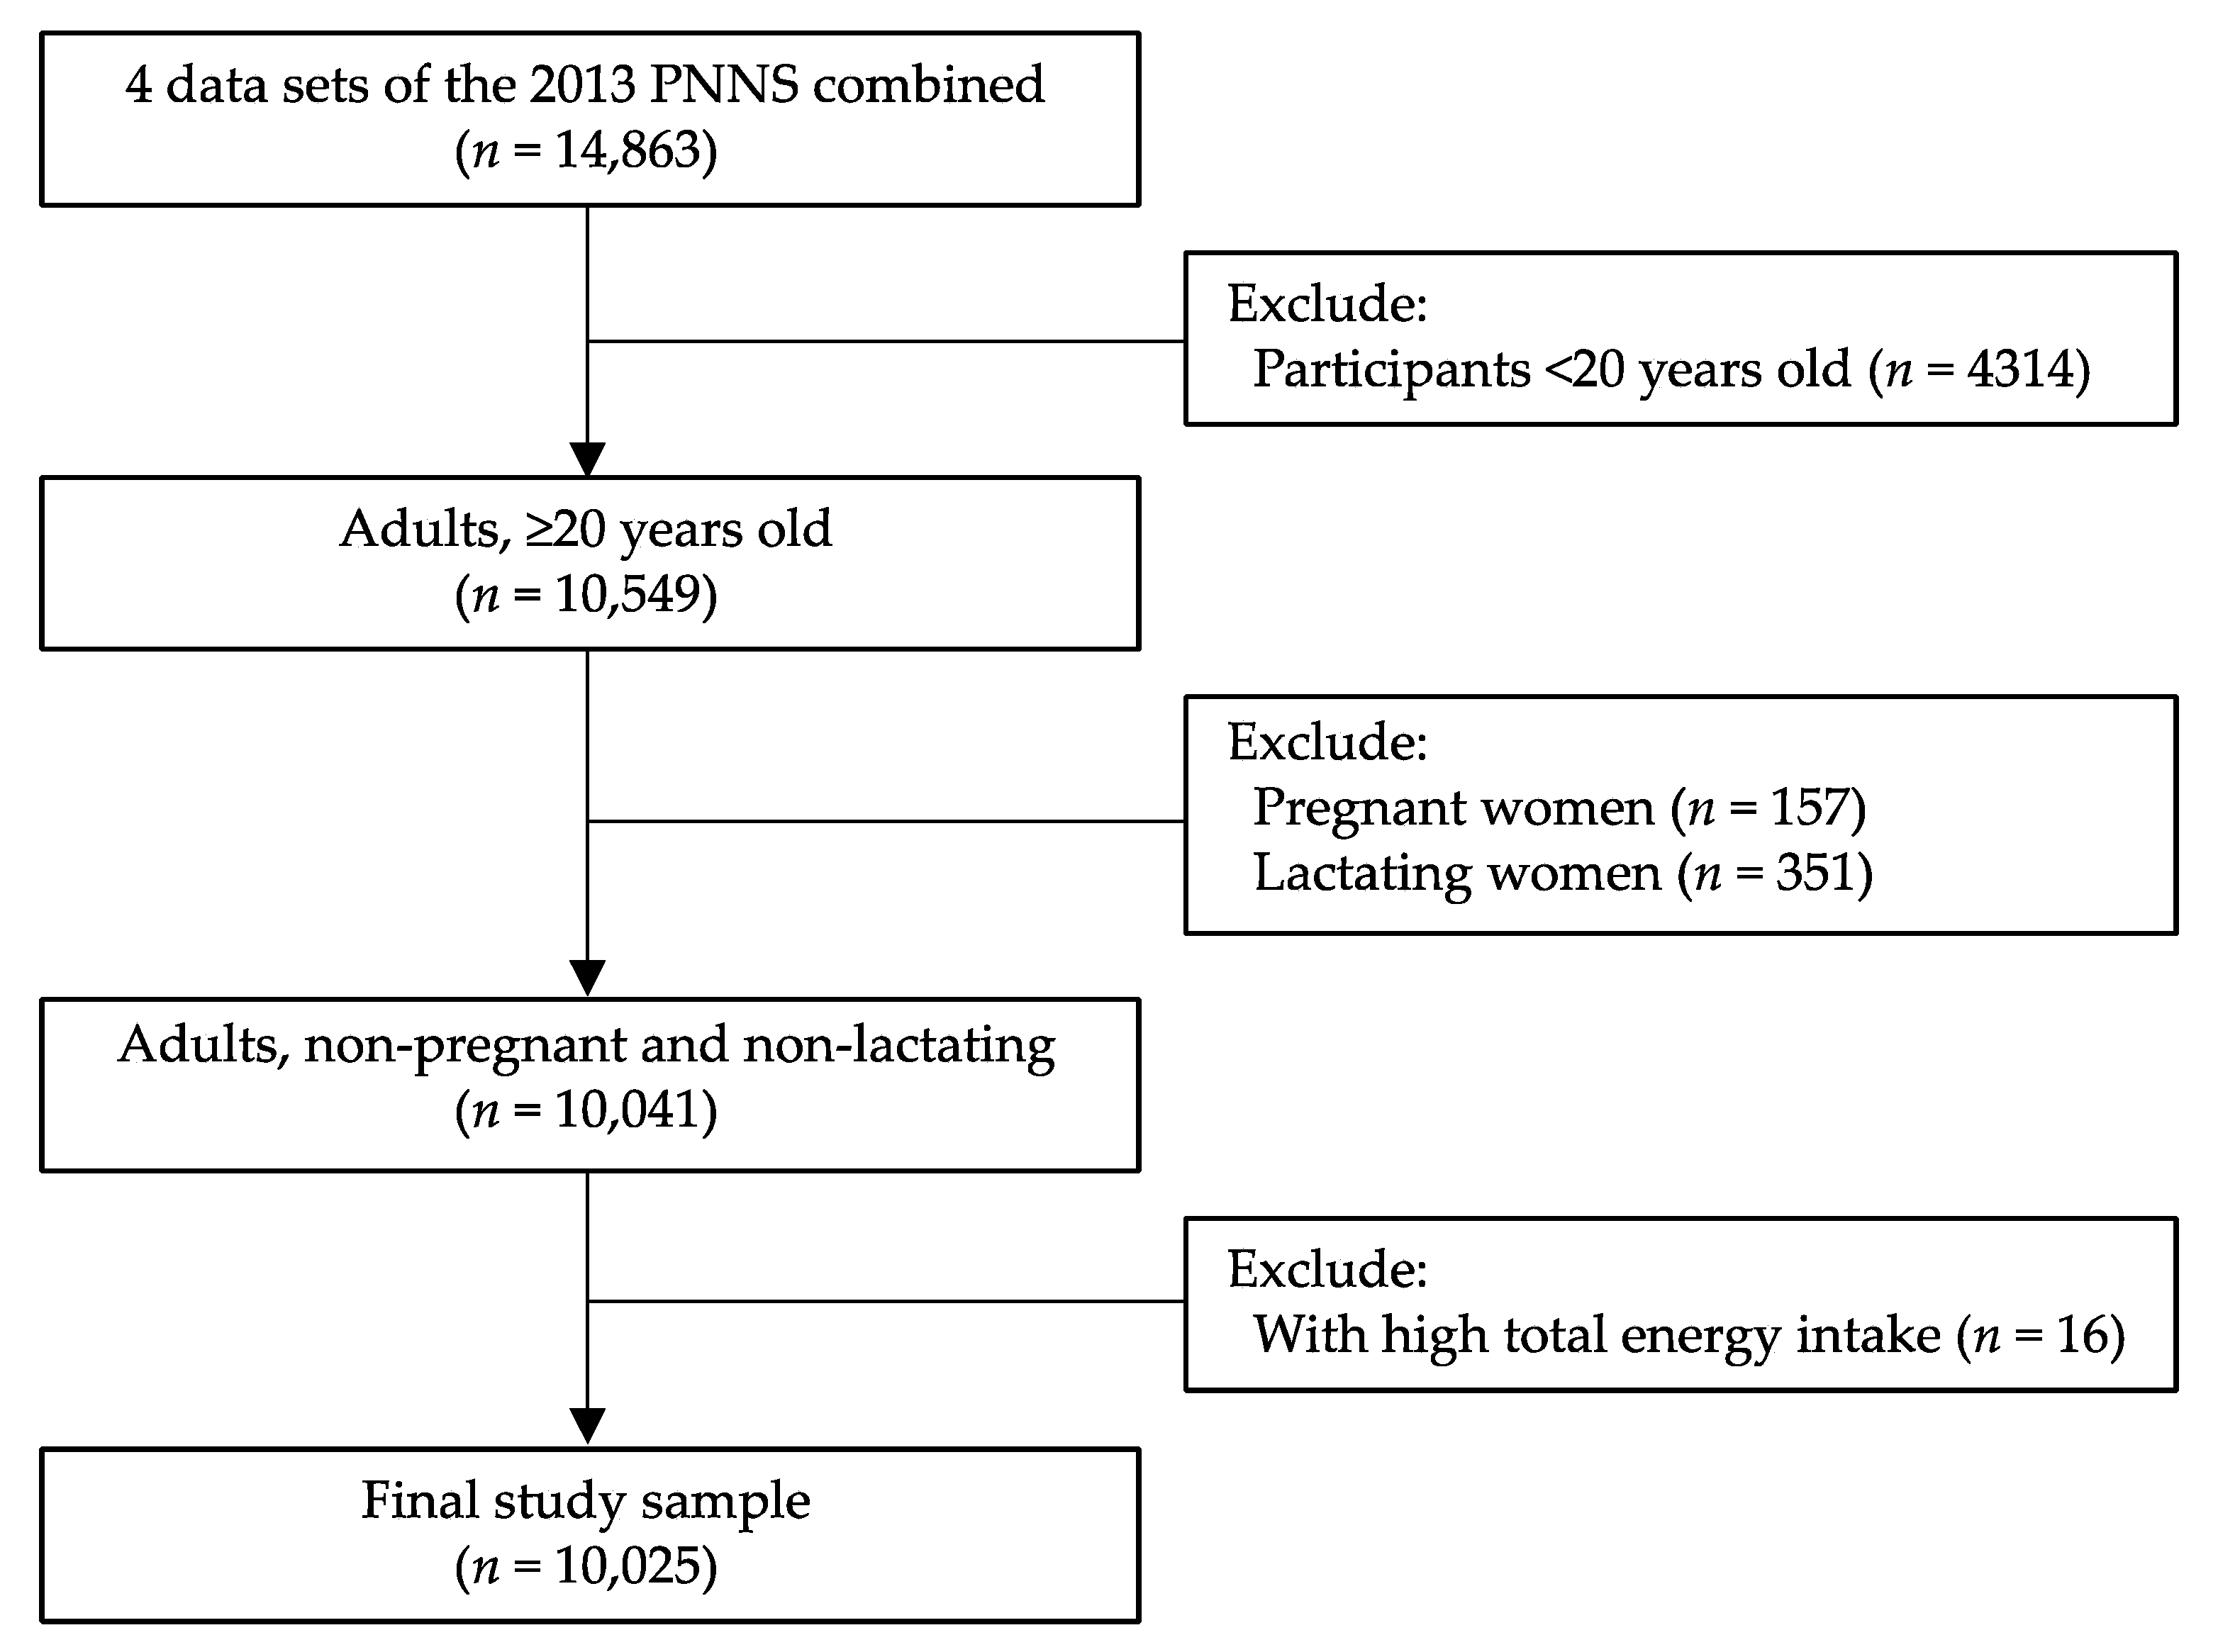
2.1. Study Population
2.2. Dietary Intake Assessment
2.3. Dietary Pattern Analysis
2.4. Sociodemographic and Lifestyle Factors
2.5. Statistical Analysis
3. Results
3.1. Characteristics of Study Participants
3.2. Dietary Patterns and Their Correlates
4. Discussion
5. Conclusions
Supplementary Materials
Author Contributions
Funding
Institutional Review Board Statement
Informed Consent Statement
Data Availability Statement
Acknowledgments
Conflicts of Interest
References
- Murray, C.J.L.; Aravkin, Y.; Zheng, P.; Abbafati, C.; Abbas, K.M.; Abbasi-Kangevari, M.; Abd-Allah, F.; Abdelalim, A.; Abdollahi, M.; Abdollapour, I.; et al. Global burden of 87 risk factors in 204 countries and territories, 1990–2019: A systematic analysis for the Global Burden of Disease Study 2019. Lancet 2020, 396, 1223–1249. [Google Scholar] [CrossRef]
- Hu, F.B. Dietary pattern analysis: A new direction in nutritional epidemiology. Curr. Opin. Lipidol. 2002, 13, 3–9. [Google Scholar] [CrossRef] [PubMed]
- Moeller, S.M.; Reedy, J.; Millen, A.E.; Dixon, L.B.; Newby, P.K.; Tucker, K.L.; Krebs-Smith, S.M.; Guenther, P.M. Dietary patterns: Challenges and opportunities in dietary patterns research an experimental biology workshop, April 1, 2006. J. Am. Diet. Assoc. 2007, 107, 1233–1239. [Google Scholar] [CrossRef]
- Tucker, K.L. Dietary patterns, approaches, and multicultural perspective. Appl. Physiol. Nutr. Metab. 2010, 35, 211–218. [Google Scholar] [CrossRef]
- Ocké, M.C. Evaluation of methodologies for assessing the overall diet: Dietary quality scores and dietary pattern analysis. Proc. Nutr. Soc. 2013, 72, 191–199. [Google Scholar] [CrossRef] [Green Version]
- Angeles-Agdeppa, I.; Sun, Y.; Tanda, K.V. Dietary pattern and nutrient intakes in association with non-communicable disease risk factors among Filipino adults: A cross-sectional study. Nutr. J. 2020, 19, 1–13. [Google Scholar] [CrossRef]
- Cai, J.X.; Nuli, R.; Zhang, Y.; Zhang, Y.Y.; Abudusemaiti, M.; Kadeer, A.; Tian, X.; Xiao, H. Association of dietary patterns with type 2 diabetes mellitus among middle-aged adults in Uygur population of Xinjiang region. J. Nutr. Sci. Vitaminol. 2019, 65, 362–374. [Google Scholar] [CrossRef] [Green Version]
- Chan, R.; Yau, F.; Yu, B.; Woo, J. The role of dietary patterns in the contribution of cardiorespiratory fitness in community-dwelling older Chinese adults in Hong Kong. J. Am. Med. Dir. Assoc. 2019, 20, 558–563. [Google Scholar] [CrossRef] [PubMed]
- Doostvandi, T.; Bahadoran, Z.; Mozaffari-Khosravi, H.; Tahmasebinejad, Z.; Mirmiran, P.; Azizi, F. The association of dietary patterns and the incidence of insulin resistance after a 3-year follow-up: Tehran Lipid and Glucose Study. Asia Pac. J. Clin. Nutr. 2017, 26, 531–538. [Google Scholar] [PubMed]
- Haidari, F.; Shirbeigi, E.; Cheraghpour, M.; Mohammadshahi, M. Association of dietary patterns with body mass index, waist circumference, and blood pressure in an adult population in Ahvaz, Iran. Saudi Med. J. 2014, 35, 967–974. [Google Scholar]
- Hong, X.; Xu, F.; Wang, Z.Y.; Liang, Y.Q.; Li, J.Q. Dietary patterns and the incidence of hyperglycemia in China. Public Health Nutr. 2015, 19, 131–141. [Google Scholar] [CrossRef] [Green Version]
- Ito, T.; Kawakami, R.; Tanisawa, K.; Miyawaki, R.; Ishii, K.; Torii, S.; Suzuki, K.; Sakamoto, S.; Torii, S.; Suzuki, K.; et al. Dietary patterns and abdominal obesity in middle-aged and elderly Japanese adults: Waseda Alumni’s Sports, Exercise, Daily Activity, Sedentariness and Health Study (WASEDA’S Health Study). Nutrition 2019, 58, 149–155. [Google Scholar] [CrossRef]
- Kim, J.; Jo, I.; Joung, H. A rice-based traditional dietary pattern is associated with obesity in Korean adults. J. Acad. Nutr. Diet. 2012, 112, 246–253. [Google Scholar] [CrossRef]
- Lee, J.Y.; Jun, N.R.; Yoon, D.; Shin, C.; Baik, I. Association between dietary patterns in the remote past and telomere length. Eur. J. Clin. Nutr. 2015, 69, 1048–1052. [Google Scholar] [CrossRef]
- Muga, M.A.; Owili, P.O.; Hsu, C.Y.; Rau, H.H.; Chao, J.C.J. Dietary patterns, gender, and weight status among middle-aged and older adults in Taiwan: A cross-sectional study. BMC Geriatr. 2017, 17, 1–10. [Google Scholar] [CrossRef] [PubMed] [Green Version]
- Naja, F.; Itani, L.; Hwalla, N.; Sibai, A.M.; Kharroubi, S.A. Identification of dietary patterns associated with elevated blood pressure among Lebanese men: A comparison of principal component analysis with reduced rank regression and partial least square methods. PLoS ONE 2019, 14, e0220942. [Google Scholar] [CrossRef]
- Okada, E.; Takahashi, K.; Takimoto, H.; Takabayashi, S.; Kishi, T.; Kobayashi, T.; Nakamura, K.; Ukawa, S.; Nakamura, M.; Sasaki, S.; et al. Dietary patterns among Japanese adults: Findings from the National Health and Nutrition Survey, 2012. Asia Pac. J. Clin. Nutr. 2018, 27, 1120–1130. [Google Scholar]
- Park, J.E.; Jung, H.; Lee, J.E. Dietary pattern and hypertension in Korean adults. Public Health Nutr. 2013, 17, 597–606. [Google Scholar] [CrossRef] [Green Version]
- Rashidkhani, B.; Gargari, B.P.; Ranjbar, F.; Zareiy, S.; Kargarnovin, Z. Dietary patterns and anthropometric indices among Iranian women with major depressive disorder. Psychiatry Res. 2013, 210, 115–120. [Google Scholar] [CrossRef] [PubMed]
- Rezazadeh, A.; Rashidkhani, B. The association of general and central obesity with major dietary patterns of adult women living in Tehran, Iran. J. Nutr. Sci. Vitaminol. 2010, 56, 132–138. [Google Scholar] [CrossRef] [PubMed] [Green Version]
- Rezazadeh, A.; Rashidkhani, B.; Omidvar, N. Association of major dietary patterns with socio-economic and lifestyle factors of adult women living in Tehran, Iran. Nutrition 2010, 26, 337–341. [Google Scholar] [CrossRef] [PubMed]
- Safdar, N.F.; Bertone-Johnson, E.R.; Cordeiro, L.; Jafar, T.H.; Cohen, N.L. Dietary patterns and their association with hypertension among Pakistani urban adults. Asia Pac. J. Clin. Nutr. 2015, 24, 710–719. [Google Scholar] [PubMed]
- Shin, D.; Lee, K.W.; Kim, M.H.; Kim, H.J.; An, Y.S.; Chung, H.K. Identifying dietary patterns associated with mild cognitive impairment in older Korean adults using reduced rank regression. Int. J. Environ. Res. Public Health 2018, 15, 100. [Google Scholar] [CrossRef] [PubMed] [Green Version]
- Vajdi, M.; Nikniaz, L.; Asl, A.M.P.; Farhangi, M.A. Lifestyle patterns and their nutritional, socio-demographic and psychological determinants in a community-based study: A mixed approach of latent class and factor analyses. PLoS ONE 2020, 15, e0236242. [Google Scholar] [CrossRef]
- Venkaiah, K.; Brahmam, G.N.V.; Vijayaraghavan, K. Application of factor analysis to identify dietary patterns and use of factor scores to study their relationship with nutritional status of adult rural populations. J. Health Popul. Nutr. 2011, 29, 327–338. [Google Scholar] [CrossRef] [Green Version]
- Wei, Z.Y.; Liu, J.J.; Zhan, X.M.; Feng, H.M.; Zhang, Y.Y. Dietary patterns and the risk of metabolic syndrome in Chinese adults: A population-based cross-sectional study. Public Health Nutr. 2018, 21, 2409–2416. [Google Scholar] [CrossRef] [Green Version]
- Zhang, M.Y.; Li, Z.J.; Yang, S.M.; Sun, Y.Y.; Jin, M.D.; Chen, X.; Yu, Q. The association between dietary patterns and depressive symptoms in Chinese adults. Biomed Res. Int. 2020, 2020, 8380151. [Google Scholar] [CrossRef]
- Department of Science and Technology-Food and Nutrition Research Institute. Public Use File. Available online: http://enutrition.fnri.dost.gov.ph/site/home.php (accessed on 14 February 2020).
- Patalen, C.F.; Ikeda, N.; Angeles-Agdeppa, I.; Vargas, M.B.; Nishi, N.; Duante, C.A.; Capanzana, M.V. Data Resource Profile: The Philippine National Nutrition Survey (NNS). Int. J. Epidemiol. 2020, 49, 742–743f. [Google Scholar] [CrossRef]
- Department of Science and Technology-Food Nutrition Research Institute. eNutrition, Facts and Figure 2013 National Nutrition Survey. Available online: https://www.fnri.dost.gov.ph/index.php/19-nutrition-statistic/175-national-nutrition-survey#facts-and-figures (accessed on 3 September 2020).
- Flores, M.; Macias, N.; Rivera, M.; Lozada, A.; Barquera, S.; Rivera-Dommarco, J.; Tucker, K.L. Dietary patterns in Mexican adults are associated with risk of being overweight or obese. J. Nutr. 2010, 140, 1869–1873. [Google Scholar] [CrossRef] [Green Version]
- Gazan, R.; Béchaux, C.; Crépet, A.; Sirot, V.; Drouillet-Pinard, P.; Dubuisson, C.; Harvard, S. Dietary patterns in the French adult population: A study from the second French national cross-sectional dietary survey (INCA2) (2006–2007). Br. J. Nutr. 2016, 116, 300–315. [Google Scholar] [CrossRef] [Green Version]
- De Gavelle, E.; Huneau, J.F.; Mariotti, F. Patterns of protein food intake are associated with nutrient adequacy in the general French adult population. Nutrients 2018, 10, 226. [Google Scholar] [CrossRef] [PubMed] [Green Version]
- Zárate-Ortiz, A.G.; Melse-Boonstra, A.; Rodríguez-Ramírez, S.; Hernández-Cordero, S.; Feskens, E.J. Dietary patterns and the double burden of malnutrition in Mexican adolescents: Results from ENSANUT-2006. Nutrients 2019, 11, 2753. [Google Scholar] [CrossRef] [PubMed] [Green Version]
- Smyth, R.; Johnson, A. Factor Analysis. Available online: https://www.uwo.ca/fhs/tc/labs/10.FactorAnalysis.pdf (accessed on 8 January 2022).
- Bell, L.K.; Edwards, S.; Grieger, J.A. The relationship between dietary patterns and metabolic health in a representative sample of adult Australians. Nutrients 2015, 7, 6491–6505. [Google Scholar] [CrossRef] [Green Version]
- World Health Organization. WHO STEPS Surveillance Manual: The WHO STEPwise Approach to Chronic Disease Risk Factor Surveillance; WHO: Geneva, Switzerland, 2005. [Google Scholar]
- World Health Organization. Global Status Report on Alcohol and Health 2018; WHO: Geneva, Switzerland, 2019. [Google Scholar]
- Park, S.; Bae, J.-H. Fermented food intake is associated with a reduced likelihood of atopic dermatitis in an adult population (Korean National Health and Nutrition Examination Survey 2012–2013). Nutr. Res. 2016, 36, 125–133. [Google Scholar] [CrossRef]
- Lee, W.L.; Woo, H.D.; Cho, M.J.; Park, J.K.; Kim, S.S. Identification of dietary patterns associated with incidence of hyperglycemia in middle-aged and older Korean adults. Nutrients 2019, 11, 1801. [Google Scholar] [CrossRef] [PubMed] [Green Version]
- Chen, Z.; Liu, L.; Roebothan, B.; Ryan, A.; Colbourne, J.; Baker, N.; Yan, J.; Wang, P.P. Four major dietary patterns identified for a target-population of adults residing in Newfoundland and Labrador, Canada. BMC Public Health 2015, 15, 1–12. [Google Scholar] [CrossRef] [PubMed] [Green Version]
- Mishra, G.; Ball, K.; Arbuckle, J.; Crawford, D. Dietary patterns of Australian adults and their association with socioeconomic status: Results from the 1995 National Nutrition Survey. Eur. J. Clin. Nutr. 2002, 56, 687–693. [Google Scholar] [CrossRef] [Green Version]
- Knudsen, V.K.; Matthiessen, J.; Biltoft-Jensen, A.; Sørensen, M.R.; Groth, M.V.; Christensen, T.; Fagt, S. Identifying dietary patterns and associated health-related lifestyle factors in the adult Danish population. Eur. J. Clin. Nutr. 2014, 68, 736–740. [Google Scholar] [CrossRef]
- Park, S.; Murphy, S.; Wilkens, L.R. Dietary patterns using the Food Guide Pyramid groups are associated with socioeconomic and lifestyle factors: The multi-ethnic cohort study. J. Nutr. 2005, 135, 843–849. [Google Scholar] [CrossRef] [Green Version]
- Sánchez-Villegas, A.; Delgado-Rodríguez, M.; Martínez-González, M.Á.; de Irala-Estévez, J. Gender, age, socio-demographic and lifestyle factors associated with major dietary patterns in the Spanish Project SUN (Seguimineto Universidad de Navarra). Eur. J. Clin. Nutr. 2003, 57, 285–292. [Google Scholar] [CrossRef] [Green Version]
- Kesse-Guyot, E.; Bertrais, S.; Peneau, S.; Estaquio, C.; Dauchet, L.; Vergnaud, A.C.; Czemichow, P.; Galan, S.; Hercberg, S.; Bellisle, F. Dietary patterns and their sociodemographic and behavioral correlates in French middle-aged adults from the SU. VI. MAX cohort. Eur. J. Clin. Nutr. 2009, 63, 521–528. [Google Scholar] [CrossRef] [PubMed] [Green Version]
- Kriaučionienė, V.; Petkevičienė, J.; Klumbienė, J. Dietary patterns and their association with lifestyle factors in Lithuanian adult population. Medicina 2009, 44, 799–804. [Google Scholar] [CrossRef] [Green Version]
- World Health Organization. Global Strategy on Diet, Physical Activity and Health; WHO: Geneva, Switzerland, 2004. [Google Scholar]
- Vinther, J.L.; Conklin, A.I.; Wareham, N.J.; Monsivais, P. Marital transitions and associated changes in fruit and vegetable intake: Findings from the population-based [rospective EPIC-Norfolk cohort, UK. Soc. Sci. Med. 2016, 157, 120–126. [Google Scholar] [CrossRef] [Green Version]
- Ax, E.; Lemming, E.W.; Becker, W.; Andersson, A.; Lindroos, A.K.; Cederholm, T.; Sjörgren, P.; Fung, T.T. Dietary patterns in Swedish adults: Results from a national dietary survey. Br. J. Clin. Nutr. 2015, 115, 95–104. [Google Scholar] [CrossRef] [PubMed] [Green Version]
- Denova-Gutiérrez, E.; Tucker, K.L.; Salmerón, J.; Flores, M.; Barquera, S. Relative validity of a food frequency questionnaire to identify dietary patterns in Mexican adult population. Salud Publica Mex. 2016, 58, 608–616. [Google Scholar] [CrossRef] [Green Version]
- Martinez, M.E.; Marshall, J.R.; Sechrest, L. Invited commentary: Factor analysis and the search for objectivity. Am. J. Epidemiol. 1998, 148, 17–19. [Google Scholar] [CrossRef] [Green Version]
- Skrondal, A.; Rabe-Hesketh, S. Generalized Latent Variable Modeling: Multilevel, Longitudinal and Structural Equation Models; Chapman and Hall/CRC: London, UK, 2004. [Google Scholar]
- Hair, J.F.; Black, W.C.; Babin, B.J.; Anderson, R.E. Multivariate Data Analysis, 7th ed.; Pearson Prentice Hall: Hoboken, NJ, USA, 2009. [Google Scholar]
- Hawrysz, I.; Wadolowska, L.; Slowinska, M.A.; Czerwinska, A.; Golota, J.J. Adherence to Prudent and Mediterranean dietary patterns is inversely associated with lung cancer in moderate but not heavy male Polish smokers: A case-control study. Nutrients 2020, 12, 3788. [Google Scholar] [CrossRef]
- Borges, C.A.; Rinaldi, A.E.; Conde, W.L.; Mainardi, G.M.; Behar, D.; Slater, B. Dietary patterns: A literature review of methodological characteristics of the main step in multivariate analyzes. Rev. Bras. Epidemiol. 2015, 18, 837–857. [Google Scholar] [CrossRef] [Green Version]

| Food Groups | Food Items Included |
|---|---|
| Rice and rice products | Rice and other rice products, such as rice noodles and rice cakes |
| Corn and corn products | Milled corn, corn on a cob, and other corn products like cornstarch, corn pudding, popcorn, and corn chips |
| Other cereal products | Pandesal, bread, cookies/biscuits, cakes/pastries, noodles, flour, and others |
| Starchy roots and tubers | Sweet potatoes and products, potatoes and products, cassava and products, and other roots and tubers such as yam, taro, and arrowroot |
| Sugar and syrups | Sugars, jams, candies, honey, sweetened soda, sherbet, ice drop, ice candy, sugary foods like chocolates, and others |
| Dried beans, nuts, and seeds | Mungbean and products, soybeans and products, nuts and products, and other dried beans/seeds and products like almond, peas, sesame seed, green peas, tofu, and others |
| Green leafy and yellow vegetables | Green leafy vegetables, squash fruit, carrot, and other yellow vegetables |
| Other vegetables | Eggplant, string beans, bitter gourd, other wild vegetables, and other canned/processed vegetables |
| Fruits | Mango, citrus fruits, strawberry, guava, banana, watermelon, melon, jackfruit, pineapple, young coconut, and others |
| Fish and fish products | Fresh fish, dried fish, processed fish, crustaceans, and mollusks |
| Meat and meat products | Fresh meat, organ meat, and processed meat |
| Poultry | Chicken and other fowls like duck, goose, pigeon, turkey |
| Eggs | Hen’s egg, duck’s egg, and other eggs like quail egg and turkey egg |
| Milk and milk products | Fresh whole milk, evaporated milk, recombined milk, powdered milk, condensed milk, cheese, and other milk products like ice cream, yogurt, and cultured milk |
| Fats and oils | Cooking oil, coconut meat, coconut cream, pork drippings and lard, butter, margarine, peanut butter, and others |
| Beverages | Coffee, tea, alcoholic beverages, chocolate-based beverages, fruit-flavored drink, and others |
| Condiments and spices | Salt, vinegar, catsup, and other seasonings |
| Other miscellaneous food | Lemongrass, bay leaves, oregano, turmeric, food coloring, and others |
| Variables 1 | % | 95% CI |
|---|---|---|
| Sex | ||
| Male | 49.5 | 48.3, 50.6 |
| Female | 50.5 | 49.4, 51.7 |
| Age group | ||
| 20–39 years | 47.5 | 46.0, 49.0 |
| 40–59 years | 37.6 | 36.3, 39.0 |
| ≥60 years | 14.9 | 13.9, 15.9 |
| Educational attainment | ||
| Elementary and lower | 30.8 | 28.6, 33.0 |
| High school | 37.8 | 36.1, 39.6 |
| College and higher | 31.4 | 29.2, 33.6 |
| Marital status | ||
| Single | 24.5 | 22.9, 26.1 |
| Married | 65.5 | 63.8, 67.2 |
| Others | 10.0 | 9.2, 10.9 |
| Employment status | ||
| Employed | 60.1 | 58.6, 61.5 |
| Unemployed | 39.9 | 38.5, 41.4 |
| Household size | ||
| 1–3 | 31.5 | 29.3, 33.9 |
| 4–6 | 46.2 | 43.4, 49.1 |
| ≥7 | 22.2 | 19.8, 24.8 |
| Wealth quintile | ||
| Poorest | 17.1 | 14.9, 19.7 |
| Poor | 18.6 | 16.6, 20.7 |
| Middle | 20.5 | 18.5, 22.7 |
| Rich | 20.7 | 18.7, 22.9 |
| Richest | 23.1 | 20.5, 26.0 |
| Current smoker | ||
| Yes | 27.0 | 25.5, 28.5 |
| No | 73.0 | 71.5, 74.5 |
| Current alcohol drinker | ||
| Yes | 51.6 | 49.6, 53.7 |
| No | 48.4 | 46.3, 50.4 |
| Physical activity | ||
| Low | 44.7 | 42.0, 47.3 |
| High | 55.3 | 52.7, 58.0 |
| Food Groups | Dietary Patterns 1 | |||||
|---|---|---|---|---|---|---|
| Rice | Cereal, Milk, Sugar, and Oil | Fruits and Miscellaneous Food | Fish | Vegetables and Corn | Meat and Beverage | |
| Rice and rice products | 0.936 | −0.009 | −0.001 | 0.142 | 0.064 | 0.069 |
| Corn and corn products | −0.331 | −0.099 | −0.045 | 0.046 | 0.294 | 0.004 |
| Other cereal products | −0.024 | 0.475 | −0.005 | −0.040 | −0.071 | 0.092 |
| Starchy roots and tubers | −0.046 | −0.003 | 0.037 | 0.007 | 0.145 | 0.017 |
| Sugar and syrups | 0.049 | 0.327 | 0.029 | 0.004 | −0.011 | 0.198 |
| Dried beans, nuts, and seeds | 0.051 | 0.081 | −0.027 | −0.070 | 0.049 | 0.023 |
| Green leafy and yellow vegetables | 0.007 | −0.105 | 0.003 | −0.002 | 0.491 | −0.073 |
| Other vegetables | 0.119 | 0.038 | 0.042 | −0.118 | 0.295 | −0.049 |
| Fruits | −0.007 | 0.077 | 0.570 | 0.023 | 0.065 | 0.000 |
| Fish and fish products | 0.113 | −0.031 | 0.018 | 0.741 | −0.054 | −0.050 |
| Meat and meat products | 0.072 | 0.205 | 0.016 | −0.133 | −0.073 | 0.525 |
| Poultry | 0.077 | 0.208 | 0.028 | −0.079 | −0.038 | 0.153 |
| Eggs | 0.103 | 0.185 | 0.026 | −0.088 | −0.042 | 0.016 |
| Milk and milk products | −0.055 | 0.281 | 0.089 | −0.008 | −0.003 | 0.057 |
| Fats and oils | 0.028 | 0.266 | 0.024 | 0.024 | 0.005 | 0.003 |
| Beverages | −0.009 | 0.054 | −0.008 | 0.018 | 0.004 | 0.312 |
| Condiments and spices | −0.039 | 0.173 | −0.007 | 0.109 | −0.024 | 0.145 |
| Other miscellaneous | 0.030 | 0.058 | 0.514 | −0.001 | 0.050 | 0.004 |
| Proportion variance, % | 5.8 | 3.7 | 3.4 | 3.5 | 2.6 | 2.7 |
| Cumulative variance, % | 5.8 | 9.5 | 12.9 | 16.4 | 19.0 | 21.7 |
| Variables | Rice Pattern | Cereal, Milk, Sugar, and Oil Pattern | Fruits and Miscellaneous Food Pattern | Fish Pattern | Vegetables and Corn Pattern | Meat and Beverage Pattern | ||||||
|---|---|---|---|---|---|---|---|---|---|---|---|---|
| T2 and T3 vs. T1 | T3 vs. T1 or T2 | T2 and T3 vs. T1 | T3 vs. T1 or T2 | T2 and T3 vs. T1 | T3 vs. T1 or T2 | T2 and T3 vs. T1 | T3 vs. T1 or T2 | T2 and T3 vs. T1 | T3 vs. T1 or T2 | T2 and T3 vs. T1 | T3 vs. T1 or T2 | |
| Sex (ref. = male) | ||||||||||||
| Female | 0.18 (0.16, 0.21) | 0.29 (0.25, 0.33) | 0.96 (0.85, 1.09) | 1.18 (1.05, 1.33) | 1.35 (1.19, 1.53) | 1.83 (1.59, 2.11) | 0.64 (0.57, 0.72) | 0.76 (0.67, 0.86) | 0.63 (0.56, 0.70) | 0. 60 (0.53, 0.67) | 0.73 (0.64, 0.82) | 0.82 (0.72, 0.93) |
| Age group (ref. = 20–39 years) | ||||||||||||
| 40–59 years | 0.75 (0.67, 0.85) | 0.80 (0.71, 0.92) | 0.84 (0.74, 0.96) | 0.87 (0.76, 1.00) | 1.20 (1.07, 1.36) | 1.15 (1.02, 1.31) | 1.04 (0.93, 1.17) | 1.10 (0.97, 1.24) | 1.20 (1.06, 1.36) | 1.07 (0.95, 1.20) | 0.75 (0.66, 0.86) | 0.78 (0.68, 0.89) |
| ≥60 years | 0.36 (0.30, 0.43) | 0.45 (0.38, 0.54) | 0.81 (0.67, 0.97) | 0.87 (0.72, 1.04) | 1.65 (1.40, 1.94) | 1.88 (1.58, 2.25) | 1.04 (0.88, 1.22) | 1.16 (0.97, 1.39) | 1.05 (0.88, 1.26) | 0.95 (0.80, 1.13) | 0.51 (0.42, 0.61) | 0.58 (0.48, 0.70) |
| Educational attainment (ref. = ≤ elementary) | ||||||||||||
| High school | 1.07 (0.94, 1.21) | 1.29 (1.12, 1.48) | 1.77 (1.51, 2.07) | 1.73 (1.52, 1.97) | 1.29 (1.13, 1.47) | 1.03 (0.89, 1.20) | 0.90 (0.79, 1.03) | 0.91 (0.79, 1.05) | 0.94 (0.82, 1.07) | 0.97 (0.85, 1.10) | 1.47 (1.28, 1.68) | 1.28 (1.13, 1.46) |
| ≥College | 0.83 (0.70, 0.97) | 0.93 (0.76, 1.13) | 2.52 (2.05, 3.09) | 2.37 (1.94, 2.90) | 1.58 (1.33, 1.89) | 1.22 (1.04, 1.44) | 0.92 (0.77, 1.09) | 0.85 (0.72, 0.99) | 0.95 (0.81, 1.12) | 0.89 (0.74, 1.08) | 2.01 (1.70, 2.38) | 1.69 (1.42, 2.02) |
| Marital status (ref. = single) | ||||||||||||
| Married | 1.21 (1.05, 1.38) | 1.23 (1.06, 1.43) | 0.95 (0.82, 1.09) | 0.92 (0.79, 1.07) | 1.08 (0.94, 1.23) | 1.01 (0.88, 1.17) | 1.30 (1.13, 1.49) | 1.36 (1.18, 1.57) | 1.19 (1.03, 1.38) | 1.19 (1.04, 1.35) | 0.89 (0.77, 1.03) | 0.96 (0.81, 1.13) |
| Others | 0.84 (0.65, 1.07) | 0.88 (0.72, 1.09) | 1.03 (0.83, 1.28) | 1.02 (0.82, 1.26) | 0.90 (0.73, 1.10) | 0.93 (0.75, 1.15) | 1.07 (0.87, 1.33) | 1.03 (0.84, 1.26) | 0.89 (0.71, 1.11) | 0.82 (0.65, 1.03) | 0.86 (0.68, 1.08) | 0.90 (0.73, 1.12) |
| Employment status (ref. = employed) | ||||||||||||
| Unemployed | 1.15 (1.02, 1.29) | 1.08 (0.97, 1.20) | 0.87 (0.78, 0.97) | 0.81 (0.72, 0.92) | 0.94 (0.83, 1.05) | 1.08 (0.95, 1.24) | 0.95 (0.85, 1.06) | 1.02 (0.91, 1.13) | 0.98 (0.88, 1.10) | 0.90 (0.80, 1.00) | 0.71 (0.63, 0.80) | 0.74 (0.67, 0.83) |
| Household size (ref. = 1–3) | ||||||||||||
| 4–6 | 1.14 (1.01, 1.30) | 1.18 (1.04, 1.36) | 0.92 (0.80, 1.06) | 0.96 (0.83, 1.11) | 0.86 (0.75, 0.98) | 0.87 (0.77, 0.99) | 1.09 (0.95, 1.25) | 1.03 (0.90, 1.18) | 0.98 (0.86, 1.12) | 0.98 (0.86, 1.13) | 0.98 (0.84, 1.14) | 0.92 (0.80, 1.06) |
| ≥7 | 0.96 (0.81, 1.14) | 0.99 (0.83, 1.19) | 0.99 (0.82, 1.20) | 0.92 (0.77, 1.10) | 0.85 (0.71, 1.01) | 0.92 (0.78, 1.09) | 0.96 (0.80, 1.14) | 0.93 (0.78, 1.11) | 1.00 (0.84, 1.21) | 1.00 (0.84, 1.20) | 0.92 (0.77, 1.11) | 1.02 (0.85, 1.21) |
| Wealth quintile (ref. = poorest) | ||||||||||||
| Poor | 0.98 (0.82, 1.18) | 1.24 (0.99, 1.54) | 1.26 (1.00, 1.59) | 1.47 (1.24, 1.75) | 1.09 (0.89, 1.32) | 1.05 (0.88, 1.26) | 0.99 (0.81, 1.21) | 1.03 (0.84, 1.27) | 0.77 (0.64, 0.94) | 0.90 (0.73, 1.12) | 1.39 (1.12, 1.72) | 1.22 (1.01, 1.46) |
| Middle | 1.06 (0.87, 1.29) | 1.40 (1.12, 1.77) | 1.84 (1.44, 2.34) | 2.48 (2.06, 3.00) | 1.21 (0.98, 1.50) | 1.16 (0.96, 1.39) | 0.99 (0.81, 1.21) | 1.02 (0.83, 1.26) | 0.53 (0.43, 0.66) | 0.76 (0.61, 0.94) | 1.72 (1.37, 2.16) | 1.62 (1.32, 1.99) |
| Rich | 0.88 (0.72, 1.08) | 1.18 (0.93, 1.49) | 2.68 (2.08, 3.45) | 3.66 (2.92, 4.59) | 1.68 (1.37, 2.05) | 1.55 (1.27, 1.89) | 0.94 (0.75, 1.17) | 0.92 (0.75, 1.13) | 0.45 (0.37, 0.56) | 0.71 (0.57, 0.90) | 3.30 (2.61, 4.18) | 3.19 (2.57, 3.96) |
| Richest | 0.62 (0.49, 0.79) | 0.78 (0.60, 1.03) | 3.71 (2.83, 4.85) | 5.63 (4.35, 7.30) | 2.21 (1.78, 2.74) | 1.87 (1.50, 2.33) | 0.90 (0.71, 1.15) | 0.84 (0.67, 1.06) | 0.40 (0.32, 0.50) | 0.58 (0.44, 0.75) | 4.41 (3.43, 5.68) | 3.79 (2.95, 4.87) |
| Current smoker (ref. = yes) | ||||||||||||
| No | 1.17 (1.02, 1.33) | 0.95 (0.82, 1.09) | 1.05 (0.91, 1.20) | 0.96 (0.83, 1.11) | 1.25 (1.09, 1.42) | 0.99 (0.87, 1.11) | 1.09 (0.95, 1.25) | 1.10 (0.95, 1.28) | 1.21 (1.07, 1.36) | 1.19 (1.04, 1.37) | 0.83 (0.72, 0.96) | 0.80 (0.70, 0.92) |
| Current alcohol drinker (ref. = yes) | ||||||||||||
| No | 0.90 (0.80, 1.02) | 0.93 (0.82, 1.05) | 0.83 (0.73, 0.93) | 0.86 (0.76, 0.97) | 1.06 (0.94, 1.18) | 1.06 (0.94, 1.20) | 0.93 (0.82, 1.05) | 0.95 (0.83, 1.08) | 0.92 (0.81, 1.04) | 1.06 (0.93, 1.19) | 0.66 (0.58, 0.75) | 0.74 (0.65, 0.83) |
| Physical activity (ref. = high) | ||||||||||||
| Low | 0.81 (0.72, 0.92) | 0.87 (0.77, 0.99) | 1.17 (1.04, 1.31) | 1.23 (1.09, 1.39) | 1.00 (0.89, 1.13) | 1.00 (0.89, 1.13) | 0.96 (0.86, 1.08) | 0.98 (0.88, 1.09) | 0.80 (0.71, 0.89) | 0.83 (0.74, 0.92) | 1.07 (0.95, 1.21) | 1.01 (0.89, 1.14) |
Publisher’s Note: MDPI stays neutral with regard to jurisdictional claims in published maps and institutional affiliations. |
© 2022 by the authors. Licensee MDPI, Basel, Switzerland. This article is an open access article distributed under the terms and conditions of the Creative Commons Attribution (CC BY) license (https://creativecommons.org/licenses/by/4.0/).
Share and Cite
de Juras, A.R.; Hsu, W.-C.; Hu, S.C. Dietary Patterns and Their Association with Sociodemographic and Lifestyle Factors in Filipino Adults. Nutrients 2022, 14, 886. https://doi.org/10.3390/nu14040886
de Juras AR, Hsu W-C, Hu SC. Dietary Patterns and Their Association with Sociodemographic and Lifestyle Factors in Filipino Adults. Nutrients. 2022; 14(4):886. https://doi.org/10.3390/nu14040886
Chicago/Turabian Stylede Juras, Aileen R., Wan-Chen Hsu, and Susan C. Hu. 2022. "Dietary Patterns and Their Association with Sociodemographic and Lifestyle Factors in Filipino Adults" Nutrients 14, no. 4: 886. https://doi.org/10.3390/nu14040886
APA Stylede Juras, A. R., Hsu, W.-C., & Hu, S. C. (2022). Dietary Patterns and Their Association with Sociodemographic and Lifestyle Factors in Filipino Adults. Nutrients, 14(4), 886. https://doi.org/10.3390/nu14040886