
Dietary Patterns and Prevalent NAFLD at Year 25 from the Coronary Artery Risk Development in Young Adults (CARDIA) Study

 , ,
, ,
Abstract
:1. Introduction
2. Materials and Methods
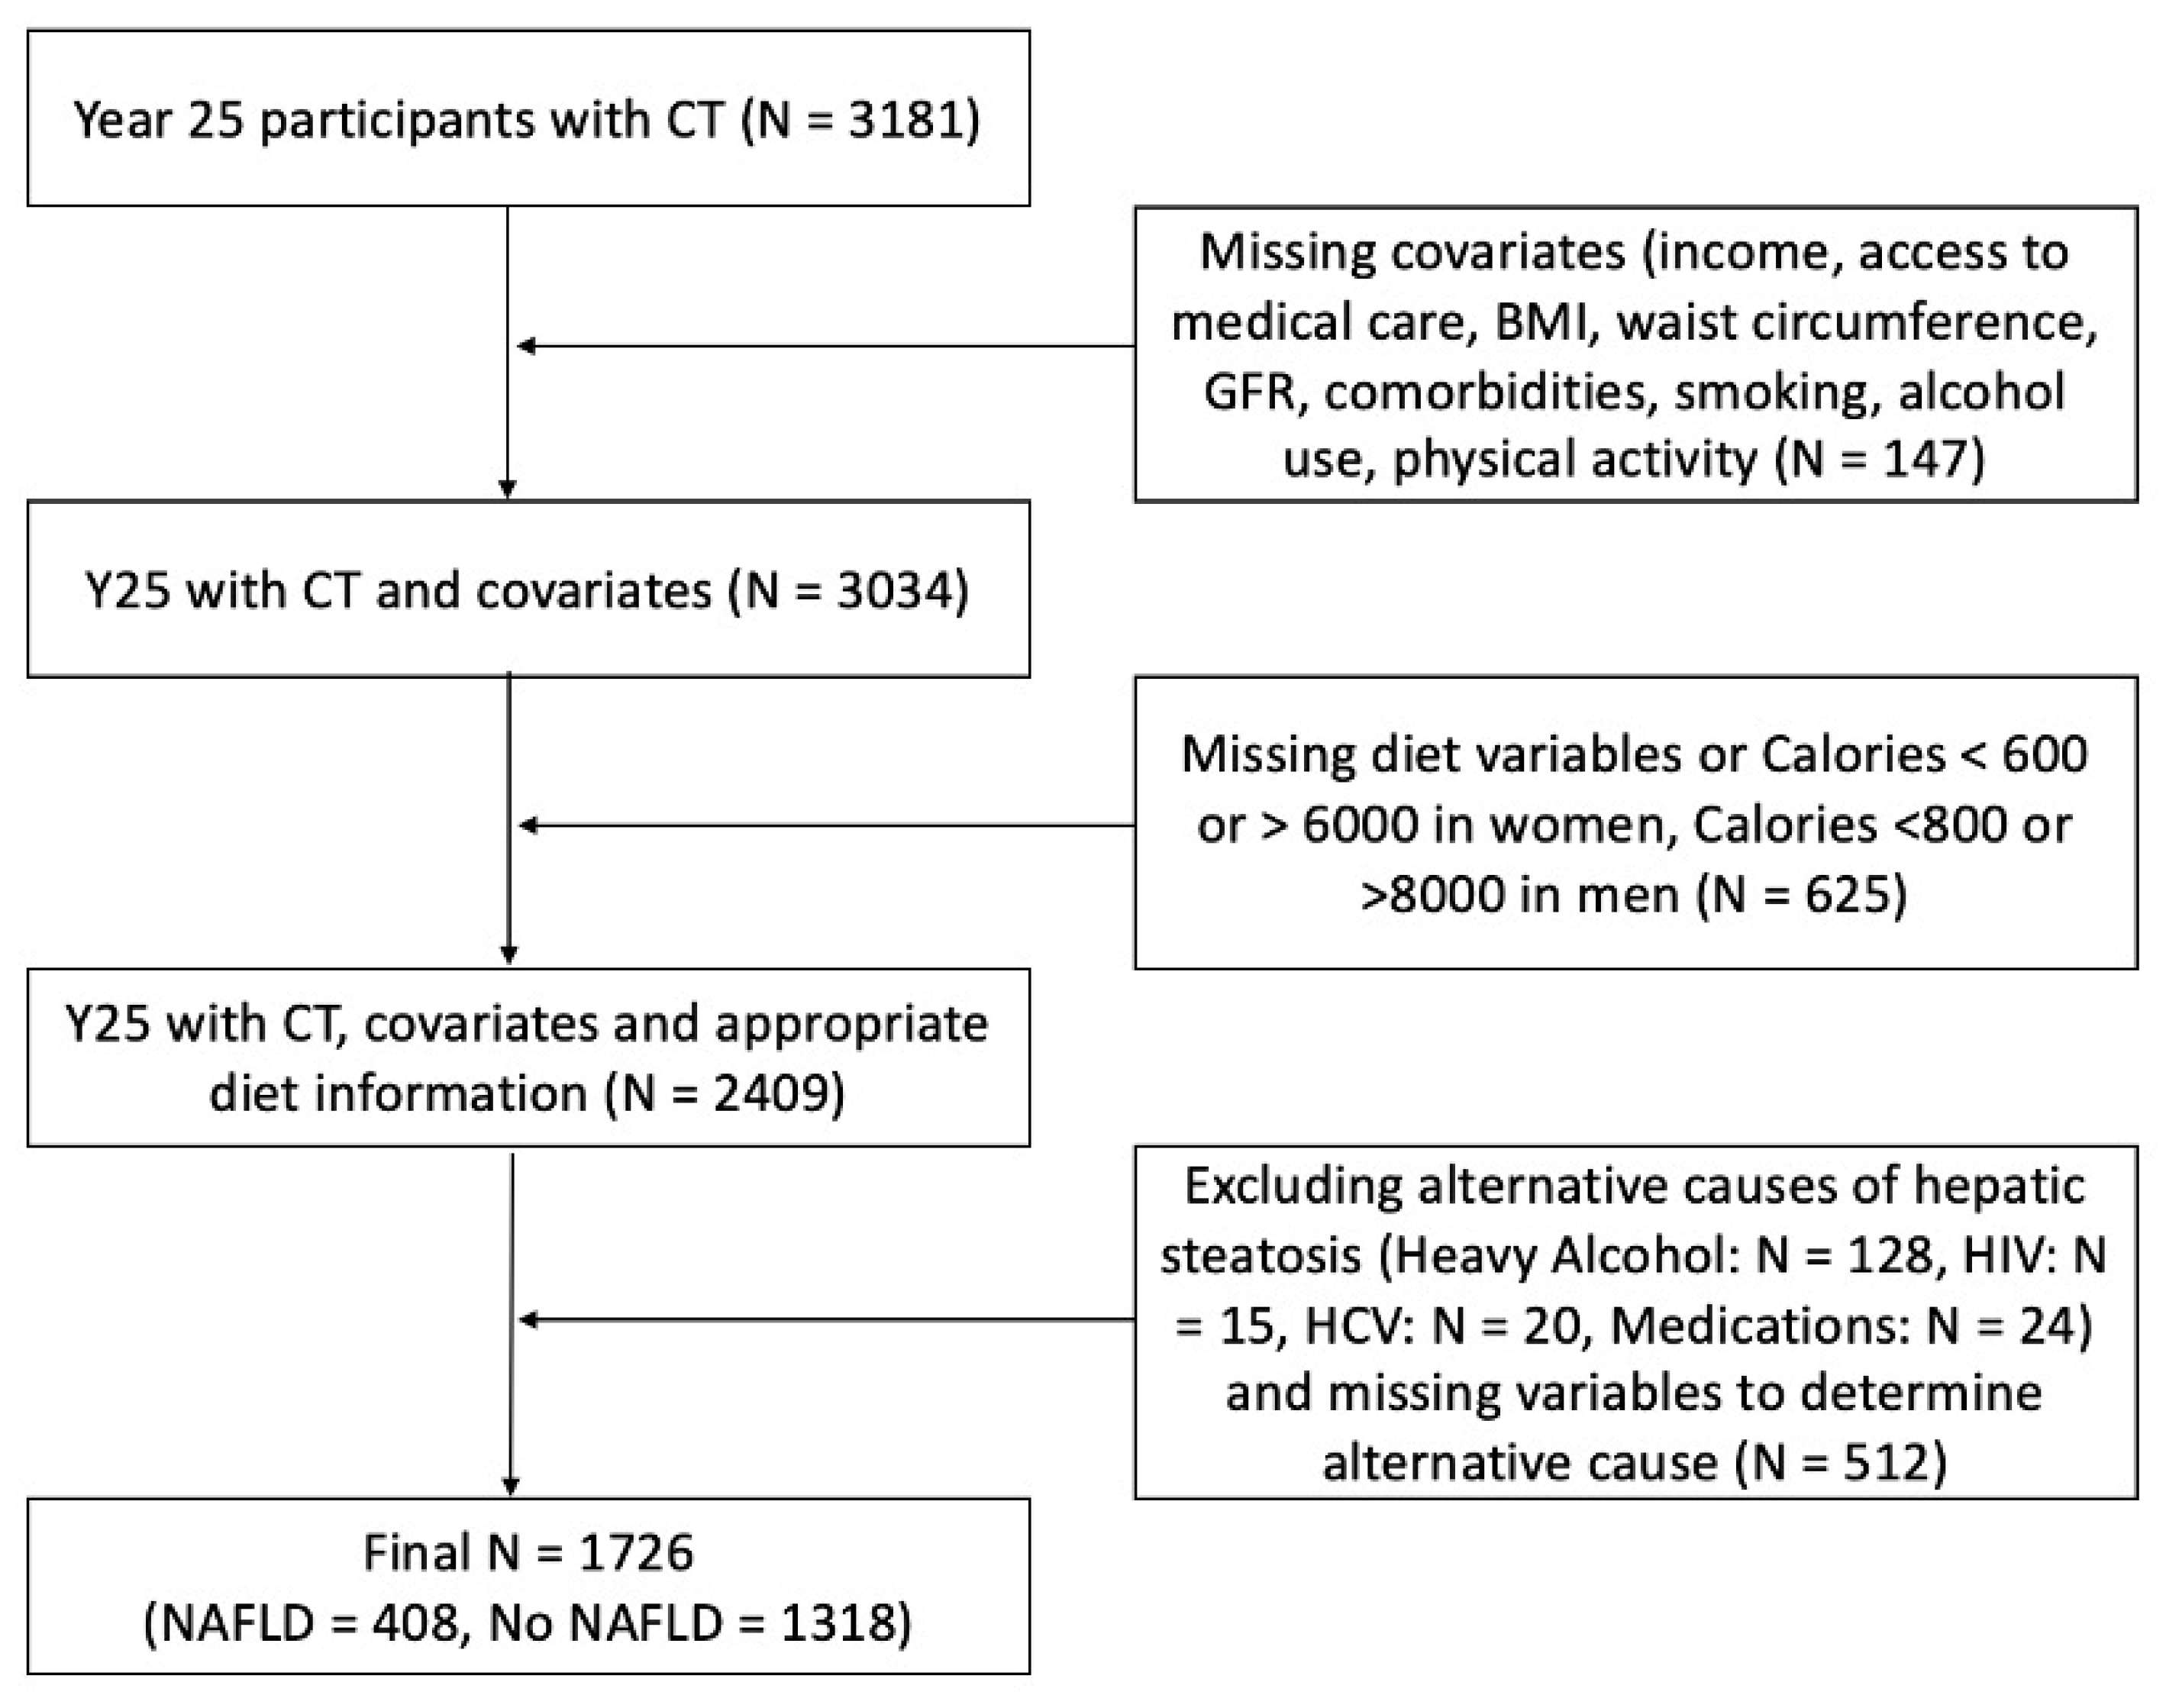
2.1. Study Design and Sample
2.2. Data Collection
2.3. Diet Measure and Dietary Pattern Scores
2.4. Assessment of Hepatic Steatosis
2.5. Statistical Analysis
3. Results
4. Discussion
Supplementary Materials
Author Contributions
Funding
Institutional Review Board Statement
Informed Consent Statement
Data Availability Statement
Acknowledgments
Conflicts of Interest
References
- Vernon, G.; Baranova, A.; Younossi, Z.M. Systematic review: The epidemiology and natural history of non-alcoholic fatty liver disease and non-alcoholic steatohepatitis in adults. Aliment. Pharmacol. Ther. 2011, 34, 274–285. [Google Scholar] [CrossRef] [PubMed]
- Browning, J.D.; Szczepaniak, L.S.; Dobbins, R.; Nuremberg, P.; Horton, J.D.; Cohen, J.C.; Grundy, S.M.; Hobbs, H.H. Prevalence of hepatic steatosis in an urban population in the United States: Impact of ethnicity. Hepatology 2004, 40, 1387–1395. [Google Scholar] [CrossRef] [PubMed]
- Hydes, T.J.; Ravi, S.; Loomba, R.; Gray, M.E. Evidence-based clinical advice for nutrition and dietary weight loss strategies for the management of NAFLD and NASH. Clin. Mol. Hepatol. 2020, 26, 383–400. [Google Scholar] [CrossRef] [PubMed]
- Ma, J.; Hennein, R.; Liu, C.; Long, M.T.; Hoffmann, U.; Jacques, P.F.; Lichtenstein, A.H.; Hu, F.B.; Levy, D. Improved Diet Quality Associates With Reduction in Liver Fat, Particularly in Individuals with High Genetic Risk Scores for Nonalcoholic Fatty Liver Disease. Gastroenterology 2018, 155, 107–117. [Google Scholar] [CrossRef] [PubMed] [Green Version]
- Maskarinec, G.; Lim, U.; Jacobs, S.; Monroe, K.R.; Ernst, T.; Buchthal, S.D.; Shepherd, J.A.; Wilkens, L.R.; Le Marchand, L.; Boushey, C.J. Diet Quality in Midadulthood Predicts Visceral Adiposity and Liver Fatness in Older Ages: The Multiethnic Cohort Study. Obesity 2017, 25, 1442–1450. [Google Scholar] [CrossRef] [PubMed]
- Park, S.Y.; Shvetsov, Y.B.; Kang, M.; Setiawan, V.W.; Wilkens, L.R.; Le Marchand, L.; Boushey, C.J. Changes in Diet Quality over 10 Years Are Associated with Baseline Sociodemographic and Lifestyle Factors in the Multiethnic Cohort Study. J. Nutr. 2020, 150, 1880–1888. [Google Scholar] [CrossRef]
- Yoo, E.R.; Kim, D.; Vazquez-Montesino, L.M.; Escober, J.A.; Li, A.A.; Tighe, S.P.; Fernandes, C.T.; Cholankeril, G.; Ahmed, A. Diet quality and its association with nonalcoholic fatty liver disease and all-cause and cause-specific mortality. Liver Int. Off. J. Int. Assoc. Study Liver 2020, 40, 815–824. [Google Scholar] [CrossRef]
- Jia, Q.; Xia, Y.; Zhang, Q.; Wu, H.; Du, H.; Liu, L.; Wang, C.; Shi, H.; Guo, X.; Liu, X.; et al. Dietary patterns are associated with prevalence of fatty liver disease in adults. Eur. J. Clin. Nutr. 2015, 69, 914–921. [Google Scholar] [CrossRef]
- Yang, C.Q.; Shu, L.; Wang, S.; Wang, J.J.; Zhou, Y.; Xuan, Y.J.; Wang, S.F. Dietary Patterns Modulate the Risk of Non-Alcoholic Fatty Liver Disease in Chinese Adults. Nutrients 2015, 7, 4778–4791. [Google Scholar] [CrossRef] [Green Version]
- Liu, X.; Peng, Y.; Chen, S.; Sun, Q. An observational study on the association between major dietary patterns and non-alcoholic fatty liver disease in Chinese adolescents. Medicine 2018, 97, e0576. [Google Scholar] [CrossRef]
- Kalafati, I.P.; Borsa, D.; Dimitriou, M.; Revenas, K.; Kokkinos, A.; Dedoussis, G.V. Dietary patterns and non-alcoholic fatty liver disease in a Greek case-control study. Nutrition 2019, 61, 105–110. [Google Scholar] [CrossRef] [PubMed]
- Mazidi, M.; Ofori-Asenso, R.; Kengne, A.P. Dietary patterns are associated with likelihood of hepatic steatosis among US adults. J. Gastroenterol. Hepatol. 2020, 35, 1916–1922. [Google Scholar] [CrossRef] [PubMed]
- Friedman, G.D.; Cutter, G.R.; Donahue, R.P.; Hughes, G.H.; Hulley, S.B.; Jacobs, D.R., Jr.; Liu, K.; Savage, P.J. CARDIA: Study design, recruitment, and some characteristics of the examined subjects. J. Clin. Epidemiol. 1988, 41, 1105–1116. [Google Scholar] [CrossRef]
- Westwood, A.; Bullock, D.G.; Whitehead, T.P. An examination of the hexokinase method for serum glucose assay using external quality assessment data. Ann. Clin. Biochem. 1986, 23, 92–96. [Google Scholar] [CrossRef]
- Sapin, R.; Le Galudec, V.; Gasser, F.; Pinget, M.; Grucker, D. Elecsys insulin assay: Free insulin determination and the absence of cross-reactivity with insulin lispro. Clin. Chem. 2001, 47, 602–605. [Google Scholar] [CrossRef] [Green Version]
- Warnick, G.R. Enzymatic methods for quantification of lipoprotein lipids. Methods Enzym. 1986, 129, 101–123. [Google Scholar] [CrossRef]
- Fukuyama, N.; Homma, K.; Wakana, N.; Kudo, K.; Suyama, A.; Ohazama, H.; Tsuji, C.; Ishiwata, K.; Eguchi, Y.; Nakazawa, H.; et al. Validation of the Friedewald Equation for Evaluation of Plasma LDL-Cholesterol. J. Clin. Biochem. Nutr. 2008, 43, 1–5. [Google Scholar] [CrossRef] [Green Version]
- Friedewald, W.T.; Levy, R.I.; Fredrickson, D.S. Estimation of the concentration of low-density lipoprotein cholesterol in plasma, without use of the preparative ultracentrifuge. Clin. Chem. 1972, 18, 499–502. [Google Scholar] [CrossRef]
- Grundy, S.M.; Brewer, H.B., Jr.; Cleeman, J.I.; Smith, S.C.; Lenfant, C. Definition of metabolic syndrome: Report of the National Heart, Lung, and Blood Institute/American Heart Association conference on scientific issues related to definition. Arterioscler. Thromb. Vasc. Biol. 2004, 24, e13–e18. [Google Scholar] [CrossRef] [Green Version]
- Parker, E.D.; Schmitz, K.H.; Jacobs, D.R., Jr.; Dengel, D.R.; Schreiner, P.J. Physical activity in young adults and incident hypertension over 15 years of follow-up: The CARDIA study. Am. J. Public Health 2007, 97, 703–709. [Google Scholar] [CrossRef]
- Shikany, J.M.; Jacobs, D.R., Jr.; Lewis, C.E.; Steffen, L.M.; Sternfeld, B.; Carnethon, M.R.; Richman, J.S. Associations between food groups, dietary patterns, and cardiorespiratory fitness in the Coronary Artery Risk Development in Young Adults study. Am. J. Clin. Nutr. 2013, 98, 1402–1409. [Google Scholar] [CrossRef] [PubMed] [Green Version]
- Davidson, L.E.; Kuk, J.L.; Church, T.S.; Ross, R. Protocol for measurement of liver fat by computed tomography. J. Appl. Physiol. 2006, 100, 864–868. [Google Scholar] [CrossRef] [PubMed] [Green Version]
- Kodama, Y.; Ng, C.S.; Wu, T.T.; Ayers, G.D.; Curley, S.A.; Abdalla, E.K.; Vauthey, J.N.; Charnsangavej, C. Comparison of CT methods for determining the fat content of the liver. AJR Am. J. Roentgenol. 2007, 188, 1307–1312. [Google Scholar] [CrossRef] [PubMed] [Green Version]
- VanWagner, L.B.; Ning, H.; Lewis, C.E.; Shay, C.M.; Wilkins, J.; Carr, J.J.; Terry, J.G.; Lloyd-Jones, D.M.; Jacobs, D.R., Jr.; Carnethon, M.R. Associations between nonalcoholic fatty liver disease and subclinical atherosclerosis in middle-aged adults: The Coronary Artery Risk Development in Young Adults Study. Atherosclerosis 2014, 235, 599–605. [Google Scholar] [CrossRef] [Green Version]
- Zeb, I.; Li, D.; Nasir, K.; Katz, R.; Larijani, V.N.; Budoff, M.J. Computed tomography scans in the evaluation of fatty liver disease in a population based study: The multi-ethnic study of atherosclerosis. Acad. Radiol. 2012, 19, 811–818. [Google Scholar] [CrossRef] [Green Version]
- Park, S.H.; Kim, P.N.; Kim, K.W.; Lee, S.W.; Yoon, S.E.; Park, S.W.; Ha, H.K.; Lee, M.G.; Hwang, S.; Lee, S.G.; et al. Macrovesicular hepatic steatosis in living liver donors: Use of CT for quantitative and qualitative assessment. Radiology 2006, 239, 105–112. [Google Scholar] [CrossRef]
- Boyce, C.J.; Pickhardt, P.J.; Kim, D.H.; Taylor, A.J.; Winter, T.C.; Bruce, R.J.; Lindstrom, M.J.; Hinshaw, J.L. Hepatic steatosis (fatty liver disease) in asymptomatic adults identified by unenhanced low-dose CT. AJR Am. J. Roentgenol. 2010, 194, 623–628. [Google Scholar] [CrossRef]
- Hashemi Kani, A.; Alavian, S.M.; Esmaillzadeh, A.; Adibi, P.; Azadbakht, L. Dietary Quality Indices and Biochemical Parameters Among Patients With Non Alcoholic Fatty Liver Disease (NAFLD). Hepat. Mon. 2013, 13, e10943. [Google Scholar] [CrossRef] [Green Version]
- Chan, R.; Wong, V.W.; Chu, W.C.; Wong, G.L.; Li, L.S.; Leung, J.; Chim, A.M.; Yeung, D.K.; Sea, M.M.; Woo, J.; et al. Diet-Quality Scores and Prevalence of Nonalcoholic Fatty Liver Disease: A Population Study Using Proton-Magnetic Resonance Spectroscopy. PLoS ONE 2015, 10, e0139310. [Google Scholar] [CrossRef] [Green Version]
- Park, S.Y.; Noureddin, M.; Boushey, C.; Wilkens, L.R.; Setiawan, V.W. Diet Quality Association with Nonalcoholic Fatty Liver Disease by Cirrhosis Status: The Multiethnic Cohort. Curr. Dev. Nutr. 2020, 4, nzaa024. [Google Scholar] [CrossRef]
- Bozzetto, L.; Prinster, A.; Annuzzi, G.; Costagliola, L.; Mangione, A.; Vitelli, A.; Mazzarella, R.; Longobardo, M.; Mancini, M.; Vigorito, C.; et al. Liver fat is reduced by an isoenergetic MUFA diet in a controlled randomized study in type 2 diabetic patients. Diabetes Care 2012, 35, 1429–1435. [Google Scholar] [CrossRef] [PubMed] [Green Version]
- Bjermo, H.; Iggman, D.; Kullberg, J.; Dahlman, I.; Johansson, L.; Persson, L.; Berglund, J.; Pulkki, K.; Basu, S.; Uusitupa, M.; et al. Effects of n-6 PUFAs compared with SFAs on liver fat, lipoproteins, and inflammation in abdominal obesity: A randomized controlled trial. Am. J. Clin. Nutr. 2012, 95, 1003–1012. [Google Scholar] [CrossRef] [PubMed] [Green Version]
- Errazuriz, I.; Dube, S.; Slama, M.; Visentin, R.; Nayar, S.; O’Connor, H.; Cobelli, C.; Das, S.K.; Basu, A.; Kremers, W.K.; et al. Randomized Controlled Trial of a MUFA or Fiber-Rich Diet on Hepatic Fat in Prediabetes. J. Clin. Endocrinol. Metab. 2017, 102, 1765–1774. [Google Scholar] [CrossRef] [PubMed] [Green Version]
- Maersk, M.; Belza, A.; Stodkilde-Jorgensen, H.; Ringgaard, S.; Chabanova, E.; Thomsen, H.; Pedersen, S.B.; Astrup, A.; Richelsen, B. Sucrose-sweetened beverages increase fat storage in the liver, muscle, and visceral fat depot: A 6-mo randomized intervention study. Am. J. Clin. Nutr. 2012, 95, 283–289. [Google Scholar] [CrossRef] [PubMed]
- Sevastianova, K.; Santos, A.; Kotronen, A.; Hakkarainen, A.; Makkonen, J.; Silander, K.; Peltonen, M.; Romeo, S.; Lundbom, J.; Lundbom, N.; et al. Effect of short-term carbohydrate overfeeding and long-term weight loss on liver fat in overweight humans. Am. J. Clin. Nutr. 2012, 96, 727–734. [Google Scholar] [CrossRef] [PubMed] [Green Version]
- Dixon, J.B.; Bhathal, P.S.; O’Brien, P.E. Nonalcoholic fatty liver disease: Predictors of nonalcoholic steatohepatitis and liver fibrosis in the severely obese. Gastroenterology 2001, 121, 91–100. [Google Scholar] [CrossRef] [PubMed]
- Andersen, T.; Christoffersen, P.; Gluud, C. The liver in consecutive patients with morbid obesity: A clinical, morphological, and biochemical study. Int. J. Obes. 1984, 8, 107–115. [Google Scholar]
- Luyckx, F.H.; Lefebvre, P.J.; Scheen, A.J. Non-alcoholic steatohepatitis: Association with obesity and insulin resistance, and influence of weight loss. Diabetes Metab. 2000, 26, 98–106. [Google Scholar]
- Choi, Y.; Larson, N.; Gallaher, D.D.; Odegaard, A.O.; Rana, J.S.; Shikany, J.M.; Steffen, L.M.; Jacobs, D.R., Jr. A Shift Toward a Plant-Centered Diet From Young to Middle Adulthood and Subsequent Risk of Type 2 Diabetes and Weight Gain: The Coronary Artery Risk Development in Young Adults (CARDIA) Study. Diabetes Care 2020, 43, 2796–2803. [Google Scholar] [CrossRef]

| No NAFLD N = 1318 | NAFLD 1,2 N = 408 | p-Value | |
|---|---|---|---|
| Age (year), mean (SD) | 50.1 (3.6) | 50.3 (3.6) | 0.25 |
| Women (%) | 813 (61.7) | 185 (45.3) | <0.0001 |
| White (%) | 780 (59.2) | 251 (61.5) | 0.40 |
| Socioeconomic status | |||
| Highest grade completed, mean (SD) | 16.04 (2.5) | 15.72 (2.5) | 0.018 |
| Income > $50,000/year (%) | 950 (72.1) | 279 (68.4) | 0.15 |
| Access to medical care | |||
| Report regular medical care (%) | 1215 (92.2) | 383 (93.9) | 0.26 |
| Difficulty accessing healthcare (%) 3 | 133 (10.1) | 36 (8.8) | 0.45 |
| BMI (kg/m2), mean (SD) | 28.2 (6.0) | 34.2 (6.9) | <0.0001 |
| Obese, BMI > 30 (%) | 394 (29.9) | 292 (71.6) | <0.0001 |
| Waist circumference (cm), mean (SD) | 89.1(13.3) | 106.4 (14.0) | <0.0001 |
| Glomerular filtration rate (mL/min/1.73 m2), mean (SD) | 93.9(19.4) | 96.7 (21.3) | 0.020 |
| Comorbidities (%) | |||
| Hyperlipidemia 4 | 225 (17.1) | 186 (45.6) | <0.0001 |
| Hypertension 5 | 401 (30.4) | 199 (48.8) | <0.0001 |
| Diabetes mellitus 6 | 101 (7.7) | 110 (27.0) | <0.0001 |
| Metabolic syndrome 7 | 129 (9.8) | 181 (44.4) | <0.0001 |
| Alcohol use (g/day), median (IQR) | 5.5 (15.2) | 5.1 (15.0) | 0.38 |
| Smoking (%) | 175 (13.3) | 73 (17.9) | 0.020 |
| Physical activity (exercise units/week), median (IQR) | 305 (369) | 270 (335.5) | 0.013 |
| No NAFLD N = 1318 | NAFLD 1,2 N = 408 | p-Value | |
|---|---|---|---|
| Energy intake (kcal/day) | 2276 (985) | 2466 (1111) | 0.002 |
| Food groups (servings/day) | |||
| Fruit | 2.70 (2.31) | 2.42 (2.20) | 0.031 |
| Vegetables (excluding potatoes) | 3.82 (2.65) | 3.72 (2.73) | 0.48 |
| Vegetables, potatoes | 0.43 (0.44) | 0.54 (0.55) | 0.0003 |
| Grains | 6.41 (3.58) | 7.01 (3.69) | 0.004 |
| Meat and fish | 5.12 (3.42) | 6.05 (3.90) | <0.0001 |
| Dairy | 2.47 (2.78) | 2.76 (2.51) | 0.048 |
| Fats | 5.22 (5.74) | 6.14 (8.09) | 0.032 |
| Beans | 0.24 (0.39) | 0.24 (0.35) | 0.96 |
| Eggs/omelets | 0.55 (0.67) | 0.61 (0.55) | 0.089 |
| Seeds, nuts, peanut butter | 1.21 (2.01) | 1.04 (1.61) | 0.077 |
| Salad dressings/sauces | 2.34 (2.02) | 2.33 (1.80) | 0.86 |
| Soups | 0.05 (0.09) | 0.06 (0.09) | 0.10 |
| Soy/nondairy products | 0.73 (1.51) | 0.71 (1.78) | 0.90 |
| Pickled foods | 0.50 (1.51) | 0.43 (0.64) | 0.13 |
| Chocolate | 0.20 (0.45) | 0.19 (0.38) | 0.74 |
| Sweet extras | 1.81 (4.00) | 1.50 (2.56) | 0.068 |
| Sugar substitutes | 0.66 (2.31) | 0.62 (1.96) | 0.69 |
| Beverages | 4.48 (3.26) | 4.98 (3.52) | 0.009 |
| Dietary Score/Pattern | NAFLD 1 N = 408 OR (CI) (Adjusted Model 1) * | p-Value (Adjusted Model 1) * | NAFLD 1 N = 408 OR (CI) (Adjusted Model 2) ** | p-Value (Adjusted Model 2) ** | NAFLD 1 N = 408 OR (CI) (Adjusted Model 3) *** | p-Value (Adjusted Model 3) *** |
|---|---|---|---|---|---|---|
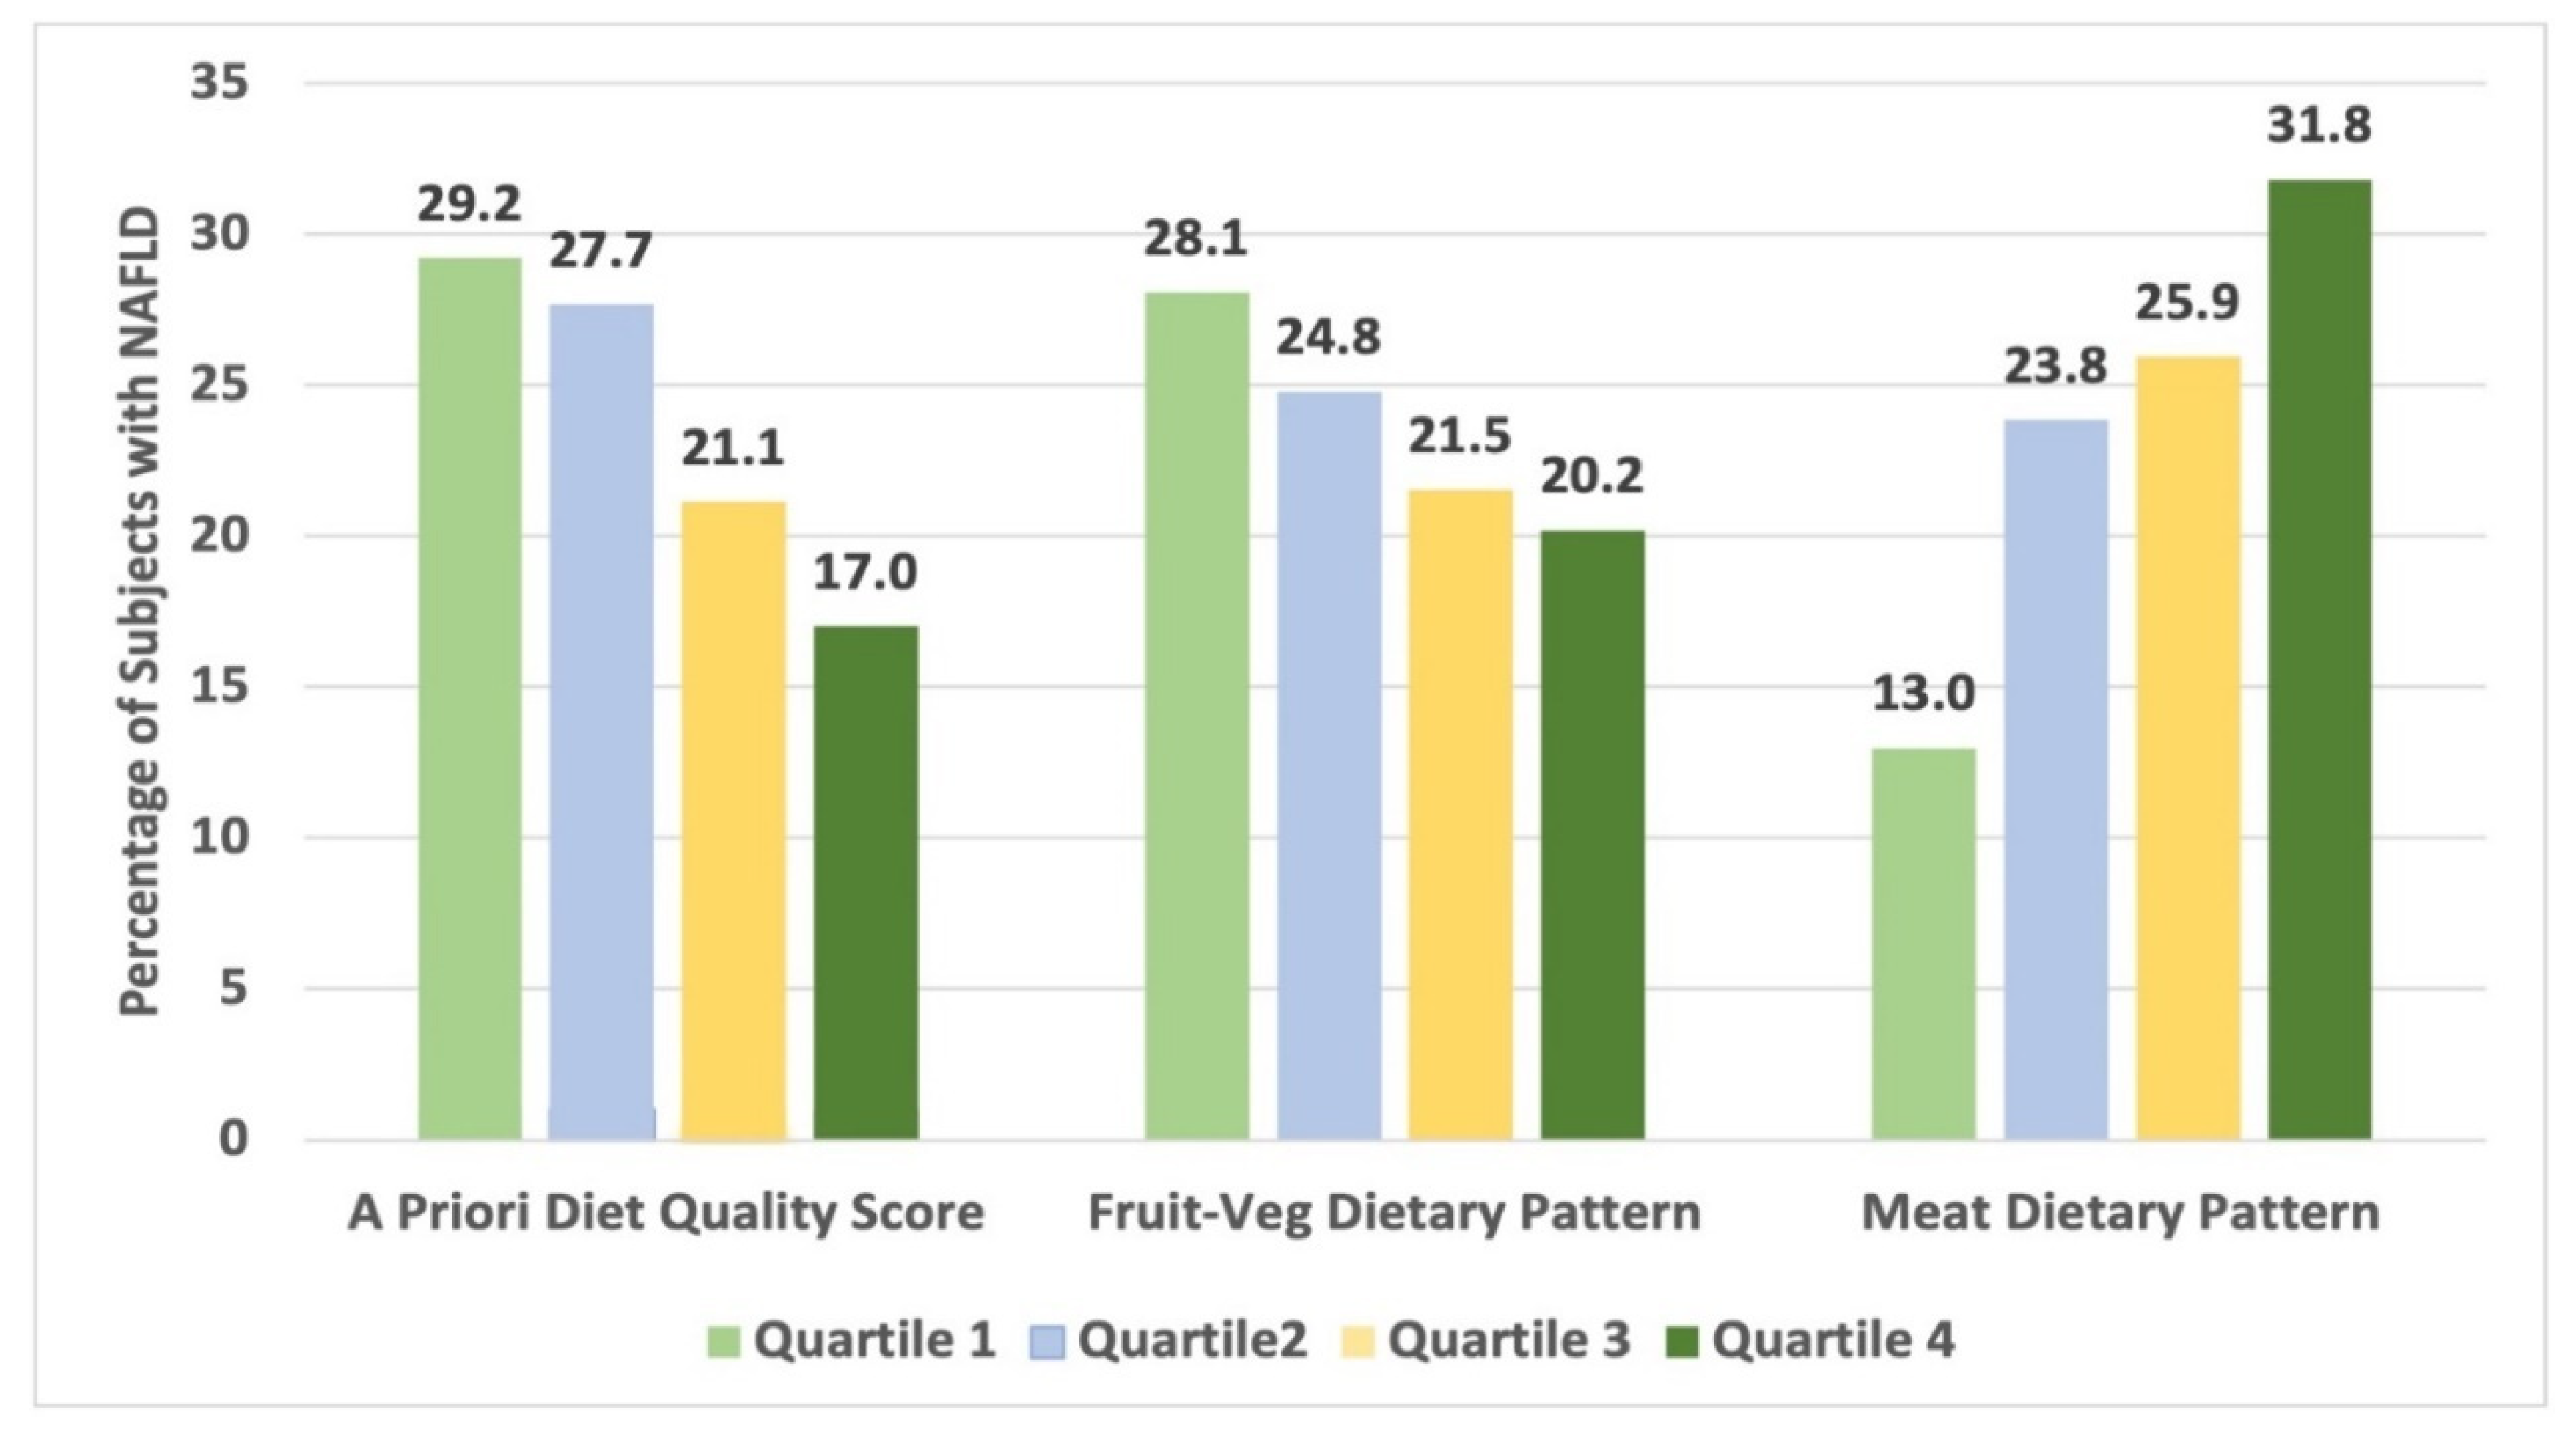
| A priori diet-quality score | 0.004 | 0.040 | 0.12 | |||
| Quartile 2 vs. 1 | 0.95 (0.69, 1.30) | 1.14 (0.8, 1.63) | 1.03 (0.70, 1.50) | |||
| Quartile 3 vs. 1 | 0.67 (0.47, 0.95) | 0.79 (0.54, 1.17) | 0.80 (0.53, 1.21) | |||
| Quartile 4 vs. 1 | 0.53 (0.36, 0.79) | 0.66 (0.43, 1.01) | 0.63 (0.40, 1.00) | |||
| Meat dietary pattern | <0.0001 | 0.014 | 0.27 | |||
| Quartile 2 vs. 1 | 1.93 (1.34, 2.79) | 1.56 (1.05, 2.33) | 1.38 (0.91, 2.09) | |||
| Quartile 3 vs. 1 | 2.08 (1.43, 3.02) | 1.55 (1.04, 2.32) | 1.34 (0.88, 2.04) | |||
| Quartile 4 vs. 1 | 2.70 (1.83, 3.99) | 2.01 (1.32, 3.05) | 1.55 (1.00, 2.42) | |||
| Fruit-vegetable dietary pattern | 0.40 | 0.46 | 0.15 | |||
| Quartile 2 vs. 1 | 0.86 (0.62, 1.19) | 0.85 (0.6, 1.23) | 0.83 (0.56, 1.21) | |||
| Quartile 3 vs. 1 | 0.80 (0.56, 1.13) | 0.86 (0.59, 1.27) | 0.78 (0.52, 1.18) | |||
| Quartile 4 vs. 1 | 0.74 (0.51, 1.06) | 0.72 (0.48, 1.08) | 0.60 (0.39, 0.93) |
Publisher’s Note: MDPI stays neutral with regard to jurisdictional claims in published maps and institutional affiliations. |
© 2022 by the authors. Licensee MDPI, Basel, Switzerland. This article is an open access article distributed under the terms and conditions of the Creative Commons Attribution (CC BY) license (https://creativecommons.org/licenses/by/4.0/).
Share and Cite
Gray, M.E.; Bae, S.; Ramachandran, R.; Baldwin, N.; VanWagner, L.B.; Jacobs, D.R., Jr.; Terry, J.G.; Shikany, J.M. Dietary Patterns and Prevalent NAFLD at Year 25 from the Coronary Artery Risk Development in Young Adults (CARDIA) Study. Nutrients 2022, 14, 854. https://doi.org/10.3390/nu14040854
Gray ME, Bae S, Ramachandran R, Baldwin N, VanWagner LB, Jacobs DR Jr., Terry JG, Shikany JM. Dietary Patterns and Prevalent NAFLD at Year 25 from the Coronary Artery Risk Development in Young Adults (CARDIA) Study. Nutrients. 2022; 14(4):854. https://doi.org/10.3390/nu14040854
Chicago/Turabian StyleGray, Meagan E., Sejong Bae, Rekha Ramachandran, Nicholas Baldwin, Lisa B. VanWagner, David R. Jacobs, Jr., James G. Terry, and James M. Shikany. 2022. "Dietary Patterns and Prevalent NAFLD at Year 25 from the Coronary Artery Risk Development in Young Adults (CARDIA) Study" Nutrients 14, no. 4: 854. https://doi.org/10.3390/nu14040854
APA StyleGray, M. E., Bae, S., Ramachandran, R., Baldwin, N., VanWagner, L. B., Jacobs, D. R., Jr., Terry, J. G., & Shikany, J. M. (2022). Dietary Patterns and Prevalent NAFLD at Year 25 from the Coronary Artery Risk Development in Young Adults (CARDIA) Study. Nutrients, 14(4), 854. https://doi.org/10.3390/nu14040854