Article

Oral Intake of L-Ornithine-L-Aspartate Is Associated with Distinct Microbiome and Metabolome Changes in Cirrhosis

1
Department of Gastroenterology and Hepatology, Medical University of Graz, 8036 Graz, Austria
2
Center of Biomarker Research in Medicine, CBmed GmbH Graz, 8010 Graz, Austria
3
Department of Clinical Medical Nutrition, University Hospital Graz, 8036 Graz, Austria
4
Gottfried Schatz Research Center for Cell Signaling, Metabolism and Aging Molecular Biology and Biochemistry, Medical University of Graz, 8036 Graz, Austria
5
BioTechMed-Graz, 8010 Graz, Austria
*
Author to whom correspondence should be addressed.
Nutrients 2022, 14(4), 748; https://doi.org/10.3390/nu14040748
Submission received: 10 January 2022 / Revised: 7 February 2022 / Accepted: 8 February 2022 / Published: 10 February 2022
(This article belongs to the Special Issue Nutrition and Liver Disease)

Abstract

:
L-ornithine L-aspartate (LOLA) is administered as a therapeutic and/or preventive strategy against hepatic encephalopathy either intravenously or orally in patients with liver cirrhosis. Here, we analyzed how LOLA influences the microbiome and metabolome of patients with liver cirrhosis. We retrospectively analyzed the stool microbiome, stool, urine and serum metabolome as well as markers for gut permeability, inflammation and muscle metabolism of 15 cirrhosis patients treated orally with LOLA for at least one month and 15 propensity-score-matched cirrhosis patients without LOLA. Results were validated by comparing the LOLA-treated patients to a second set of controls. Patients with and without LOLA were comparable in age, sex, etiology and severity of cirrhosis as well as PPI and laxative use. In the microbiome, Flavonifractor and Oscillospira were more abundant in patients treated with LOLA compared to the control group, while alpha and beta diversity were comparable between groups. Differences in stool and serum metabolomes reflected the pathophysiology of hepatic encephalopathy and confirmed LOLA intake. In the urine metabolome, ethanol to acetic acid ratio was lower in patients treated with LOLA compared to controls. LOLA-treated patients also showed lower serum levels of insulin-like growth factor (IGF) 1 than patients without LOLA. No differences in gut permeability or inflammation markers were found. A higher abundance of Flavonifractor and Oscillospira in LOLA-treated patients could indicate LOLA as a potential microbiome modulating strategy in patients with liver disease. The lower levels of IGF1 in patients treated with LOLA suggest a possible link between the pathophysiology of hepatic encephalopathy and muscle health.

1. Introduction

Chronic liver diseases and liver cirrhosis are on the rise in Europe [1]. Hepatic encephalopathy (HE) is one of the most debilitating complications of cirrhosis and is associated with increased morbidity and mortality [2]. Although the pathogenesis is still incompletely understood, currently, it is assumed that protein and urea breakdown by colonic bacteria leads to ammonia release, and due to the reduced capacity of the liver to detoxify, ammonia accumulates and is shunted into the systemic circulation [3,4]. Ammonia accumulates in the brain and has neurotoxic effects, especially on astrocytes [5,6]. Available treatment modalities to lower ammonia include L-ornithine-L-aspartate (LOLA), nonabsorbable disaccharides (lactulose) and nonabsorbable antibiotics (rifaximin) [7]. The amino acids L-ornithine and L-aspartate in LOLA dissociate readily and are consecutively absorbed.
L-ornithine serves as an intermediary in the urea cycle in periportal hepatocytes in the liver and as an activator of carbamoyl phosphate synthetase, and both amino acids also lower ammonia levels by transamination to glutamate via glutamine synthetase in perivenous hepatocytes as well as by skeletal muscle and the brain [8]. Besides these direct effects, additional functions such as hepatoprotective effects or effects on restoring skeletal muscle proteostasis have been proposed but are not fully explained to date [9]. Since oral LOLA comes into contact with the human gut microbiome and the intestinal barrier, effects on the gut microbiome and intestinal permeability may play a role in the clinical effects of LOLA. The gut microbiome is not only involved in ammonia generation and thereby in the pathogenesis of HE, but it is today also understood as a key driver of complications of cirrhosis [10]. The gut microbiome is severely altered in liver cirrhosis in general, with a reduction in bacterial diversity and an increase in potential pathogens [11]. Factors influencing the microbiome in cirrhosis are etiology and severity of liver disease, drug intake, nutritional status, and inflammation [12]. In general, many human-targeted drugs can alter the composition of the gut microbiome [13]. For LOLA thus far, no data are available on its association with gut microbiome composition and metabolomic changes in cirrhosis. Therefore, we aimed to investigate whether LOLA intake in patients with liver cirrhosis is associated with taxonomic and functional changes of the gut microbiome and the urinary, and/or serum and/or fecal metabolome.

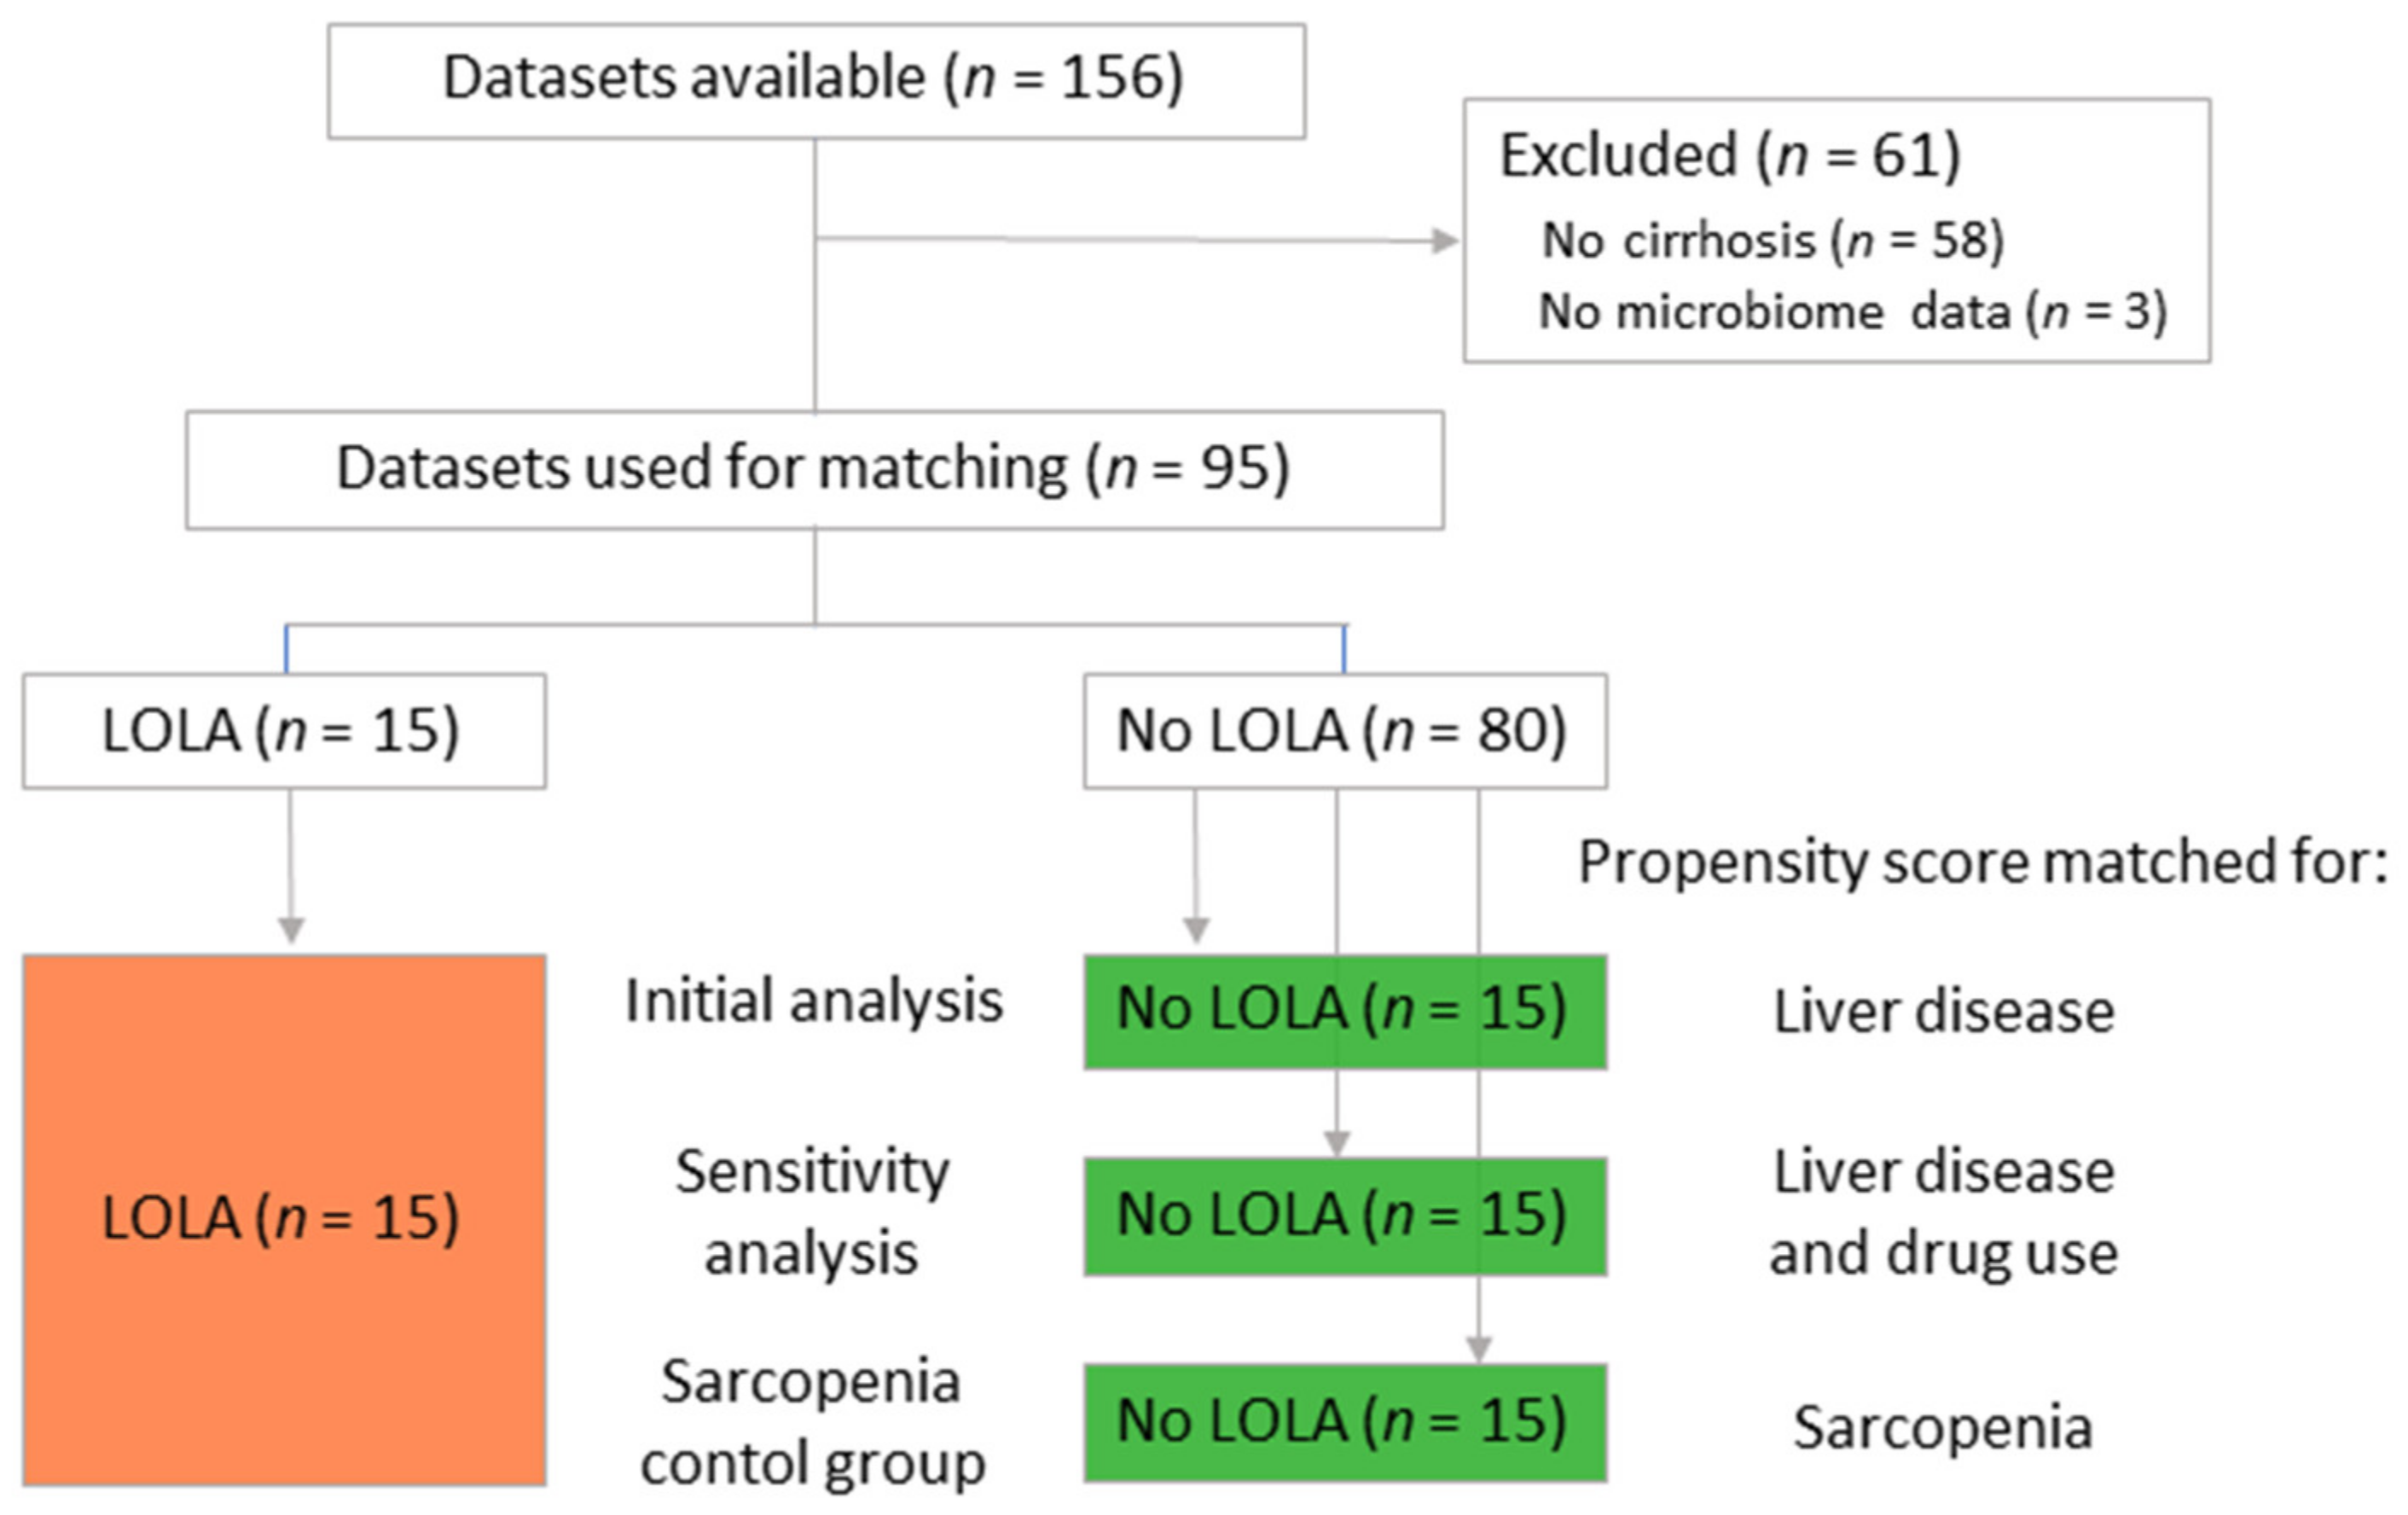
2. Materials and Methods

From an ongoing cohort study (NCT03080129, 29-280 ex 16/17), 15 patients with cirrhosis with oral LOLA intake for at least 1 month and 15 control cirrhotic patients were selected with nearest-neighbor propensity score matching. Propensity score matching was based on cirrhosis severity (Child-Pugh score and MELD-score), using the R package “MatchIt” [14,15]. To avoid overfitting and false positive results, results were validated by comparing the patients receiving LOLA to a second control group. This control group was selected by extending the regression model for nearest neighbor propensity score matching to include etiology of cirrhosis and proton pump inhibitor use in addition to disease severity. Due to this alteration, 9 out of 15 control patients (60%) were replaced. Sarcopenia is a potential confounder in the analysis too. To approximate its influence, LOLA patients were propensity score matched to a third control group of patients not receiving LOLA based on their sarcopenia status (non-sarcopenic, pre-sarcopenic, sarcopenic). To minimize confounding by potentially unbalanced parameters in regard to liver disease, this group comparison was only performed for sarcopenia related biomarkers with Mann–Whitney U tests.
Then, 16S rDNA sequencing data (for details regarding the method, see Supplementary Methods) of these 30 patients were preprocessed with the QIIME 2 pipeline on a local Galaxy instance (https://galaxy.medunigraz.at, accessed on 21 September 2021) [16] and analyzed on the web-based platform “Calypso” V8.84 (https://cgenome.net, accessed on 25 September 2021) [17]. Taxonomic analysis was performed with a Bayesian classifier based on the SILVA V132 database. Low abundance filtering was applied to remove features that were present in only one sample or had less than 10 copies in total; cyanobacteria and chloroplasts were removed as likely contaminants. For alpha diversity approximations, a rarefied feature table with 8427 reads per sample was used to calculate richness, evenness, Chao-1 index and Shannon index. For beta diversity analysis and taxon comparisons, a full (not rarefied) feature table was subjected to Hellinger transformation (i.e., total sum scaling and square root transformation). Principal coordinate analysis (PCoA) with subsequent analysis of similarities (ANOSIM) based on Bray–Curtis dissimilarity as well as redundancy analysis (RDA) and non-parametric multidimensional scaling (NMDS) was used to identify similarities of microbiome structures between groups. LDA effect size (LEfSe) and analysis of compositions of microbiomes (ANCOM) identified differentially abundant taxa between the groups.
Nuclear magnetic resonance (NMR) metabolomic profiling was performed for urine, serum and stool samples using a well-established pipeline (for details regarding the method, see Supplementary Methods) [18,19]. Metabolites were extracted using methanol, NMR spectra were recorded and processed in Matlab to obtain aligned and normalized datasets. Valid datasets were obtained from 29 patients (14 LOLA, 15 noLOLA), 27 patients (13 LOLA, 14 noLOLA) and 27 patients (13 LOLA, 14 noLOLA). The human metabolome database (HMDB) was used for metabolite annotation. Obtained concentrations were then normalized to the sum of all concentrations in a sample, square root transformed, mean centered and divided by the standard deviation of the respective feature for statistical analysis. Principal component analysis (PCA) was performed to visually assess the similarity of metabolome profiles between groups. To further discriminate groups, biomarker identification was performed based on area under the receiver operator characteristics curve (AUROC). For biomarker identification, the 20 ratios of metabolites with the lowest p value in group comparison tests were included in the list of analytes. Analysis was performed in the web-based version of MetaboAnalyst 5.0 (https://www.metaboanalyst.ca, accessed on 28 September 2021) [20].
Targeted metabolomics were compared between groups, whereby routine and experimental parameters were selected to complement the NMR results. Parameters include routine biomarkers for liver function/injury and related information: alanine aminotransferase (ALT), aspartate aminotransferase (AST), alkaline phosphatase (AP), gamma-glutamyltransferase (GGT), albumin, bilirubin, prothrombin time international normalized ratio (PZINR), C-reactive protein and total protein biomarkers for inflammation and gut permeability: fecal calprotectin, fecal zonulin, diamine oxidase (DAO), LPS binding protein and sCD14 indicators for sarcopenia: fibroblast growth factor (FGF) 21, irisin, myostatin and insulin-like growth factor (IGF)—1 biomarkers for neutrophil function: resting burst, priming and ROS production after E. coli stimulation, all given as percentage of positive cells and geometric mean of fluorescence intensity (GMFI) [20].
Biomarkers for liver function and injury as well as C-reactive protein were taken from the routine biochemistry report of the patients, fecal zonulin and fecal calprotectin were measured externally by Biovis’ Diagnostik MVZ GmbH (Limburg–Offenheim, Germany); neutrophil function was assessed by flow cytometry in heparinized whole blood using Phagoburst kits (Celonic, Basel, Switzerland) in house (for details, see Supplementary Methods), the remaining biomarkers were assessed in house by ELISA (diamine oxidase and myostatin: Immundiagnostik, Bensheim, Germany; insulin-like growth factor-1 and fibroblast growth factor-21: Biotechne, Minneapolis, MN, USA; Irisin: Biovendor, Brno, Czeck Republic; LPS binding protein: Hycult Biotech, Uden, The Netherlands; sCD14: R&D systems, Minneapolis, MN, USA). All tests were performed according to manufacturers’ instructions. In addition, muscle function and muscle mass assessments (chair rise test, gait speed, midarm muscle circumference, hand grip strength and body mass index) were included in the analysis.
All analyses and visualizations, if not otherwise stated in the Method section, were performed with R (version 4.0.3) in R studio (version 1.4.1103) using the packages “tidyverse”, “readxl”, “writexl”, and “ggpubr” [14,21,22,23,24].

3. Results

3.1. Patient Characteristics

Of the 156 patients with a valid sarcopenia diagnosis and microbiome profile, 98 were diagnosed with cirrhosis. Of these 98, 95 had a microbiome profile with at least 8000 reads per sample, and 15 had a documented oral LOLA-therapy at the timepoint of sampling (for at least one month, range: 1–29 months). Out of the remaining 80 eligible patients without LOLA therapy, 15 patients were selected as a control group with nearest-neighbor propensity score matching, as shown in Figure 1. The two resulting groups (LOLA and noLOLA) were comparable in etiology of cirrhosis (p = 0.7), Child-Pugh score (p < 0.99), MELD-score (p = 0.5), age (p = 0.9), sex (p = 0.7), proton pump inhibitor use (p > 0.99) and lactulose use (p = 0.7). Non-absorbable antibiotics (rifaximin) were used by four patients in the LOLA group, but none in the control group (p = 0.1). For patient characteristics of matched groups, see Table 1.
For the sensitivity analysis, we iterated the control group matching with a regression model that included disease severity, cirrhosis etiology and proton pump inhibitor use. Sixty percent of patients from the initial control cohort (only matched for liver disease severity) were replaced during this process. In addition, this control group was well comparable to the LOLA group in regard to age (p = 0.5), sex (p = 0.4), etiology (p > 0.99), Child-Pugh score (p = 0.3), MELD score (p = 0.9), PPI use (p > 0.99) and lactulose use (p > 0.99). None of the patients in the control group were taking non-absorbable antibiotics. Patient characteristics are compared in Table 2.

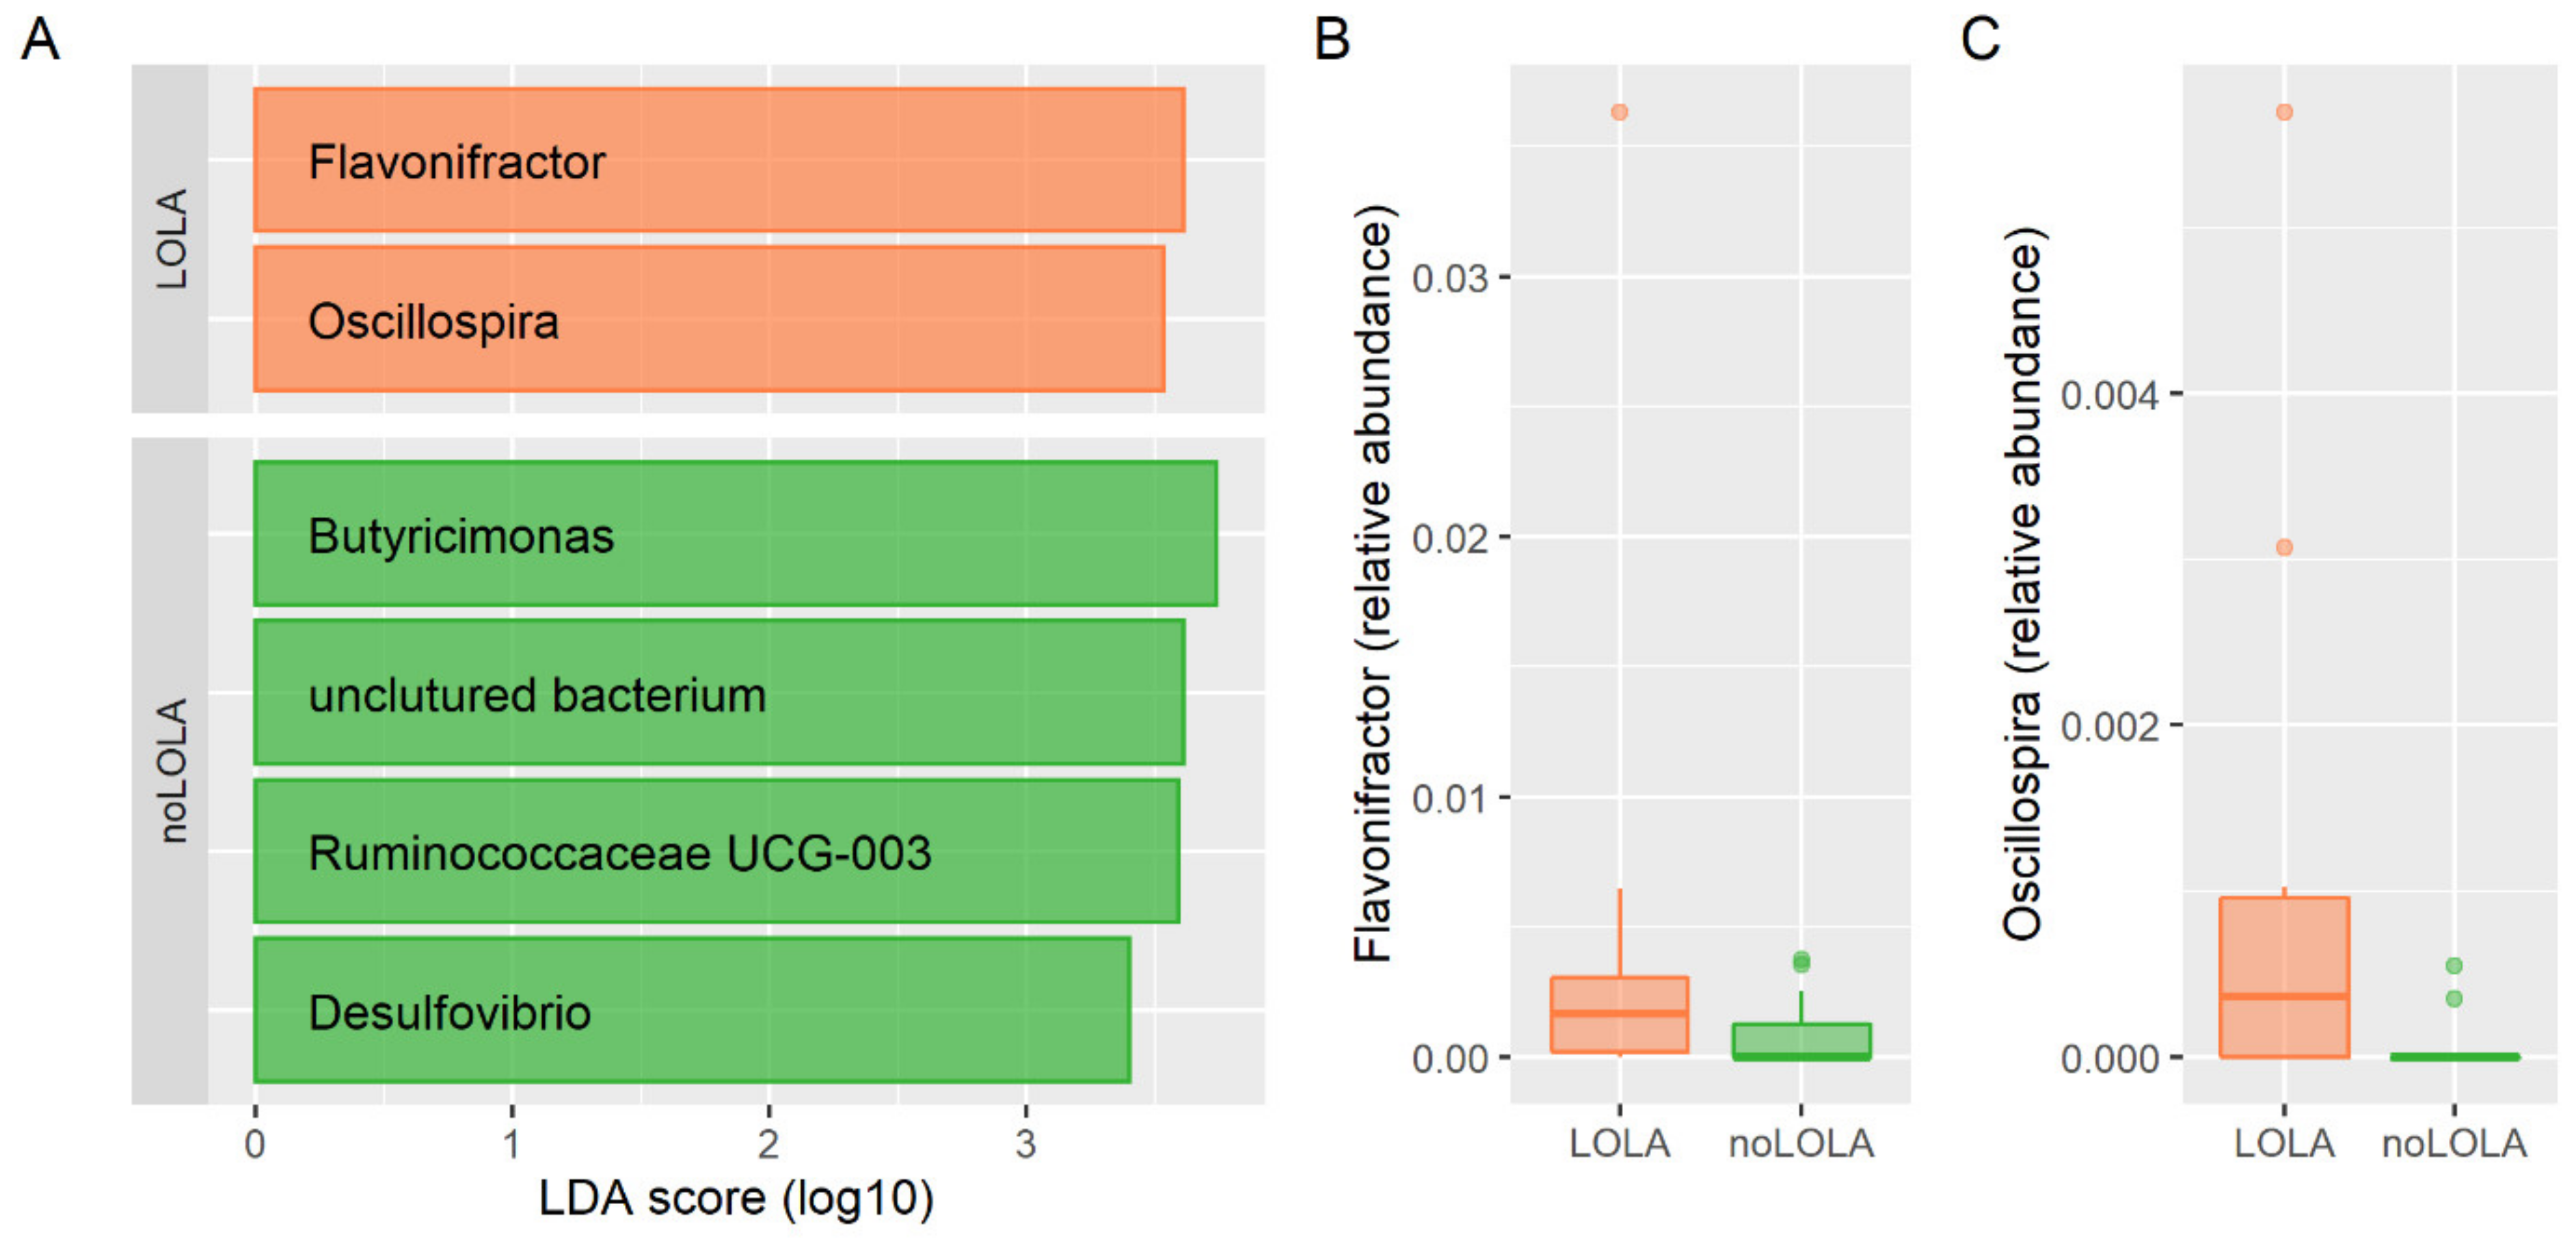
3.2. Association of LOLA Intake with Microbiome Composition

The analysis of the microbiome compositions showed no significant differences in alpha diversity (Chao1: p = 0.4, Evenness: p = 0.2; Richness: p = 0.8, Shannon: p = 0.2) or beta diversity (ANOSIM: R = −0.045, p = 0.9; RDA: Variance = 27.46, F = 0.98, p = 0.6, NMDS: stress = 0.235), and ANCOM could not identify any significant differences between the groups. LEfSe analysis identified six genera to be differentially abundant between groups: Flavonifractor and Oscillospira was associated with LOLA therapy, Ruminococcaceae_UCG003, Butyricimonas, Desulfovibrio and an uncultured, not further identified bacterium were associated with controls without LOLA therapy (see also Figure 2). This result was also observed when patients with intake of lactulose or PPI or rifaximin were excluded from the analysis (see Supplementary Figure S1).
Similar results were obtained in the sensitivity analysis using the control group matched for liver disease severity, etiology and PPI use. Alpha-diversity (Chao1: p = 0.7, Evenness: p = 0.9; Richness: p = 0.6, Shannon: p = 0.8) and beta-diversity (ANOSIM: R = −0.006, p = 0.5; RDA: Variance = 28.29, F = 1.04, p = 0.2, NMDS: stress = 0.224) did not show significant differences between patients with and without LOLA use, consistent with the previous analysis. LEfSe identified five differentially abundant genera; Parabacteriodes, Flavonifractor and Oscillospira were more abundant in patients treated with LOLA, Subdoligranulum and Anaerostipes were more abundant in patients not taking LOLA (see also Supplementary Figure S2). ANCOM could identify the genus Flavonifractor to be differentially abundant between groups.
The genera Flavonifractor and Oscillospira re-emerged in the sensitivity analysis using the control group matched for liver disease severity, etiology and PPI use, and the differences in Flavonifractor abundance could be reproduced by ANCOM. Both taxa are more abundant in patients treated with LOLA compared to patients not taking LOLA. Flavonifractor was 4.9-fold and 10.6-fold higher and Oscillospira was 14.6-fold and 3.4-fold higher in patients with LOLA intake compared to patients without in the initial analysis and in the sensitivity analysis using the control group matched for liver disease severity, etiology and PPI use, respectively, as shown in Supplementary Figures S1B,C and S2B,C.

3.3. Metabolomic Analysis of Urine, Stool and Serum Samples

To identify metabolites discriminating patients treated with LOLA from patients not taking LOLA, we used PCA and ROC analysis of metabolite panels obtained for urine, stool and serum samples using NMR spectroscopy. Whereas PCA showed no clear separation of the groups (PCA plots are given in Supplementary Figure S3), ROC analysis was able to identify metabolite (ratios)-discriminating patients treated with LOLA from patients not taking LOLA.

3.3.1. Urine Metabolome

Urine metabolomics data of 29 patients were available (14 LOLA, 15 noLOLA). In total, 41 metabolites and the 20 most distinctive metabolite ratios were analyzed. Of these, 14 biomarkers showed a c value above 0.7 in the AUROC analysis and significant differences between groups (uncorrected t test). Because of the considerable risk of overfitting, the analysis was repeated in the sensitivity analysis dataset using the control group matched for liver disease severity, etiology and PPI use to select the more robust biomarkers. This dataset consisted of 27 patients (14 LOLA, 13 noLOLA). Biomarker analysis identified 13 potential biomarkers to distinguish between patients with and without LOLA use. The overlap in potential biomarkers between the initial analysis and the sensitivity analysis included only one biomarker: ethanol to acetic acid ratio was higher in the noLOLA group. Neither ethanol nor acetic acid showed considerable predictive power as a standalone biomarker. Details are given in Table 3. All urine samples contained at least minimal concentrations of ethanol, although more than half of the patients reported not to drink alcohol at all. Patient-reported alcohol consumption did not correlate with urine ethanol concentrations (rs = −0.057; p = 0.8) nor with urine ethanol to acetic acid ratio (rs = −0.051; p = 0.9). Moreover, urine ethanol concentrations were also not correlated with serum ethanol concentrations (rs = −0.035; p = 0.9). Patient-reported alcohol consumption was comparable between groups.

3.3.2. Stool Metabolome

Valid stool metabolomics data were available in 27 of the 30 patients (13 LOLA, 14 noLOLA). In total, 48 metabolites and the 20 most distinctive metabolite ratios were analyzed. Biomarker identification showed 19 potential biomarkers in the initial analysis matched for liver disease severity and 12 in the sensitivity analysis matched for liver disease severity, etiology and PPI use, 3 of which could be validated in both datasets: propylene glycol to isopropyl alcohol ratio, propylene glycol to valeric acid ratio, and valeric acid to glycerol ratio. Neither propylene glycol, isopropyl alcohol, valeric acid nor glycerol showed significant predictive potential as standalone biomarkers. Of note, although valeric acid to glycerol ratio showed significant group differences and c values above 0.7 in both cohorts, the predictive power assessed by AUROC did not reach statistical significance in the sensitivity analysis. Details are given in Table 4.

3.3.3. Serum Metabolome

Serum metabolome datasets with 42 compounds of 27 patients were available. Biomarker identification selected several biomarkers that indicated hepatic encephalopathy and LOLA adherence. Biomarkers that showed significant predictive power in the initial analysis and the sensitivity analysis are listed in Table 5. As expected, the presence of ornithine in the serum of LOLA patients dominates the biomarker selection and thereby validates drug adherence and absorption of oral LOLA.

3.4. Serum- and Fecal-Targeted Metabolomics and Clinical Characteristics

Liver parameters ALT, AST, AP, GGT, albumin as well as total protein, bilirubin, and PZINR, were well balanced between the groups. Patients with LOLA intake showed significantly lower fecal zonulin levels, decreased insulin-like growth factor and slower gait speed compared to patients without LOLA intake. All other tested biomarkers did not show significant differences. Details are given in Table 6.
In the sensitivity analysis, none of the above-described differences could be reproduced. Only the reduced IGF-1 levels showed a similar but not statistically significant difference between groups. Details are given in Supplementary Table S1. The decreased IGF-1 levels might be associated with the higher rate of sarcopenic patients in the LOLA group. Although the difference was not statistically significant, there was a slight overrepresentation of sarcopenic patients in the LOLA group. Of the fifteen patients in the group, nine were sarcopenic, three pre-sarcopenia and three non-sarcopenic. In the control group, however, only six patients were sarcopenic, three pre-sarcopenic and six non-sarcopenic. We therefore matched a third control dataset to the LOLA patients based on sarcopenia diagnosis only for this analysis (irrespective of liver disease) that still showed significantly higher levels of IGF-1 compared to the LOLA group (93.1 ± 51.1 versus 48.3 ± 28.1 ng/mL, p = 0.01), indicating the close connection of hepatic encephalopathy to muscle metabolism in cirrhosis.

4. Discussion

Our retrospective analysis of 15 patients with oral LOLA intake for at least one month and propensity-score-matched controls showed that patients with LOLA intake show a higher abundance of the genera Flavonifractor and Oscillospira in the intestinal microbiome, a reduced ratio of ethanol to acetic acid in urine, an increased ratio of propylene glycol to isopropyl alcohol in stool, increased ratio of propylene glycol to valeric acid in stool, decreased ratio of valeric acid to glycerol in stool, increased levels of ornithine and decreased levels of leucine and isoleucine as well as lower levels of IGF-1 in serum.
Flavonifractor and Oscillospira are rather closely related bacterial taxa in the human intestinal microbiome. According to the Silva database, both genera are classified as Firmicutes (phylum), Clostridia (Class), Oscillospirales (order), Oscillospiraceae (family). Flavonifractor that can be induced by green tea consumption and can exert anti-inflammatory properties in murine DSS colitis models [25]. In humans, the role of the genus Flavonifractor is still undetermined. Its abundance was previously associated with the consumption of Mediterranean diet [26], which is generally regarded as beneficial for human health. In non-alcoholic liver disease, Flavonifractor consistently showed low abundance compared to healthy controls [27]. In addition, according to the GMrepo database, Flavonifractor is more abundant in healthy volunteers than in cirrhosis, non-alcoholic fatty liver disease, obesity/adiposity, and diabetes mellitus (topic-related selection) [28]. Conversely, Flavonifractor has been associated with the microbiome of colorectal cancer patients in India [29]. Oscillospira has previously been associated with low BMI, constipation, longer sleep time, higher HDL levels, lower uric acid and triglyceride levels [30,31]. In a previous study, we showed that lower HDL levels are predictive for the development of complications in patients with compensated cirrhosis and predictive for survival in cirrhotic patients with acute decompensation [32,33]. Taken together, the alterations in the microbiome of LOLA patients could generally be regarded as beneficial for patients with liver disease. However, due to the retrospective design and the low sample size, confounding factors cannot be ruled out, e.g., although not statistically significant, patients in the LOLA group more often also received rifaximin.
In the urine metabolome, patients in the LOLA group showed lower ethanol to acetic acid ratio. The ethanol to acetic acid ratio might be an indicator for the ethanol elimination process. When alcohol is consumed, it is converted to acetaldehyde—a toxic intermediate—and then quickly reduced to acetate. A reduced ratio of ethanol to acetic acid might indicate a more advanced state in the ethanol elimination process, either because of an earlier consumption time or accelerated conversion. Both patient groups reported similar amounts of alcohol intake and did not show any difference in serum or urine alcohol levels. An earlier starting point would therefore necessitate a higher level of intoxication in the LOLA group, which was not reported by the patients. However, in patients with present or past alcohol use disorder, alcohol consumption is notoriously hard to approximate, since some patients tend to embellish their consumption [34]. Appropriately powered and designed studies are necessary to properly explain the reduced ethanol to acetic acid ratio in the urine metabolome of LOLA patients and to further explore the possible effects of LOLA on the ethanol elimination rate in cirrhotic patients. In the stool microbiome, the most prominent biomarker was the propylene glycol to isopropyl alcohol ratio. Propylene glycol is naturally occurring in mushrooms and sesame seed but is also ubiquitously used in the cosmetic, food and drug industries. Isopropyl alcohol is a common substance in various nutritious items, including apples and onions, which are a crucial part of the local cuisine of the patients´ catchment area. The relevance in health and disease is undetermined at the moment. An increase in this ratio in LOLA patients might indicate an increase in therapeutics and decrease in fresh food consumption. However, this exploratory study is not designed to answer this question. Valeric acid is a bacterial metabolite, among others produced by Flavonifractor plautii as a product of flavonoid degradation [35]. This short chain fatty acid can also be produced by odd-chain elongation of ethanol and propionate or by hydrolysis of valerate esters used as fruity tasting food additives [36]. We observed low levels of valeric acid to glycerol ratio in the stool metabolome of LOLA patients, which is consistent with previous observations of low valerate levels in patients with recurring hepatic encephalopathy and might therefore reflect the disease rather than a therapy-related change in the metabolome [37]. Similarly, serum marker reflect a typical decrease in branched chained amino acids in patients with hepatic encephalopathy [38]. The lack of isoleucine probably would have been even more pronounced if the patients were not treated with LOLA, since LOLA supposedly increases isoleucine levels in serum [39]. Moreover, the increased levels of ornithine confirm therapy adherence of the patients and adequate reabsorption of oral LOLA in these patients [40].
IGF-1 was consistently lower in patients with LOLA, although we corrected for liver disease and sarcopenia in two separate matched cohort. In this pilot study, we could not discern the reason for this decrease nor could we find probable mechanistic indicators. It is likely that the pathophysiological changes in patients with hepatic encephalopathy, especially the high levels of ammonia, negatively influence muscle metabolism as it was previously shown in pufferfish and suggested in cirrhosis and hepatic encephalopathy [41,42].
In conclusion, patients with LOLA therapy for at least one month showed a potentially beneficial increase in Flavonifractor and Oscillospira in their microbiome compared to patients without LOLA therapy. Changes in the stool and serum metabolome mainly reflected pathophysiological changes of hepatic encephalopathy and identified possible therapeutic targets, such as valeric acid that is reduced in patients with hepatic encephalopathy but whose microbial production might be elevated by LOLA-associated changes in Flavonifractor abundance. Lastly, low levels of IGF-1 demonstrated a link between hepatic encephalopathy and muscle metabolism, a potential new avenue for LOLA use in liver cirrhotic patients.

Supplementary Materials

The following supporting information can be downloaded at: https://www.mdpi.com/article/10.3390/nu14040748/s1, Supplementary Methods and Results. Supplementary Figure S1: Relative abundance of Oscillospira and Flavonifractor in patients with and without LOLA use and no concomitant lactulose use (A-B), no concomitant PPI use (C-D) and no concomitant rifaximin use (E-F). Supplementary Figure S2: Sensitivity analysis A) Genera associated with LOLA therapy (orange bars—LOLA) or controls (green bars—noLOLA) determined by LDA Effect Size (LEfSe) in the sensitivity analysis. (B-C) Relative abundances of genera Flavonifractor and Oscillospira in patient with and without LOLA intake. Supplementary Figure S3. (A+B) Similarity of urine metabolome in patients with and without LOLA. Scores plot of principal component analysis based on the urine metabolome in the initial analysis (A) and the sensitivity analysis (B). (C+D) Similarity of stool metabolome in patients with and without LOLA. Scores plot of principal component analysis based on the stool metabolome in the initial analysis (C) and the sensitivity analysis (D). (E+F) Similarity of serum metabolome in patients with and without LOLA. Scores plot of principal component analysis based on the serum metabolome in the initial analysis (E) and the sensitivity analysis (F). Supplementary Table S1: Targeted metabolomics including liver disease parameters, gut inflammation and permeability markers, indicators of sarcopenia and neutrophil function.

Author Contributions

Conceptualization, A.H. and V.S.; methodology, A.H., B.B. and T.M.; data curation, J.T. and B.A.; writing—original draft preparation, A.H. and V.S.; writing—review and editing, all authors; visualization, A.H.; supervision, V.S.; project administration, J.T. and B.A.; funding acquisition, V.S. All authors have read and agreed to the published version of the manuscript.

Funding

Data analysis in this project was funded by MEFO Graz. V.S. is supported by Austrian Science Fund (FWF) grant KLI741 and the Center for Biomarker Research in Medicine (CBmed), a COMET K1 center funded by the Austrian Research Promotion Agency. B.A. is a PhD student in the DK MOLMED. T.M. is supported by Austrian Science Fund (FWF) grants P28854, I3792, DOC-130, and DK-MCD W1226; Austrian Research Promotion Agency (FFG) grants 864690 and 870454; the Integrative Metabolism Research Center Graz; the Austrian Infrastructure Program 2016/2017; the Styrian Government (Zukunftsfonds, doc.fund program); the City of Graz; and BioTechMed-Graz (flagship project).

Institutional Review Board Statement

The study was conducted in accordance with the Declaration of Helsinki and approved by the Institutional Review Board of the Medical University of Graz (29-280 ex 16/17).

Informed Consent Statement

Informed consent was obtained from all subjects involved in the study.

Data Availability Statement

The data presented in this study are available on request from the corresponding author. The data are not publicly available yet due to the ongoing collection of data in this study.

Acknowledgments

Open Access Funding by the Austrian Science Fund (FWF).

Conflicts of Interest

The authors declare no conflict of interest.

References

  1. Pimpin, L.; on behalf of the HEPAHEALTH Steering Committee. HEPAHEALTH Project Report; Europeal Association for the Study of the Liver: Geneva, Switzerland, 2018. [Google Scholar]
  2. European Association for the Study of the Liver. EASL Clinical Practice Guidelines on nutrition in chronic liver disease. J. Hepatol. 2019, 70, 172–193. [Google Scholar] [CrossRef] [PubMed] [Green Version]
  3. Wijdicks, E.F. Hepatic Encephalopathy. N. Engl. J. Med. 2016, 375, 1660–1670. [Google Scholar] [CrossRef] [PubMed]
  4. Olde Damink, S.W.; Jalan, R.; Dejong, C.H. Interorgan ammonia trafficking in liver disease. Metab. Brain Dis. 2009, 24, 169–181. [Google Scholar] [CrossRef] [PubMed] [Green Version]
  5. Butterworth, R.F. Role of circulating neurotoxins in the pathogenesis of hepatic encephalopathy: Potential for improvement following their removal by liver assist devices. Liver Int. 2003, 23 (Suppl. 3), 5–9. [Google Scholar] [CrossRef]
  6. Butterworth, R.F. Hepatic encephalopathy in alcoholic cirrhosis. Handb. Clin. Neurol. 2014, 125, 589–602. [Google Scholar] [CrossRef]
  7. American Association for the Study of Liver; European Association for the Study of the Liver. Hepatic encephalopathy in chronic liver disease: 2014 practice guideline by the European Association for the Study of the Liver and the American Association for the Study of Liver Diseases. J. Hepatol. 2014, 61, 642–659. [Google Scholar] [CrossRef] [Green Version]
  8. Blanco Vela, C.I.; Poo Ramirez, J.L. Efficacy of oral L-ornithine L-aspartate in cirrhotic patients with hyperammonemic hepatic encephalopathy. Ann. Hepatol. 2011, 10 (Suppl. 2), S55–S59. [Google Scholar] [CrossRef]
  9. Kircheis, G.; Luth, S. Pharmacokinetic and Pharmacodynamic Properties of L-Ornithine L-Aspartate (LOLA) in Hepatic Encephalopathy. Drugs 2019, 79, 23–29. [Google Scholar] [CrossRef] [Green Version]
  10. Gustot, T.; Stadlbauer, V.; Laleman, W.; Alessandria, C.; Thursz, M. Transition to decompensation and acute-on-chronic liver failure: Role of predisposing factors and precipitating events. J. Hepatol. 2021, 75 (Suppl. 1), S36–S48. [Google Scholar] [CrossRef]
  11. Qin, N.; Yang, F.; Li, A.; Prifti, E.; Chen, Y.; Shao, L.; Guo, J.; Le Chatelier, E.; Yao, J.; Wu, L.; et al. Alterations of the human gut microbiome in liver cirrhosis. Nature 2014, 513, 59–64. [Google Scholar] [CrossRef]
  12. Stadlbauer, V.; Komarova, I.; Klymiuk, I.; Durdevic, M.; Reisinger, A.; Blesl, A.; Rainer, F.; Horvath, A. Disease severity and proton pump inhibitor use impact strongest on faecal microbiome composition in liver cirrhosis. Liver Int. 2020, 40, 866–877. [Google Scholar] [CrossRef] [PubMed] [Green Version]
  13. Maier, L.; Pruteanu, M.; Kuhn, M.; Zeller, G.; Telzerow, A.; Anderson, E.E.; Brochado, A.R.; Fernandez, K.C.; Dose, H.; Mori, H.; et al. Extensive impact of non-antibiotic drugs on human gut bacteria. Nature 2018, 555, 623–628. [Google Scholar] [CrossRef] [PubMed]
  14. R_Core_Team. R: A Language and Environment for Statistical Computing; R Foundation for Statistical Computing: Vienna, Austria, 2017. [Google Scholar]
  15. Ho, D.; Imai, K.; King, G.; Stuart, E.A. MatchIt: Nonparametric Preprocessing for Parametric Causal Inference. J. Stat. Softw. 2011, 42, 1–28. [Google Scholar] [CrossRef] [Green Version]
  16. Estaki, M.; Jiang, L.; Bokulich, N.A.; McDonald, D.; González, A.; Kosciolek, T.; Martino, C.; Zhu, Q.; Birmingham, A.; Vázquez-Baeza, Y.; et al. QIIME 2 Enables Comprehensive End-to-End Analysis of Diverse Microbiome Data and Comparative Studies with Publicly Available Data. Curr. Protoc. Bioinform. 2020, 70, e100. [Google Scholar] [CrossRef] [PubMed]
  17. Zakrzewski, M.; Proietti, C.; Ellis, J.J.; Hasan, S.; Brion, M.J.; Berger, B.; Krause, L. Calypso: A user-friendly web-server for mining and visualizing microbiome-environment interactions. Bioinformatics 2017, 33, 782–783. [Google Scholar] [CrossRef] [PubMed] [Green Version]
  18. Stryeck, S.; Gastrager, M.; Degoricija, V.; Trbusic, M.; Potocnjak, I.; Radulovic, B.; Pregartner, G.; Berghold, A.; Madl, T.; Frank, S. Serum Concentrations of Citrate, Tyrosine, 2- and 3- Hydroxybutyrate are Associated with Increased 3-Month Mortality in Acute Heart Failure Patients. Sci. Rep. 2019, 9, 6743. [Google Scholar] [CrossRef]
  19. Zhou, Q.; Kerbl-Knapp, J.; Zhang, F.; Korbelius, M.; Kuentzel, K.B.; Vujić, N.; Akhmetshina, A.; Hörl, G.; Paar, M.; Steyrer, E.; et al. Metabolomic Profiles of Mouse Tissues Reveal an Interplay between Aging and Energy Metabolism. Metabolites 2022, 12, 17. [Google Scholar] [CrossRef]
  20. Pang, Z.; Chong, J.; Zhou, G.; de Lima Morais, D.A.; Chang, L.; Barrette, M.; Gauthier, C.; Jacques, P.E.; Li, S.; Xia, J. MetaboAnalyst 5.0: Narrowing the gap between raw spectra and functional insights. Nucleic Acids Res. 2021, 49, W388–W396. [Google Scholar] [CrossRef]
  21. Wickham, H.; Averick, M.; Bryan, J.; Chang, W.; McGowan, L.; François, R.; Grolemund, G.; Hayes, A.; Henry, L.; Hester, J.; et al. Welcome to the tidyverse. J. Open Source Softw. 2019, 4, 1686. [Google Scholar] [CrossRef]
  22. Wickham, H.; Bryan, J. Readxl: Read Excel Files. R Package Version 1.3.1. 2019. Available online: https://CRAN.R-project.org/package=readxl (accessed on 21 June 2021).
  23. Ooms, J. writexl: Export Data Frames to Excel ‘xlsx’ Format. R Package Version 1.3.1. 2020. Available online: https://CRAN.R-project.org/package=writexl (accessed on 21 June 2021).
  24. Alboukadel, K. ggpubr: ‘ggplot2’ Based Publication Ready Plots. R Package Version 0.4.0. 2020. Available online: https://CRAN.R-project.org/package=ggpubr (accessed on 21 June 2021).
  25. Mikami, A.; Ogita, T.; Namai, F.; Shigemori, S.; Sato, T.; Shimosato, T. Oral Administration of Flavonifractor plautii, a Bacteria Increased with Green Tea Consumption, Promotes Recovery From Acute Colitis in Mice via Suppression of IL-17. Front. Nutr. 2020, 7, 610946. [Google Scholar] [CrossRef]
  26. Rosés, C.; Cuevas-Sierra, A.; Quintana, S.; Riezu-Boj, J.I.; Martínez, J.A.; Milagro, F.I.; Barceló, A. Gut Microbiota Bacterial Species Associated with Mediterranean Diet-Related Food Groups in a Northern Spanish Population. Nutrients 2021, 13, 636. [Google Scholar] [CrossRef] [PubMed]
  27. Pan, X.; Wen, S.W.; Kaminga, A.C.; Liu, A. Gut metabolites and inflammation factors in non-alcoholic fatty liver disease: A systematic review and meta-analysis. Sci. Rep. 2020, 10, 8848. [Google Scholar] [CrossRef] [PubMed]
  28. Wu, S.; Sun, C.; Li, Y.; Wang, T.; Jia, L.; Lai, S.; Yang, Y.; Luo, P.; Dai, D.; Yang, Y.Q.; et al. GMrepo: A database of curated and consistently annotated human gut metagenomes. Nucleic Acids Res. 2020, 48, D545–D553. [Google Scholar] [CrossRef] [Green Version]
  29. Gupta, A.; Dhakan, D.B.; Maji, A.; Saxena, R.; Vishnu Prasoodanan, K.V.; Mahajan, S.; Pulikkan, J.; Kurian, J.; Gomez, A.M.; Scaria, J.; et al. Association of Flavonifractor plautii, a Flavonoid-Degrading Bacterium, with the Gut Microbiome of Colorectal Cancer Patients in India. mSystems 2019, 4, e00438-19. [Google Scholar] [CrossRef] [PubMed] [Green Version]
  30. Chen, Y.R.; Zheng, H.M.; Zhang, G.X.; Chen, F.L.; Chen, L.D.; Yang, Z.C. High Oscillospira abundance indicates constipation and low BMI in the Guangdong Gut Microbiome Project. Sci. Rep. 2020, 10, 9364. [Google Scholar] [CrossRef] [PubMed]
  31. Konikoff, T.; Gophna, U. Oscillospira: A Central, Enigmatic Component of the Human Gut Microbiota. Trends Microbiol. 2016, 24, 523–524. [Google Scholar] [CrossRef] [PubMed]
  32. Trieb, M.; Rainer, F.; Stadlbauer, V.; Douschan, P.; Horvath, A.; Binder, L.; Trakaki, A.; Knuplez, E.; Scharnagl, H.; Stojakovic, T.; et al. HDL-related biomarkers are robust predictors of survival in patients with chronic liver failure. J. Hepatol. 2020, 73, 113–120. [Google Scholar] [CrossRef] [Green Version]
  33. Trieb, M.; Horvath, A.; Birner-Gruenberger, R.; Spindelboeck, W.; Stadlbauer, V.; Taschler, U.; Curcic, S.; Stauber, R.E.; Holzer, M.; Pasterk, L.; et al. Liver disease alters high-density lipoprotein composition, metabolism and function. Biochim. Biophys. Acta 2016, 1861, 630–638. [Google Scholar] [CrossRef] [Green Version]
  34. Hempel, J.M.; Greif-Higer, G.; Kaufmann, T.; Beutel, M.E. Detection of alcohol consumption in patients with alcoholic liver cirrhosis during the evaluation process for liver transplantation. Liver Transpl. 2012, 18, 1310–1315. [Google Scholar] [CrossRef]
  35. Braune, A.; Blaut, M. Bacterial species involved in the conversion of dietary flavonoids in the human gut. Gut Microbes 2016, 7, 216–234. [Google Scholar] [CrossRef] [Green Version]
  36. Candry, P.; Ulcar, B.; Petrognani, C.; Rabaey, K.; Ganigué, R. Ethanol:propionate ratio drives product selectivity in odd-chain elongation with Clostridium kluyveri and mixed communities. Bioresour. Technol. 2020, 313, 123651. [Google Scholar] [CrossRef] [PubMed]
  37. Bloom, P.P.; Luévano, J.M., Jr.; Miller, K.J.; Chung, R.T. Deep stool microbiome analysis in cirrhosis reveals an association between short-chain fatty acids and hepatic encephalopathy. Ann. Hepatol. 2021, 25, 100333. [Google Scholar] [CrossRef] [PubMed]
  38. Holecek, M. Ammonia and amino acid profiles in liver cirrhosis: Effects of variables leading to hepatic encephalopathy. Nutrition 2015, 31, 14–20. [Google Scholar] [CrossRef] [PubMed]
  39. Rose, C.; Michalak, A.; Rao, K.V.; Quack, G.; Kircheis, G.; Butterworth, R.F. L-ornithine-L-aspartate lowers plasma and cerebrospinal fluid ammonia and prevents brain edema in rats with acute liver failure. Hepatology 1999, 30, 636–640. [Google Scholar] [CrossRef]
  40. Kowalski, P.; Bieniecki, M. Pharmacokinetics and bioavailability study of L-ornithine-L-aspartate in healthy volunteers--a comparative study of two oral formulations. J. Pharm. Biomed. Anal. 2006, 41, 1061–1064. [Google Scholar] [CrossRef]
  41. Butterworth, R.F. L-Ornithine L-Aspartate for the Treatment of Sarcopenia in Chronic Liver Disease: The Taming of a Vicious Cycle. Can. J. Gastroenterol. Hepatol. 2019, 2019, 8182195. [Google Scholar] [CrossRef]
  42. Cheng, C.H.; Yang, F.F.; Liao, S.A.; Miao, Y.T.; Ye, C.X.; Wang, A.L. Effect of acute ammonia exposure on expression of GH/IGF axis genes GHR1, GHR2 and IGF-1 in pufferfish (Takifugu obscurus). Fish. Physiol. Biochem. 2015, 41, 495–507. [Google Scholar] [CrossRef]
Figure 1. Flow diagram for patient selection. Analyzed groups are given in colored boxes.
Nutrients 14 00748 g001
Figure 2. (A) Genera associated with LOLA therapy (orange bars—LOLA) or controls (green bars—noLOLA) determined by LDA effect size (LEfSe). (B,C) Relative abundances of genera Flavonifractor and Oscillospira in patient with and without LOLA intake.
Nutrients 14 00748 g002
Table 1. Characteristics of LOLA-receiving patients and controls matched for liver disease severity.
ParameterLOLA (n = 15)noLOLA (n = 15)p Value
Age63 (6.5)61 (15.1)0.9
Sex (m/f)13/2 (87/13%)11/4 (73/27%)0.7
Etiology (Alc/Non-alc)10/5 (67/33%)9/6 (60/40%)0.7
Child-Pugh score7 (1.5) *7 (1.5) *>0.99
MELD score12.8 (3.3)11.9 (2.7)0.5
PPI use/non-use7/8 (47/53%)6/9 (40/60%)>0.99
Lactulose use/non-use5/10 (33/67%)3/12 (20/80%)0.7
Non-absorbable antibiotics use/non-use4/11 (36/64%)0/15 (0/100%)0.1
Sarcopenia diagnosis (no/pre-/sarcopenia)3/3/9 (20/20/60%)6/3/6 (40/20/40%)0.4
Values are given as mean (standard deviation) or count (%), unless otherwise stated; * values are given as median (interquartile range); LOLA: patients with LOLA intake; noLOLA: patients without LOLA intake; Alc: alcoholic cirrhosis; MELD: model of end stage liver disease; PPI: proton pump inhibitor.
Table 2. Patient characteristics of LOLA-receiving patients and controls matched for liver disease severity, etiology and PPI use.
LOLA (n = 15)noLOLA (n = 15)p Value
Age (years)63 (6.5)62 (7.7)0.5
Gender (m/f)13/2 (87/13%)10/5 (67/33%)0.4
Etiology (Alc/Non-alc)10/5 (67/33%)10/5 (67/33%)>0.99
Child-Pugh score7 (1.5) *7 (2.5) *0.3
MELD score12.8 (3.3)12.7 (4.3)0.9
PPI use/non-use7/8 (47/53%)7/8 (47/53%)>0.99
Lactulose use/non-use5/10 (33/67%)4/11 (36/64%)>0.99
Non-absorbable antibiotics use/non-use4/11 (36/64%)0/15 (0/100%)0.1
Sarcopenia diagnosis (no/pre-/sarcopenia)3/3/9 (20/20/60%)7/3/5 (47/20/33%)0.3
Values are given as mean (standard deviation) or count (%), unless otherwise stated; * values are given as median (interquartile range); LOLA: patients with LOLA intake; noLOLA: patients without LOLA intake; Alc: alcoholic cirrhosis; MELD: model of end stage liver disease; PPI: proton pump inhibitor.
Table 3. Predictive power of urine ethanol to acetic acid ratio and its components for patients with and without LOLA intake in both the initial analysis (groups matched for liver disease severity) and the sensitivity analysis (groups matched for liver disease severity, etiology and PPI use).
Initial AnalysisSensitivity Analysis
BiomarkerLOLAnoLOLAAUROC (95%CI)LOLAnoLOLAAUROC (95%CI)
Ethanol to acetic acid ratio−0.59 (0.85)0.30 (0.51)0.83 (0.61–0.95)−0.46 (0.78)0.07 (0.64)0.76 (0.54–0.92)
Ethanol−0.11 (0.60)0.00 (0.63)0.60 (0.37–0.80)−0.02 (0.54)−0.16 (0.84)0.53 (0.31–0.78)
Acetic acid0.42 (0.91)−0.27 (0.79)0.68 (0.46–0.87)0.42 (0.87)−0.24 (0.8)0.69 (0.78–0.88)
Values are given as mean (standard deviation) or AUROC c value (95%CI); LOLA: patients with LOLA intake; noLOLA: patients without LOLA intake; AUROC: area under the receiver operator curve; 95%CI: 95% confidence interval; biomarkers with significant predictive power are printed in bold.
Table 4. Predictive power of stool metabolite ratios that distinguish between patients with and without LOLA intake in both the initial analysis (matched for liver disease severity) and the sensitivity analysis (matched for liver disease severity, etiology and PPI use).
Initial Analysis Sensitivity Analysis
Biomarker/RatioLOLAnoLOLAAUROC (95%CI)LOLAnoLOLAAUROC (95%CI)
Propylene glycerol to isopropyl alcohol0.54 (0.77)−0.62 (0.93)0.84 (0.65–0.96)0.46 (0.77)−0.67 (1.00)0.78 (0.56–0.93)
Propylene glycerol to valeric acid0.59 (1.01)−0.40 (0.86)0.74 (0.52–0.89)0.57 (0.91)−0.28 (0.85)0.76 (0.53–0.90)
Valeric acid to glycerol−0.23 (1.00)0.41 (0.78)0.73 (0.51–0.90)−0.19 (0.98)0.12 (0.63)0.72 (0.49–0.89)
Propylene glycerol0.30 (1.30)−0.08 (0.70)0.65 (0.42–0.82)0.31 (0.98)−0.25 (1.02)0.65 (0.40–0.84)
Isopropyl alcohol−0.21 (1.04)0.44 (0.83)0.69 (0.47–0.87)−0.06 (0.88)0.24 (1.22)0.62 (0.38–0.82)
Valeric acid−0.27 (1.28)0.32 (0.74)0.36 (0.19–0.58)−0.13 (0.87)−0.03 (1.21)0.67 (0.47–0.88)
Glycerol0.07 (1.09)−0.24 (0.85)0.62 (0.42–0.82)0.08 (0.97)−0.15 (1.02)0.61 (0.39–0.81)
Values are given as mean (standard deviation) or AUROC c value (95%CI); LOLA: patients with LOLA intake; noLOLA: patients without LOLA intake; AUROC: area under the receiver operator characteristics curve; 95%CI: 95% confidence interval; biomarkers with significant predictive power are printed in bold.
Table 5. Predictive power of serum metabolite ratios that distinguish between patients with and without LOLA intake in both the initial analysis (groups matched for liver disease severity) and the sensitivity analysis (groups matched for liver disease severity, etiology and PPI use).
Initial AnalysisSensitivity Analysis
Biomarkers/RatiosLOLAnoLOLAAUROC (95%CI)LOLAnoLOLAAUROC (95%CI)
Ornithine0.53 (1.06)–0.42 (0.85)0.76 (0.57–0.93)0.54 (1.04)–0.38 (0.87)0.78 (0.59–0.93)
Isoleucine−0.54 (1.23)0.37 (0.59)0.79 (0.57–0.93)–0.51 (0.98)0.46 (0.88)0.76 (0.54–0.92)
Leucine–0.37 (1.24)0.36 (0.57)0.74 (0.52–0.92)–0.35 (1.07)0.54 (0.7)0.73 (0.50–0.90)
Isoleucine to ornithine–0.7 (0.9)0.52 (0.77)0.88 (0.70–0.97)–0.8 (0.94)0.62 (0.62)0.91 (0.77–1.00)
Acetone to ornithine–0.58 (0.97)0.51 (0.83)0.83 (0.63–0.95)–0.52 (0.99)0.37 (0.76)0.75 (0.54–0.92)
Lysine to ornithine–0.53 (1.04)0.46 (0.71)0.82 (0.63–0.96)–0.54 (1.10)0.53 (0.72)0.82 (0.64–0.98)
Leucine to ornithine–0.55 (1.16)0.46 (0.61)0.84 (0.67–0.90)–0.58 (1.16)0.56 (0.64)0.87 (0.70–0.98)
Ethanol to ornithine–0.54 (0.95)0.49 (0.87)0.81 (0.61–0.95)–0.52 (1.03)0.46 (0.84)0.80 (0.60–0.95)
Ornithine to threonine0.55 (1.05)–0.52 (0.77)0.83 (0.66–0.96)0.64 (0.93)–0.49 (0.72)0.90 (0.75–0.98)
Aspartic acid to ornithine–0.62 (1.1)0.46 (0.71)0.82 (0.62–0.97)–0.6 (1.07)0.38 (0.60)0.79 (0.58–0.93)
Ornithine to serine0.56 (1.08)–0.5 (0.74)0.82 (0.61–0.95)0.59 (0.95)–0.34 (0.63)0.86 (0.65–0.97)
Valine to ornithine–0.57 (1.14)0.41 (0.66)0.78 (0.60–0.93)–0.62 (1.19)0.52 (0.59)0.85 (0.66–0.99)
Arginine to ornithine–0.49 (1.07)0.41 (0.73)0.78 (0.57–0.92)–0.52 (1.06)0.37 (0.63)0.82 (0.64–0.97)
Acetone–0.27 (0.75)0.37 (1.05)0.70 (0.46–0.88)0.05 (0.74)0.01 (1.00)0.54 (0.31–0.75)
Lysine–0.18 (0.63)0.25 (0.90)0.72 (0.48–0.90)–0.07 (0.53)0.38 (0.90)0.72 (0.50–0.89)
Ethanol–0.05 (0.85)0.27 (0.88)0.61 (0.41–0.81)0.21 (0.74)0.13 (1.04)0.50 (0.29–0.74)
Threonine–0.07 (1.11)0.22 (0.92)0.63 (0.36–0.83)–0.30 (0.92)0.28 (0.85)0.74 (0.51–0.89)
Aspartic acid –0.29 (0.80)0.17 (1.19)0.56 (0.34–0.76)–0.25 (0.76)0.09 (1.21)0.55 (0.34–0.75)
Serine0.03 (1.12)0.12 (0.83)0.46 (0.23–0.68)–0.17 (0.90)–0.07 (0.86)0.62 (0.41–0.82)
Valine–0.44 (1.23)0.26 (0.62)0.70 (0.49–0.90)–0.40 (1.05)0.43 (0.92)0.73 (0.52–0.90)
Arginine–0.11 (1.02)0.15 (0.42)0.56 (0.34–0.78)–0.15 (0.86)0.10 (0.88)0.67 (0.42–0.86)
Values are given as mean (standard deviation) or AUROC c value (95%CI); LOLA: patients with LOLA intake; noLOLA: patients without LOLA intake; AUROC: area under the receiver operator characteristics curve; 95%CI: 95% confidence interval; biomarkers with significant predictive power are printed in bold.
Table 6. Liver disease parameters, gut inflammation and permeability markers, indicators of sarcopenia and neutrophil function in the initial analysis (groups matched for liver disease severity). Values are given in mean (standard deviation). Significant differences are marked in bold print.
ParameterLOLA (n = 15)noLOLA (n = 15)p Value
Alanine aminotransferase (U/L)38.8 (22.8)39.5 (15.6)0.6
Aspartate aminotransferase (U/L)67.7 (41.9)66.2 (35)0.9
Alkaline phosphatase (U/L)137.7 (59.2)125.7 (68.8)0.3
Gamma-glutamyltransferase (U/L)134.5 (92.8)121.9 (105.3)0.6
Albumin (g/dL)3.2 (0.5)3.3 (0.5)0.4
Bilirubin (mg/dL)2.3 (1.8)2.4 (1.9)>0.99
Prothrombin time international normalized ratio1.4 (0.2)1.3 (0.2)0.2
Total protein (g/dL)6.8 (0.9)7 (0.9)0.3
Fecal calprotectin (ng/mL)101.4 (103.9)80.3 (64.6)0.7
Fecal zonulin (ng/mL)161.2 (219.9)205.2 (203.5)0.036
Diamine oxidase (U/mL)24 (11.9)23.3 (15.3)0.6
LPS binding protein (µg/mL)16.7 (7)20.4 (9.8)0.4
C-reactive protein (mg/L)10.3 (13.6)8.1 (15.2)0.4
soluble Cluster of Differentiation 14 (µg/mL)1.8 (0.4)2 (0.8)0.7
Fibroblast growth factor (ng/mL)0.3 (0.6)0.3 (0.2)0.3
Irisin (µg/mL)2 (1.5)1.9 (1)0.8
Myostatin (ng/mL)44 (34.1)38.6 (15.2)0.8
Insulin-like growth factor 1 (ng/mL)48.3 (28.1)75.5 (38.4)0.029
Chair rise test (s)25 (15.9)16.7 (3.8)0.1
Gait speed (m/s)0.8 (0.3)1.1 (0.3)0.049
Midarm muscle circumference (mm)256.6 (63.7)260.4 (48.1)0.7
Hand grip strength (kg)30.6 (10.6)28.8 (5.8)0.5
Body mass index (kg/m2)27.5 (6)28.5 (5.8)0.6
Resting burst of neutrophils (% of neutrophils)2.4 (0.9)2.6 (1.9)0.7
Resting burst of neutrophils (GMFI)174 (102.9)239.8 (223.3)0.4
Neutrophil priming (% of neutrophils)3.2 (1.4)2.7 (1.2)0.5
Neutrophil priming (GMFI)148.7 (58.7)194.8 (99.1)0.1
ROS production after E. coli stimulation (% of neutrophils)96.7 (5.2)96.8 (4.5)0.6
ROS production after E. coli stimulation (GMFI)1034.2 (547.1)753.7 (340.1)0.1
LOLA: patients with LOLA intake; noLOLA: patients without LOLA intake; LPS: lipopolysaccharide; GMFI: geometric mean of fluorescence intensity.
Publisher’s Note: MDPI stays neutral with regard to jurisdictional claims in published maps and institutional affiliations.

