Article

Neurometabolic Dysfunction in SPG11 Hereditary Spastic Paraplegia

by
Martin Regensburger
1,2,3,*,
Laura Krumm
2,
Manuel Alexander Schmidt
4,
Andreas Schmid
5,
Imke Tabea Spatz
1,
Dominique Cornelius Marterstock
4,
Christoph Kopp
6,
Zacharias Kohl
1,†,
Arnd Doerfler
4,
Thomas Karrasch
5,
Beate Winner
2,3 and
Jürgen Winkler
1,3
1
Division of Molecular Neurology, Friedrich-Alexander-Universität Erlangen-Nürnberg (FAU), 91054 Erlangen, Germany
2
Division of Stem Cell Biology, Friedrich-Alexander-Universität Erlangen-Nürnberg (FAU), 91054 Erlangen, Germany
3
Center for Rare Diseases Erlangen (ZSEER), University Hospital Erlangen, 91054 Erlangen, Germany
4
Institute of Neuroradiology, Friedrich-Alexander-Universität Erlangen-Nürnberg (FAU), 91054 Erlangen, Germany
5
Department of Internal Medicine III, Gießen University Hospital, 35392 Giessen, Germany
6
Department of Nephrology and Hypertension, Friedrich-Alexander-Universität Erlangen-Nürnberg (FAU), 91054 Erlangen, Germany
*
Author to whom correspondence should be addressed.
Current address: Department of Neurology, University of Regensburg, 93053 Regensburg, Germany.
Nutrients 2022, 14(22), 4803; https://doi.org/10.3390/nu14224803
Submission received: 17 October 2022 / Accepted: 9 November 2022 / Published: 13 November 2022
(This article belongs to the Special Issue The Role of Nutrition in Neurological Disorders)

Abstract

:
Background: Pathogenic variants in SPG11 cause the most common autosomal recessive complicated hereditary spastic paraplegia. Besides the prototypical combination of spastic paraplegia with a thin corpus callosum, obesity has increasingly been reported in this multisystem neurodegenerative disease. However, a detailed analysis of the metabolic state is lacking. Methods: In order to characterize metabolic alterations, a cross-sectional analysis was performed comparing SPG11 patients (n = 16) and matched healthy controls (n = 16). We quantified anthropometric parameters, body composition as determined by bioimpedance spectroscopy, and serum metabolic biomarkers, and we measured hypothalamic volume by high-field MRI. Results: Compared to healthy controls, SPG11 patients exhibited profound changes in body composition, characterized by increased fat tissue index, decreased lean tissue index, and decreased muscle mass. The presence of lymphedema correlated with increased extracellular fluid. The serum levels of the adipokines leptin, resistin, and progranulin were significantly altered in SPG11 while adiponectin and C1q/TNF-related protein 3 (CTRP-3) were unchanged. MRI volumetry revealed a decreased hypothalamic volume in SPG11 patients. Conclusions: Body composition, adipokine levels, and hypothalamic volume are altered in SPG11. Our data indicate a link between obesity and hypothalamic neurodegeneration in SPG11 and imply that specific metabolic interventions may prevent obesity despite severely impaired mobility in SPG11.

1. Introduction

Autosomal recessive pathogenic variants in SPG11 are the most frequent cause of complex hereditary spastic paraplegia (HSP) [1,2]. In addition to progressive spastic paraparesis, the phenotype of SPG11 is frequently categorized as complicated due to cognitive dysfunction, a thin corpus callosum, neuropathy, and other neurological symptoms [3]. Compared to pure forms of HSP, SPG11 progresses more rapidly and causes earlier wheelchair dependence. Of note, in different cohorts of different sizes, obesity was observed in SPG11 at varying frequencies. For example, obesity was reported in only 1 out of 38 SPG11 patients in one study [4] but in 14 out of 18 SPG11 patients in another cohort [5]. A recent Brazilian study of 20 SPG11 patients reported obesity in 25% of patients and provided first evidence of altered hypothalamic volume in SPG11 [6]. Swelling of the lower extremities caused by lymphedema has been described in SPG11 patients and may further contribute to an increased body weight [7]. However, an in-depth analysis regarding the metabolic state in SPG11 is lacking.
Insight into the etiopathogenesis of obesity and lymphedema in SPG11 may not only extend current knowledge on the mechanism of SPG11-linked neurodegeneration but also provide novel targets to interfere with the metabolic phenotype. Importantly, overweight (defined by BMI ranging from 25 to 30 kg/m2) and obesity (BMI > 30 kg/m2) impact multiple aspects of health, mobility, the efficacy of physiotherapy, and quality of life.
The aim of our study was to characterize the metabolic profile of SPG11 patients in order to gain novel insights into the underlying mechanisms of metabolic dysfunction.

2. Materials and Methods

2.1. Participants

All patients with biallelic pathogenic variants in SPG11 clinically assessed at the outpatient clinic of the Division of Molecular Neurology at the University Hospital Erlangen, Germany were enrolled, along with age- and gender-matched healthy controls. The study was approved by the local institutional review board (ethics committee of the Friedrich-Alexander-Universität Erlangen-Nürnberg, Erlangen, Germany, no. 17-347-B), and informed consent was obtained from all patients and controls according to the Declaration of Helsinki. Written consent for publication of images was obtained from both individuals shown. Due to long travel distances, patients stayed overnight on-site in order to avoid physical overstraining and to enable early morning standardized measurements in a basal fasting state. A subset of patients completed the ZUNG self-rating depression scale [8].

2.2. Laboratory Workup

Patients were asked to avoid excessive physical activity within the preceding week, and blood samples were withdrawn in the morning (between 8 am and 11 am) after a fasting period of at least 8 h, including abstinence from caffeine and sweeteners. Serum and EDTA samples were cooled immediately after blood drawing. EDTA samples were submitted to tandem liquid chromatography/mass spectrometry for ACTH levels. Serum supernatants were prepared within 4 h and subsequently stored at −80 °C. The endocrine parameters thyrotropin (TSH), cortisol (determined by electrochemiluminescence assay), and leptin (determined using a human leptin ELISA kit, Mediagnost Reutlingen, Germany) were determined by diagnostically certified laboratories as performed in clinical routine. Levels of progranulin, resistin, and CTRP-3 were determined by an ELISA in duplicate using the DuoSet ELISA development systems (R&D Systems, Wiesbaden, Germany), as described previously [9,10].

2.3. Anthropometry and Bioimpedance Spectroscopy

Anthropometric measurements and bioimpedance spectroscopy were conducted as described previously [11]. Obesity was classified based upon BMI values into class I (30–35 kg/m2), class II (35–40 kg/m2), and class III (>40 kg/m2) according to the World Health Organization. Bioimpedance spectroscopy (BIS) with the Body Composition Monitor® (Fresenius Medical Care, Bad Homburg, Germany) was conducted according to the operating instructions. Two SPG11 patients were not able to undergo bioimpedance spectroscopy due to an implanted intrathecal baclofen pump. Prior to measurement, patients lay down in a supine position for at least 10 min and recording electrodes were attached to one hand and one foot. Age- and gender-specific reference data had been derived from a healthy population of 1000 individuals [12], and values of the 10th and 90th percentiles had been validated as the reference range [11], from which Z-values were calculated. The three-compartment model of the BCM Body Composition Monitor was previously validated against standard reference methods for assessment of fluid status and body composition in patients with dialysis and in healthy controls [13,14,15,16].

2.4. Determination of Hypothalamic Volume

High-resolution magnetic resonance imaging (MRI) of the brain was performed in 12 SPG11 patients using a 3.0 Tesla scanner (Magnetom Tim Trio, Siemens Healthineers, Erlangen, Germany) with a gradient field strength up to 45 mT/m (72 mT/m effective). Analyses were performed on volumetric T1w sequences at an isotopic spatial resolution of 1 mm, TE of 2.52 ms, TR of 1900.00 ms, and FOV of 250 mm × 250 mm resulting in a voxel size of 1.0 mm3. As a control cohort, volumetric analysis was also performed of 12 healthy persons, matched for gender and sex, who had undergone MRI on the same scanner previously. The volume of the hypothalamus was determined using the MRICloud image processing pipeline based upon a multiple-atlas likelihood fusion algorithm providing parcellation into 265 anatomical regions [17].

2.5. Statistics

All patient-related parameters were compared using the unpaired Mann–Whitney U test. Correlation analyses were calculated by Spearman’s rho (r). Analyses were conducted in IBM SPSS 28 and graphs were generated in GraphPad Prism 8. Anonymized raw data are available from the corresponding author upon reasonable request.

3. Results

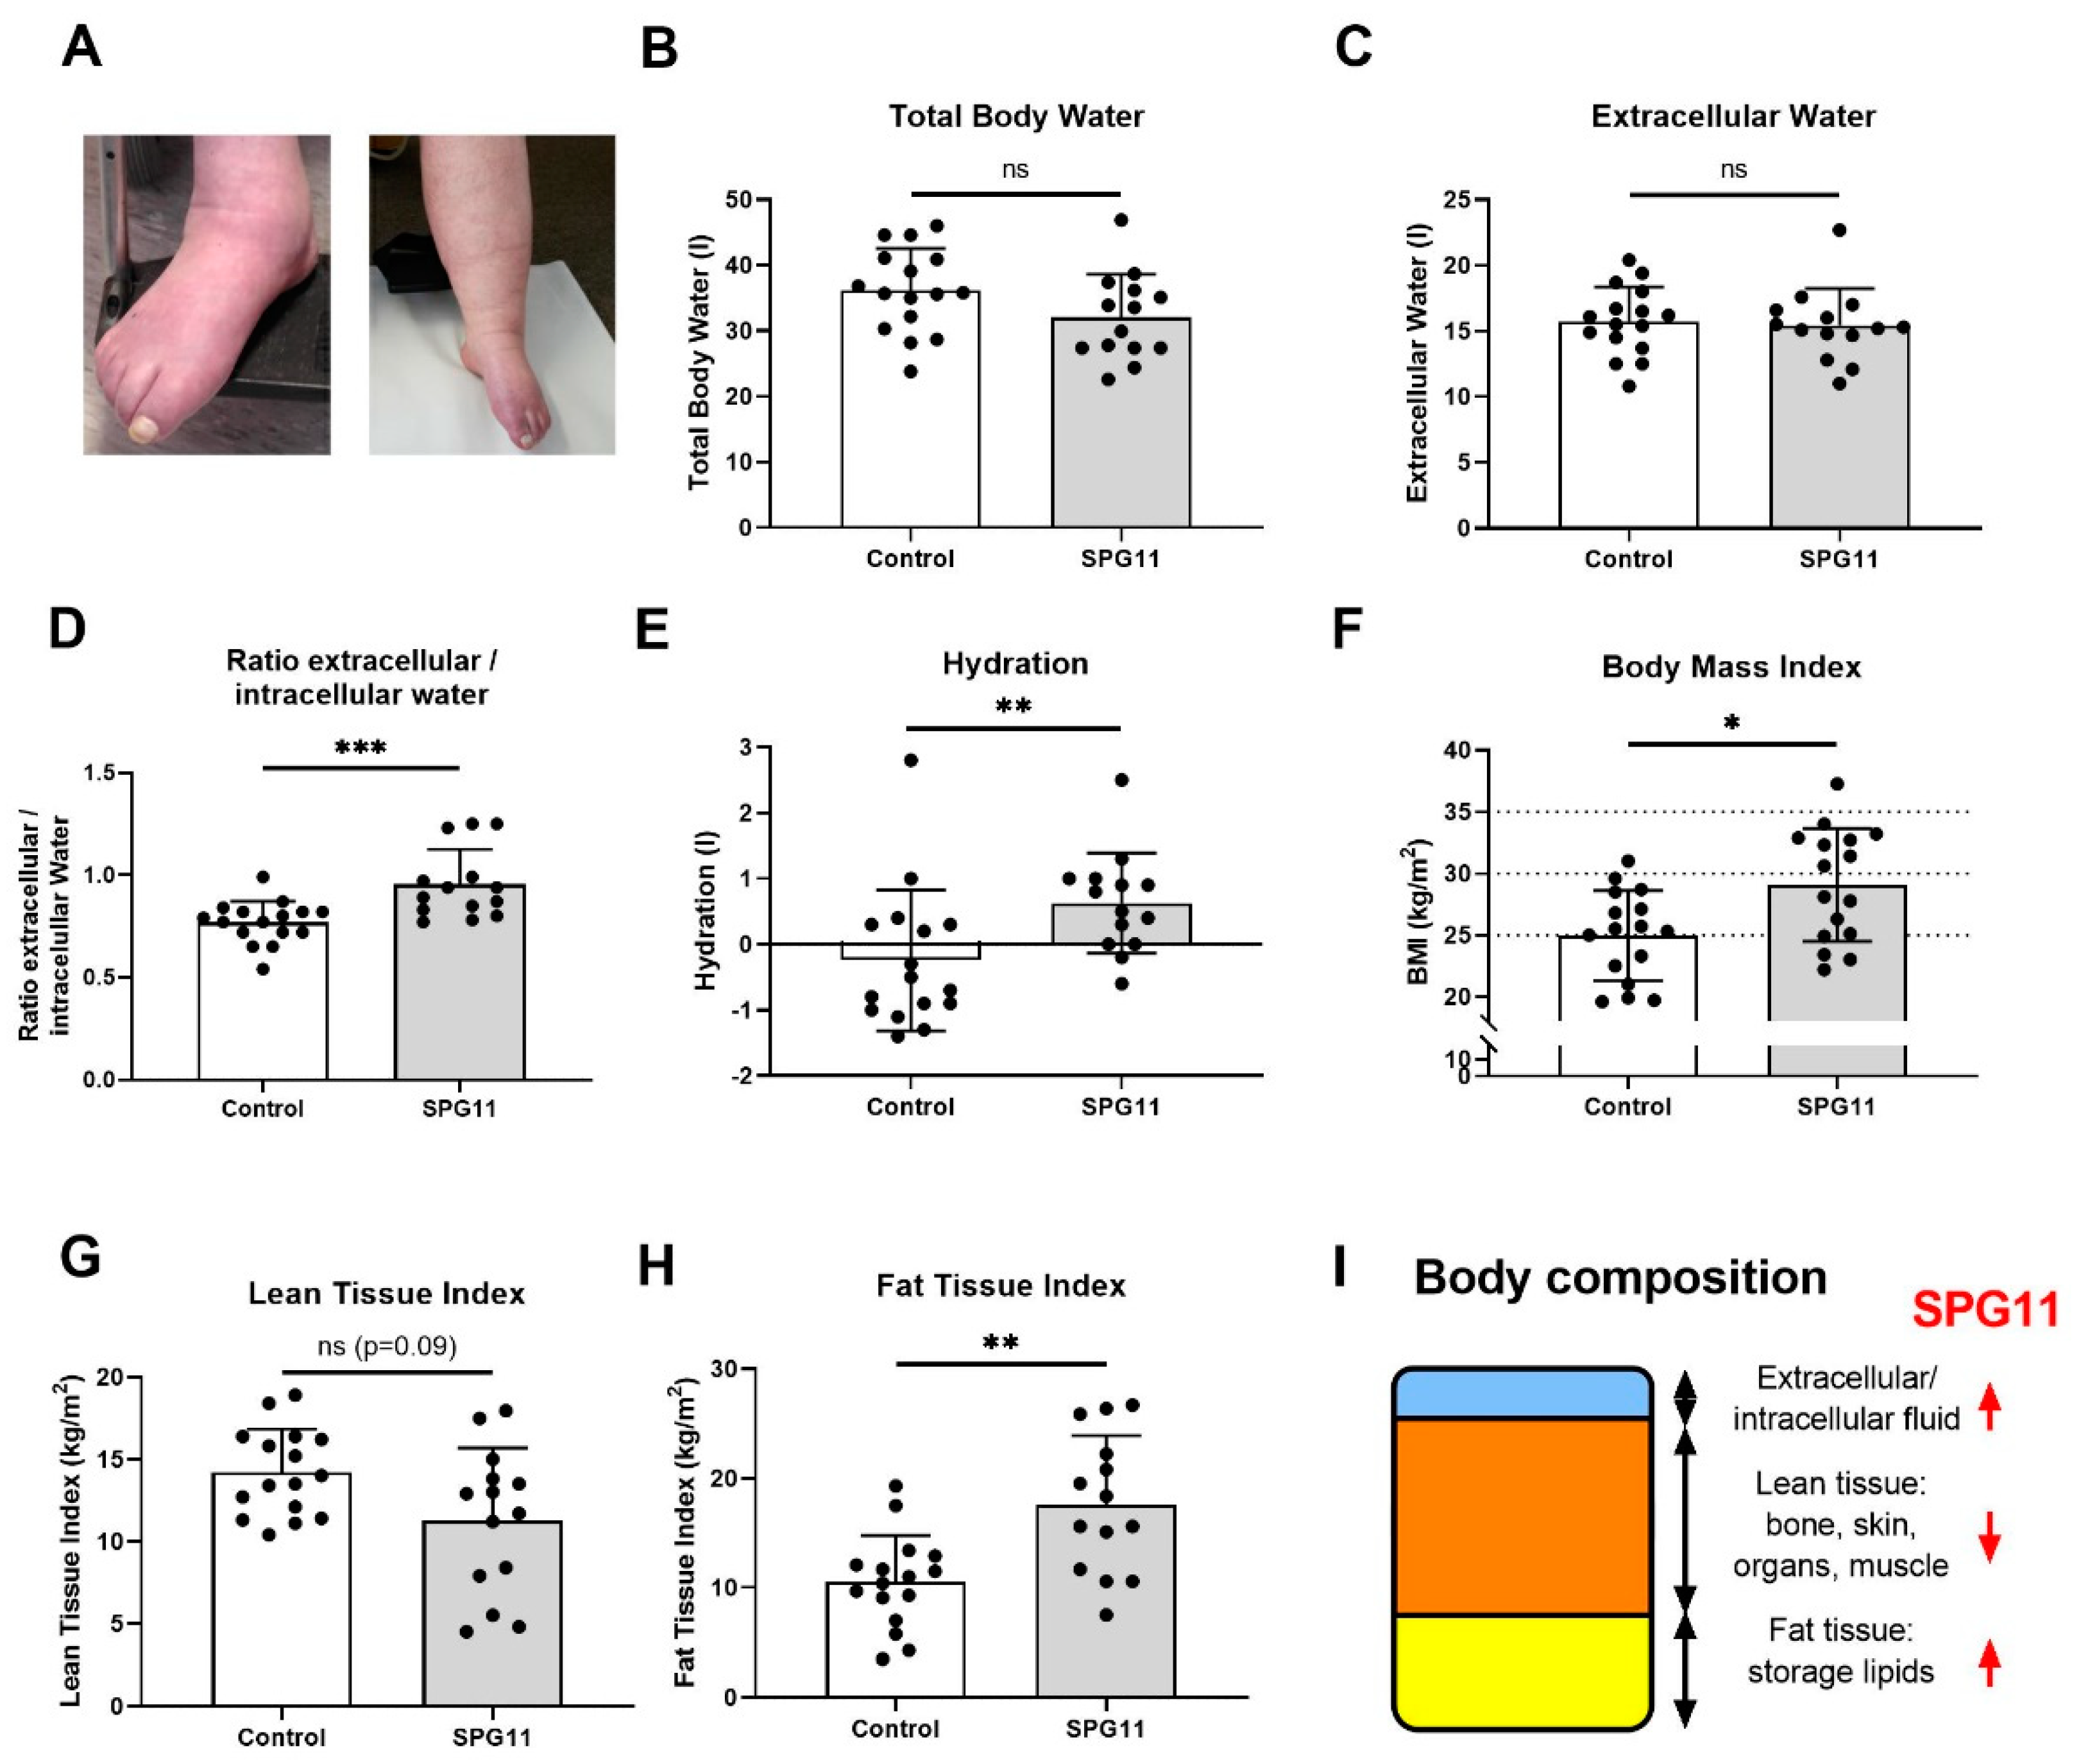
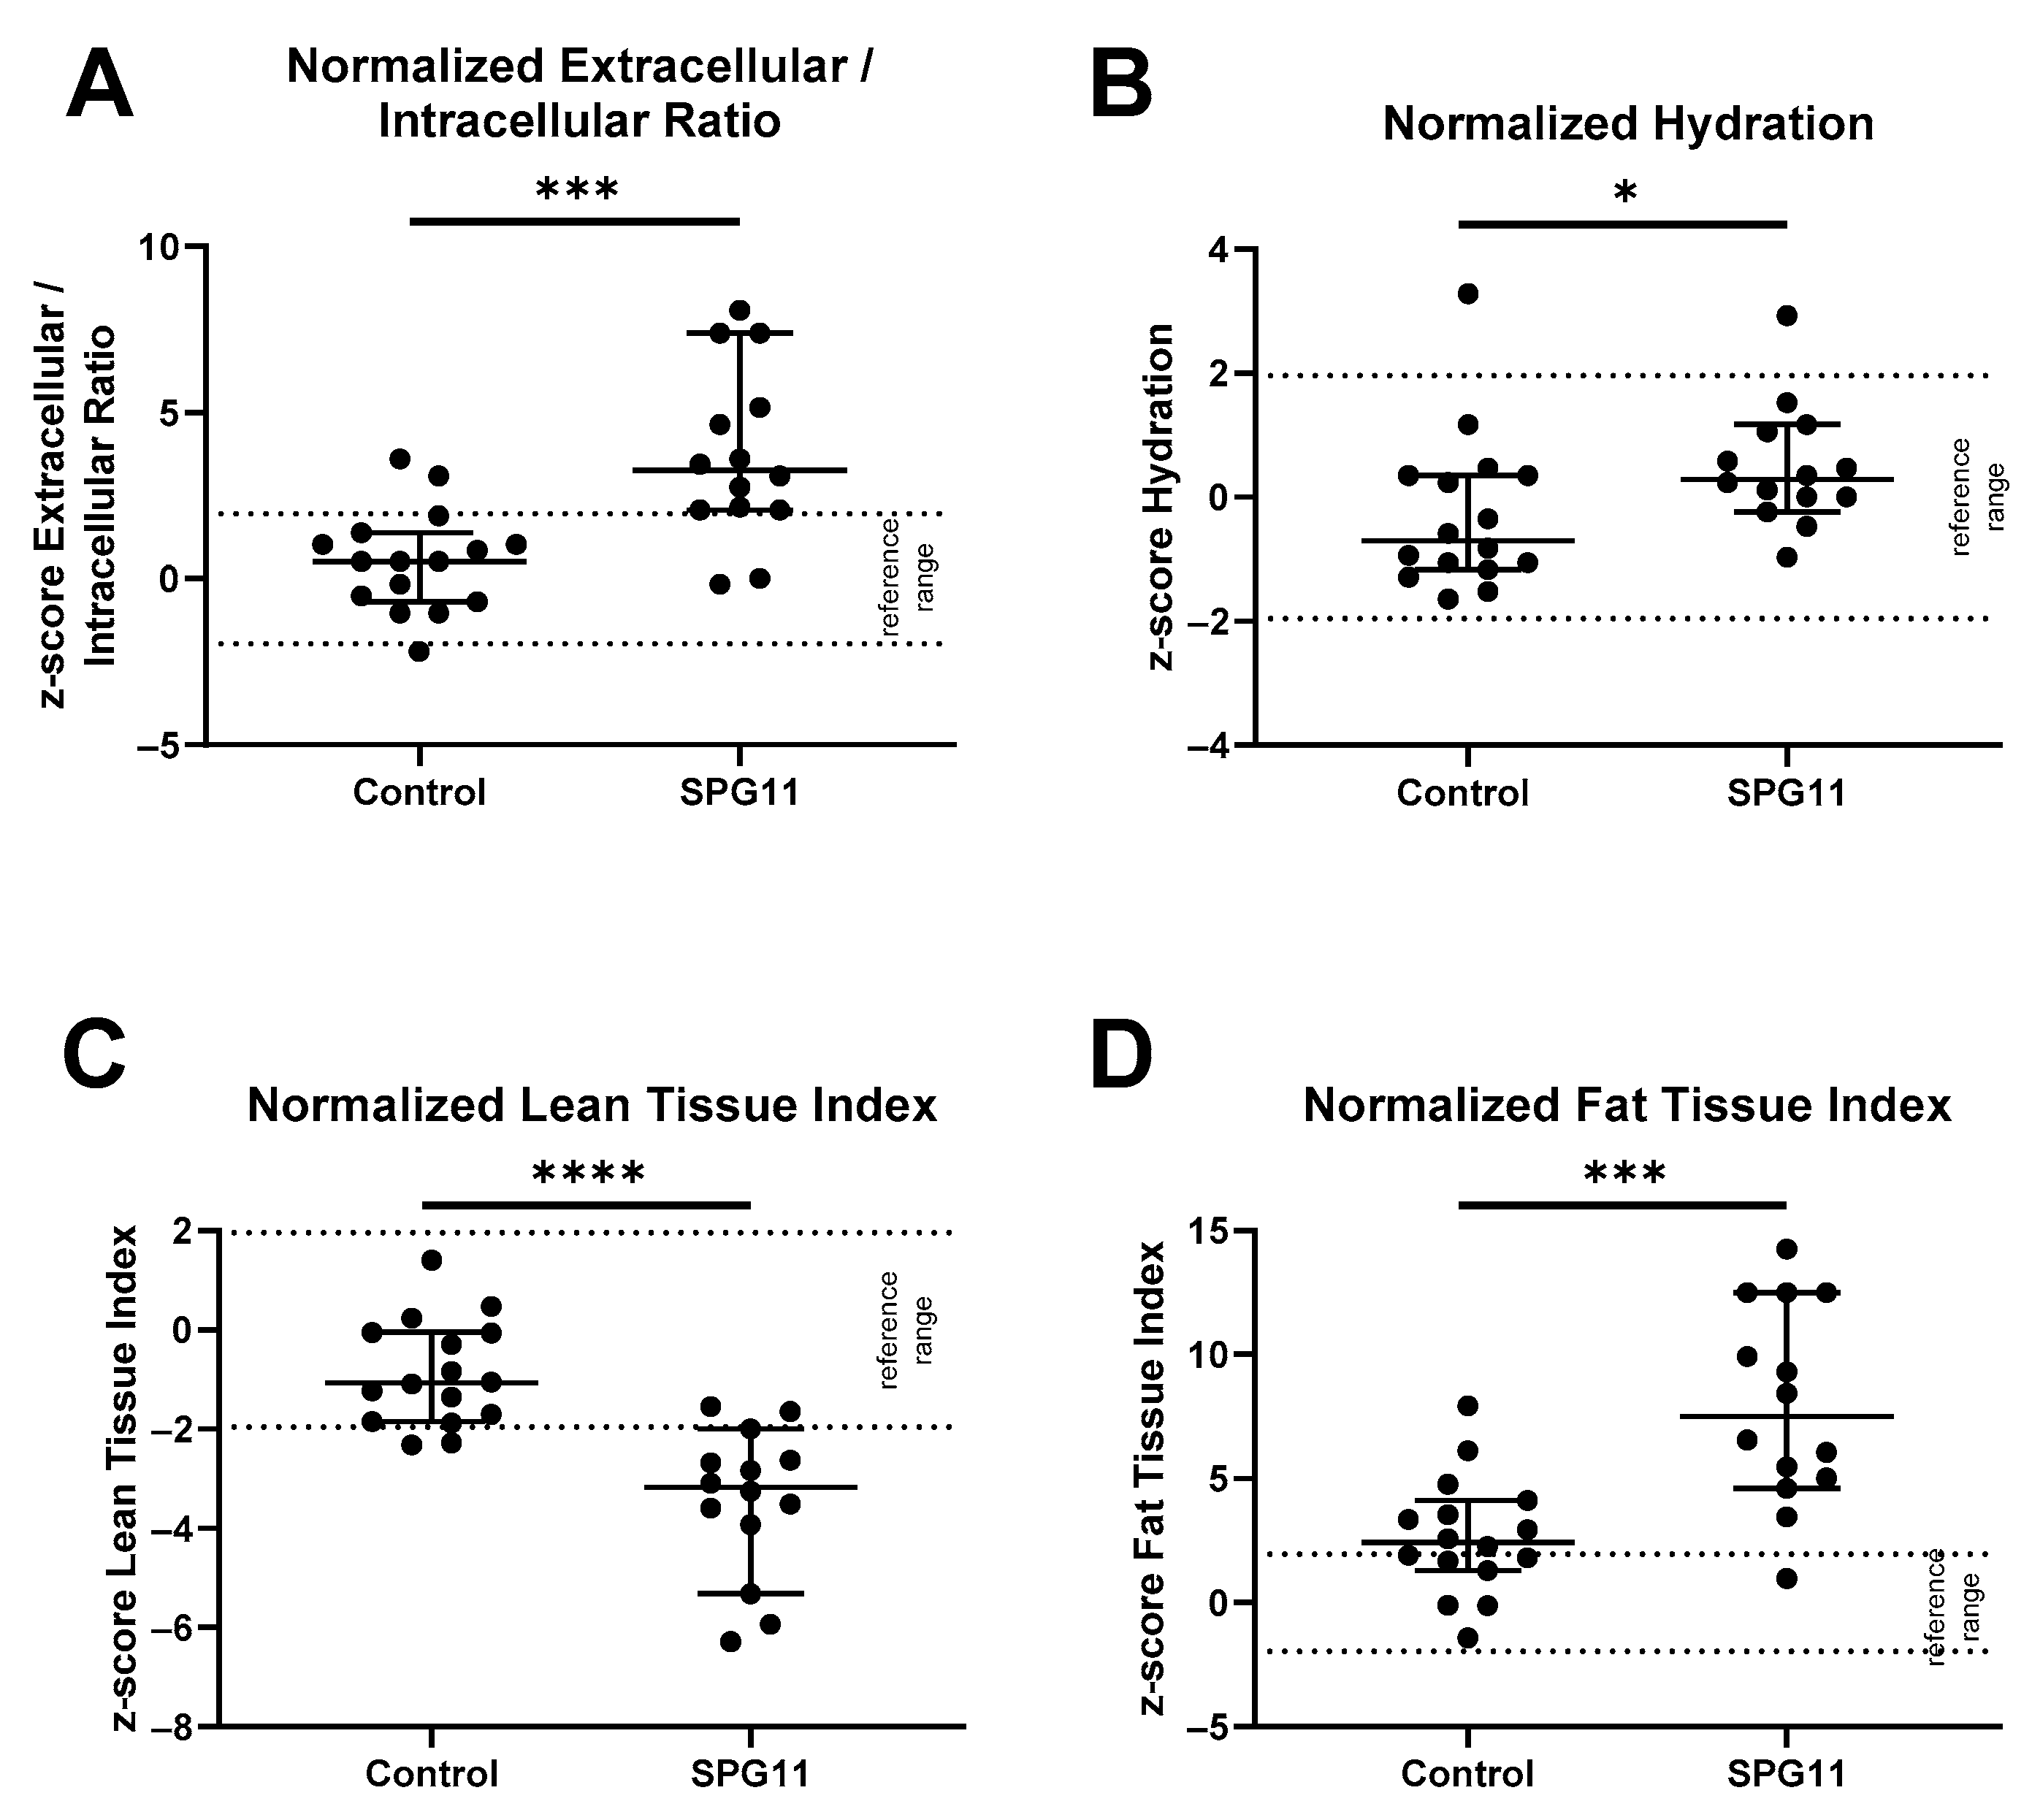
3.1. Altered Body Composition in SPG11 Patients

A total of 16 patients with genetically confirmed SPG11-HSP were recruited, including 8 females and 8 males, with an equal distribution of early, intermediate, and late disease stages (Table 1 and Table 2). Disease duration at the time of clinical examination ranged from 4 to 33 years. Nine patients were still ambulatory and six of them were dependent on the use of canes or a wheeled walker. One patient (SPG11-4) only was mildly depressed but was not on antidepressive medication. Patient SPG11-1 was on a long-term therapy with aripiprazole (10 mg OD) due to a single episode of hallucinations. Physiotherapy was regularly performed by all patients (20 to 80 min per week). Four patients received manual lymphatic drainage therapy.
Clinical signs of lymphedema were present in 10 out of 16 patients and were severe in 5 patients (Figure 1A). The body fluids and nutritional state of the SPG11 patients were analyzed by anthropometry and BIS in patients and healthy controls. Body composition was determined by BIS in 14 out of 16 patients and compared to the control group (Figure 1B–I) but also to age- and gender-matched reference values (Figure 2A–D). While the absolute values of the total body water compartment were unchanged in SPG11 (Figure 1B,C), there was an increase in the relative amount of intracellular water (Figure 1D and Figure 2A) and in the hydration state (Figure 1E and Figure 2B). Thus, bioimpedance spectroscopy confirms that there is excessive body fluid in SPG11.
As determined by BMI, four patients had a normal body weight (BMI ≤ 25 kg/m2), four patients were pre-obese (BMI 25–30), seven patients exhibited obesity class I (BMI 30–35), and one patient exhibited obesity class II (BMI 35–40). Compared to controls, BMI was significantly higher in SPG11 patients (Figure 1F, 25.0 ± 3.7 kg/m2 in controls vs. 29.1 ± 4.6 in SPG11, p = 0.021). All patients with BMI > 25 kg/m2 showed clinical signs of lymphedema indicating that both obesity and lymphedema may contribute to an increased BMI in SPG11.
In order to determine which compartment contributes to increased BMI in SPG11, the lean and fat tissue compartments were analyzed. There was a non-significant trend of reduced lean tissue index in SPG11 (Figure 1G) which was highly significant when correcting for age and sex with previously obtained reference values (Figure 2C). Conversely, fat tissue index was significantly increased in SPG11 compared to controls, both in absolute and relative values (Figure 1H and Figure 2D). While the bioimpedance measure of fat tissue index reflects energy storage lipids, lean tissue index comprises bone, skin, organ, and muscle mass. Thus, our findings show that the fat tissue and fluid compartments are increased in SPG11 at the expense of the lean tissue compartment (Figure 1I).

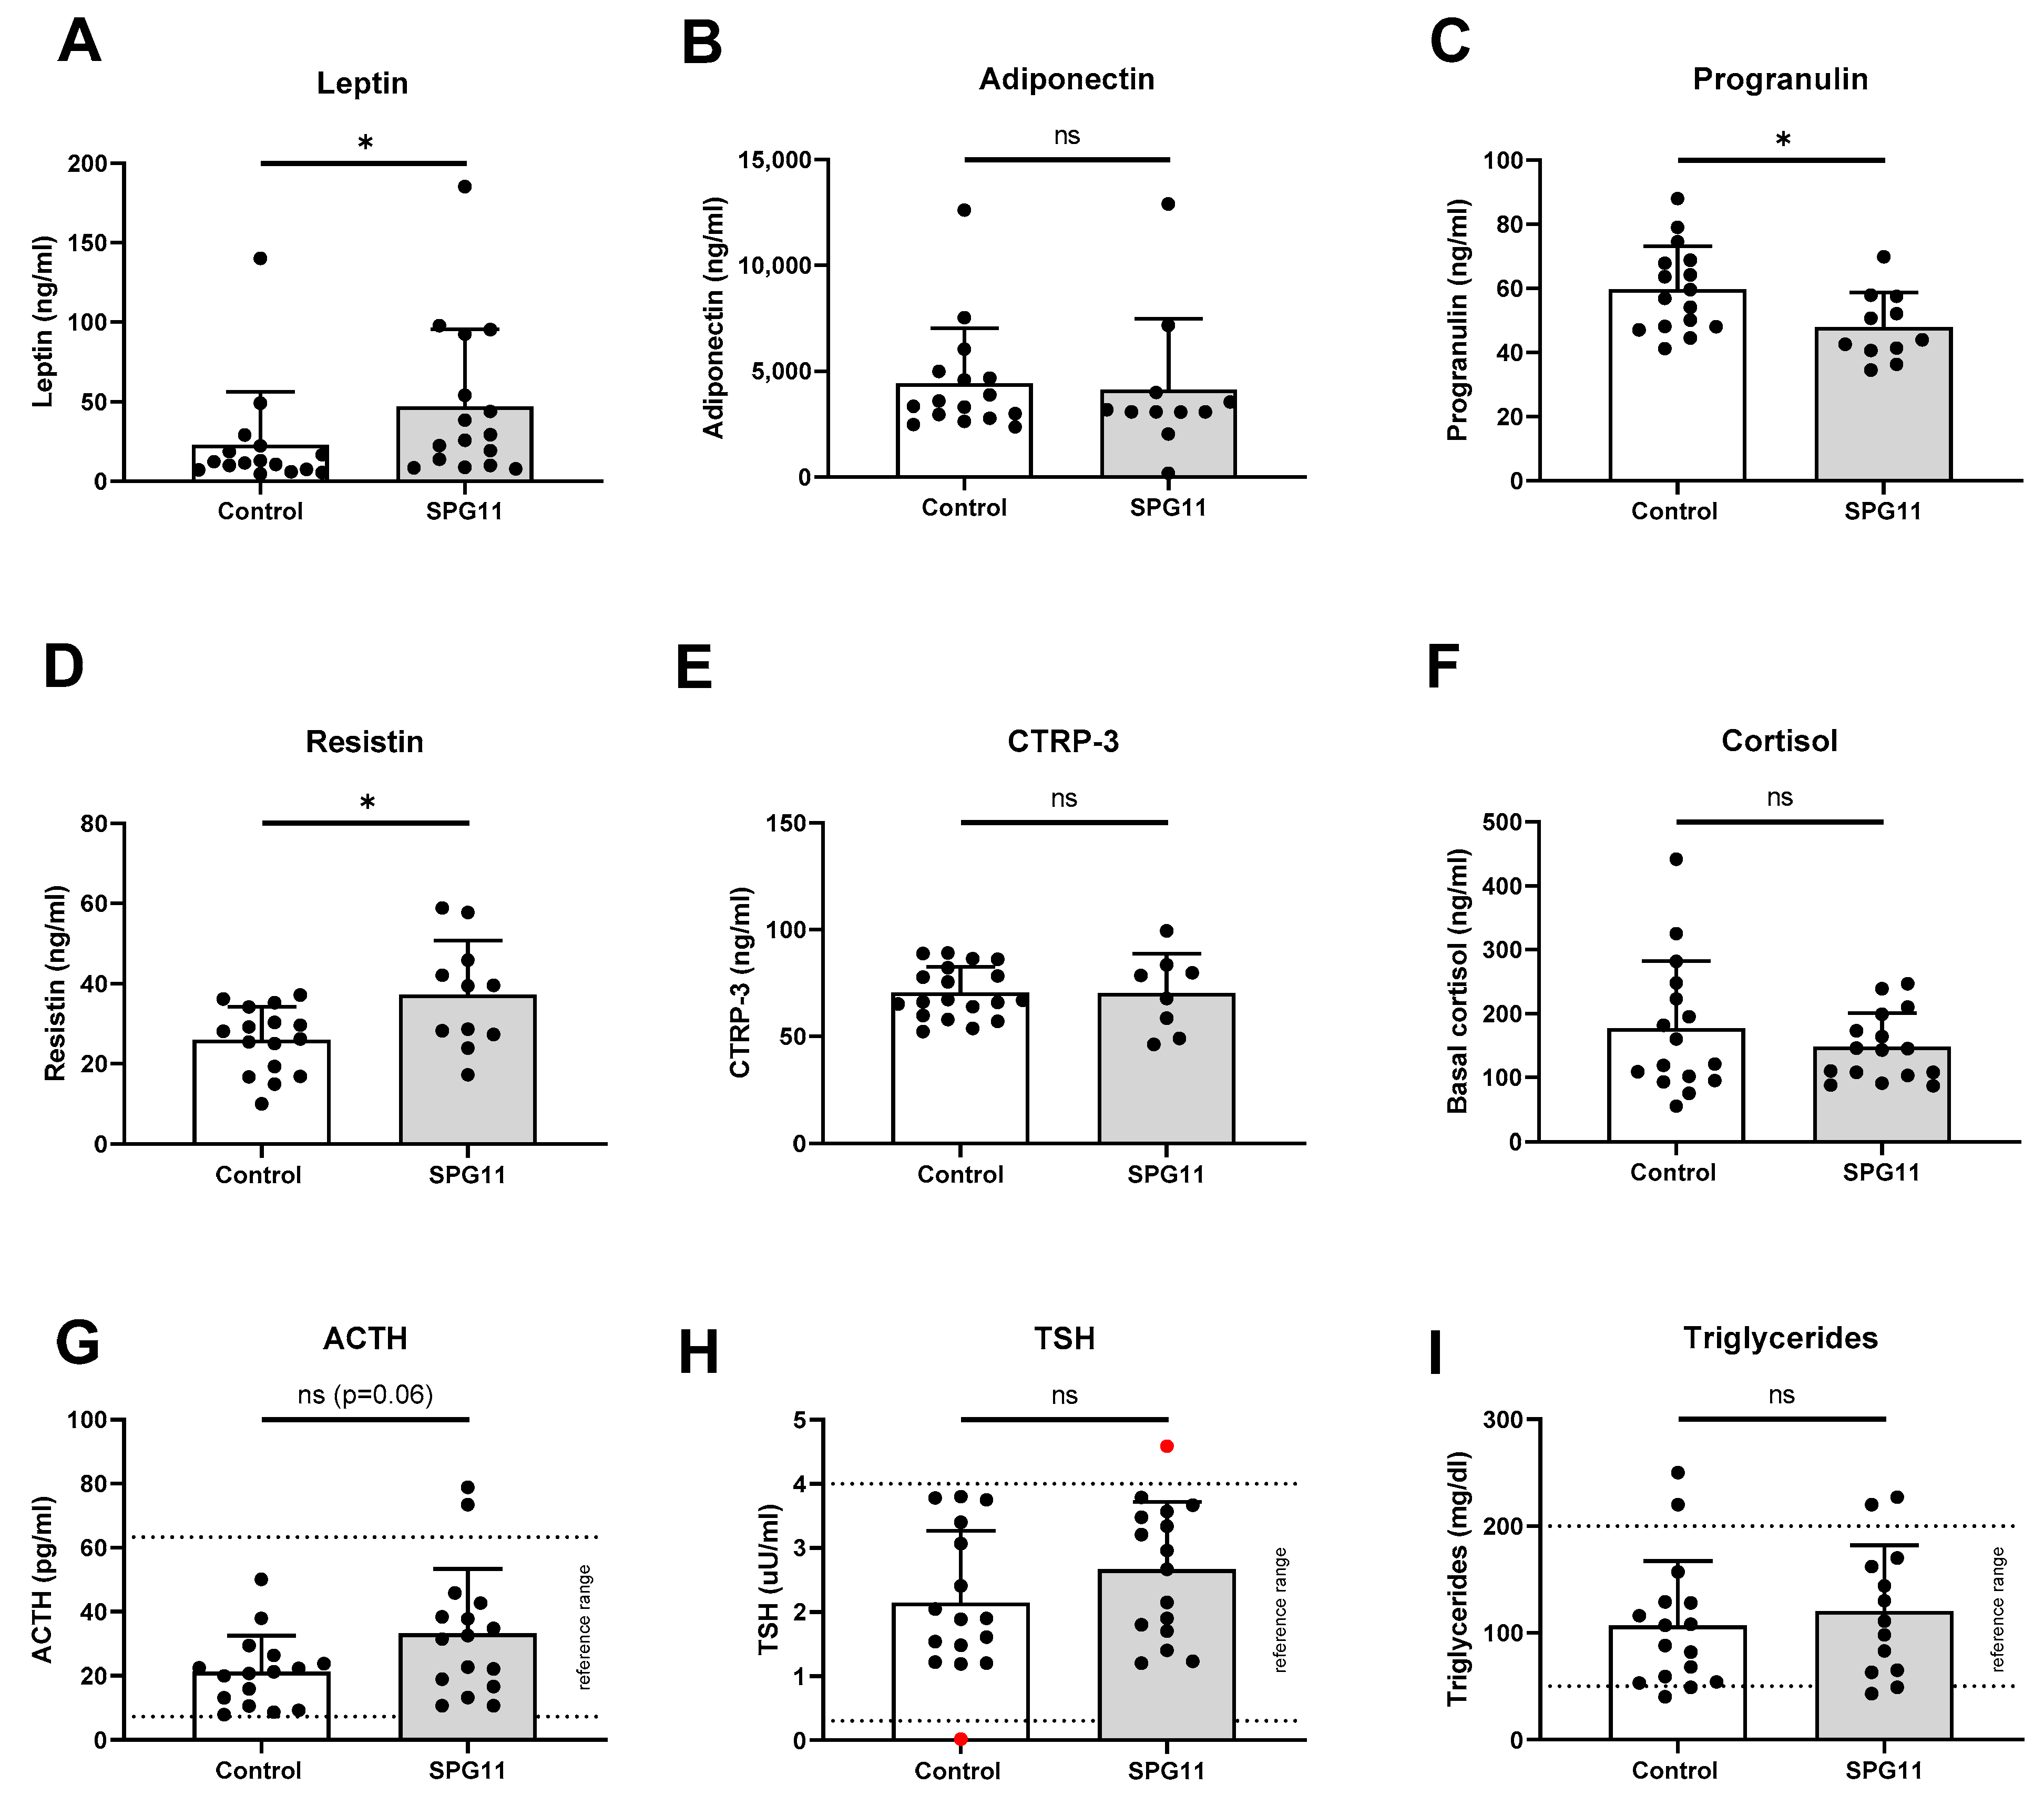
3.2. Increased Levels of Leptin in SPG11

To identify potential causes of obesity and lymphedema, we next characterized various serum parameters, obtained in a standardized fasting morning state. The hypothalamus and pituitary gland are major regulators of adipose tissue homeostasis by controlling satiety, energy expenditure metabolism, and hormone release [18]. Leptin is an adipocytokine secreted by adipose tissue and mediates its downstream effects in the central nervous system. Basal serum leptin levels were more than twofold higher in SPG11 compared to controls (Figure 3A; p < 0.05). Adiponectin, like leptin, is predominantly secreted by adipocytes, albeit in an inverse relation to adipose tissue mass. Adiponectin levels, nevertheless, were not significantly changed in SPG11 (Figure 3B). Progranulin is an additional adipocytokine with peripheral anti-inflammatory functions [19]. The levels of progranulin were significantly reduced in SPG11 (Figure 3D). Resistin, on the other hand, is a proinflammatory adipokine [20], and its levels were significantly increased in SPG11 (Figure 3D). Finally, the levels of CTRP-3, another anti-inflammatory adipocytokine, were unchanged in SPG11 (Figure 3E).

3.3. Unchanged Pituitary Gland Hormones and Lipid Parameters in SPG11

We next addressed the basal levels of the pituitary gland/adrenal gland hormones. The levels of cortisol, adrenocorticotropic hormone (ACTH), and thyroid-stimulating hormone (TSH) were unchanged in SPG11 when compared to controls (Figure 3F–H). The serum levels of triglycerides were unchanged in SPG11 (Figure 3I). In addition, electrolytes and renal function parameters as well as cholesterol, HDL, and LDL levels were within normal range.

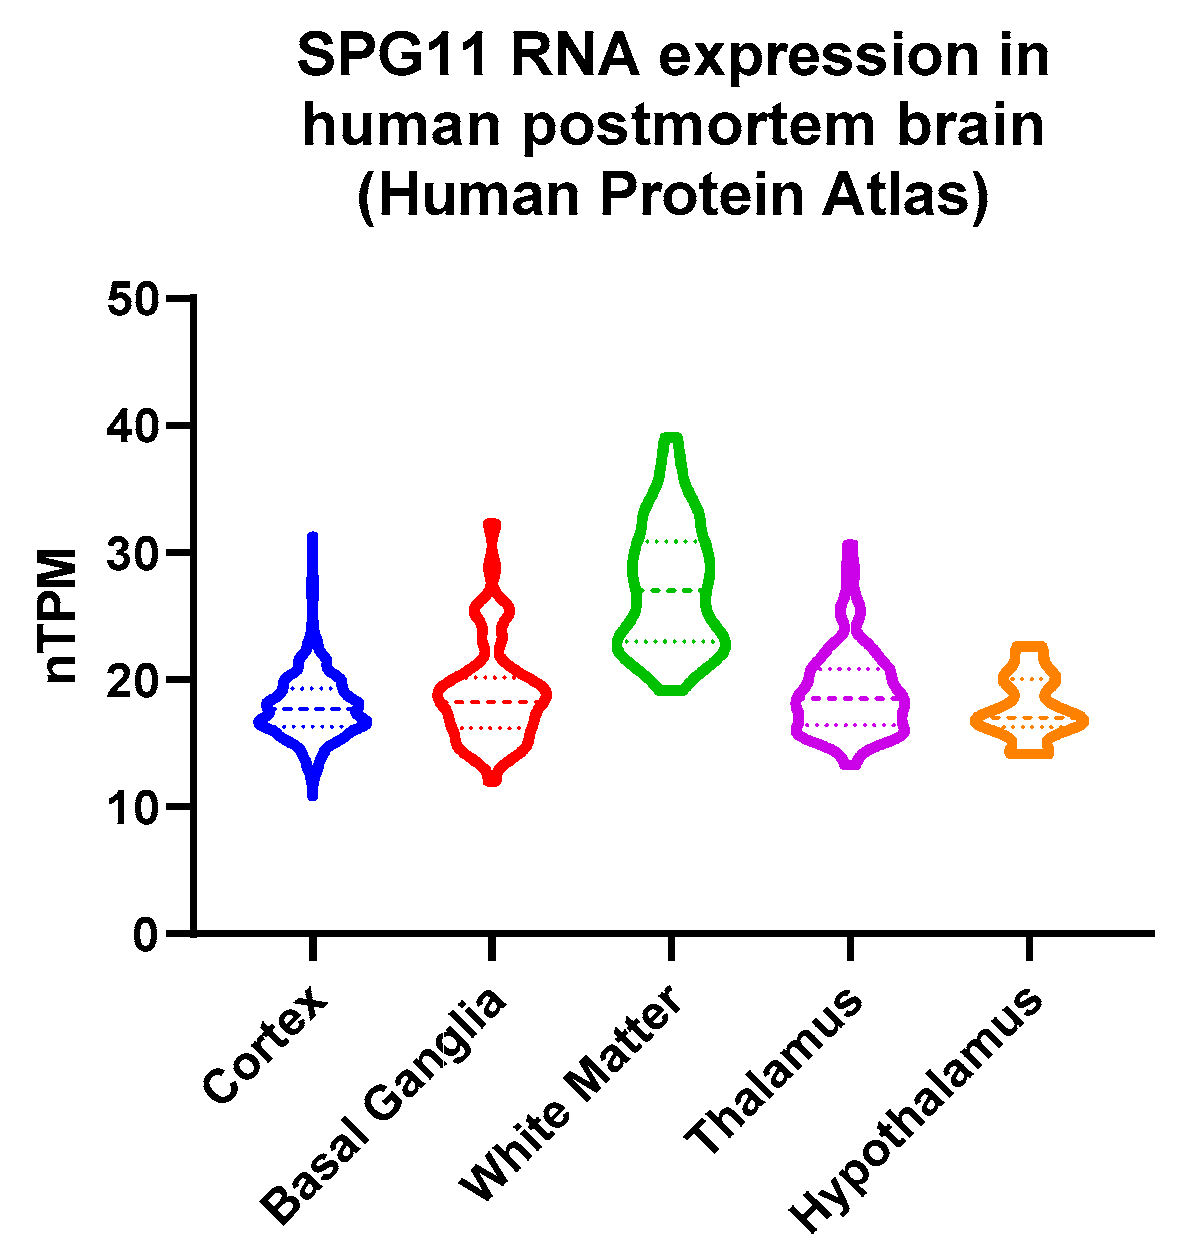
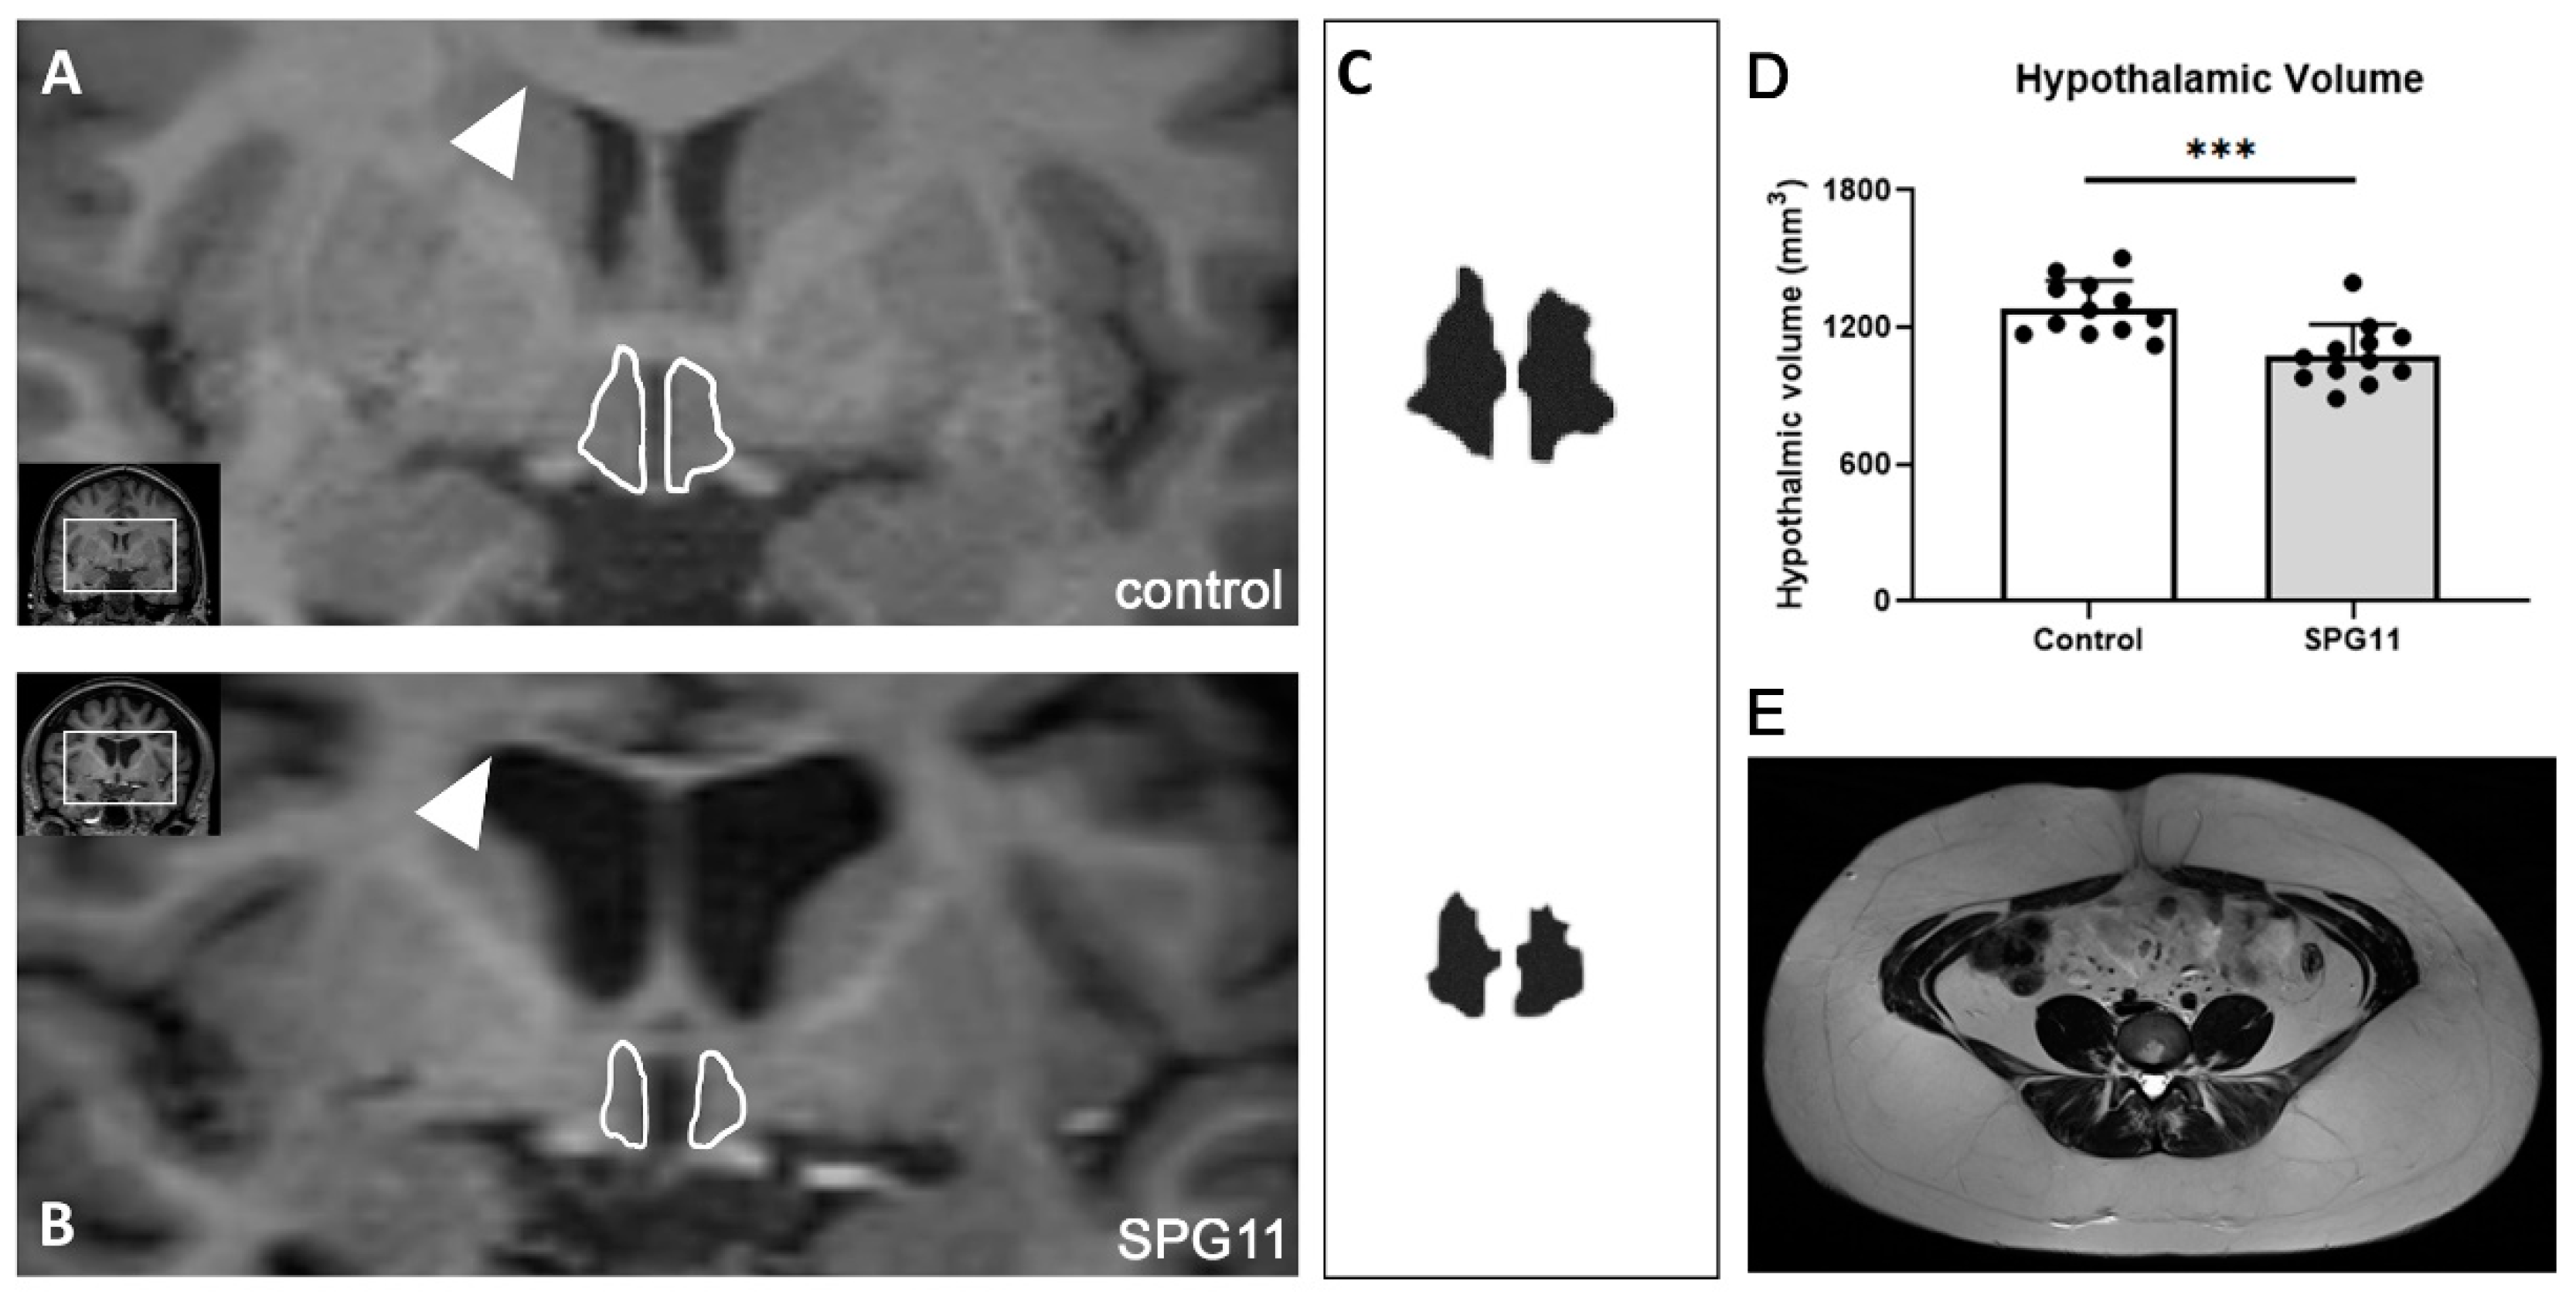
3.4. Decreased Hypothalamic Volume in SPG11

Adipocytokine receptors are predominantly expressed within the hypothalamus. In the human brain, SPG11 is expressed within the hypothalamus (Human Protein Atlas data shown in Figure 4). Consequently, SPG11-mediated neurodegenerative processes may involve hypothalamic regions. Thus, we analyzed the hypothalamic MRI volume of the SPG11 patients. There was a significant 16 % reduction in hypothalamic volume in SPG11 when compared to 1:1 matched healthy controls (1.283 ± 0.121 mm3 in controls vs. 1.079 ± 0.135 mm3 in SPG11, p = 0.0006, n = 12, Figure 5A–D). An abdominal MRI was available in a single SPG11 patient, showing excessive accumulation of both visceral and subcutaneous adipose tissue (Figure 5E).

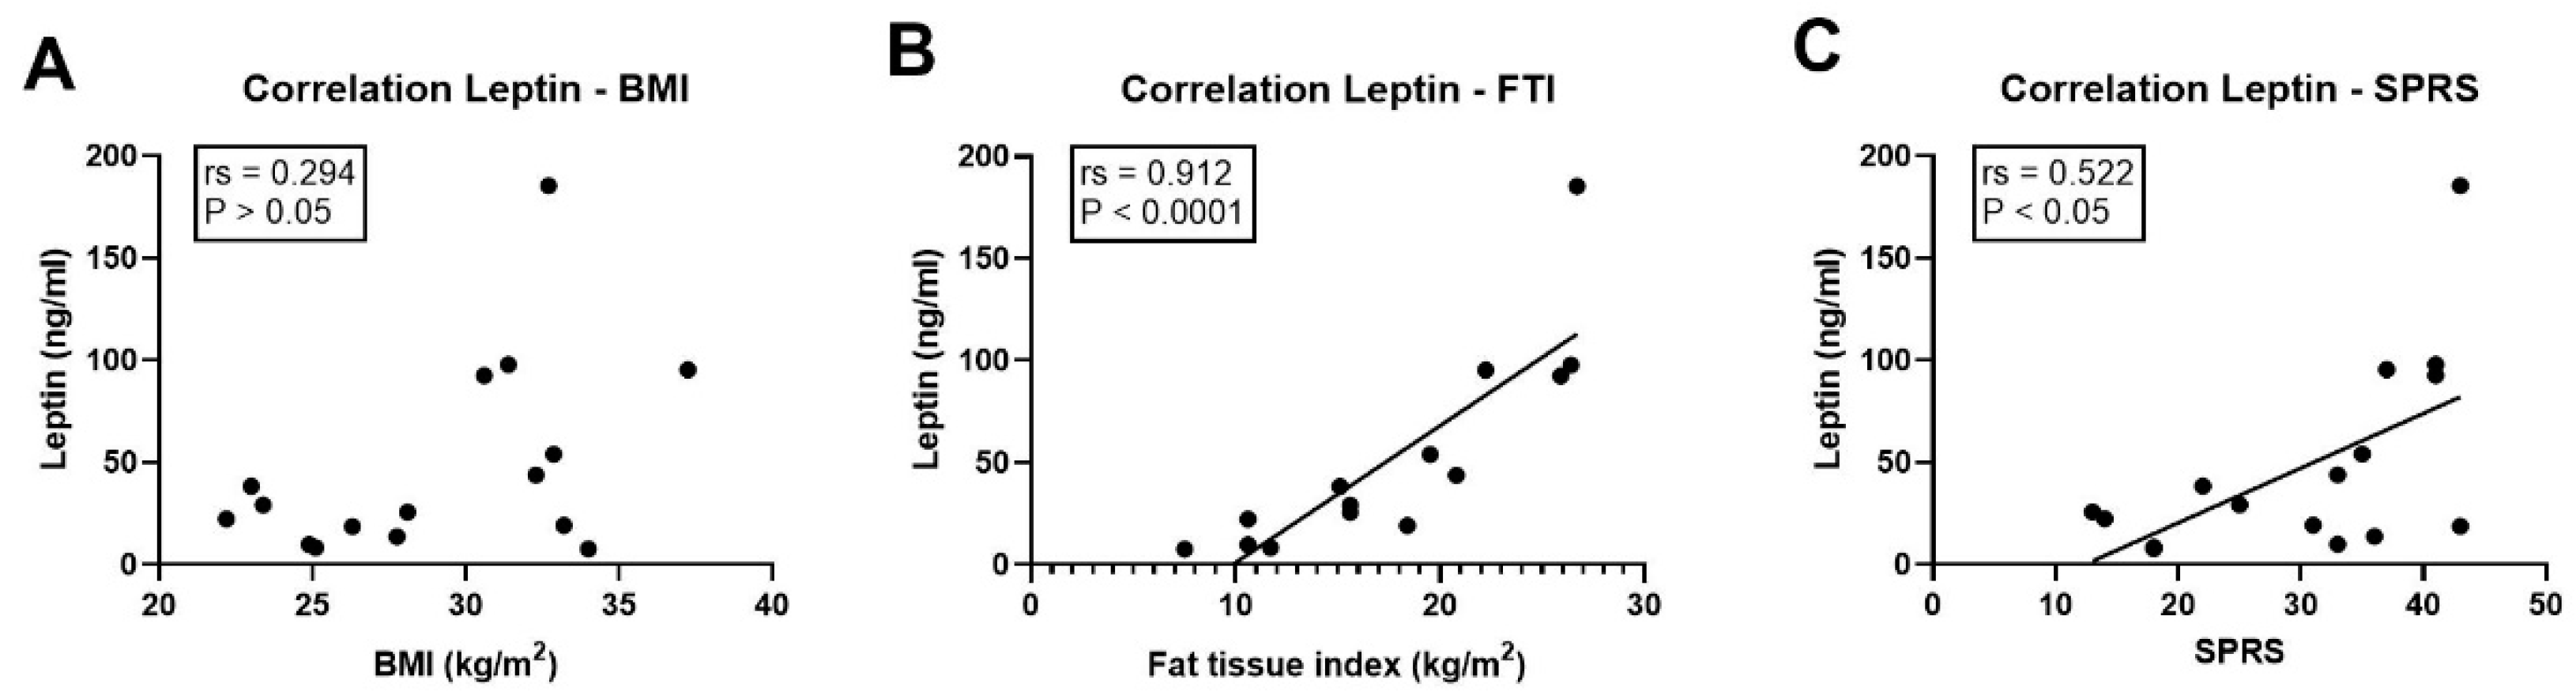
3.5. Association of Leptin with Clinical Parameters

Leptin is mainly secreted by adipocytes, and systemic leptin levels correlate with fat mass. Thus, we next addressed whether this relation was also present in the cohorts. In controls, there was a strong association of leptin levels with fat tissue index (Spearman’s rho rs = 0.762, p = 0.001) but not with BMI (rs = 0.165, p > 0.05). Likewise, within the cohort of SPG11 patients, leptin levels were also not significantly related to BMI (rs = 0.294; p > 0.05, Figure 6A), but there was a very strong and significant correlation with fat tissue index (rs = 0.912; p < 0.0001, Figure 6B). Finally, the absolute levels of leptin were significantly associated with clinical severity, as measured by the total score on the Spastic Paraplegia Rating Scale (SPRS, rs = 0.522; p < 0.05, Figure 6C).

4. Discussion

Here, we delineate a severe metabolic phenotype in SPG11 patients and provide first evidence of underlying hypothalamic leptin resistance in SPG11. The metabolic parameters in SPG11 were characterized by profound changes in body composition. While the basal pituitary hormones of the adrenal and thyroid axis were normal, serum leptin levels were increased in SPG11 patients associated with a reduced hypothalamic volume, and they correlated with the severity of HSP symptoms. Moreover, we observed changes in the systemic levels of the adipocytokines progranulin and resistin in SPG11, and we provide imaging data on hypothalamic degeneration in SPG11.

4.1. Role of Disability-Related Causes of Obesity

A high prevalence of obesity in SPG11 has been reported by several groups (summarized in Table 3), but a more detailed characterization has been lacking. As SPG11 results in rapidly progressing motor disability, immobility might be the primary cause of obesity in SPG11. In line with this hypothesis, there were significant correlations of leptin levels with fat tissue index and SPRS scores. The presence of a disease-specific metabolic phenotype is supported by the observation that obesity segregated with the disease in two families (index patients SPG11-1 and SPG11-4). The etiology of obesity in SPG11 may be different from the well-described metabolic syndrome because none of the SPG11 patients was affected by diabetes, arterial hypertension, or coronary artery disease. Furthermore, there were no differences in lipid parameters compared to controls.
Antispastic therapy using baclofen was prescribed for most of our patients, but baclofen has been shown to reduce body weight and is thus less likely to induce the present severe obesity phenotype in our patient cohort [22]. While obesity and depression are linked reciprocally [23], only one patient in our cohort was depressed. In this patient, obesity preceded the onset of depression by years, and obesity with progressive motor impairments were closely linked to her mood including social withdrawal.
Neuropsychological deficits were present in all patients in varying degrees. Weight loss was reported as an early feature of cognitive impairment, caused by the general effect of aging on hormonal balance, slowly emerging apathy, or olfactory dysfunction [24]. On the other hand, obesity is an established symptom of certain genetic syndromes with intellectual disability. In 22q11.2 deletion syndrome, obesity has been related to alterations in mitochondrial pathways [25]. Another example of disease-specific metabolic changes is in Prader Willi syndrome where the presence of obesity has been directly linked to the loss or the imprinting of different chromosome regions [26].
Table 3. Obesity and lymphedema in previous case series of SPG11.
Ref.No. of FamiliesNo. of SPG11 PatientsNo. (%) of Obese
Patients
No. (%) of
Patients with Edema
Remarks
[27]122 (100%)2 (100%)Absence of obesity in 4 unaffected siblings.
[28]242 (50%)not reported
[4]20381 (3%)not reported
[29]153 (60%)not reported
[30]442 (50%)not reportedPatients with Kjellin’s syndrome.
[31]34not reported1 (25%)Congenital left leg lymphedema.
[5]91418 (78%)not reportedFive patients were still ambulatory.
[7]24not reported2 (50%)Two members of same family affected.
[6]n/a205 (25%)n/aIncludes patients from [32]; increased BMI compared to FRDA individuals.
this report141612 (75%)10 (63%)Includes 2 patients from [27].
Summary of previous case series of patients with SPG11 where “obesity” or “edema” were reported. Number of families includes sporadic patients.

4.2. Implications of Increased Leptin Levels

Elevated leptin levels provide evidence for a central nervous system-mediated mechanism of obesity in SPG11. Considering the fact that the increase in BMI was probably partly due to coexisting lymphedema, the relative increase in leptin levels may even be more pronounced. Leptin is produced by adipocytes and reflects lipid content [33]. Homozygous mutations of the leptin receptor lead to increased leptin levels and obesity along with impaired pubertal development and reduced levels of growth hormone and TSH [34]. TSH levels were within normal limits in our patient cohort and there was no clinical evidence for growth hormone deficiency.
Although not explicitly described for the hypothalamic region, post-mortem neuropathological reports on a total of five patients with SPG11-HSP described widespread neuronal loss in the brain and spinal cord [35,36,37,38]. Our finding of a decreased hypothalamic volume in the MRI volumetric analysis is in line with a similar observation in a Brazilian study [6], further underlining the role of hypothalamic damage in SPG11. Progressive and widespread cortical and subcortical atrophy is a known feature of SPG11, and our data thus confirm that the hypothalamus is also involved in this disease. Whereas altered dopamine metabolism was described in SPG11 patients [31,39], our study focused on hypothalamic/pituitary/adrenal gland hormones in SPG11. The reduction in cerebral glucose metabolism was most pronounced in the thalamus of two patients with HSP and a thin corpus callosum [40]. Although a molecular genetic diagnosis of SPG11 was not performed, this might indicate that hypothalamic function is also impaired in SPG11. There is a phenotypic and neuropathological overlap between SPG11 (also termed ALS5) and amyotrophic lateral sclerosis [35,41]. A population-based study showed decreased leptin levels in patients with amyotrophic lateral sclerosis which was mainly related to a decrease in BMI [42]. Alterations in hypothalamic volume have been described in both sporadic and familial motor neuron disease [43]. Further studies are required to dissect the impact of SPG11-HSP on the molecular pathway governing the brain–adipose axis in more detail.
In addition to the hypothalamus, leptin receptors are expressed in many regions of the brain including the neocortex [44,45]. Leptin receptor signalling promotes axonal growth of cortical neurons via the inactivation of GSK3ß [46], a mechanism which has been implicated in SPG11 [47,48,49]. Mutations in SPG13 cause pure autosomal dominant hereditary spastic paraplegia, and its gene product, HSP60, was reduced in the hypothalamus of leptin receptor-deficient mice [50]. Subcellular localization of SPATACSIN, on the other hand, partly overlapped with HSP60 in mitochondria [51], and, strikingly, altered mitochondrial function has been implicated in SPG11 [52,53]. Thus, mitochondrial dysfunction may be a potential mechanism of altered leptin signalling in SPG11.

4.3. Immune–Metabolic Implications of Dysregulated Progranulin and Resistin

While the levels of the additional adipokines adiponectin and CTRP-3 were unchanged in SPG11, we were able to identify a dysregulation of additional inflammation-related adipocytokines, i.e., decreased levels of progranulin and increased levels of resistin. Resistin is a proinflammatory adipocytokine which is secreted by monocytes and upregulated upon systemic inflammation [20]. Resistin and progranulin cross the blood–brain barrier which is enhanced under inflammatory conditions [10]. The relevance of immune–metabolic interplay was highlighted by a recent study suggesting that caloric restriction-related longevity is mediated by anti-inflammatory responses [54]. The observed proinflammatory alterations of specific adipocytokines in SPG11 should thus be studied in larger patient cohorts, including detailed analyses of the peripheral and central nervous system immune cells [55].

5. Conclusions

Lymphedema and dysregulated adipose homeostasis are frequent symptoms in SPG11-HSP and may be directly linked to hypothalamic adipocytokine resistance leading to a dysfunctional brain–adipose axis. Further research is needed to clarify whether a targeted metabolic intervention may prolong mobility in SPG11.

Author Contributions

Conceptualization, M.R., Z.K., B.W. and J.W.; methodology, A.S., I.T.S., D.C.M. and C.K.; formal analysis, M.R., L.K., M.A.S. and D.C.M.; resources, A.D., T.K., B.W. and J.W.; writing—original draft preparation, M.R.; writing—review and editing, L.K., M.A.S., A.S., Z.K., T.K., B.W. and J.W.; funding acquisition, M.R., Z.K., B.W. and J.W. All authors have read and agreed to the published version of the manuscript.

Funding

This research was funded by Deutsche Forschungsgemeinschaft (German Research Foundation; 270949263/GRK2162 to M.R., B.W., and J.W.; WI 3567/2-1 to B.W.; SCHM 3261/3-1 to A.S.), by the German Bundesministerium für Bildung und Forschung (BMBF) through the TreatHSP consortium (01GM1905B to M.R., B.W., and J.W.), by the Tom Wahlig Foundation, by the “Förderverein für HSP-Forschung”, and by the “Forschungsstiftung Medizin” at the University Hospital Erlangen. M.R. is a fellow of the Clinician Scientist Programme (IZKF, University Hospital Erlangen).

Institutional Review Board Statement

The study was conducted in accordance with the Declaration of Helsinki and approved by the ethics committee of the Friedrich-Alexander-Universität Erlangen-Nürnberg (FAU), Erlangen, Germany (no. 17-347-B, 26 January 2018).

Informed Consent Statement

Informed consent was obtained from all subjects involved in the study.

Data Availability Statement

The data that support the findings of this study are available on request from the corresponding author (M.R.).

Acknowledgments

The authors would like to thank all patients and controls. In addition, the authors would like to thank Tatyana Pozner and Helmut-Günther Dörr for critical discussion and help with data interpretation. The present work was performed in partial fulfillment of the requirements for obtaining the degree “Dr. med.” (I.T.S.).

Conflicts of Interest

The authors declare no conflict of interest.

References

  1. Kara, E.; Tucci, A.; Manzoni, C.; Lynch, D.S.; Elpidorou, M.; Bettencourt, C.; Chelban, V.; Manole, A.; Hamed, S.A.; Haridy, N.A.; et al. Genetic and Phenotypic Characterization of Complex Hereditary Spastic Paraplegia. Brain 2016, 139, 1904–1918. [Google Scholar] [CrossRef] [PubMed] [Green Version]
  2. Schüle, R.; Wiethoff, S.; Martus, P.; Karle, K.N.; Otto, S.; Klebe, S.; Klimpe, S.; Gallenmüller, C.; Kurzwelly, D.; Henkel, D.; et al. Hereditary Spastic Paraplegia: Clinicogenetic Lessons from 608 Patients. Ann. Neurol. 2016, 79, 646–658. [Google Scholar] [CrossRef] [PubMed]
  3. Pozner, T.; Regensburger, M.; Engelhorn, T.; Winkler, J.; Winner, B. Janus-Faced Spatacsin (SPG11): Involvement in Neurodevelopment and Multisystem Neurodegeneration. Brain 2020, 143, 2369–2379. [Google Scholar] [CrossRef] [PubMed]
  4. Stevanin, G.; Azzedine, H.; Denora, P.; Boukhris, A.; Tazir, M.; Lossos, A.; Rosa, A.L.; Lerer, I.; Hamri, A.; Alegria, P.; et al. Mutations in SPG11 Are Frequent in Autosomal Recessive Spastic Paraplegia with Thin Corpus Callosum, Cognitive Decline and Lower Motor Neuron Degeneration. Brain 2008, 131, 772–784. [Google Scholar] [CrossRef] [Green Version]
  5. Bot, S.T.D.; Burggraaff, R.C.; Herkert, J.C.; Schelhaas, H.J.; Post, B.; Diekstra, A.; van Vliet, R.O.; van der Knaap, M.S.; Kamsteeg, E.-J.; Scheffer, H.; et al. Rapidly Deteriorating Course in Dutch Hereditary Spastic Paraplegia Type 11 Patients. Eur. J. Hum. Genet. 2013, 21, 1312–1315. [Google Scholar] [CrossRef] [Green Version]
  6. Cardozo-Hernández, A.L.D.C.; Rezende, T.J.R.; França, M.C. Hereditary Spastic Paraplegia Type 11 (SPG11) Is Associated with Obesity and Hypothalamic Damage. J. Neurol. Sci. 2020, 416, 116982. [Google Scholar] [CrossRef]
  7. Manole, A.; Chelban, V.; Haridy, N.A.; Hamed, S.A.; Berardo, A.; Reilly, M.M.; Houlden, H. Severe Axonal Neuropathy Is a Late Manifestation of SPG11. J. Neurol. 2016, 263, 2278–2286. [Google Scholar] [CrossRef] [Green Version]
  8. Zung, W.W. A Self-Rating Depression Scale. Arch. Gen. Psychiatry 1965, 12, 63–70. [Google Scholar] [CrossRef]
  9. Schmid, A.; Berghoff, M.; Hochberg, A.; Schäffler, A.; Karrasch, T. CTRP-3 Is Permeable to the Blood-Brain Barrier and Is Not Regulated by Glucose or Lipids in Vivo. Eur. J. Clin. Investig. 2017, 47, 203–212. [Google Scholar] [CrossRef]
  10. Berghoff, M.; Hochberg, A.; Schmid, A.; Schlegel, J.; Karrasch, T.; Kaps, M.; Schäffler, A. Quantification and Regulation of the Adipokines Resistin and Progranulin in Human Cerebrospinal Fluid. Eur. J. Clin. Investig. 2016, 46, 15–26. [Google Scholar] [CrossRef]
  11. Marcelli, D.; Usvyat, L.A.; Kotanko, P.; Bayh, I.; Canaud, B.; Etter, M.; Gatti, E.; Grassmann, A.; Wang, Y.; Marelli, C.; et al. Body Composition and Survival in Dialysis Patients: Results from an International Cohort Study. Clin. J. Am. Soc. Nephro. 2015, 10, 1192–1200. [Google Scholar] [CrossRef] [PubMed] [Green Version]
  12. Wabel, P.; Chamney, P.; Moissl, U.; Jirka, T. Importance of Whole-Body Bioimpedance Spectroscopy for the Management of Fluid Balance. Blood Purificat. 2009, 27, 75–80. [Google Scholar] [CrossRef] [PubMed]
  13. Chamney, P.W.; Wabel, P.; Moissl, U.M.; Müller, M.J.; Bosy-Westphal, A.; Korth, O.; Fuller, N.J. A Whole-Body Model to Distinguish Excess Fluid from the Hydration of Major Body Tissues. Am. J. Clin. Nutr. 2007, 85, 80–89. [Google Scholar] [CrossRef] [PubMed] [Green Version]
  14. Moissl, U.M.; Wabel, P.; Chamney, P.W.; Bosaeus, I.; Levin, N.W.; Bosy-Westphal, A.; Korth, O.; Müller, M.J.; Ellegård, L.; Malmros, V.; et al. Body Fluid Volume Determination via Body Composition Spectroscopy in Health and Disease. Physiol. Meas. 2006, 27, 921–933. [Google Scholar] [CrossRef] [PubMed]
  15. Mulasi, U.; Kuchnia, A.J.; Cole, A.J.; Earthman, C.P. Bioimpedance at the Bedside. Nutr. Clin. Pract. 2015, 30, 180–193. [Google Scholar] [CrossRef] [Green Version]
  16. Passauer, J.; Petrov, H.; Schleser, A.; Leicht, J.; Pucalka, K. Evaluation of Clinical Dry Weight Assessment in Haemodialysis Patients Using Bioimpedance Spectroscopy: A Cross-Sectional Study. Nephrol. Dial. Transpl. 2010, 25, 545–551. [Google Scholar] [CrossRef] [Green Version]
  17. Tang, X.; Oishi, K.; Faria, A.V.; Hillis, A.E.; Albert, M.S.; Mori, S.; Miller, M.I. Bayesian Parameter Estimation and Segmentation in the Multi-Atlas Random Orbit Model. PLoS ONE 2013, 8, e65591. [Google Scholar] [CrossRef] [Green Version]
  18. Friedman, J.M. Causes and Control of Excess Body Fat. Nature 2009, 459, 340–342. [Google Scholar] [CrossRef]
  19. Nguyen, A.D.; Nguyen, T.A.; Martens, L.H.; Mitic, L.L.; Farese, R.V. Progranulin: At the Interface of Neurodegenerative and Metabolic Diseases. Trends Endocrinol. Metab. 2013, 24, 597–606. [Google Scholar] [CrossRef] [Green Version]
  20. Steppan, C.M.; Lazar, M.A. The Current Biology of Resistin. J. Intern. Med. 2004, 255, 439–447. [Google Scholar] [CrossRef]
  21. Sjöstedt, E.; Zhong, W.; Fagerberg, L.; Karlsson, M.; Mitsios, N.; Adori, C.; Oksvold, P.; Edfors, F.; Limiszewska, A.; Hikmet, F.; et al. An Atlas of the Protein-Coding Genes in the Human, Pig, and Mouse Brain. Science 2020, 367, eaay5947. [Google Scholar] [CrossRef] [PubMed]
  22. Avena, N.M.; Murray, S.; Gold, M.S. The next Generation of Obesity Treatments: Beyond Suppressing Appetite. Front. Psychol. 2013, 4, 721. [Google Scholar] [CrossRef] [PubMed] [Green Version]
  23. Luppino, F.S.; Wit, L.M.D.; Bouvy, P.F.; Stijnen, T.; Cuijpers, P.; Penninx, B.W.J.H.; Zitman, F.G. Overweight, Obesity, and Depression: A Systematic Review and Meta-Analysis of Longitudinal Studies. Arch. Gen. Psychiatry 2010, 67, 220–229. [Google Scholar] [CrossRef] [PubMed]
  24. Alhurani, R.E.; Vassilaki, M.; Aakre, J.A.; Mielke, M.M.; Kremers, W.K.; Machulda, M.M.; Geda, Y.E.; Knopman, D.S.; Peterson, R.C.; Roberts, R.O. Decline in Weight and Incident Mild Cognitive Impairment: Mayo Clinic Study of Aging. JAMA Neurol. 2016, 73, 439–446. [Google Scholar] [CrossRef] [PubMed]
  25. Voll, S.L.; Boot, E.; Butcher, N.J.; Cooper, S.; Heung, T.; Chow, E.W.C.; Silversides, C.K.; Bassett, A.S. Obesity in Adults with 22q11.2 Deletion Syndrome. Genet. Med. Off. J. Am. Coll. Med. Genet. 2017, 19, 204–208. [Google Scholar] [CrossRef] [Green Version]
  26. Butler, M.G. Prader-Willi Syndrome: Obesity Due to Genomic Imprinting. Curr. Genom. 2011, 12, 204–215. [Google Scholar] [CrossRef]
  27. Winner, B.; Uyanik, G.; Gross, C.; Lange, M.; Schulte-Mattler, W.; Schuierer, G.; Marienhagen, J.; Hehr, U.; Winkler, J. Clinical Progression and Genetic Analysis in Hereditary Spastic Paraplegia with Thin Corpus Callosum in Spastic Gait Gene 11 (SPG11). Arch. Neurol. 2004, 61, 117–121. [Google Scholar] [CrossRef] [Green Version]
  28. Lossos, A.; Stevanin, G.; Meiner, V.; Argov, Z.; Bouslam, N.; Newman, J.P.; Gomori, J.M.; Klebe, S.; Lerer, I.; Elleuch, N.; et al. Hereditary Spastic Paraplegia with Thin Corpus Callosum: Reduction of the SPG11 Interval and Evidence for Further Genetic Heterogeneity. Arch. Neurol. 2006, 63, 756–760. [Google Scholar] [CrossRef] [Green Version]
  29. Orlén, H.; Melberg, A.; Raininko, R.; Kumlien, E.; Entesarian, M.; Söderberg, P.; Påhlman, M.; Darin, N.; Kyllerman, M.; Holmberg, E.; et al. SPG11 Mutations Cause Kjellin Syndrome, a Hereditary Spastic Paraplegia with Thin Corpus Callosum and Central Retinal Degeneration. Am. J. Med. Genetics. Part B Neuropsychiatr. Genet. Off. Publ. Int. Soc. Psychiatr. Genet. 2009, 150B, 984–992. [Google Scholar] [CrossRef]
  30. Puech, B.; Lacour, A.; Stevanin, G.; Sautiere, B.G.; Devos, D.; Depienne, C.; Denis, E.; Mundwiller, E.; Ferriby, D.; Vermersch, P.; et al. Kjellin Syndrome: Long-Term Neuro-Ophthalmologic Follow-up and Novel Mutations in the SPG11 Gene. Ophthalmology 2011, 118, 564–573. [Google Scholar] [CrossRef]
  31. Vanderver, A.; Tonduti, D.; Auerbach, S.; Schmidt, J.L.; Parikh, S.; Gowans, G.C.; Jackson, K.E.; Brock, P.L.; Patterson, M.; Nehrebecky, M.; et al. Neurotransmitter Abnormalities and Response to Supplementation in SPG11. Mol. Genet. Metab. 2012, 107, 229–233. [Google Scholar] [CrossRef] [PubMed] [Green Version]
  32. Faber, I.; Martinez, A.R.M.; Rezende, T.J.R.D.; Martins, C.R.; Martins, M.P.; Lourenco, C.M.; Marques, W.; Montecchiani, C.; Orlacchio, A.; Pedroso, J.L.; et al. SPG11 Mutations Cause Widespread White Matter and Basal Ganglia Abnormalities, but Restricted Cortical Damage. NeuroImage Clin. 2018, 19, 848–857. [Google Scholar] [CrossRef] [PubMed]
  33. Maffei, M.; Fei, H.; Lee, G.H.; Dani, C.; Leroy, P.; Zhang, Y.; Proenca, R.; Negrel, R.; Ailhaud, G.; Friedman, J.M. Increased Expression in Adipocytes of Ob RNA in Mice with Lesions of the Hypothalamus and with Mutations at the Db Locus. Proc. Natl. Acad. Sci. USA 1995, 92, 6957–6960. [Google Scholar] [CrossRef] [PubMed] [Green Version]
  34. Clément, K.; Vaisse, C.; Lahlou, N.; Cabrol, S.; Pelloux, V.; Cassuto, D.; Gourmelen, M.; Dina, C.; Chambaz, J.; Lacorte, J.-M.; et al. A Mutation in the Human Leptin Receptor Gene Causes Obesity and Pituitary Dysfunction. Nature 1998, 392, 398–401. [Google Scholar] [CrossRef]
  35. Denora, P.S.; Smets, K.; Zolfanelli, F.; Groote, C.C.; Casali, C.; Deconinck, T.; Sieben, A.; Gonzales, M.; Zuchner, S.; Darios, F.; et al. Motor Neuron Degeneration in Spastic Paraplegia 11 Mimics Amyotrophic Lateral Sclerosis Lesions. Brain 2016, 139, 1723–1734. [Google Scholar] [CrossRef] [PubMed]
  36. Kuru, S.; Sakai, M.; Konagaya, M.; Yoshida, M.; Hashizume, Y. Autopsy Case of Hereditary Spastic Paraplegia with Thin Corpus Callosum Showing Severe Gliosis in the Cerebral White Matter. Neuropathology 2005, 25, 346–352. [Google Scholar] [CrossRef] [PubMed]
  37. Mori, S.; Honda, H.; Hamasaki, H.; Sasagasako, N.; Suzuki, S.O.; Furuya, H.; Taniwaki, T.; Iwaki, T. Transactivation Response DNA-binding Protein of 43 KDa Proteinopathy and Lysosomal Abnormalities in Spastic Paraplegia Type 11. Neuropathology 2021, 41, 253–265. [Google Scholar] [CrossRef] [PubMed]
  38. Hayakawa, M.; Matsubara, T.; Mochizuki, Y.; Takeuchi, C.; Minamitani, M.; Imai, M.; Kosaki, K.; Arai, T.; Murayama, S. An Autopsied Case Report of Spastic Paraplegia with Thin Corpus Callosum Carrying a Novel Mutation in the SPG11 Gene: Widespread Degeneration with Eosinophilic Inclusions. BMC Neurol. 2022, 22, 2. [Google Scholar] [CrossRef]
  39. Faber, I.; Martinez, A.R.M.; Martins, C.R.; Maia, M.L.; Souza, J.P.; Lourenço, C.M.; Marques, W.; Montecchiani, C.; Orlacchio, A.; Pedroso, J.L.; et al. SPG11-related Parkinsonism: Clinical Profile, Molecular Imaging and L-dopa Response. Mov. Disord. 2018, 33, 1650–1656. [Google Scholar] [CrossRef]
  40. Ueda, M.; Katayama, Y.; Kamiya, T.; Mishina, M.; Igarashi, H.; Okubo, S.; Senda, M.; Iwabuchi, K.; Terashi, A. Hereditary Spastic Paraplegia with a Thin Corpus Callosum and Thalamic Involvement in Japan. Neurology 1998, 51, 1751–1754. [Google Scholar] [CrossRef]
  41. Orlacchio, A.; Babalini, C.; Borreca, A.; Patrono, C.; Massa, R.; Basaran, S.; Munhoz, R.P.; Rogaeva, E.A.; George-Hyslop, P.H.S.; Bernardi, G.; et al. SPATACSIN Mutations Cause Autosomal Recessive Juvenile Amyotrophic Lateral Sclerosis. Brain 2010, 133, 591–598. [Google Scholar] [CrossRef] [PubMed] [Green Version]
  42. Nagel, G.; Peter, R.S.; Rosenbohm, A.; Koenig, W.; Dupuis, L.; Rothenbacher, D.; Ludolph, A.C. Adipokines, C-Reactive Protein and Amyotrophic Lateral Sclerosis—Results from a Population- Based ALS Registry in Germany. Sci. Rep. 2017, 7, 4374. [Google Scholar] [CrossRef] [PubMed] [Green Version]
  43. Gorges, M.; Vercruysse, P.; Müller, H.-P.; Huppertz, H.-J.; Rosenbohm, A.; Nagel, G.; Weydt, P.; Petersén, Å.; Ludolph, A.C.; Kassubek, J.; et al. Hypothalamic Atrophy Is Related to Body Mass Index and Age at Onset in Amyotrophic Lateral Sclerosis. J. Neurol. Neurosurg. Psychiatry 2017, 88, 1033. [Google Scholar] [CrossRef] [PubMed]
  44. Baskin, D.G.; Schwartz, M.W.; Seeley, R.J.; Woods, S.C.; Porte, D.; Breininger, J.F.; Jonak, Z.; Schaefer, J.; Krouse, M.; Burghardt, C.; et al. Leptin Receptor Long-Form Splice-Variant Protein Expression in Neuron Cell Bodies of the Brain and Co-Localization with Neuropeptide Y MRNA in the Arcuate Nucleus. J. Histochem. Cytochem. Off. J. Histochem. Soc. 1999, 47, 353–362. [Google Scholar] [CrossRef] [PubMed] [Green Version]
  45. Couce, M.E.; Burguera, B.; Parisi, J.E.; Jensen, M.D.; Lloyd, R.V. Localization of Leptin Receptor in the Human Brain. Neuroendocrinology 1997, 66, 145–150. [Google Scholar] [CrossRef] [PubMed]
  46. Valerio, A.; Ghisi, V.; Dossena, M.; Tonello, C.; Giordano, A.; Frontini, A.; Ferrario, M.; Pizzi, M.; Spano, P.; Carruba, M.O.; et al. Leptin Increases Axonal Growth Cone Size in Developing Mouse Cortical Neurons by Convergent Signals Inactivating Glycogen Synthase Kinase-3β*. J. Biol. Chem. 2006, 281, 12950–12958. [Google Scholar] [CrossRef] [Green Version]
  47. Mishra, H.K.; Prots, I.; Havlicek, S.; Kohl, Z.; Perez-Branguli, F.; Boerstler, T.; Anneser, L.; Minakaki, G.; Wend, H.; Hampl, M.; et al. GSK3ß-dependent Dysregulation of Neurodevelopment in SPG11-patient Induced Pluripotent Stem Cell Model. Ann. Neurol. 2016, 79, 826–840. [Google Scholar] [CrossRef] [Green Version]
  48. Pérez-Brangulí, F.; Buchsbaum, I.Y.; Pozner, T.; Regensburger, M.; Fan, W.; Schray, A.; Börstler, T.; Mishra, H.; Gräf, D.; Kohl, Z.; et al. Human SPG11 Cerebral Organoids Reveal Cortical Neurogenesis Impairment. Hum. Mol. Genet. 2019, 28, 961–971. [Google Scholar] [CrossRef] [Green Version]
  49. Pozner, T.; Schray, A.; Regensburger, M.; Lie, D.C.; Schlötzer-Schrehardt, U.; Winkler, J.; Turan, S.; Winner, B. Tideglusib Rescues Neurite Pathology of SPG11 IPSC Derived Cortical Neurons. Front. Neurosci. 2018, 12, 914. [Google Scholar] [CrossRef] [Green Version]
  50. Kleinridders, A.; Lauritzen, H.P.M.M.; Ussar, S.; Christensen, J.H.; Mori, M.A.; Bross, P.; Kahn, C.R. Leptin Regulation of Hsp60 Impacts Hypothalamic Insulin Signaling. J. Clin. Investig. 2013, 123, 4667–4680. [Google Scholar] [CrossRef]
  51. Murmu, R.P.; Martin, E.; Rastetter, A.; Esteves, T.; Muriel, M.-P.; Hachimi, K.H.E.; Denora, P.S.; Dauphin, A.; Fernandez, J.C.; Duyckaerts, C.; et al. Cellular Distribution and Subcellular Localization of Spatacsin and Spastizin, Two Proteins Involved in Hereditary Spastic Paraplegia. Mol. Cell. Neurosci. 2011, 47, 191–202. [Google Scholar] [CrossRef] [PubMed]
  52. Güner, F.; Pozner, T.; Krach, F.; Prots, I.; Loskarn, S.; Schlötzer-Schrehardt, U.; Winkler, J.; Winner, B.; Regensburger, M. Axon-Specific Mitochondrial Pathology in SPG11 Alpha Motor Neurons. Front. Neurosci. 2021, 15, 680572. [Google Scholar] [CrossRef] [PubMed]
  53. Denton, K.; Mou, Y.; Xu, C.-C.; Shah, D.; Chang, J.; Blackstone, C.; Li, X.-J. Impaired Mitochondrial Dynamics Underlie Axonal Defects in Hereditary Spastic Paraplegias. Hum. Mol. Genet. 2018, 27, 2517–2530. [Google Scholar] [CrossRef] [PubMed] [Green Version]
  54. Spadaro, O.; Youm, Y.; Shchukina, I.; Ryu, S.; Sidorov, S.; Ravussin, A.; Nguyen, K.; Aladyeva, E.; Predeus, A.N.; Smith, S.R.; et al. Caloric Restriction in Humans Reveals Immunometabolic Regulators of Health Span. Science 2022, 375, 671–677. [Google Scholar] [CrossRef] [PubMed]
  55. Regensburger, M.; Chaudhry, S.R.; Yasin, H.; Zhao, Y.; Stadlbauer, A.; Buchfelder, M.; Kinfe, T. Emerging Roles of Leptin in Parkinson’s Disease: Chronic Inflammation, Neuroprotection and More? Brain Behav. Immun. 2022, 107, 53–61. [Google Scholar] [CrossRef]
Figure 1. Body composition of SPG11 patients compared to matched healthy controls. (A) Representative lower limb lymphedema of late-stage SPG11 patients. Note the blue-livid discoloration and swelling of the calf and feet. (BE) Body fluid distribution derived from bioimpedance spectroscopy comprising (B) total body water, (C) extracellular water, (D) the ratio of extracellular and intracellular water, and (E) total hydration state. (F) Body mass index (BMI) was increased in 12 out of 16 SPG11 patients. (G) Lean tissue index was reduced in SPG11 (not at a significant level), whereas (H) fat tissue index showed a significant increase in SPG11. (I) Model of body composition and its changes in SPG11, indicated by red arrows. Bars indicate means ± SD. All groups were compared by Mann–Whitney U tests. ns: not significant, * p < 0.05, ** p < 0.01, *** p < 0.001.
Nutrients 14 04803 g001
Figure 2. Normalized body composition values in controls and SPG11. Bioimpedance spectroscopy values in controls and SPG11 shown as Z-scores calculated from previously reported sex- and age-adjusted reference values from 1000 healthy subjects. Reference cutoff values had been defined by the 10th and 90th percentiles and are indicated as dotted lines. When comparing normalized values of SPG11 vs. controls, there was a significant difference in (A) normalized extracellular/intracellular fluid ratio, (B) hydration, (C) lean tissue index, and (D) fat tissue index. * p < 0.05, *** p < 0.001, **** p < 0.0001, based on non-parametric Mann–Whitney U tests.
Nutrients 14 04803 g002
Figure 3. Altered levels of leptin, progranulin, and resistin in SPG11. (AE) Levels of adipocytokines in SPG11 patients compared to controls, including (A) leptin, (B) adiponectin, (C) progranulin, (D) resistin, and (E) CTRP-3. (FH) Basal levels of cortisol (F), adrenocorticotropic hormone (ACTH, G), and thyroid-stimulating hormone (TSH, (H)) were within normal range in most patients and there was no significant difference to controls. Red data points in H indicate subjects with known thyroid function disorder. (I) Basal triglyceride levels were within normal limits in most patients and controls. Dotted lines indicate reference ranges. Bars indicate means ± SD. ns: not significant, * p < 0.05.
Nutrients 14 04803 g003
Figure 4. Human brain expression of SPG11. Normalized transcripts per million (nTPM) derived from the Human Protein Atlas: http://v21.proteinatlas.org access on 3 June 2022 [21].
Nutrients 14 04803 g004
Figure 5. Reduced hypothalamic volume in SPG11. Representative images of hypothalamic volumetry with the MRIcloud software package in a control (A) and SPG11 patient (B). Arrowheads indicate the ventral border of the corpus callosum showing significant atrophy in SPG11. Outlines of the hypothalamus are in white lines, and 3D segmentation extracted from MRIcloud are shown in (C). (D) Quantification of hypothalamic volume in SPG11 and matched controls (n = 12). Bars indicate means ± SD. *** p < 0.001. (E) T2-weighted axial image of abdominal adipose tissue obtained in a single SPG11 patient.
Nutrients 14 04803 g005
Figure 6. Leptin levels correlate with adipose tissue mass and disease severity in SPG11. (AC) Correlation of leptin levels in SPG11 patients with (A) body mass index (BMI; no significant correlation), (B) fat tissue index (p < 0.0001), and (C) total score on the Spastic Paraplegia Rating Scale (SPRS; p < 0.05). rs: Spearman’s rho.
Nutrients 14 04803 g006
Table 1. Patient characteristics.
Parameter
(Mean ± SD)
SPG11 HSP
N = 16
Controls
N = 16
p Value
Age (y) 31.1 ± 10.936.1 ± 11.6 >0.05
Gender (male: female) 8:87:9>0.05 *
Body Mass Index (kg/m2)29.1 ± 4.625.0 ± 3.70.02
Age of onset (y)12.7 ± 11.0---
Disease duration (y) 18.4 ± 8.0---
SPRS total score 30.2 ± 10.4 ---
SPRS functional measures18.4 ± 6.0---
    (sum of items #1–#6)
SPRS spasticity measures (#7–#10)8.0 ± 3.3---
SPRS non-motor measures (#11–#13)3.8 ± 2.3---
* Chi-squared test, SPRS: Spastic Paraplegia Rating Scale.
Table 2. Demographic and disease-related characteristics of the SPG11 patient cohort.
Disease StagePatientSexAAOAAESPRSTCCIDZUNGDysarthriaTrunk Ambul.SPG11 Genotype
earlySPG11-7f17271773.75c.5623C>T
(homozyg.)
SPG11-9f141824++40+c.704_705del;
c.6832_6833del
SPG11-10m121620++45++c.1203_1203delA
(homozyg.)
SPG11-12m42451848.75+c.255G>A;
c.531T>C
SPG11-14m32718++50+c.1951C>T
(homozyg.)
SPG11-16f142114++n/a+c.2612dupG;
c.4434G>T
middleSPG11-4f152321++45++c.3075dupA;
c.6204A>G
SPG11-5f152317++52.5++c.3075dupA;
c.6204A>G
SPG11-6m142221++43.75++c.733_734del;
c.4306_4307del
SPG11-8m123540++66.25++c.5623C>T
(homozyg.)
SPG11-13m92033++n/a+++c.2990T>A;
c.4877_4878delTT
SPG11-15m32531++n/a+++c.190dupC;
c.704_705delAT
lateSPG11-1f244644+++n/a++c.3036C>A;
c.5798delC
SPG11-2f204037++n/a++c.3036C>A;
c.5798delC
SPG11-3f315036++35++c.267G>A;
c.1457-2A>G
SPG11-11m144746++n/a++c.3076insA;
del. exon 37-39
Characteristics and disease stages of the SPG11 cohort. SPG11-1 and -2 are sisters, SPG11-4 and -5 are isogenic twins, SPG11-7 and -8 are unrelated. Abbreviations: AAO = age at onset, AAE = age at examination, SPRS = Spastic Paraplegia Rating Scale (ranging from 0 to 52, with higher values indicating a more severe disease stage), TCC = thin corpus callosum, ID = intellectual disability, ZUNG = Zung Self-Rating Depression Scale (ranging from 25 to 100, values above 50 considered as depression), trunk = axial instability, ambul. = ambulatory and independent of wheelchair.
Publisher’s Note: MDPI stays neutral with regard to jurisdictional claims in published maps and institutional affiliations.

