
Impact of the Nutrition–Inflammation Status on the Functionality of Patients with Chronic Kidney Disease


Abstract
1. Introduction
2. Materials and Methods
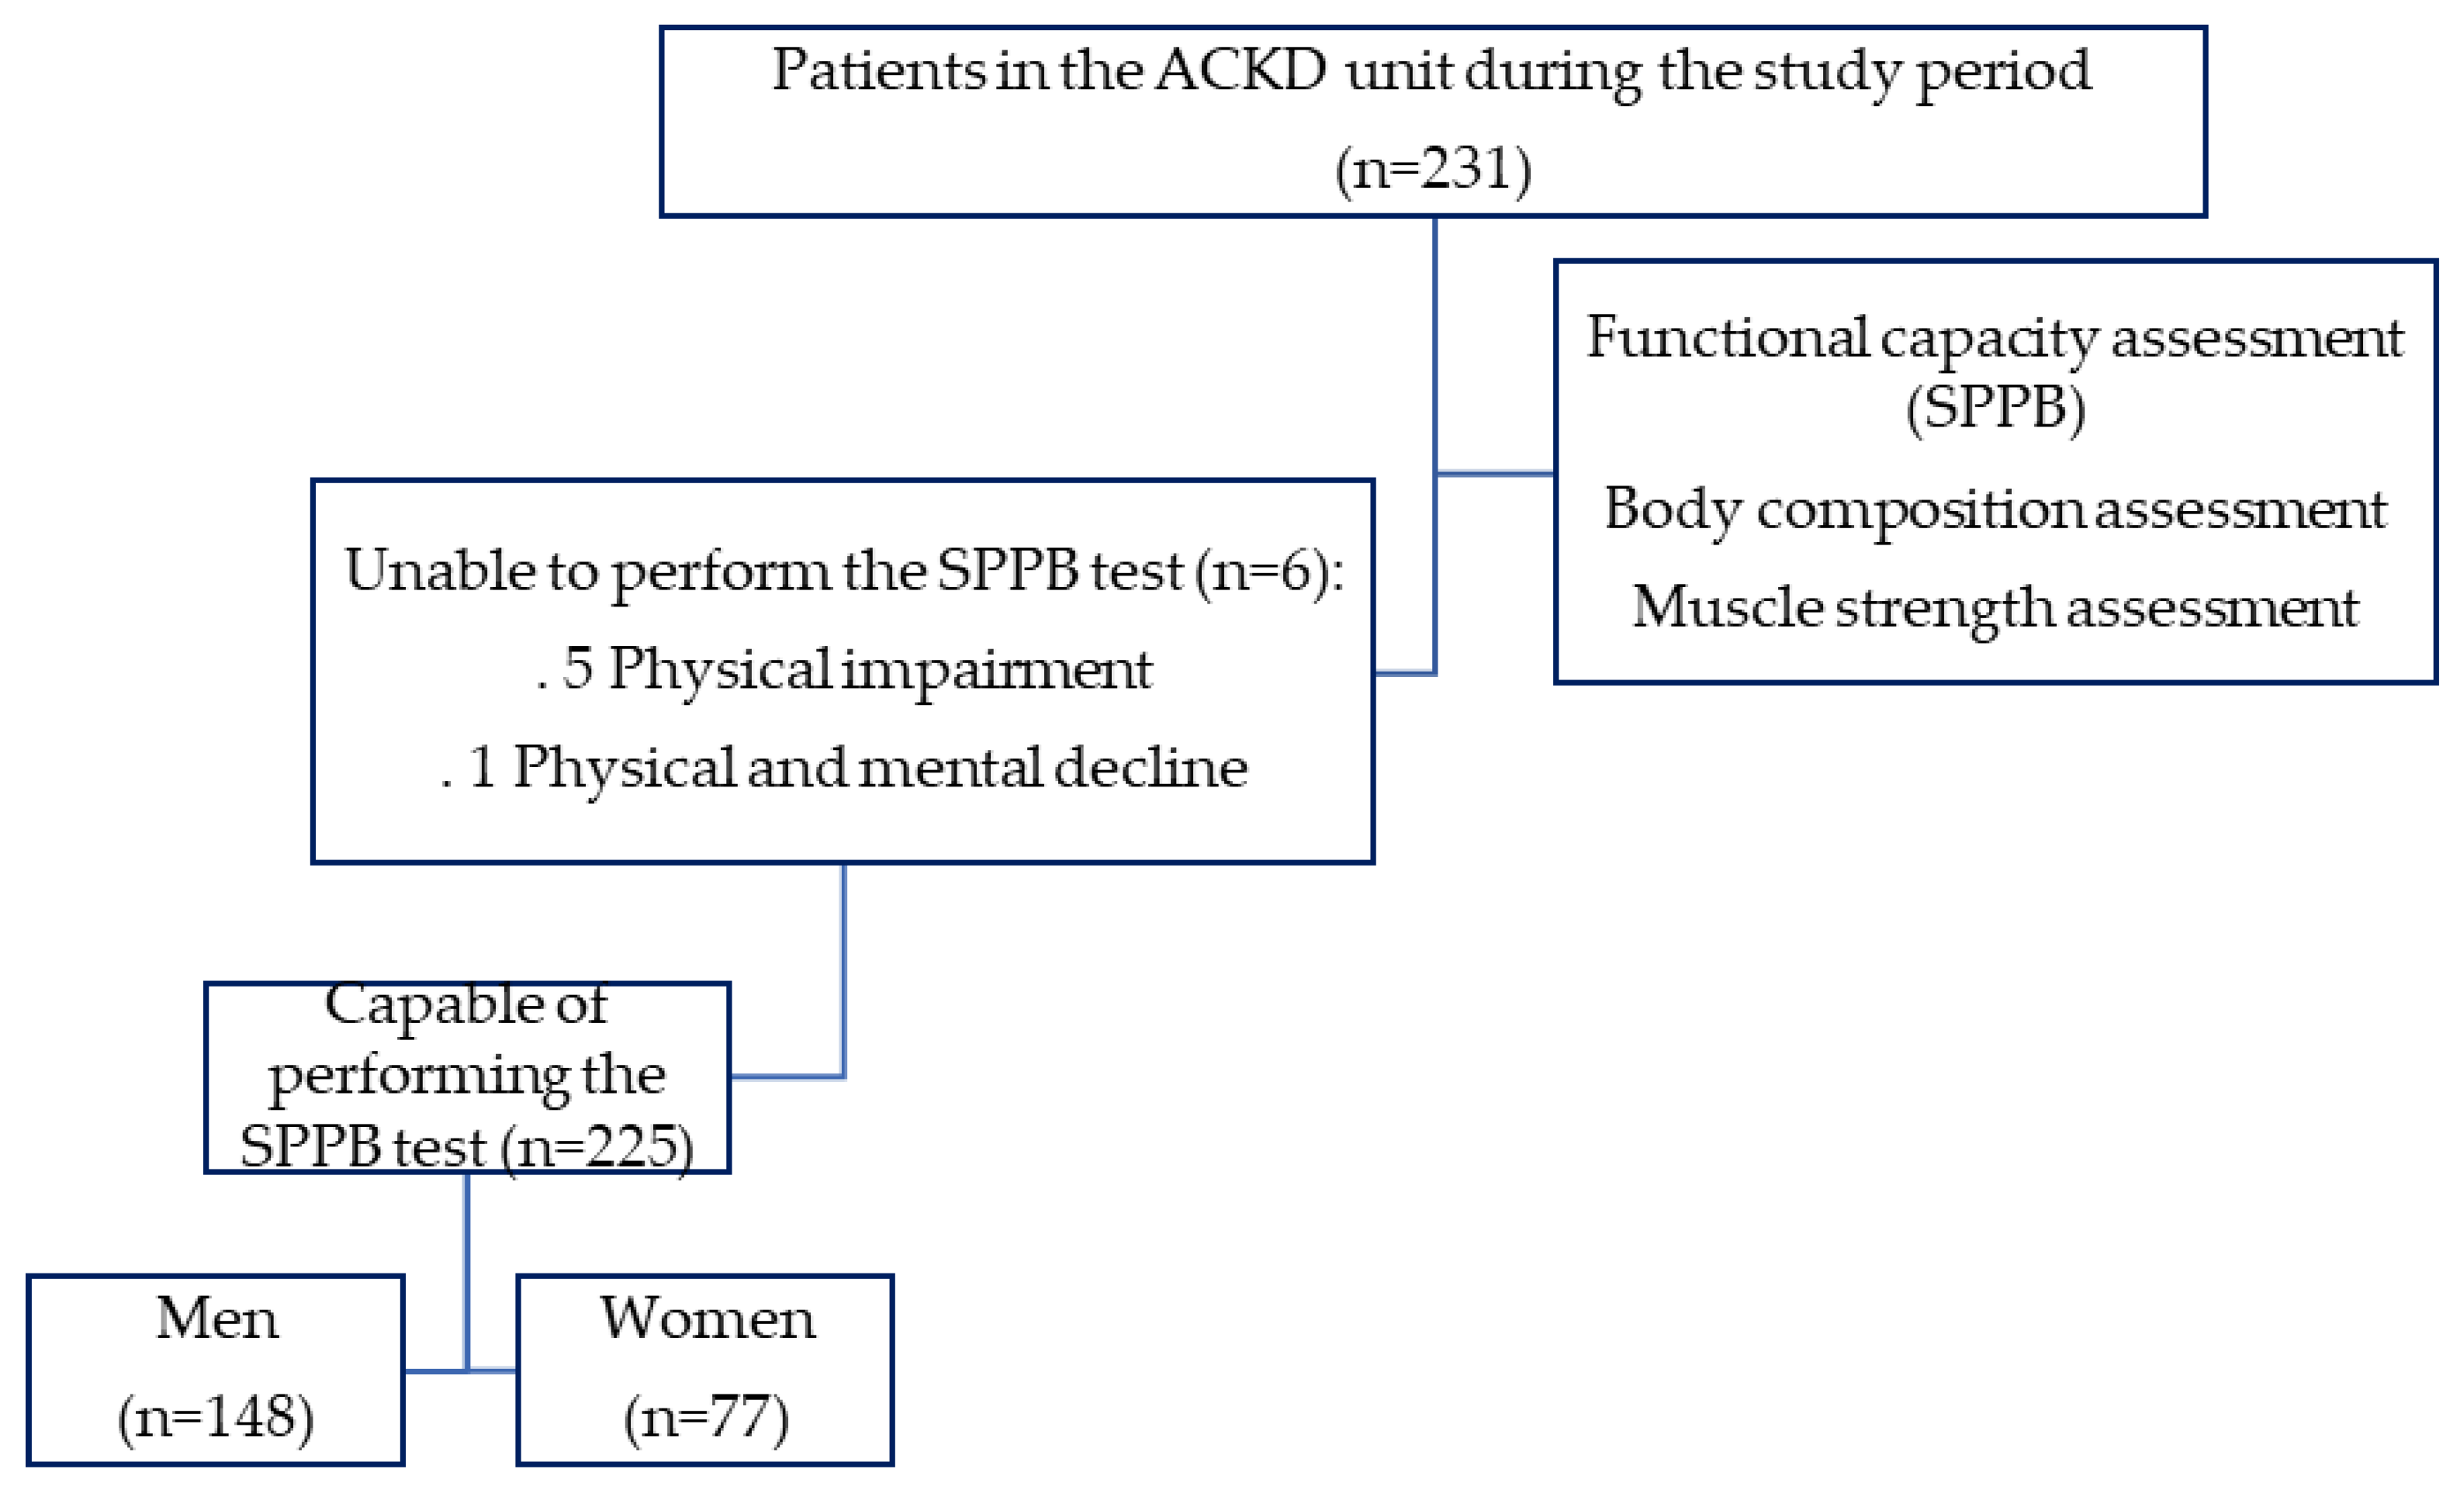
2.1. Study Design and Participants
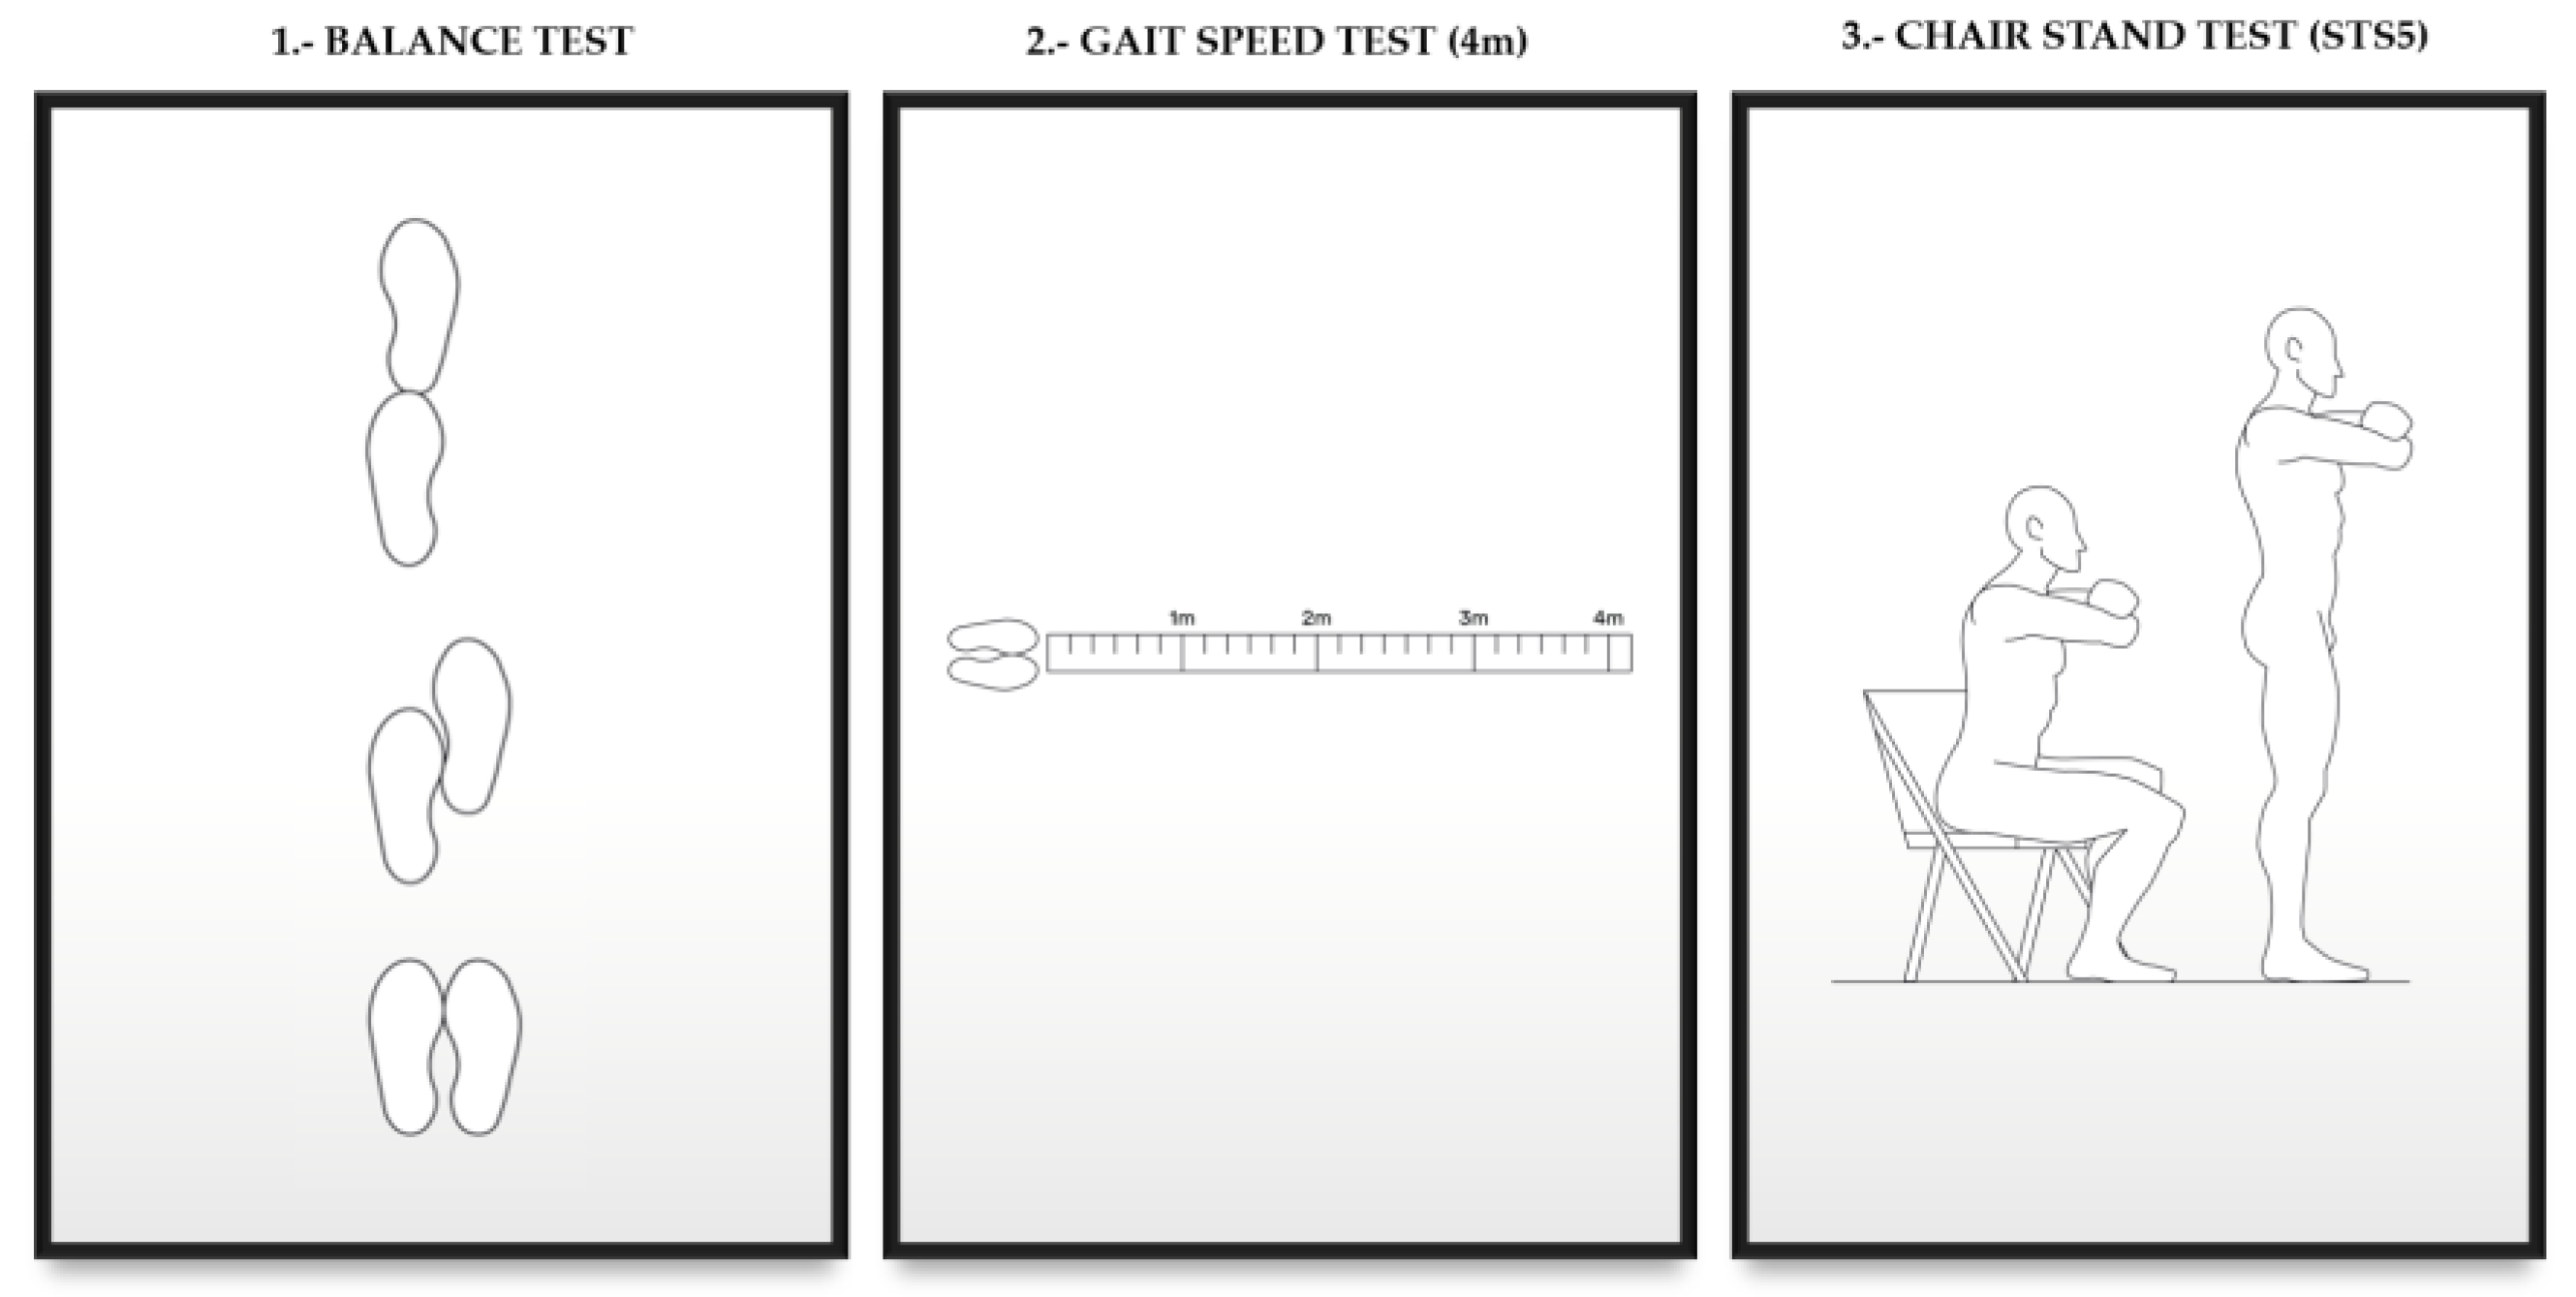
2.2. Evaluation of Functional Capacity and Muscle Strength
- 0–3 points, severe limitations
- 3–6 points, moderate limitations
- 7–9 points, slight limitations
- 10–12 points, minimum/no limitations [17]
2.3. Frailty
2.4. Hand Grip Strength (HGS)/Dynamometry
2.5. Assessment of Nutritional Status
- Age, sex, and CKD-EPI as modifying factors of nutritional parameters.
- Nutritional study with classic laboratory nutritional parameters: albumin, prealbumin, CRP, lymphocytes, transferrin. Laboratory results were retrospectively collected from medical records. S-albumin was measured by the colorimetric standard method (Roche/Hitachi 904®/Modular ACN413) using the bromocresol green method s-Prealbumin and s-CRP were measured by immunoturbidimetry methods (Roche/Hitachi 904®/Model P: ACN 218, Roche Diagnostics, Basel, Switzerland) [21].
- Malnutrition Inflammation Score (MIS), is a scale that includes components of the subjective global assessment scale, combining them with body mass index, serum albumin, and transferrin. Each of the 10 components of the scale is graded according to severity (from normal to very severe), and the sum of the score of the 10 components classifies the patients according to their degree of malnutrition [22].
2.6. Body Composition Assessment
2.7. Statistical Analysis
3. Results
3.1. Characteristics of the Study Population
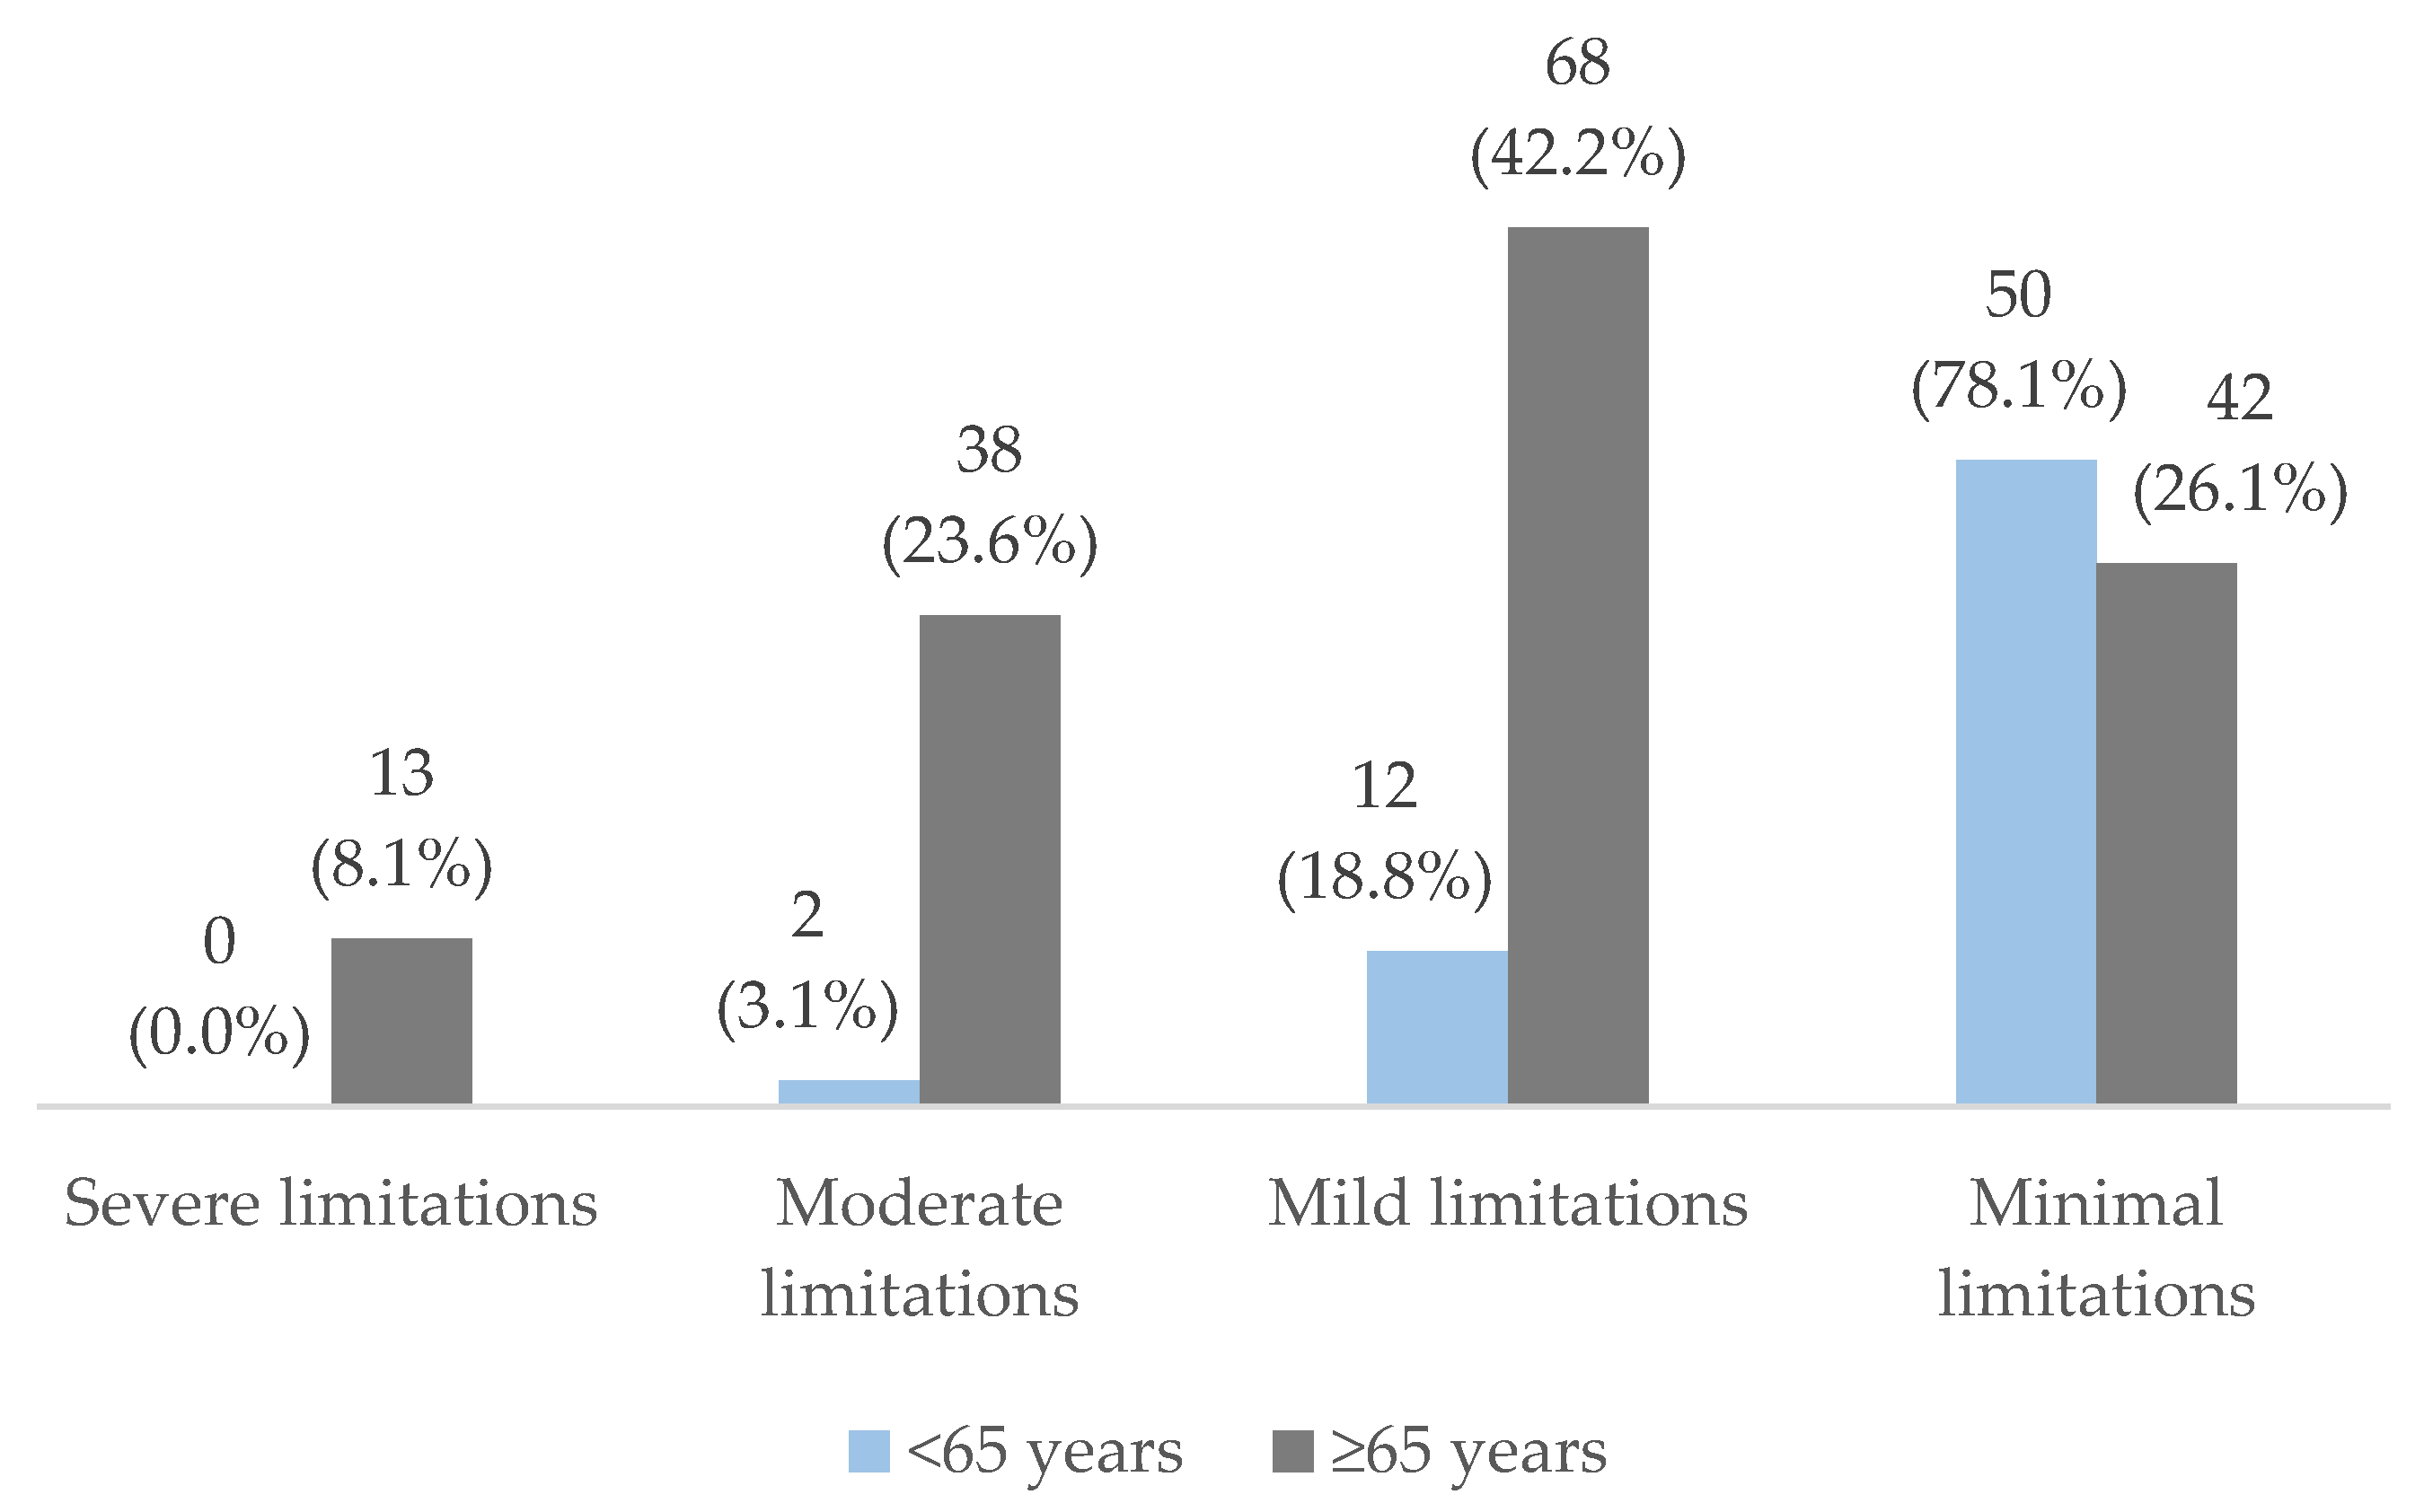
3.2. Results of the Functionality Study
3.3. Association of Parameters of Nutritional Status and Body Composition with Patient Functionality
4. Discussion
5. Conclusions
Author Contributions
Funding
Institutional Review Board Statement
Informed Consent Statement
Data Availability Statement
Acknowledgments
Conflicts of Interest
References
- Aucella, F.; Corsonello, A.; Leosco, D.; Brunori, G.; Gesualdo, L.; Antonelli-Incalzi, R. Beyond chronic kidney disease: The diagnosis of Renal Disease in the Elderly as an unmet need. A position paper endorsed by Italian Society of Nephrology (SIN) and Italian Society of Geriatrics and Gerontology (SIGG). J. Nephrol. 2019, 32, 165–176. [Google Scholar] [CrossRef] [PubMed]
- Nitta, K.; Okada, K.; Yanai, M.; Takahashi, S. Aging and chronic kidney disease. Kidney Blood Press Res. 2013, 38, 109–120. [Google Scholar] [CrossRef] [PubMed]
- Corsonello, A.; Fabbietti, P.; Formiga, F.; Moreno-Gonzalez, R.; Tap, L.; Mattace-Raso, F.; Roller-Wirnsberger, R.; Wirnsberger, G.; Ärnlöv, J.; Carlsson, A.C.; et al. Chronic kidney disease in the context of multimorbidity patterns: The role of physical performance: The screening for CKD among older people across Europe (SCOPE) study. BMC Geriatr. 2020, 20 (Suppl. S1), 350. [Google Scholar] [CrossRef]
- Marzuca-Nassr, G.N.; Soto-Rodríguez, F.J.; Bascour-Sandoval, C.; Cofré-Obando, V.; Hermosilla, C.; Sepúlveda, P.; Muñoz-Poblete, C. Influence of age on functional capacity and work ability in Chilean workers: A cross-sectional study. Int. Arch. Occup. Env. Health 2021, 94, 1307–1315. [Google Scholar] [CrossRef] [PubMed]
- Painter, P.; Roshanravan, B. The association of physical activity and physical function with clinical outcomes in adults with chronic kidney disease. Curr. Opin. Nephrol. Hypertens. 2013, 22, 615–623. [Google Scholar] [CrossRef]
- Stenvinkel, P.; Carrero, J.J.; von Walden, F.; Ikizler, T.A.; Nader, G.A. Muscle wasting in end-stage renal disease promulgates premature death: Established, emerging and potential novel treatment strategies. Nephrol. Dial. Transplant. 2016, 31, 1070–1077. [Google Scholar] [CrossRef] [PubMed]
- Prado, C.M.; Purcell, S.; Alish, C.; Pereira, S.L.; Deutz, N.E.; Heyland, D.K.; Goodpaster, B.H.; Tappenden, K.; Heymsfield, S.B. Implications of low muscle mass across the continuum of care: A narrative review. Ann. Med. 2018, 50, 675–693. [Google Scholar] [CrossRef]
- Kimura, A.; Paredes, W.; Pai, R.; Farooq, H.; Buttar, R.S.; Custodio, M.; Munugoti, S.; Kotwani, S.; Randhawa, L.S.; Dalezman, S.; et al. Step length and fall risk in adults with chronic kidney disease: A pilot study. BMC Nephrol. 2022, 23, 74. [Google Scholar] [CrossRef]
- Nowak, K.L.; Hung, A.; Ikizler, T.; Farmer-Bailey, H.; Salas-Cruz, N.; Sarkar, S.; Hoofnagle, A.; You, Z.; Chonchol, M. Interleukin-1 inhibition, chronic kidney disease-mineral and bone disorder, and physical function. Clin. Nephrol. 2017, 88, 132–143. [Google Scholar] [CrossRef]
- O’Sullivan, E.D.; Hughes, J.; Ferenbach, D.A. Renal Aging: Causes and Consequences. J. Am. Soc. Nephrol. 2017, 28, 407–420. [Google Scholar] [CrossRef]
- Kim, G.; Kim, J.H. Impact of Skeletal Muscle Mass on Metabolic Health. Endocrinol Metab. 2020, 35, 1–6. [Google Scholar] [CrossRef] [PubMed]
- Iorember, F.M. Malnutrition in Chronic Kidney Disease. Front. Pediatr. 2018, 6, 161. [Google Scholar] [CrossRef] [PubMed]
- Oner-Iyidogan, Y.; Gurdol, F.; Kocak, H.; Oner, P.; Cetinalp-Demircan, P.; Caliskan, Y.; Kocak, T.; Turkmen, A. Appetite-regulating hormones in chronic kidney disease patients. J. Ren. Nutr. 2011, 21, 316–321. [Google Scholar] [CrossRef]
- Sabatino, A.; D’Alessandro, C.; Regolisti, G.; di Mario, F.; Guglielmi, G.; Bazzocchi, A.; Fiaccadori, E. Muscle mass assessment in renal disease: The role of imaging techniques. Quant. Imaging Med. Surg. 2020, 10, 1672–1686. [Google Scholar] [CrossRef] [PubMed]
- Lodebo, B.T.; Shah, A.; Kopple, J.D. Is it Important to Prevent and Treat Protein-Energy Wasting in Chronic Kidney Disease and Chronic Dialysis Patients? J. Ren. Nutr. 2018, 28, 369–379. [Google Scholar] [CrossRef]
- Kovesdy, C.P.; Kopple, J.D.; Kalantar-Zadeh, K. Management of protein-energy wasting in non-dialysis-dependent chronic kidney disease: Reconciling low protein intake with nutritional therapy. Am. J. Clin. Nutr. 2013, 97, 1163–1177. [Google Scholar] [CrossRef]
- Guralnik, J.M.; Simonsick, E.M.; Ferrucci, L.; Glynn, R.J.; Berkman, L.F.; Blazer, D.G.; Scherr, P.A.; Wallace, R.B. A short physical performance battery assessing lower extremity function: Association with self-reported disability and prediction of mortality and nursing home admission. J. Gerontol. 1994, 49, M85–M94. [Google Scholar] [CrossRef]
- Fried, L.P.; Tangen, C.M.; Walston, J.; Newman, A.B.; Hirsch, C.; Gottdiener, J.; Seeman, T.; Tracy, R.; Kop, W.J.; Burke, G.; et al. Frailty in older adults: Evidence for a phenotype. J. Gerontol. A Biol. Sci. Med. Sci. 2001, 56, M146–M156. [Google Scholar] [CrossRef]
- Oliveira, M.C.; Bufarah, M.N.B.; Balbi, A.L. Handgrip strength in end stage of renal disease: A narrative review. Nutrire 2018, 43, 14. [Google Scholar] [CrossRef]
- Lee, S.Y.; Jin, H.; Arai, H.; Lim, J.Y. Handgrip strength: Should repeated measurements be performed in both hands? Geriatr. Gerontol. Int. 2021, 21, 426–432. [Google Scholar] [CrossRef]
- McGinlay, J.M.; Payne, R.B. Serum albumin by dye-binding: Bromocresol green or bromocresol purple? The case for conservatism. Ann. Clin. Biochem. 1988, 25, 417–421. [Google Scholar] [CrossRef] [PubMed]
- Kalantar-Zadeh, K.; Kopple, J.D.; Block, G.; Humphreys, M.H. A malnutrition-inflammation score is correlated with morbidity and mortality in maintenance hemodialysis patients. Am. J. Kidney Dis. 2001, 38, 1251–1263. [Google Scholar] [CrossRef] [PubMed]
- Quesada, L.; Lidyce, C.C.; Betancourt, J.; Pestana, E. Elementos teóricos y prácticos sobre la bioimpedancia eléctrica en salud. Rev. Arch. Médico Camagüey 2016, 20, 565–578. [Google Scholar]
- Cigarrán Guldrís, S. Future uses of vectorial bioimpedance (BIVA) in nephrology. Nefrología 2011, 31, 635–643. [Google Scholar] [CrossRef]
- López-Gómez, J.M. Evolution and applications of bioimpedance in managing chronic kidney disease. Nefrología 2011, 31, 630–634. [Google Scholar] [CrossRef]
- Guligowska, A.; Corsonello, A.; Pigłowska, M.; Roller-Wirnsberger, R.; Wirnsberger, G.; Ärnlöv, J.; Carlsson, A.C.; Tap, L.; Mattace-Raso, F.; Formiga, F.; et al. Association between kidney function, nutritional status and anthropometric measures in older people. BMC Geriatr. 2020, 20, 366. [Google Scholar] [CrossRef]
- Cupisti, A.; D’Alessandro, C.; Finato, V.; Del Corso, C.; Catania, B.; Caselli, G.M.; Egidi, M.F. Assessment of physical activity, capacity and nutritional status in elderly peritoneal dialysis patients. BMC Nephrol. 2017, 18, 180. [Google Scholar] [CrossRef]
- Painter, P.; Marcus, R.L. Assessing physical function and physical activity in patients with CKD. Clin. J. Am. Soc. Nephrol. 2013, 8, 861–872. [Google Scholar] [CrossRef]
- Basu, A. Role of Physical Performance Assessments and Need for a Standardized Protocol for Selection of Older Kidney Transplant Candidates. Kidney Int. Rep. 2019, 4, 1666–1676. [Google Scholar] [CrossRef]
- Gravina, E.P.L.; Pinheiro, B.V.; Jesus, L.A.D.S.; Barros, F.S.; Lucinda, L.M.F.; Colugnati, F.A.B.; Segura-Ortí, E.; Reboredo, M.M. Factors Associated with Functional Capacity in CKD Patients. Clin. Nurs. Res. 2021, 30, 351–359. [Google Scholar] [CrossRef]
- Chin, H.J.; Ahn, S.Y.; Ryu, J.; Kim, S.; Na, K.Y.; Kim, K.W.; Chae, D.-W.; Kim, C.-H. Renal function and decline in functional capacity in older adults. Age Ageing 2014, 43, 833–838. [Google Scholar] [CrossRef] [PubMed]
- Segura-Ortí, E.; Gordon, P.L.; Doyle, J.W.; Johansen, K.L. Correlates of Physical Functioning and Performance Across the Spectrum of Kidney Function. Clin. Nurs. Res. 2018, 27, 579–596. [Google Scholar] [CrossRef] [PubMed]
- Walther, C.P.; Gutiérrez, O.M.; Cushman, M.; E Judd, S.; Lang, J.; McClellan, W.; Muntner, P.; Sarnak, M.J.; Shlipak, M.G.; Warnock, D.G.; et al. Serum albumin concentration and risk of end-stage renal disease: The REGARDS study. Nephrol. Dial. Transplant. 2018, 33, 1770–1777. [Google Scholar] [CrossRef] [PubMed]
- Mello, R.; Johansen, K.L.; Murray, A.; Davey, C.; Hart, A. Estimated GFR, Albuminuria, and Physical Function: The Brain in Kidney Disease (BRINK) Cohort Study. Kidney Med. 2022, 4, 100531. [Google Scholar] [CrossRef] [PubMed]
- Eloueyk, A.K.; Alameddine, R.Y.; Osta, B.A.; Awad, D.M. Correlations between serum inflammatory markers and comorbidities in patients with end-stage renal disease. J. Taibah Univ. Med. Sci. 2019, 14, 547–552. [Google Scholar] [CrossRef]
- Alves, F.C.; Sun, J.; Qureshi, A.R.; Dai, L.; Snaedal, S.; Bárány, P.; Heimbürger, O.; Lindholm, B.; Stenvinkel, P. The higher mortality associated with low serum albumin is dependent on systemic inflammation in end-stage kidney disease. PLoS ONE 2018, 13, e0190410. [Google Scholar] [CrossRef]
- Lang, J.; Katz, R.; Ix, J.H.; Gutierrez, O.M.; Peralta, C.A.; Parikh, C.R.; Satterfield, S.; Petrovic, S.; Devarajan, P.; Bennett, M.; et al. Association of serum albumin levels with kidney function decline and incident chronic kidney disease in elders. Nephrol. Dial. Transplant. 2018, 33, 986–992. [Google Scholar] [CrossRef]
- Adejumo, O.A.; Okaka, E.I.; Okwuonu, C.G.; Iyawe, I.O.; Odujoko, O.O. Serum C-reactive protein levels in pre-dialysis chronic kidney disease patientsin southern Nigeria. Ghana Med. J. 2016, 50, 31–38. [Google Scholar] [CrossRef][Green Version]
- Slee, A.D.; Reid, J. Wasting in Chronic Kidney Disease—A Complex Issue. JCSM Clin. Rep. 2018, 3, 1–10. [Google Scholar] [CrossRef]
- Calvo-Lobo, C.; Neyra-Bohorquez, P.P.; Seco-Calvo, J. Aerobic exercise effects in renal function and quality of life of patients with advanced chronic kidney disease. Rev. Assoc. Med. Bras. 2019, 65, 657–662. [Google Scholar] [CrossRef]
- Nixon, A.C.; Bampouras, T.M.; Pendleton, N.; Woywodt, A.; Mitra, S.; Dhaygude, A. Frailty and chronic kidney disease: Current evidence and continuing uncertainties. Clin. Kidney J. 2018, 11, 236–245. [Google Scholar] [CrossRef] [PubMed]
- Drost, D.; Kalf, A.; Vogtlander, N.; van Munster, B.C. High prevalence of frailty in end-stage renal disease. Int. Urol. Nephrol. 2016, 48, 1357–1362. [Google Scholar] [CrossRef] [PubMed]
- Perracini, M.R.; Mello, M.; de Oliveira Máximo, R.; Bilton, T.L.; Ferriolli, E.; Lustosa, L.P.; Alexandre, T. Diagnostic Accuracy of the Short Physical Performance Battery for Detecting Frailty in Older People. Phys. Ther. 2020, 100, 90–98. [Google Scholar] [CrossRef]
- Ramírez-Vélez, R.; López Sáez de Asteasu, M.; Morley, J.E.; Cano-Gutierrez, C.A.; Izquierdo, M. Performance of the Short Physical Performance Battery in Identifying the Frailty Phenotype and Predicting Geriatric Syndromes in Community-Dwelling Elderly. J. Nutr. Health Aging 2021, 25, 209–217. [Google Scholar] [CrossRef] [PubMed]
- Valentini, A.; Federici, M.; Cianfarani, M.A.; Tarantino, U.; Bertoli, A. Frailty and nutritional status in older people: The Mini Nutritional Assessment as a screening tool for the identification of frail subjects. Clin. Interv. Aging 2018, 13, 1237–1244. [Google Scholar] [CrossRef]
- Chang, C.-Y.; Lin, M.-H.; Kuo, C.-C.; Lu, C.-H.; Wu, D.-M.; Tsai, M.-K.; Chu, N.-F. Nutritional Status and Renal Function in Relation to Frailty among the Community-Dwelling Elderly Taiwanese Population. J. Nutr. Health Aging 2022, 26, 6–12. [Google Scholar] [CrossRef] [PubMed]
- Smith, G.; Avenell, A.; Band, M.M.; Hampson, G.; Lamb, E.J.; Littleford, R.C.; McNamee, P.; Soiza, R.L.; Sumukadas, D.; Witham, M.D. Associations between frailty, physical performance, and renal biomarkers in older people with advanced chronic kidney disease. Eur. Geriatr. Med. 2021, 12, 943–952. [Google Scholar] [CrossRef] [PubMed]
- Ikizler, T.A.; Burrowes, J.D.; Byham-Gray, L.D.; Campbell, K.L.; Carrero, J.-J.; Chan, W.; Fouque, D.; Friedman, A.N.; Ghaddar, S.; Goldstein-Fuchs, D.J.; et al. KDOQI Clinical Practice Guideline for Nutrition in CKD: 2020 Update. Am. J. Kidney Dis. 2020, 76 (Suppl. S1), S1–S107. [Google Scholar] [CrossRef]
- García-Montero, C.; Fraile-Martínez, O.; Gómez-Lahoz, A.M.; Pekarek, L.; Castellanos, A.J.; Noguerales-Fraguas, F.; Coca, S.; Guijarro, L.G.; García-Honduvilla, N.; Asúnsolo, A.; et al. Nutritional Components in Western Diet Versus Mediterranean Diet at the Gut Microbiota–Immune System Interplay. Implications for Health and Disease. Nutrients 2021, 13, 699. [Google Scholar] [CrossRef]
- Djuricic, I.; Calder, P.C. Beneficial Outcomes of Omega-6 and Omega-3 Polyunsaturated Fatty Acids on Human Health: An Update for 2021. Nutrients 2021, 13, 2421. [Google Scholar] [CrossRef]
- Campa, F.; Toselli, S.; Mazzilli, M.; Gobbo, L.A.; Coratella, G. Assessment of Body Composition in Athletes: A Narrative Review of Available Methods with Special Reference to Quantitative and Qualitative Bioimpedance Analysis. Nutrients 2021, 13, 1620. [Google Scholar] [CrossRef] [PubMed]
- Patiño-Villada, F.A.; González-Bernal, J.J.; González-Santos, J.; de Paz, J.A.; Jahouh, M.; Mielgo-Ayuso, J.; Romero-Pérez, E.M.; Soto-Cámara, R. Relationship of Body Composition with the Strength and Functional Capacity of People over 70 Years. Int. J. Environ. Res. Public Health 2020, 17, 7767. [Google Scholar] [CrossRef] [PubMed]
- Hsu, H.-J.; Yen, C.-H.; Wu, I.-W.; Liu, M.-H.; Cheng, H.-Y.; Lin, Y.-T.; Lee, C.-C.; Hsu, K.-H.; Sun, C.-Y.; Chen, C.-Y.; et al. The association between low protein diet and body composition, muscle function, inflammation, and amino acid-based metabolic profile in chronic kidney disease stage 3–5 patients. Clin. Nutr. ESPEN 2021, 46, 405–415. [Google Scholar] [CrossRef] [PubMed]
- Cheng, T.C.; Huang, S.H.; Kao, C.L.; Hsu, P.C. Muscle Wasting in Chronic Kidney Disease: Mechanism and Clinical Implications-A Narrative Review. Int. J. Mol. Sci. 2022, 23, 6047. [Google Scholar] [CrossRef]


| Overall | Men | Women | p-Value | |
|---|---|---|---|---|
| Age years (mean ± SD/Median) | 70.65 ± 11.97/73 | 69.85 ± 11.16/72 | 72.19 ± 13.33/76 | ns |
| Sex n (%) | 225 | 148 (65.8) | 77 (34.2) | 0.001 |
| Age Range n (%) | 0.012 | |||
| <55 | 27 (12) | 16 (10.8) | 11 (14.3) | |
| 55–64 | 36 (16) | 27 (18.2) | 9 (11.7) | |
| 65–74 | 61 (27) | 46 (31.1) | 15 (19.5) | |
| 75–84 | 81 (36) | 52 (35.1) | 29 (37.7) | |
| ≥85 | 20 (9) | 7 (4.7) | 13 (16.9) | |
| ACKD stage n (%) | ns | |||
| Stage 3B | 19 (8.4) | 9 (6.1) | 10 (13) | |
| Stage 4 | 123 (54.7) | 87 (58.8) | 36 (46.8) | |
| Stage 5 (ND) | 83 (36.9) | 52 (35.1) | 31 (40.3) | |
| Comorbidity (mean ± SD/Median) | 6.46 ± 1.92/6 | 6.56 ± 1.88/7 | 6.27 ± 1.99/6 | ns |
| Frailty n (%) | 40 (17.8) | 20 (13.5) | 20 (26%) | 0.020 |
| Time in ACKD unit n (%) | ns | |||
| <6 month | 147 (65.3) | 97 (65.5) | 50 (64.9) | |
| 6–12 month | 29 (12.9) | 21 (14.2) | 8 (10.4) | |
| >12 months | 49 (21.8) | 30 (20.3) | 19 (24.7) | |
| DM n (%) | 0.016 | |||
| Yes | 98 (43.6) | 73 (49.3) | 25 (32.5) | |
| No | 127 (56.4) | 75 (50.7) | 52 (67.5) |
| Global n = 225 | Men 148 | Women 77 | p-Value | |
|---|---|---|---|---|
| SPPB (mean ± SD/median) | 8.50 ± 2.81/9 | 8.88 ± 2.49/9 | 7.77 ± 3.23/8 | 0.005 |
| SPPB < 7 (low physical performance) n (%) | 53 (23.6) | 25 (16.9) | 28 (36.4) | 0.001 |
| SPPB ≥ 7 (high physical performance) n (%) | 172 (76.4) | 123 (83.1) | 49 (63.6) | |
| Severe limitations n (%) | 13 (5.8) | 4 (2.7) | 9 (11.7) | 0.006 |
| Moderate limitations n (%) | 40 (17.8) | 21 (14.2) | 19 (24.7) | |
| Mild limitations n (%) | 80 (35.6) | 57 (38.5) | 23 (29.9) | |
| Minimal limitations n (%) | 92 (40.9) | 66 (44.6) | 26 (33.8) | |
| Age Range (mean ± SD/median) | <0.001 | |||
| <55 | 10.96 ± 1.31/11 | 10.87 ± 1.14/11 | 11.09 ± 1.57/12 | |
| 55–64 | 10.61 ± 1.79/11 | 10.88 ± 1.45/11 | 9.77 ± 2.48/11 | |
| 65–74 | 8.60 ± 2.34/9 | 8.47 ± 2.22/9 | 9.00 ± 2.72/9 | |
| 75–84 | 7.34 ± 2.62/7 | 7.88 ± 2.37/8 | 6.37 ± 2.82/6 | |
| ≥85 | 5.80 ± 2.83/5 | 6.71 ± 3.35/7 | 5.30 ± 2.52/5 |
| <55 Years | 55–64 Years | 65–74 Years | 75–84 Years | ≥85 Years | p-Value | |
|---|---|---|---|---|---|---|
| Severe limitations n (%) | 0 (0.0) | 0 (0.0) | 2 (3.3) | 7 (8.6) | 4 (20.0) | <0.001 |
| Moderate limitations n (%) | 0 (0.0) | 2 (5.6) | 8 (13.1) | 22 (27.2) | 8 (40.0) | |
| Mild limitations n (%) | 5 (18.5) | 6 (16.7) | 28 (45.9) | 34 (42.0) | 7 (35.0) | |
| Minimal limitations n (%) | 22 (81.5) | 28 (77.8) | 23 (37.7) | 18 (22.2) | 1 (5) |
| Global n = 225 Mean ± SD | SPPB < 7 n = 53 Mean ± SD | SPPB ≥ 7 n = 172 Mean ± SD | p-Value | |
|---|---|---|---|---|
| Albumin (g/dL) | 4.20 ± 0.41 | 4.06 ± 0.39 | 4.26 ± 0.41 | 0.003 |
| Prealbumin (mg/dL) | 27.91 ± 7.74 | 25.91 ± 6.87 | 28.52 ± 7.93 | 0.041 |
| CRP (mg/dL) | 0.30 ± 1.40 | 1.13 ± 1.83 | 0.56 ± 1.22 | 0.010 |
| Creatinine (mg/dL) | 3.11 ± 1.31 | 2.98 ± 1.04 | 3.43 ± 1.37 | 0.026 |
| Hemoglobin (g/dL) | 12.10 ± 1.54 | 12.03 ± 1.43 | 12.31 ± 1.57 | 0.242 |
| total lymphocytes (×103/mm3) | 1930 ± 931.38 | 1920.05± 946.96 | 2090.95 ± 925.60 | 0.244 |
| Transferrin (mg/dL) | 219.91 ± 51.60 | 211.28 ± 58.11 | 222.50 ± 49.25 | 0.171 |
| GFR (CKD-EPI) (mL/min/1.73 m2) | 17.73 ± 7.61 | 19.37 ± 8.68 | 18.61 ± 7.27 | 0.526 |
| nPNA (g/kg weight/day) | 0.86 ± 0.24 | 0.87 ± 0.20 | 0.92 ± 0.25 | 0.244 |
| MIS | 4.56 ± 2.99 | 2.89 ± 1.46 | 8.18 ± 2.14 | <0.001 |
| PA | 4.23 ± 1.09 | 3.71 ± 1.07 | 4.39 ± 1.05 | <0.001 |
| Na/K | 1.38 ± 0.44 | 1.50 ± 0.50 | 1.34 ± 0.41 | 0.021 |
| %BCM | 42.19 ± 8.18 | 38.07 ± 9.19 | 43.46 ± 7.43 | <0.001 |
| %IBW | 43.44 ± 7.71 | 39.56 ± 8.53 | 44.64 ± 7.04 | <0.001 |
| %FM | 31.22 ± 9.02 | 34.21 ± 10.39 | 30.30 ± 8.37 | 0.006 |
| %FFM | 68.77 ± 9.02 | 65.77 ± 10.40 | 69.69 ± 8.37 | 0.005 |
| % MM | 32.79 ± 7.71 | 29.83 ± 8.29 | 33.70 ± 7.32 | 0.001 |
| BCMI | 7.90 ± 2.01 | 6.72 ± 2.06 | 8.27 ± 1.85 | <0.001 |
| MMI | 8.85 ± 2.02 | 7.85 ± 1.81 | 9.16 ± 1.99 | <0.001 |
| EMM | 24.22 ± 7.27 | 20.25 ± 6.61 | 25.42 ± 7.04 | <0.001 |
| AMM | 19.02 ± 4.74 | 16.28 ± 4.05 | 19.86 ± 4.62 | <0.001 |
| FFMI | 18.62 ± 2.35 | 17.46 ± 2.12 | 18.97 ± 2.31 | <0.001 |
| %TBW | 53.31 ± 7.39 | 51.85 ± 8.38 | 53.76 ± 7.03 | 0.099 |
| FMI | 8.89 ± 3.90 | 9.64 ± 4.38 | 8.66 ± 3.72 | 0.111 |
| HGS | 26.44 ± 10.60 | 19.07 ± 9.08 | 28.71 ± 10.00 | <0.001 |
| Model 1 | Model 2 | |||
|---|---|---|---|---|
| OR (95% CI) | p-Value | OR (95% CI) | p-Value | |
| HGS (kg) | 0.928 (0.879–0.981) | 0.008 | 0.933 (0.888–0.979) | 0.005 |
| FFMI (kg/m2) | 0.825 (0.882–0.997) | 0.047 | 0.815 (0.675–0.984) | 0.033 |
| Albumin (g/dL) | 0.245 (0.084–0.714) | 0.010 | ----- | ----- |
| Age (years) | 1.111 (1.054–1.171) | <0.001 | 1.111 (1.059–1.166) | <0.001 |
| CRP (mg/dL) | ----- | ----- | 1.267 (1.007–1.594) | 0.044 |
Publisher’s Note: MDPI stays neutral with regard to jurisdictional claims in published maps and institutional affiliations. |
© 2022 by the authors. Licensee MDPI, Basel, Switzerland. This article is an open access article distributed under the terms and conditions of the Creative Commons Attribution (CC BY) license (https://creativecommons.org/licenses/by/4.0/).
Share and Cite
Nogueira, Á.; Álvarez, G.; Barril, G. Impact of the Nutrition–Inflammation Status on the Functionality of Patients with Chronic Kidney Disease. Nutrients 2022, 14, 4745. https://doi.org/10.3390/nu14224745
Nogueira Á, Álvarez G, Barril G. Impact of the Nutrition–Inflammation Status on the Functionality of Patients with Chronic Kidney Disease. Nutrients. 2022; 14(22):4745. https://doi.org/10.3390/nu14224745
Chicago/Turabian StyleNogueira, Ángel, Graciela Álvarez, and Guillermina Barril. 2022. "Impact of the Nutrition–Inflammation Status on the Functionality of Patients with Chronic Kidney Disease" Nutrients 14, no. 22: 4745. https://doi.org/10.3390/nu14224745
APA StyleNogueira, Á., Álvarez, G., & Barril, G. (2022). Impact of the Nutrition–Inflammation Status on the Functionality of Patients with Chronic Kidney Disease. Nutrients, 14(22), 4745. https://doi.org/10.3390/nu14224745