

The Effect of Dietary Patterns on Inflammatory Biomarkers in Adults with Type 2 Diabetes Mellitus: A Systematic Review and Meta-Analysis of Randomized Controlled Trials


Abstract

1. Introduction
2. Materials and Methods
2.1. Search Strategy
2.2. Eligibility Criteria
2.3. Selection of Studies
2.4. Data Extraction
2.5. Quality Assessment and Risk of Bias of the Included Studies
2.6. Data Synthesis and Analysis
2.6.1. Meta-Analysis
2.6.2. Sensitivity Analyses
3. Results
3.1. Description of the Included Studies
3.2. Risk of Bias of Included Studies and Quality of Evidence
3.3. Primary Outcomes: Inflammatory Biomarkers and Dietary Patterns
3.3.1. Secondary Glycemic Control Outcomes
3.3.2. Meta-Analysis
3.3.3. Sensitivity Analyses/Subgroup Analyses
4. Discussion
4.1. Summary Findings
4.2. Hypothesis/Reasons of Our Findings
4.3. Similar Outcomes
4.4. Implications for Further Research
4.5. Strengths and Limitations
5. Conclusions
Supplementary Materials
Author Contributions
Funding
Institutional Review Board Statement
Informed Consent Statement
Data Availability Statement
Acknowledgments
Conflicts of Interest
References
- Zhang, H.; Yan, C.; Yang, Z.; Zhang, W.; Niu, Y.; Li, X.; Qin, L.; Su, Q. Alterations of serum trace elements in patients with type 2 diabetes. J. Trace Elem. Med. Biol. 2017, 40, 91–96. [Google Scholar] [CrossRef] [PubMed]
- Cho, N.H.; Shaw, J.E.; Karuranga, S.; Huang, Y.; da Rocha Fernandes, J.D.; Ohlrogge, A.W.; Malanda, B. IDF Diabetes Atlas: Global estimates of diabetes prevalence for 2017 and projections for 2045. Diabetes Res. Clin. Pract. 2018, 138, 271–281. [Google Scholar] [CrossRef] [PubMed]
- Pickup, J.C. Inflammation and Activated Innate Immunity in the Pathogenesis of Type 2 Diabetes. Diabetes Care 2004, 27, 813–823. [Google Scholar] [CrossRef] [PubMed]
- Raiten, D.J.; Ashour, F.A.S.; Ross, A.C.; Meydani, S.N.; Dawson, H.D.; Stephensen, C.B.; Brabin, B.J.; Suchdev, P.S.; van Ommen, B.; INSPIRE Consultative Group. Inflammation and Nutritional Science for Programs/Policies and Interpretation of Research Evidence (INSPIRE). J. Nutr. 2015, 145, 1039S–1108S. [Google Scholar] [CrossRef]
- Calder, P.C.; Ahluwalia, N.; Albers, R.; Bosco, N.; Bourdet-Sicard, R.; Haller, D.; Holgate, S.T.; Jönsson, L.S.; Latulippe, M.E.; Marcos, A.; et al. A Consideration of Biomarkers to be Used for Evaluation of Inflammation in Human Nutritional Studies. Br. J. Nutr. 2013, 109, S1–S34. [Google Scholar] [CrossRef]
- Griep, L.M.O.; Wang, H.; Chan, Q. Empirically Derived Dietary Patterns, Diet Quality Scores, and Markers of Inflammation and Endothelial Dysfunction. Curr. Nutr. Rep. 2013, 2, 97–104. [Google Scholar] [CrossRef]
- Schwingshackl, L.; Hoffmann, G. Mediterranean dietary pattern, inflammation and endothelial function: A systematic review and meta-analysis of intervention trials. Nutr. Metab. Cardiovasc. Dis. 2014, 24, 929–939. [Google Scholar] [CrossRef]
- Denova-Gutiérrez, E.; Muñoz-Aguirre, P.; Shivappa, N.; Hébert, J.R.; Tolentino-Mayo, L.; Batis, C.; Barquera, S. Dietary Inflammatory Index and Type 2 Diabetes Mellitus in Adults: The Diabetes Mellitus Survey of Mexico City. Nutrients 2018, 10, 385. [Google Scholar] [CrossRef]
- Schulze, M.B.; Hoffmann, K.; Manson, J.E.; Willett, W.C.; Meigs, J.B.; Weikert, C.; Heidemann, C.; Colditz, G.A.; Hu, F.B. Dietary pattern, inflammation, and incidence of type 2 diabetes in women. Am. J. Clin. Nutr. 2005, 82, 675–684. [Google Scholar] [CrossRef]
- Shivappa, N.; Godos, J.; Hébert, J.; Wirth, M.; Piuri, G.; Speciani, A.; Grosso, G. Dietary Inflammatory Index and Cardiovascular Risk and Mortality—A Meta-Analysis. Nutrients 2018, 10, 200. [Google Scholar] [CrossRef]
- Stamler, J. Toward a Modern Mediterranean Diet for the 21st Century. Nutr. Metab. Cardiovasc. Dis. 2013, 23, 1159–1162. [Google Scholar] [CrossRef] [PubMed]
- Zang, M.; Xu, S.; Maitland-Toolan, K.A.; Zuccollo, A.; Hou, X.; Jiang, B.; Wierzbicki, M.; Verbeuren, T.J.; Cohen, R.A. Polyphenols Stimulate AMP-Activated Protein Kinase, Lower Lipids, and Inhibit Accelerated Atherosclerosis in Diabetic LDL Receptor–Deficient Mice. Diabetes 2006, 55, 2180–2191. [Google Scholar] [CrossRef] [PubMed]
- Page, M.J.; McKenzie, J.E.; Bossuyt, P.M.; Boutron, I.; Hoffmann, T.C.; Mulrow, C.D.; Shamseer, L.; Tetzlaff, J.M.; Akl, E.A.; Brennan, S.E.; et al. The PRISMA 2020 Statement: An Updated Guideline for Reporting Systematic Reviews. BMJ 2021, 372, n71. [Google Scholar] [CrossRef] [PubMed]
- Moeller, S.M.; Reedy, J.; Millen, A.E.; Dixon, L.B.; Newby, P.; Tucker, K.L.; Krebs-Smith, S.M.; Guenther, P.M. Dietary Patterns: Challenges and Opportunities in Dietary Patterns Research: An Experimental Biology Workshop, April 1, 2006. J. Am. Diet. Assoc. 2007, 107, 1233–1239. [Google Scholar] [CrossRef] [PubMed]
- Millen, B.E.; Abrams, S.; Adams-Campbell, L.; Anderson, C.A.; Brenna, J.T.; Campbell, W.W.; Clinton, S.; Hu, F.; Nelson, M.; Neuhouser, M.L.; et al. The 2015 Dietary Guidelines Advisory Committee Scientific Report: Development and Major Conclusions. Adv. Nutr. Int. Rev. J. 2016, 7, 438–444. [Google Scholar] [CrossRef] [PubMed]
- Higgins, J.P.; Sterne, J.A.; Savovic, J.; Page, M.J.; Hrbjartsson, A.; Boutron, I.; Reeves, B.; Eldridge, S. A revised tool for assessing risk of bias in randomized trials. Cochrane Database Syst. Rev. 2016, 10, 29–31. [Google Scholar]
- Luo, D.; Wan, X.; Liu, J.; Tong, T. Optimally estimating the sample mean from the sample size, median, mid-range, and/or mid-quartile range. Stat. Methods Med. Res. 2018, 27, 1785–1805. [Google Scholar] [CrossRef]
- Shi, J.; Luo, D.; Wan, X.; Liu, Y.; Liu, J.; Bian, Z.; Tong, T. Detecting the skewness of data from the sample size and the five-number summary. arXiv 2020, arXiv:2010.05749. Available online: http://arxiv.org/abs/2010.05749 (accessed on 15 February 2022).
- Shi, J.; Luo, D.; Weng, H.; Zeng, X.; Lin, L.; Chu, H.; Tong, T. Optimally estimating the sample standard deviation from the five-number summary. Res. Synth. Methods 2020, 11, 641–654. [Google Scholar] [CrossRef]
- Wan, X.; Wang, W.; Liu, J.; Tong, T. Estimating the sample mean and standard deviation from the sample size, median, range and/or interquartile range. BMC Med. Res. Methodol. 2014, 14, 135. [Google Scholar] [CrossRef]
- Milone, M.T.; Kamath, A.F.; Israelite, C.L. Converting Between High- and Low-Sensitivity C-Reactive Protein in the Assessment of Periprosthetic Joint Infection. J. Arthroplast. 2014, 29, 685–689. [Google Scholar] [CrossRef] [PubMed]
- Helal, I.; Zerelli, L.; Krid, M.; ElYounsi, F.; Ben Maiz, H.; Zouari, B.; Adelmoula, J.; Kheder, A. Comparison of C-reactive protein and high-sensitivity C-reactive protein levels in patients on hemodialysis. Saudi J. Kidney Dis. Transplant. 2012, 23, 477–483. [Google Scholar]
- Gomez-Marin, B.; Gomez-Delgado, F.; Lopez-Moreno, J.; Alcala-Diaz, J.F.; Jimenez-Lucena, R.; Torres-Peña, J.D.; Garcia-Rios, A.; Ortiz-Morales, A.M.; Yubero-Serrano, E.M.; Malagon, M.D.M.; et al. Long-term consumption of a Mediterranean diet improves postprandial lipemia in patients with type 2 diabetes: The Cordioprev randomized trial. Am. J. Clin. Nutr. 2018, 108, 963–970. [Google Scholar] [CrossRef] [PubMed]
- Vitale, M.; Masulli, M.; Calabrese, I.; Rivellese, A.A.; Bonora, E.; Signorini, S.; Perriello, G.; Squatrito, S.; Buzzetti, R.; Sartore, G.; et al. Impact of a Mediterranean Dietary Pattern and Its Components on Cardiovascular Risk Factors, Glucose Control, and Body Weight in People with Type 2 Diabetes: A Real-Life Study. Nutrients 2018, 10, 1067. [Google Scholar] [CrossRef] [PubMed]
- Sureda, A.; Del Mar Bibiloni, M.; Julibert, A.; Bouzas, C.; Argelich, E.; Llompart, I.; Pons, A.; Tur, J.A. Adherence to the Mediterranean Diet and Inflammatory Markers. Nutrients 2018, 10, 62. [Google Scholar] [CrossRef] [PubMed]
- Esposito, K.; Maiorino, M.I.; Petrizzo, M.; Bellastella, G.; Giugliano, D. The Effects of a Mediterranean Diet on the Need for Diabetes Drugs and Remission of Newly Diagnosed Type 2 Diabetes: Follow-up of a Randomized Trial. Diabetes Care 2014, 37, 1824–1830. [Google Scholar] [CrossRef] [PubMed]
- Ceriello, A.; Esposito, K.; La Sala, L.; Pujadas, G.; De Nigris, V.; Testa, R.; Bucciarelli, L.; Rondinelli, M.; Genovese, S. The protective effect of the Mediterranean diet on endothelial resistance to GLP-1 in type 2 diabetes: A preliminary report. Cardiovasc. Diabetol. 2014, 13, 140. [Google Scholar] [CrossRef]
- Aas, A.-M.; Seljeflot, I.; Torjesen, P.A.; Diep, L.M.; Thorsby, P.M.; Birkeland, K.I. Blood glucose lowering by means of lifestyle intervention has different effects on adipokines as compared with insulin treatment in subjects with type 2 diabetes. Diabetologia 2006, 49, 872–880. [Google Scholar] [CrossRef]
- Myette-Côté, É.; Durrer, C.; Neudorf, H.; Bammert, T.D.; Botezelli, J.D.; Johnson, J.D.; DeSouza, C.A.; Little, J.P. The effect of a short-term low-carbohydrate, high-fat diet with or without postmeal walks on glycemic control and inflammation in type 2 diabetes: A randomized trial. Am. J. Physiol. Integr. Comp. Physiol. 2018, 315, R1210–R1219. [Google Scholar] [CrossRef]
- Zwickey, H.; Horgan, A.; Hanes, D.; Schiffke, H.; Moore, A.; Wahbeh, H.; Jordan, J.; Ojeda, L.; McMurry, M.; Elmer, P.; et al. Effect of the Anti-Inflammatory Diet in People with Diabetes and Pre-Diabetes: A Randomized Controlled Feeding Study. J. Restor. Med. 2019, 8, e20190107. [Google Scholar] [CrossRef]
- Kim, Y.; Keogh, J.B.; Clifton, P.M. Effects of Two Different Dietary Patterns on Inflammatory Markers, Advanced Glycation End Products and Lipids in Subjects without Type 2 Diabetes: A Randomised Crossover Study. Nutrients 2017, 9, 336. [Google Scholar] [CrossRef] [PubMed]
- Maiorino, M.I.; Bellastella, G.; Petrizzo, M.; Scappaticcio, L.; Giugliano, D.; Esposito, K. Mediterranean diet cools down the inflammatory milieu in type 2 diabetes: The MÉDITA randomized controlled trial. Endocrine 2016, 54, 634–641. [Google Scholar] [CrossRef] [PubMed]
- Golan, R.; Tirosh, A.; Schwarzfuchs, D.; Harman-Boehm, I.; Thiery, J.; Fiedler, G.M.; Blüher, M.; Stumvoll, M.; Shai, I. Dietary intervention induces flow of changes within biomarkers of lipids, inflammation, liver enzymes, and glycemic control. Nutrition 2012, 28, 131–137. [Google Scholar] [CrossRef] [PubMed][Green Version]
- Lasa, A.; Miranda, J.; Bulló, M.; Casas, R.; Salas-Salvadó, J.; Larretxi, I.; Estruch, R.; Ruiz-Gutiérrez, V.; Portillo, M.P. Comparative effect of two Mediterranean diets versus a low-fat diet on glycaemic control in individuals with type 2 diabetes. Eur. J. Clin. Nutr. 2014, 68, 767–772. [Google Scholar] [CrossRef]
- Thompson, D.; Walhin, J.; Batterham, A.M.; Stokes, K.; Cooper, A.; Andrews, R.C. Effect of Diet or Diet Plus Physical Activity Versus Usual Care on Inflammatory Markers in Patients with Newly Diagnosed Type 2 Diabetes: The Early ACTivity In Diabetes (ACTID) Randomized, Controlled Trial. J. Am. Heart Assoc. 2014, 3, e000828. [Google Scholar] [CrossRef]
- Belalcazar, L.M.; Reboussin, D.M.; Haffner, S.M.; Hoogeveen, R.C.; Kriska, A.M.; Schwenke, D.C.; Tracy, R.P.; Pi-Sunyer, F.X.; Ballantyne, C.M.; Look AHEAD Research Group. 1-Year Lifestyle Intervention for Weight Loss in Individuals With Type 2 Diabetes Reduces High C-Reactive Protein Levels and Identifies Metabolic Predictors of Change. Diabetes Care 2010, 33, 2297–2303. [Google Scholar] [CrossRef]
- Itsiopoulos, C.; Brazionis, L.; Kaimakamis, M.; Cameron, M.; Best, J.; O’Dea, K.; Rowley, K. Can the Mediterranean diet lower HbA1c in type 2 diabetes? Results from a randomized cross-over study. Nutr. Metab. Cardiovasc. Dis. 2011, 21, 740–747. [Google Scholar] [CrossRef]
- Sauder, K.A.; McCrea, C.E.; Ulbrecht, J.S.; Kris-Etherton, P.; West, S.G. Effects of pistachios on the lipid/lipoprotein profile, glycemic control, inflammation, and endothelial function in type 2 diabetes: A randomized trial. Metabolism 2015, 64, 1521–1529. [Google Scholar] [CrossRef]
- Azadbakht, L.; Surkan, P.J.; Esmaillzadeh, A.; Willett, W.C. The Dietary Approaches to Stop Hypertension Eating Plan Affects C-Reactive Protein, Coagulation Abnormalities, and Hepatic Function Tests among Type 2 Diabetic Patients. J. Nutr. 2011, 141, 1083–1088. [Google Scholar] [CrossRef]
- Vera, I.M.; Tapia, M.S.; Noriega-López, L.; Granados-Portillo, O.; Guevara-Cruz, M.; Flores-López, A.; Avila-Nava, A.; Fernández, M.L.; Tovar, A.R.; Torres, N. A dietary intervention with functional foods reduces metabolic endotoxaemia and attenuates biochemical abnormalities by modifying faecal microbiota in people with type 2 diabetes. Diabetes Metab. 2019, 45, 122–131. [Google Scholar] [CrossRef]
- Fernemark, H.; Jaredsson, C.; Bunjaku, B.; Rosenqvist, U.; Nystrom, F.H.; Guldbrand, H. A Randomized Cross-Over Trial of the Postprandial Effects of Three Different Diets in Patients with Type 2 Diabetes. PLoS ONE 2013, 8, e79324. [Google Scholar] [CrossRef] [PubMed]
- Hinderliter, A.L.; Babyak, M.A.; Sherwood, A.; Blumenthal, J.A. The DASH Diet and Insulin Sensitivity. Curr. Hypertens. Rep. 2011, 13, 67–73. [Google Scholar] [CrossRef] [PubMed]
- The Diabetes Prevention Program (DPP) Research Group. The Diabetes Prevention Program (DPP): Description of lifestyle intervention. Diabetes Care 2002, 25, 2165–2171. [Google Scholar] [CrossRef] [PubMed]
- Chiuve, S.E.; Fung, T.T.; Rimm, E.B.; Hu, F.B.; McCullough, M.L.; Wang, M.; Stampfer, M.J.; Willett, W.C. Alternative Dietary Indices Both Strongly Predict Risk of Chronic Disease. J. Nutr. 2012, 142, 1009–1018. [Google Scholar] [CrossRef] [PubMed]
- McEvoy, C.T.; Cardwell, C.R.; Woodside, J.V.; Young, I.S.; Hunter, S.J.; McKinley, M.C. A Posteriori Dietary Patterns Are Related to Risk of Type 2 Diabetes: Findings from a Systematic Review and Meta-Analysis. J. Acad. Nutr. Diet. 2014, 114, 1759–1775.e4. [Google Scholar] [CrossRef] [PubMed]
- Tang, C.; Wang, X.; Qin, L.-Q.; Dong, J.-Y. Mediterranean Diet and Mortality in People with Cardiovascular Disease: A Meta-Analysis of Prospective Cohort Studies. Nutrients 2021, 13, 2623. [Google Scholar] [CrossRef]
- Eleftheriou, D.; Benetou, V.; Trichopoulou, A.; La Vecchia, C.; Bamia, C. Mediterranean diet and its components in relation to all-cause mortality: Meta-analysis. Br. J. Nutr. 2018, 120, 1081–1097. [Google Scholar] [CrossRef]
- Morze, J.; Danielewicz, A.; Przybyłowicz, K.; Zeng, H.; Hoffmann, G.; Schwingshackl, L. An updated systematic review and meta-analysis on adherence to mediterranean diet and risk of cancer. 2021, 60, 1561–1586. Eur. J. Nutr. 2021, 60, 1561–1586. [Google Scholar] [CrossRef]
- Galbete, C.; Schwingshackl, L.; Schwedhelm, C.; Boeing, H.; Schulze, M.B. Evaluating Mediterranean Diet and risk of chronic disease in cohort studies: An umbrella review of meta-analyses. Eur. J. Epidemiol. 2018, 33, 909–931. [Google Scholar] [CrossRef]
- Evert, A.B.; Boucher, J.L.; Cypress, M.; Dunbar, S.A.; Franz, M.J.; Mayer-Davis, E.J.; Neumiller, J.J.; Nwankwo, R.; Verdi, C.L.; Urbanski, P.; et al. Nutrition Therapy Recommendations for the Management of Adults With Diabetes. Diabetes Care 2013, 37, S120–S143. [Google Scholar] [CrossRef]
- Barbaresko, J.; Koch, M.; Schulze, M.B.; Nöthlings, U. Dietary pattern analysis and biomarkers of low-grade inflammation: A systematic literature review. Nutr. Rev. 2013, 71, 511–527. [Google Scholar] [CrossRef] [PubMed]
- Kolb, H.; Mandrup-Poulsen, T. The global diabetes epidemic as a consequence of lifestyle-induced low-grade inflammation. Diabetologia 2010, 53, 10–20. [Google Scholar] [CrossRef] [PubMed]
- de Souza, R.; Mente, A.; Maroleanu, A.; Cozma, A.I.; Ha, V.; Kishibe, T.; Uleryk, E.; Budylowski, P.; Schünemann, H.; Beyene, J.; et al. Intake of saturated and trans unsaturated fatty acids and risk of all cause mortality, cardiovascular disease, and type 2 diabetes: Systematic review and meta-analysis of observational studies. BMJ 2015, 351, h3978. [Google Scholar] [CrossRef] [PubMed]
- Mirmiran, P. Functional foods-based diet as a novel dietary approach for management of type 2 diabetes and its complications: A review. World J. Diabetes 2014, 5, 267–281. [Google Scholar] [CrossRef] [PubMed]
- American Diabetes Association. Nutrition Recommendations and Interventions for Diabetes: A position statement of the American Diabetes Association. Diabetes Care 2007, 30, S48–S65. [Google Scholar] [CrossRef] [PubMed]
- Clemente, J.M.G.; Cabot, G.L. Parámetros de control glucémico: Nuevas perspectivas en la evaluación del diabético [Assessment of glycemic control: New insights into the evaluation of the diabetic patient]. Med. Clin. 2010, 135, 15–19. (In Spanish) [Google Scholar] [CrossRef]
- Steckhan, N.; Hohmann, C.-D.; Kessler, C.; Dobos, G.; Michalsen, A.; Cramer, H. Effects of different dietary approaches on inflammatory markers in patients with metabolic syndrome: A systematic review and meta-analysis. Nutrition 2016, 32, 338–348. [Google Scholar] [CrossRef]
- Reynolds, A.N.; Akerman, A.P.; Mann, J. Dietary fibre and whole grains in diabetes management: Systematic review and meta-analyses. PLoS Med. 2020, 17, e1003053. [Google Scholar] [CrossRef]
- Taylor, L.E.; Sullivan, J.C. Sex differences in obesity-induced hypertension and vascular dysfunction: A protective role for estrogen in adipose tissue inflammation? Am. J. Physiol. Integr. Comp. Physiol. 2016, 311, R714–R720. [Google Scholar] [CrossRef]
- Shivappa, N.; Steck, S.E.; Hurley, T.G.; Hussey, J.R.; Hébert, J.R. Designing and developing a literature-derived, population-based dietary inflammatory index. Public Health Nutr. 2014, 17, 1689–1696. [Google Scholar] [CrossRef]
- Witkiewitz, K.; Heather, N.; Falk, D.E.; Litten, R.Z.; Hasin, D.S.; Kranzler, H.R.; Mann, K.F.; O’Malley, S.S.; Anton, R.F. World Health Organization risk drinking level reductions are associated with improved functioning and are sustained among patients with mild, moderate and severe alcohol dependence in clinical trials in the United States and United Kingdom. Addiction 2020, 115, 1668–1680. [Google Scholar] [CrossRef] [PubMed]
- Jannasch, F.; Kröger, J.; Schulze, M.B. Dietary Patterns and Type 2 Diabetes: A Systematic Literature Review and Meta-Analysis of Prospective Studies. J. Nutr. 2017, 147, 1174–1182. [Google Scholar] [CrossRef] [PubMed]
- Milenkovic, T.; Bozhinovska, N.; Macut, D.; Bjekic-Macut, J.; Rahelic, D.; Asimi, Z.V.; Burekovic, A. Mediterranean Diet and Type 2 Diabetes Mellitus: A Perpetual Inspiration for the Scientific World. A Review. Nutrients 2021, 13, 1307. [Google Scholar] [CrossRef]
- Riccardi, G.; Capaldo, B.; Vaccaro, O. Functional foods in the management of obesity and type 2 diabetes. Curr. Opin. Clin. Nutr. Metab. Care 2005, 8, 630–635. [Google Scholar] [CrossRef]
- Hill, J.O.; Peters, J.C. Biomarkers and functional foods for obesity and diabetes. Br. J. Nutr. 2002, 88, S213–S218. [Google Scholar] [CrossRef] [PubMed]
- Eichelmann, F.; Schwingshackl, L.; Fedirko, V.; Aleksandrova, K. Effect of plant-based diets on obesity-related inflammatory profiles: A systematic review and meta-analysis of intervention trials. Obes. Rev. 2016, 17, 1067–1079. [Google Scholar] [CrossRef]
- Williams, P.; Ghosh, D. Health claims and functional foods. Nutr. Diet. 2008, 65, S89–S93. [Google Scholar] [CrossRef]
- Rosenfeld, R.M.; Kelly, J.H.; Agarwal, M.; Aspry, K.; Barnett, T.; Davis, B.C.; Fields, D.; Gaillard, T.; Gulati, M.; Guthrie, G.E.; et al. Dietary Interventions to Treat Type 2 Diabetes in Adults with a Goal of Remission: An Expert Consensus Statement from the American College of Lifestyle Medicine. Am. J. Lifestyle Med. 2022, 16, 342–362. [Google Scholar] [CrossRef]
- Aune, D.; Norat, T.; Romundstad, P.R.; Vatten, L.J. Whole grain and refined grain consumption and the risk of type 2 diabetes: A systematic review and dose–response meta-analysis of cohort studies. Eur. J. Epidemiol. 2013, 28, 845–858. [Google Scholar] [CrossRef]
- Greenwood, D.C.; Threapleton, D.E.; Evans, C.; Cleghorn, C.L.; Nykjaer, C.; Woodhead, C.; Burley, V. Association between sugar-sweetened and artificially sweetened soft drinks and type 2 diabetes: Systematic review and dose–response meta-analysis of prospective studies. Br. J. Nutr. 2014, 112, 725–734. [Google Scholar] [CrossRef]
- Grosso, G.; Fresán, U.; Bes-Rastrollo, M.; Marventano, S.; Galvano, F. Environmental Impact of Dietary Choices: Role of the Mediterranean and Other Dietary Patterns in an Italian Cohort. Int. J. Environ. Res. Public Health 2020, 17, 1468. [Google Scholar] [CrossRef] [PubMed]
- Neale, E.P.; Batterham, M.J.; Tapsell, L.C. Consumption of a healthy dietary pattern results in significant reductions in C-reactive protein levels in adults: A meta-analysis. Nutr. Res. 2016, 36, 391–401. [Google Scholar] [CrossRef] [PubMed]
- Soltani, S.; Jayedi, A.; Shab-Bidar, S.; Becerra-Tomás, N.; Salas-Salvadó, J. Adherence to the Mediterranean Diet in Relation to All-Cause Mortality: A Systematic Review and Dose-Response Meta-Analysis of Prospective Cohort Studies. Adv. Nutr. Int. Rev. J. 2019, 10, 1029–1039. [Google Scholar] [CrossRef] [PubMed]
- Papamichou, D.; Panagiotakos, D.; Itsiopoulos, C. Dietary patterns and management of type 2 diabetes: A systematic review of randomised clinical trials. Nutr. Metab. Cardiovasc. Dis. 2019, 29, 531–543. [Google Scholar] [CrossRef]
- Koloverou, E.; Panagiotakos, D.B.; Georgousopoulou, E.N.; Grekas, A.; Christou, A.; Chatzigeorgiou, M.; Chrysohoou, C.; Tousoulis, D.; Stefanadis, C.; Pitsavos, C.; et al. Dietary Patterns and 10-year (2002–2012) Incidence of Type 2 Diabetes: Results from the ATTICA Cohort Study. Rev. Diabet. Stud. 2016, 13, 246–256. [Google Scholar] [CrossRef]
- Nowlin, S.Y.; Hammer, M.J.; Melkus, G.D. Diet, Inflammation, and Glycemic Control in Type 2 Diabetes: An Integrative Review of the Literature. J. Nutr. Metab. 2012, 2012, 542698. [Google Scholar] [CrossRef]
- Fabiani, R.; Naldini, G.; Chiavarini, M. Dietary Patterns and Metabolic Syndrome in Adult Subjects: A Systematic Review and Meta-Analysis. Nutrients 2019, 11, 2056. [Google Scholar] [CrossRef]
- Koelman, L.; Rodrigues, C.E.; Aleksandrova, K. Effects of Dietary Patterns on Biomarkers of Inflammation and Immune Responses: A Systematic Review and Meta-Analysis of Randomized Controlled Trials. Adv. Nutr. Int. Rev. J. 2022, 13, 101–115. [Google Scholar] [CrossRef]


| Author | Year | Study Name, Country | Follow-Up Duration | Number of Participants | Control/ Intervention Diet | Diet Assessment Method (Items) | Food and Average Components Intervention Diet | Glycemic Control Experimental vs. Control Groups | Biomarkers of Inflammation Experimental vs. Control Groups |
|---|---|---|---|---|---|---|---|---|---|
| Thompson, 2014 [35] | 2014 | United Kingdom ACTID | 1 year | 593 M: 385 F: 208 | Standard dietary/Diabetes UK healthy eating guidelines | Food diaries | Diet was not prescriptive. Foods according to energy density and content of nutrients and glycemic index. Diet was oriented to goals. | HbA1c 7 6.64 1 (0.93) 2 Δ −27%** HOMA-IR 9 1.60 1 (0.74) 2 Δ −28%** | IL-6 a 1.85 1 (−24, −0.9) 5 Δ −13% * CRP b 1.53 1 (−27, −13) 5 Δ −9.2% * sICAM-1c 232.3 1 (−11, −3.1) 5 Δ −7.1% * Adiponectin d 5.79 1, (−2.5, −14) 5 Δ + 5.2% * |
| Maiorino, 2016 [32] | 2016 | Italy MÉDITA trial | 8.1 years | 215 M: 106 F: 109 | Low fat diet/MD | Semi-quantitative FFQ Mediterranean Diet score | E%:1800 kcal/d (M), 1500 kcal/d (F), carbohydrate <50% of daily energy >30% fat calories. Plus: 30 to 50 g of olive oil. | HbA1c 7 7.75 1 ± 0.9 2 Fasting glucose 5 162 1 (34) 2 HOMA-IR 5.2 1 (1.7) 2 Δ 3.3 1 ± 1.2 2,* | CPR c 0.81 (−1.3, −0.3) 5, Δ −37% Adiponectin d 1.91 (0.8,3.09) * Δ + 43% * |
| Lasa, 2014 [34] | 2014 | Spain PREDIMED | 1 year | 191 M: 77 F: 114 | Low-fat diet/MD | 137-item FFQ | Subjects received intensive education to follow MD with qualitive aspects and quantitively: virgin olive oil (1 L/week) 30 g/d of mixed nuts (15 g walnuts, 7.5 g almonds, 7.5 g hazelnuts)) Positive and negative recommendations enriched: MUFA (50 mL) 1 L/week virgin olive oil (4 spoons oil/d) | HbA1c 7 8.1 1 (0.5) 2 Fasting glucose 5 147.5 1 (49.6) 2 Δ 3.6 (41.7) * HOMA-IR 9 9.6 1 (6.6) 2 Δ 0.4 1 (4.8) 2 | Adiponectin d +20.2 1 (44.5) 2,* Visfatin c +1.2 1 (5.5) 2 Leptin c −0.1 1 (1.1) 2 TNF-α a + 1.7 1 (23.3) 2 Resistin c −0.0 1 (0.5) 2 A/Ld + 8.1 1 (21.9) 2,* ICAM-ac −110.5 1 (10.1) 2,* IL-6 a −170.20 1(8.3) 2,* |
| Itsiopoulos, 2011 [37] | 2011 | Australia | 24 weeks* (12 weeks and then crossing over to the alternate diet) | 27 M: 16 F: 11 | Habitual diet/ MD | Self-completed seven-day diet record (in household measure) | E%: 11 MJ (2627 kcal) of total energy: medium carbohydrate (44% of energy, alcohol, 4% of energy from red wine), moderate protein (12% of energy), high in fat (40% of energy; > 50% from MUFA), olive oil (75 mL/d). Fiber (47 g/d), folate (700 mg/d), vitamin C (274 mg/d), carotenoids lycopene (14.4 mg/d), lutein/zeaxanthin (19.8 mg/d), fruits (563 g/day), vegetables (691 g/day) (280 g/day green leafy vegetables) | HbA1c 7 6.8 1 (6.3−7.3) 5,** Fasting glucose 5 8.9 1 (7.8−10.0) 5 HOMA-IR 9 5.2 1(3.9−6.6) 5 | CRP e CDt 2.49 1, (1.69, 3.30) 5 MD 2.38 1, (1.66, 3.10) 5 IL-6 a Δ −49% ** |
| Sauder, 2015 [38] | 2015 | USA | 8 weeks | 30 M: 15 F: 15 | American Heart Association’s Therapeutic Lifestyle Changes diet/+ pistachios | Daily compliance questionnaires | E%: Moderate energy fat (26.9%), SFA (6.7% of energy), and cholesterol (186 mg/d) + 20% of daily energy from pistachios. | HbA1c 7 6.2 1 (0.1) 2 Δ 6.0 1 (0.0) 2 Fasting glucose 5 106.29 1 (10.81) 2 Δ 5.9 1 (0.1) 2 HOMA-IR 9 1.8 1 (0.6) 2 Δ 1.6 1 (0.1) 2 | CRP e 1.98 1 (0.16) 2 ICAM -1 c 112.1 1 (5.8) 2 VCAM-1 c 337.7 1 (21.2) 2 E-selectin c 47.1 1 (3.6) 2 |
| Medina, 2018 [40] | 2018 | Mexico | 3 months | 81 M: 46 F: 35 | Placebo diet/ AD dietary portfolio | 24 h dietary recall | E%: 45–55% carbohydrate, 15–20% protein, 25–35% fat (< 7% SFA), 200 mg/day cholesterol, 20–35 g of fiber and 2000–3000 mg/d of sodium Based on 200 kcal from diet: 14 g of dehydrated nopal, 30 g of soy protein, 4 g of chia seeds, and 4 g of inulin, + 15 g of maltodextrin and 28 g of calcium caseinate | HbA1c 7 7.51 1 (1.2) 2 Δ − 7.2% * Fasting glucose 6 8.6 1 (2.8) 2 Δ − 8.7% * HOMA-IR 9 3.5 1 (2.1) 2 | CRP b Δ −13% * LPS e Δ −65% * |
| Golan, 2012 [33] | 2012 | Israel DIRECT trial | 2 years | 46 M: 42 F: 4 | Low-fat diet/MD | FFQ | Moderate-fat, restricted calorie. Low energy diet E%: 1800 kcal/d (M), 1500 500 kcal/d (F), fat 35%; 30 to 45 g of olive oil + nuts (five to seven nuts, <20 g/d). | Fasting glucose 5 142.8 1 (53.08) 2 Δ − 7.72 (53.1) Fasting plasma insulin 14.2 1 (10.05) Δ − 2.63 (5.4) | CRP b 5.0 1 (3.4) 2 Δ − 0.66 1 (3.0) 2 Leptin e M 7.8 1 (4.4) 2 Δ − 1.1 1 (2.8) 2 F 28.9 1 (12.8) 2 Δ − 6.3 ± 6.8 Adiponectin e M 6.0 1 (1.8) 2 Δ 0.5 1 (1.9) 2 F 7.3 1 (3.9) 2 Δ 1.5 1 (2.5) 2 |
| Azadbakht, 2011 [39] | 2011 | Iran | 8 weeks | 31 M: 13 F: 18 | Control diet/DASH diet | 3-D food diaries | Calculation of individual energy requirements. E%: 50–60% carbohydrates, 15–20% protein, <30% total fat, and <5% energy from simple sugars. High: vegetables, fruits, whole grains, and low-fat dairy products, minimum of saturated fat, cholesterol, refined grains, and sweets. Sodium 2400 mg/d +PUFA | Fasting glucose 5 Δ − 13.9 (4.5) ** | hs-CRP b CDt 2.91 1 (0.30)2 DASH 2.04 1 (0.20)2* % Δ CDt − 5.1 1 (3.8)2 DASH − 26.9 1 (3.5)2 * |
| Belalcazar, 2012 [36] | 2012 | USA Look AHEAD | 1 year | 1759 M: 720 F: 1039 | Diabetes support and education/ DPP | FFQ | E%: < 114 kg: 1200––1500 kcal/d, ≥114 kg: 1500–1800800 kcal/d (low-calorie), fat diet (<3.030% of kcal. <10% SFA from fat), total energy: 1200 to 1800 kcal/d (>15% from protein and <30% of calories from fat). Meal replacement products: 1 portion-controlled snack, and 1 self-selected meal/day. At week 20: same prescribed meal replacement/d and two meals of self-selected foods. Continue dietary protocol for years 2–4 + 1 meal replacement/d. | HbA1c 7 7.25 1 (1.14) 2 Δ − 0.7 1 (1.0) 2,* Fasting glucose 5 152.19 1 (44.71) 2 Δ − 21.7 1 (44.4) 2 * | CRP b CDt 4.2 3 (1.9,8.8) 4 DPP 4.2 3 (1.9,9.1) 4 Δ − 1.24 (−3.4,0.01) * Adiponectin d CDt 4.8 3(3.5, 7) 4 % Δ 0.2 3 (−15.6, 20.1) 4 DPP 4.6 3 (3.3, 6.6) 4 % Δ 11.9 (−7.2, 37.5) * HMW-adiponectin d, CDt 1.9 3 (1.2,3.2) 4 % Δ 0.9 3 (−0.4,0.5) 4 DPP 1.9 3 (1.1, 3.1) 4 % Δ 21.1 (−6.4,60.9) 4,* |
| Fernemark, 2013 [41] | 2013 | Sweden | 9 weeks | 19 M: 10 F: 9 | Low-fat diet/MD | Directly report | E%: 1025–1080 kcal (M) and 905–984 kcal (F) 32–35% carbohydrates, protein 15%, fat 40%, MUFA 29.1 g, PUFA 8.3 g, SFA 8.1 g. (Not including food eaten at home later during the day) + 200 mL black coffee + red wine 14% alcohol (20 mL/150 mL) Ingested as one single large meal for lunch. | HbA1c 8 511 (10) 2 Fasting glucose 6 801 (17) 2,* | Leptin a CDt 16.7581 (11,611) 2 MD 13.8221(11,187) 2,* |
| Certainty Assessment | No. of Patients | Effect | Certainty | Importance | ||||||||
|---|---|---|---|---|---|---|---|---|---|---|---|---|
| No. of Studies | Study Design | Risk of Bias | Inconsistency | Indirectness | Imprecision | Other Considerations | Final Values | Diet Control | Relative (95%CI) | Absolute (95%CI) | ||
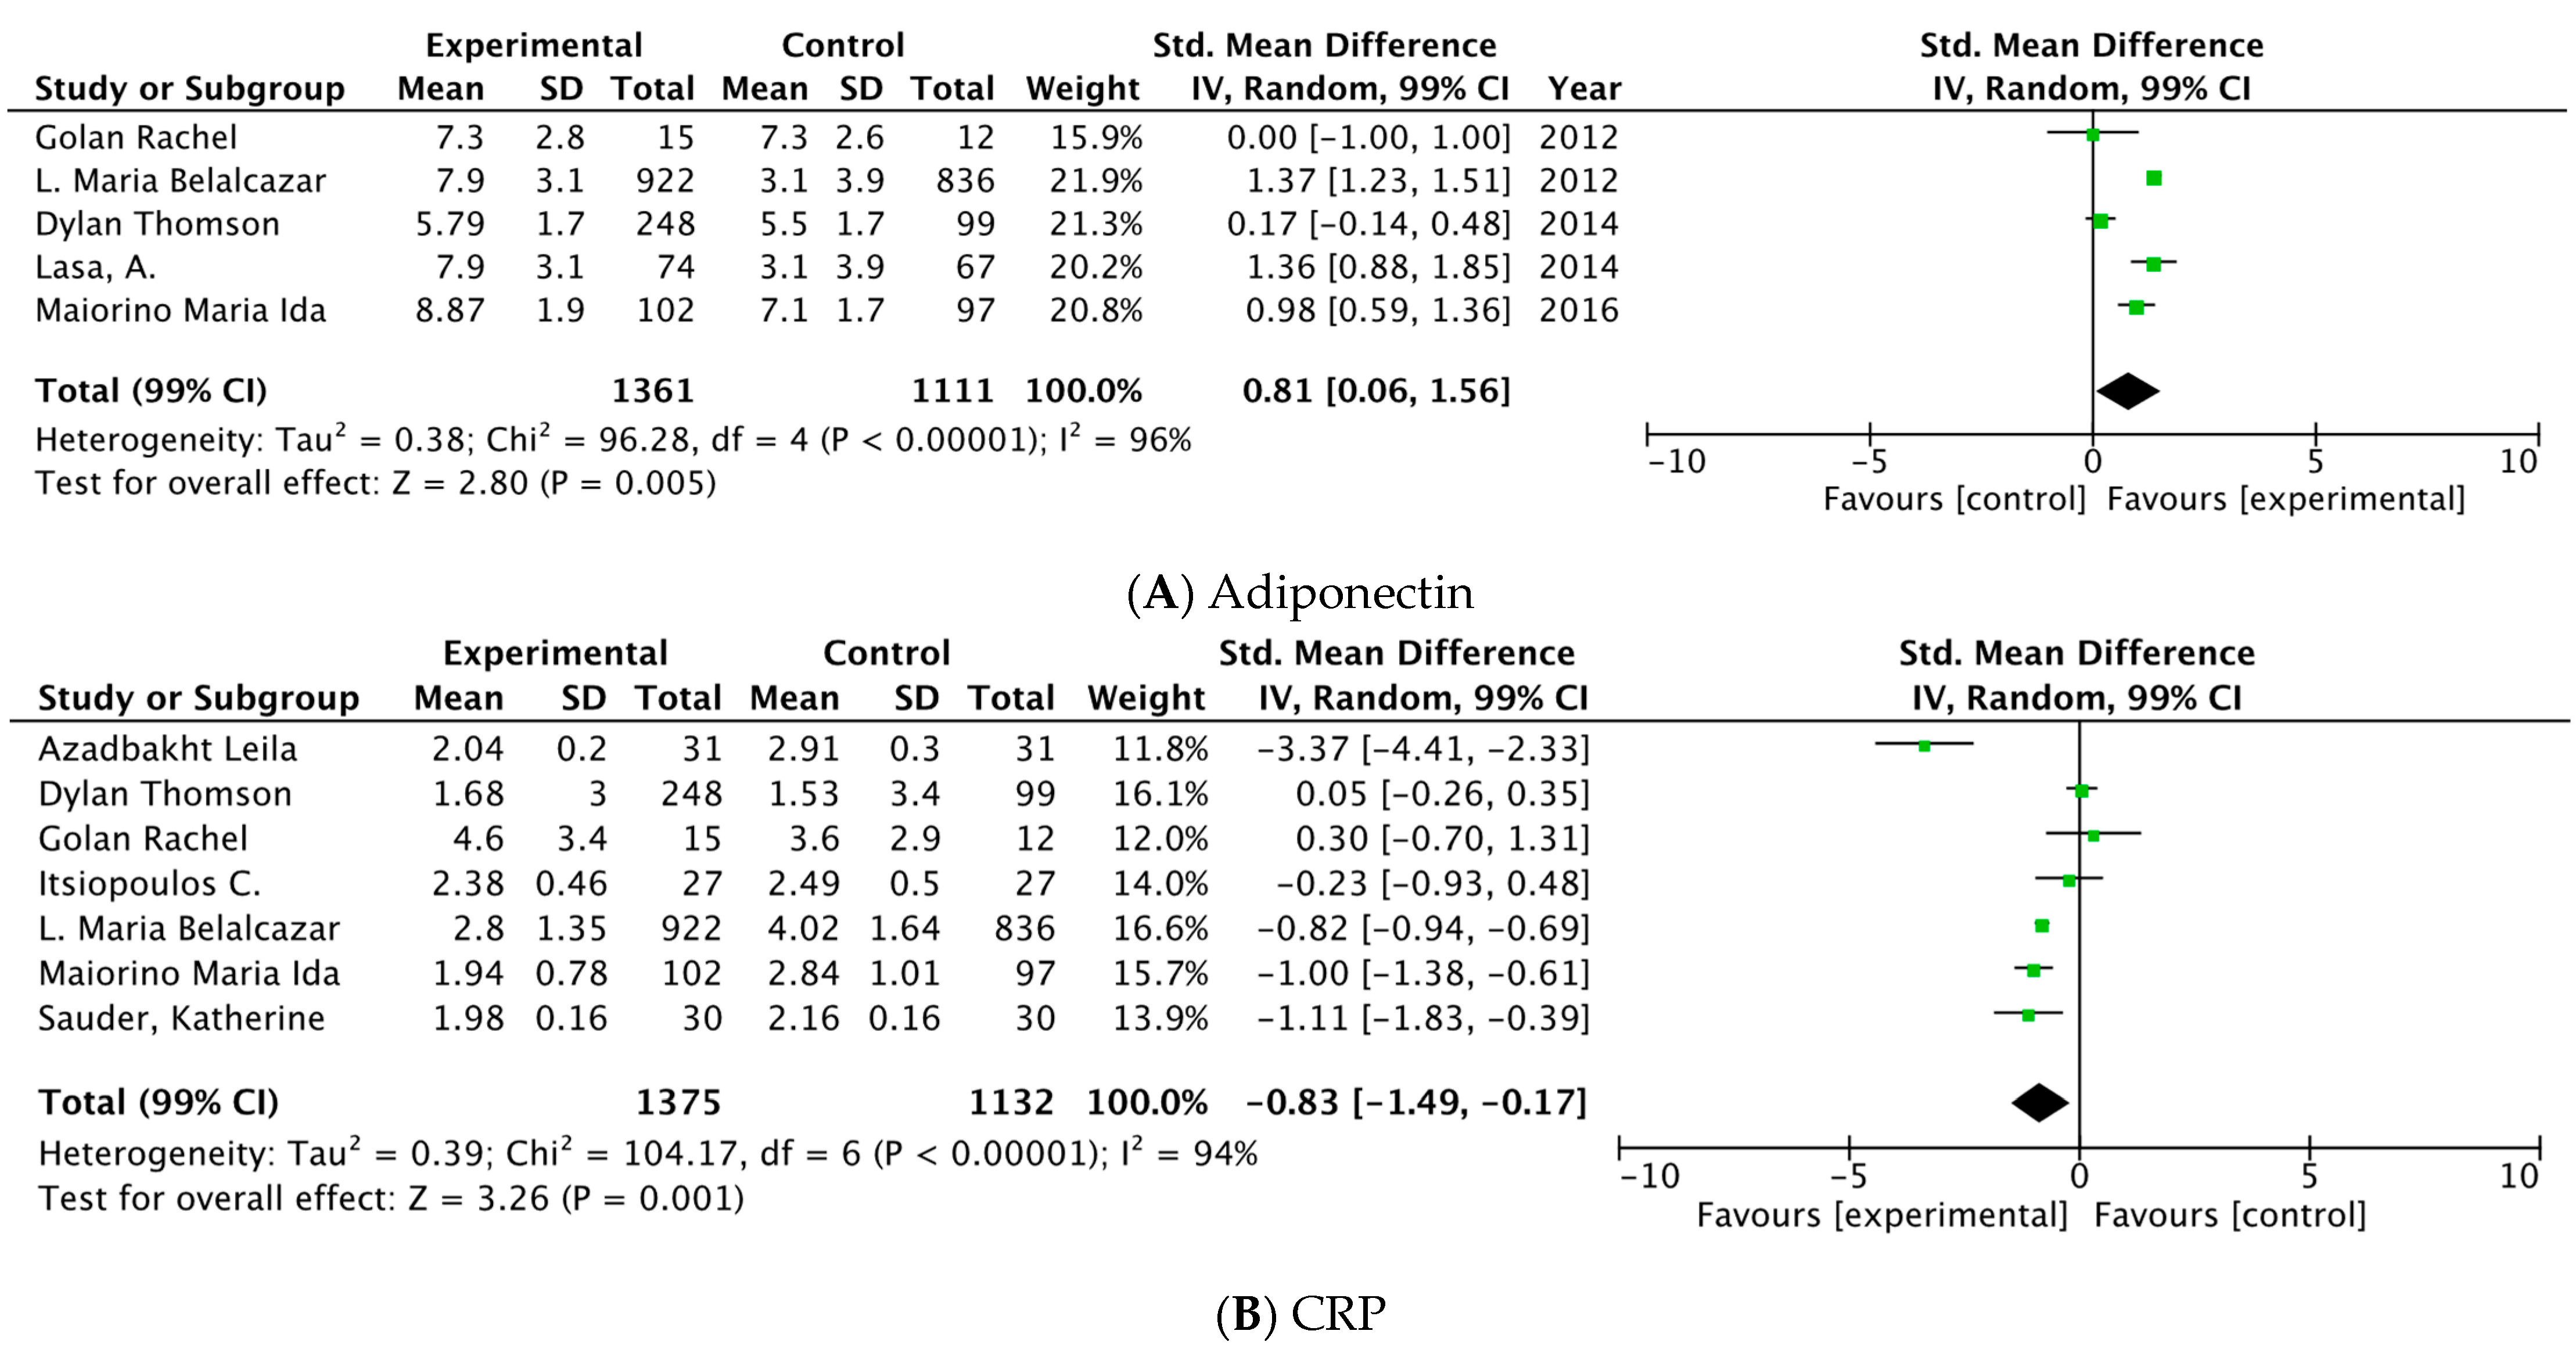
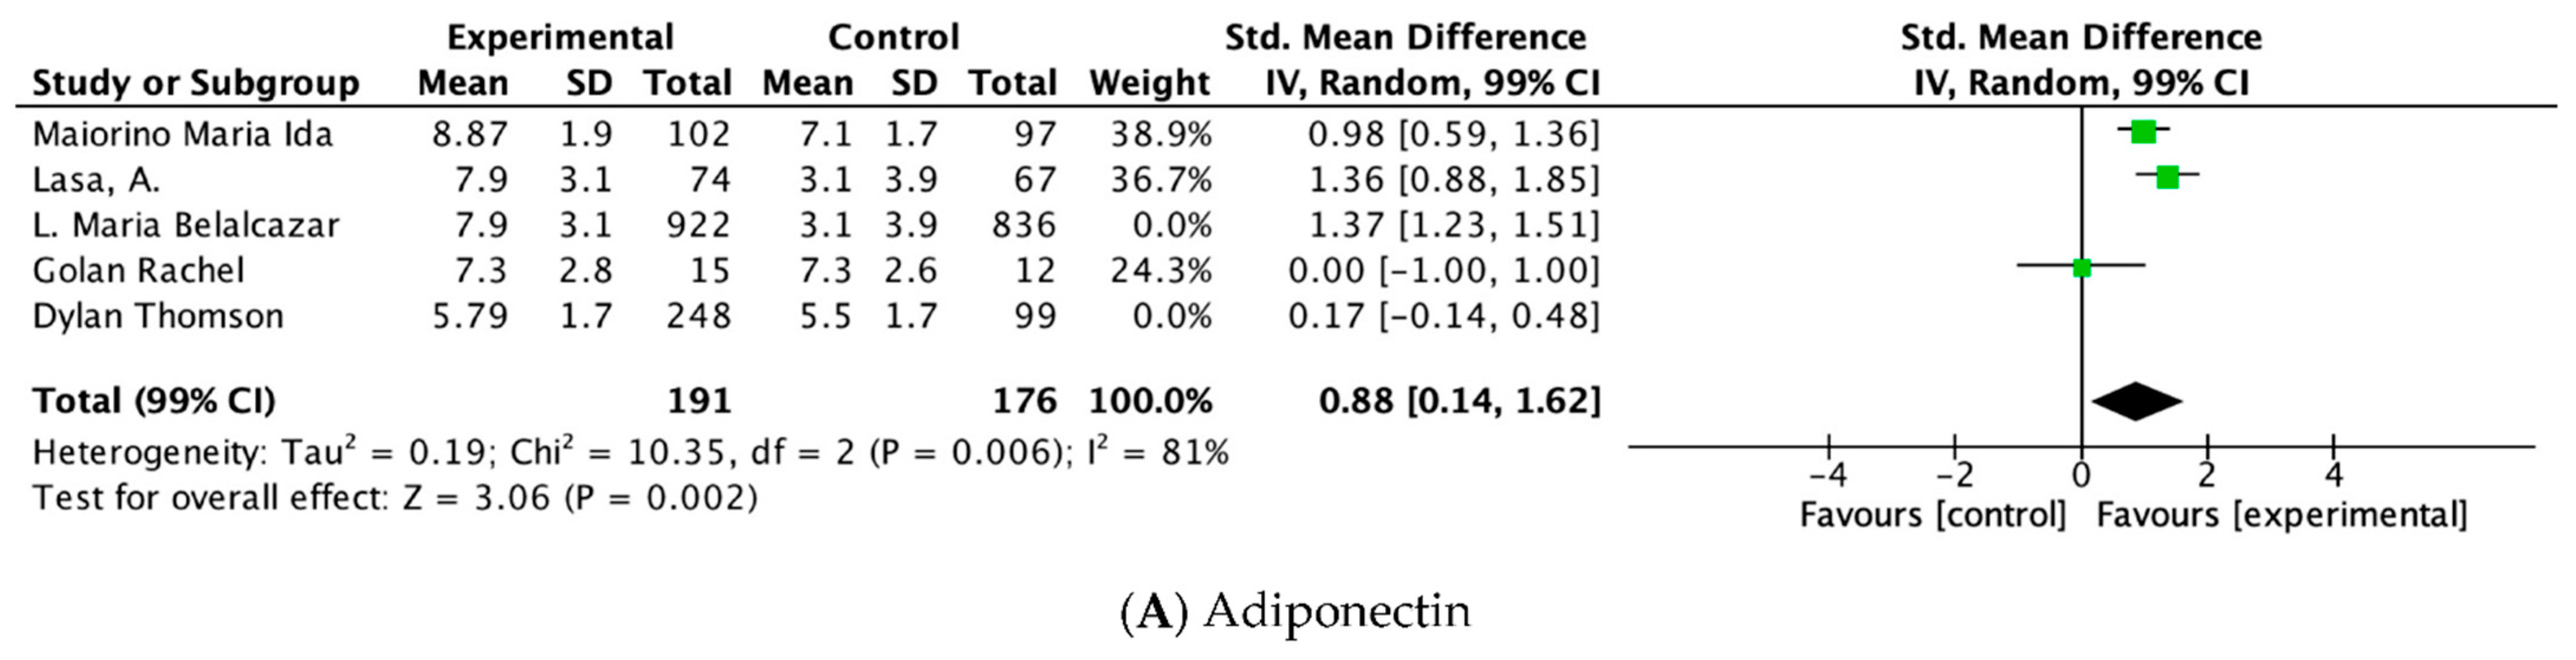
| Adiponectin | ||||||||||||
| 5 | RCT | serious a | very serious b | NT | NT | Decrease the demonstrated effect by all plausible residual confounding | 1361 | 1111 | - | SMD 0.81 higher (0.06 higher to 1.56 higher) | ⊕⊕◯◯ Low | Important |
| PCR | ||||||||||||
| 7 | RCT | serious a,b | serious b | NT | NT | The spurious effect is suggested by all plausible residual confounding, while no effect was observed | 1375 | 1132 | - | SMD 0.83 lower (1.49 lower to 0.17 lower) | ⊕⊕⊕◯ Moderate | Important |
| Dietary Pattern | Adiponectin | IL-6 | CRP | Leptin | I-CAM |
|---|---|---|---|---|---|
| Thompson, 2014 [35] |  |  | | ---- | |
| Belalcazar, 2012 [36] | | ---- | | ---- | ---- |
| Medina, 2018 [40] | ---- | ---- |  | ---- | ---- |
| Maiorino, 2016 [32] |  | ---- | | ---- | ---- |
| Lasa, 2014 [34] | ---- |  | | | |
| Itsiopulos, 2011 [37] | ---- | | | ---- | ---- |
| Fernemark, 2012 [41] | ---- | ---- | ---- | | ---- |
| Golan, 2012 [33] | | ---- | | | ---- |
| Sauder, 2015 [38] | ---- | ---- |  | ---- |  |
| Azadbakht, 2012 [39] | ---- | ---- | | ---- | ---- |
 , anti-inflammatory diet; CRP, C-reactive protein; CP
  , Cardio Protective; DASH, Dietary Approaches to Stop Hypertension; ICAM-1, intercellular adhesion molecule; IL-6, interleukin-6; MD
  , Mediterranean Diet; DE
  , specialized diet for subjects with diabetes.
Publisher’s Note: MDPI stays neutral with regard to jurisdictional claims in published maps and institutional affiliations. |
© 2022 by the authors. Licensee MDPI, Basel, Switzerland. This article is an open access article distributed under the terms and conditions of the Creative Commons Attribution (CC BY) license (https://creativecommons.org/licenses/by/4.0/).
Share and Cite
Sánchez-Rosales, A.I.; Guadarrama-López, A.L.; Gaona-Valle, L.S.; Martínez-Carrillo, B.E.; Valdés-Ramos, R. The Effect of Dietary Patterns on Inflammatory Biomarkers in Adults with Type 2 Diabetes Mellitus: A Systematic Review and Meta-Analysis of Randomized Controlled Trials. Nutrients 2022, 14, 4577. https://doi.org/10.3390/nu14214577
Sánchez-Rosales AI, Guadarrama-López AL, Gaona-Valle LS, Martínez-Carrillo BE, Valdés-Ramos R. The Effect of Dietary Patterns on Inflammatory Biomarkers in Adults with Type 2 Diabetes Mellitus: A Systematic Review and Meta-Analysis of Randomized Controlled Trials. Nutrients. 2022; 14(21):4577. https://doi.org/10.3390/nu14214577
Chicago/Turabian StyleSánchez-Rosales, Abril I., Ana L. Guadarrama-López, Laura S. Gaona-Valle, Beatriz E. Martínez-Carrillo, and Roxana Valdés-Ramos. 2022. "The Effect of Dietary Patterns on Inflammatory Biomarkers in Adults with Type 2 Diabetes Mellitus: A Systematic Review and Meta-Analysis of Randomized Controlled Trials" Nutrients 14, no. 21: 4577. https://doi.org/10.3390/nu14214577
APA StyleSánchez-Rosales, A. I., Guadarrama-López, A. L., Gaona-Valle, L. S., Martínez-Carrillo, B. E., & Valdés-Ramos, R. (2022). The Effect of Dietary Patterns on Inflammatory Biomarkers in Adults with Type 2 Diabetes Mellitus: A Systematic Review and Meta-Analysis of Randomized Controlled Trials. Nutrients, 14(21), 4577. https://doi.org/10.3390/nu14214577