
Screen Time and Its Association with Vegetables, Fruits, Snacks and Sugary Sweetened Beverages Intake among Chinese Preschool Children in Changsha, Hunan Province: A Cross-Sectional Study


Abstract
1. Introduction
2. Materials and Methods
2.1. Ethic Approvals
2.2. Study Design and Participants
2.3. Data Collection
2.3.1. Demographics and Anthropometrics
2.3.2. Children’s Screen Time
2.3.3. Children Food Consumption Frequencies
2.3.4. Covariates
2.4. Data Analysis
3. Results
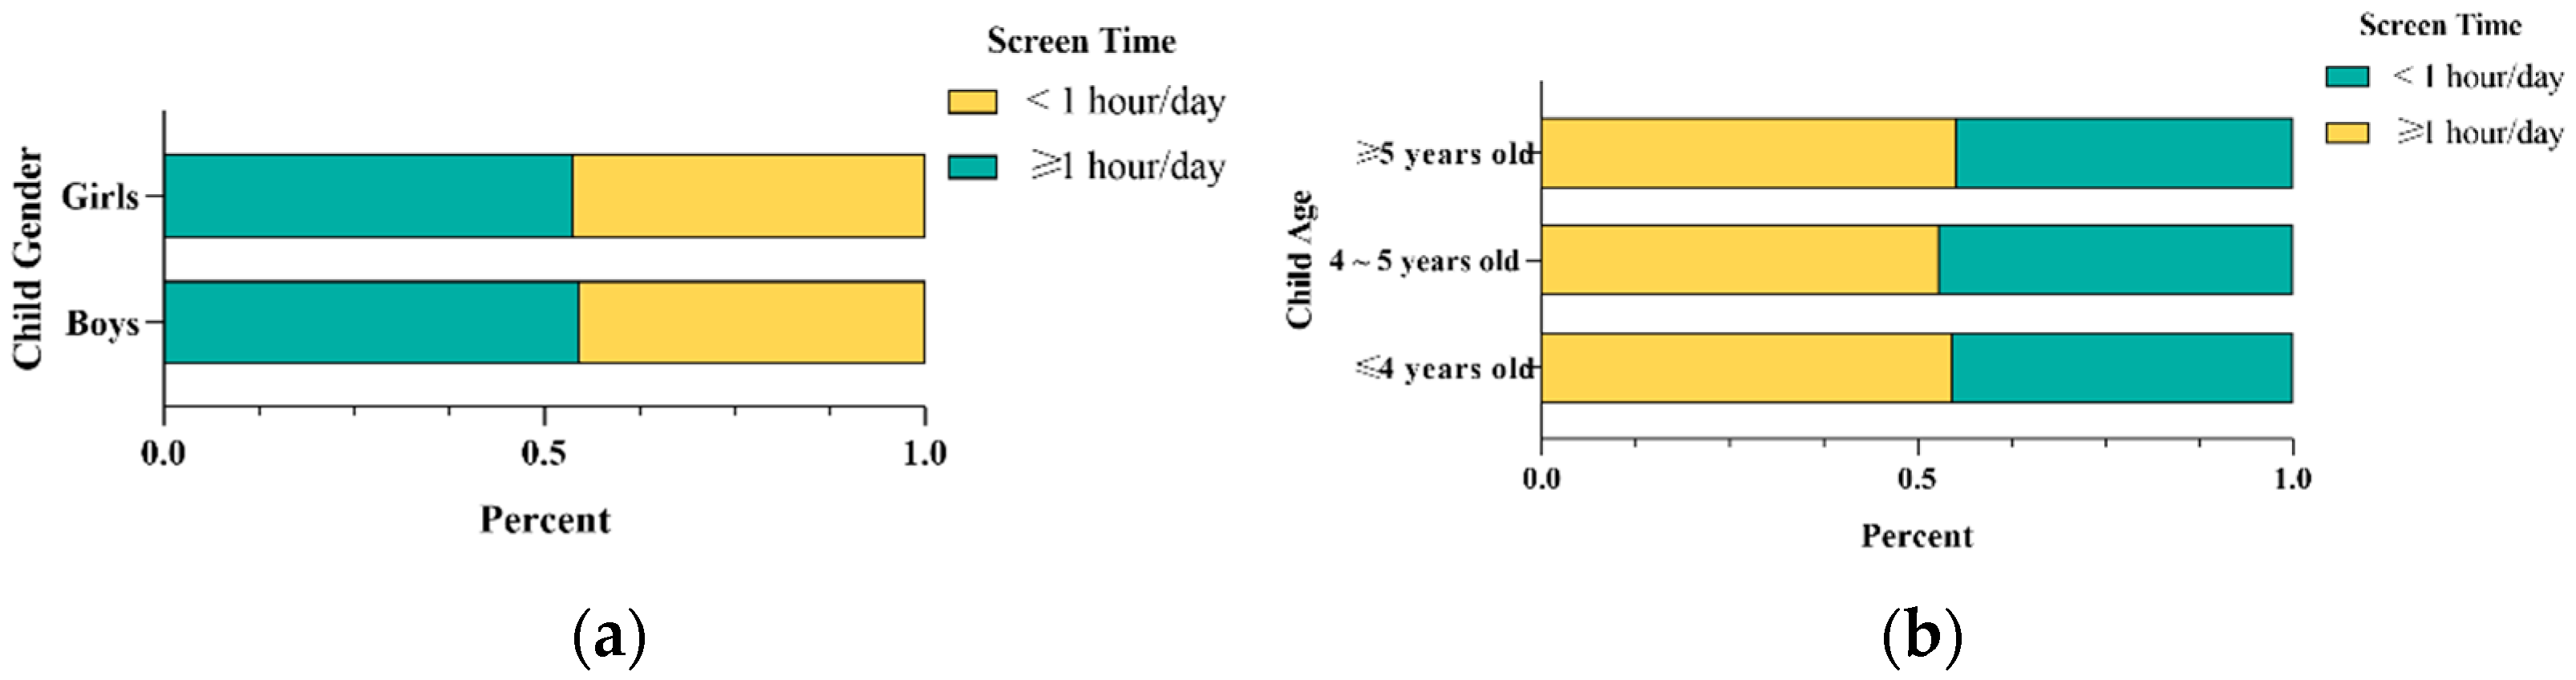
3.1. Screen Time
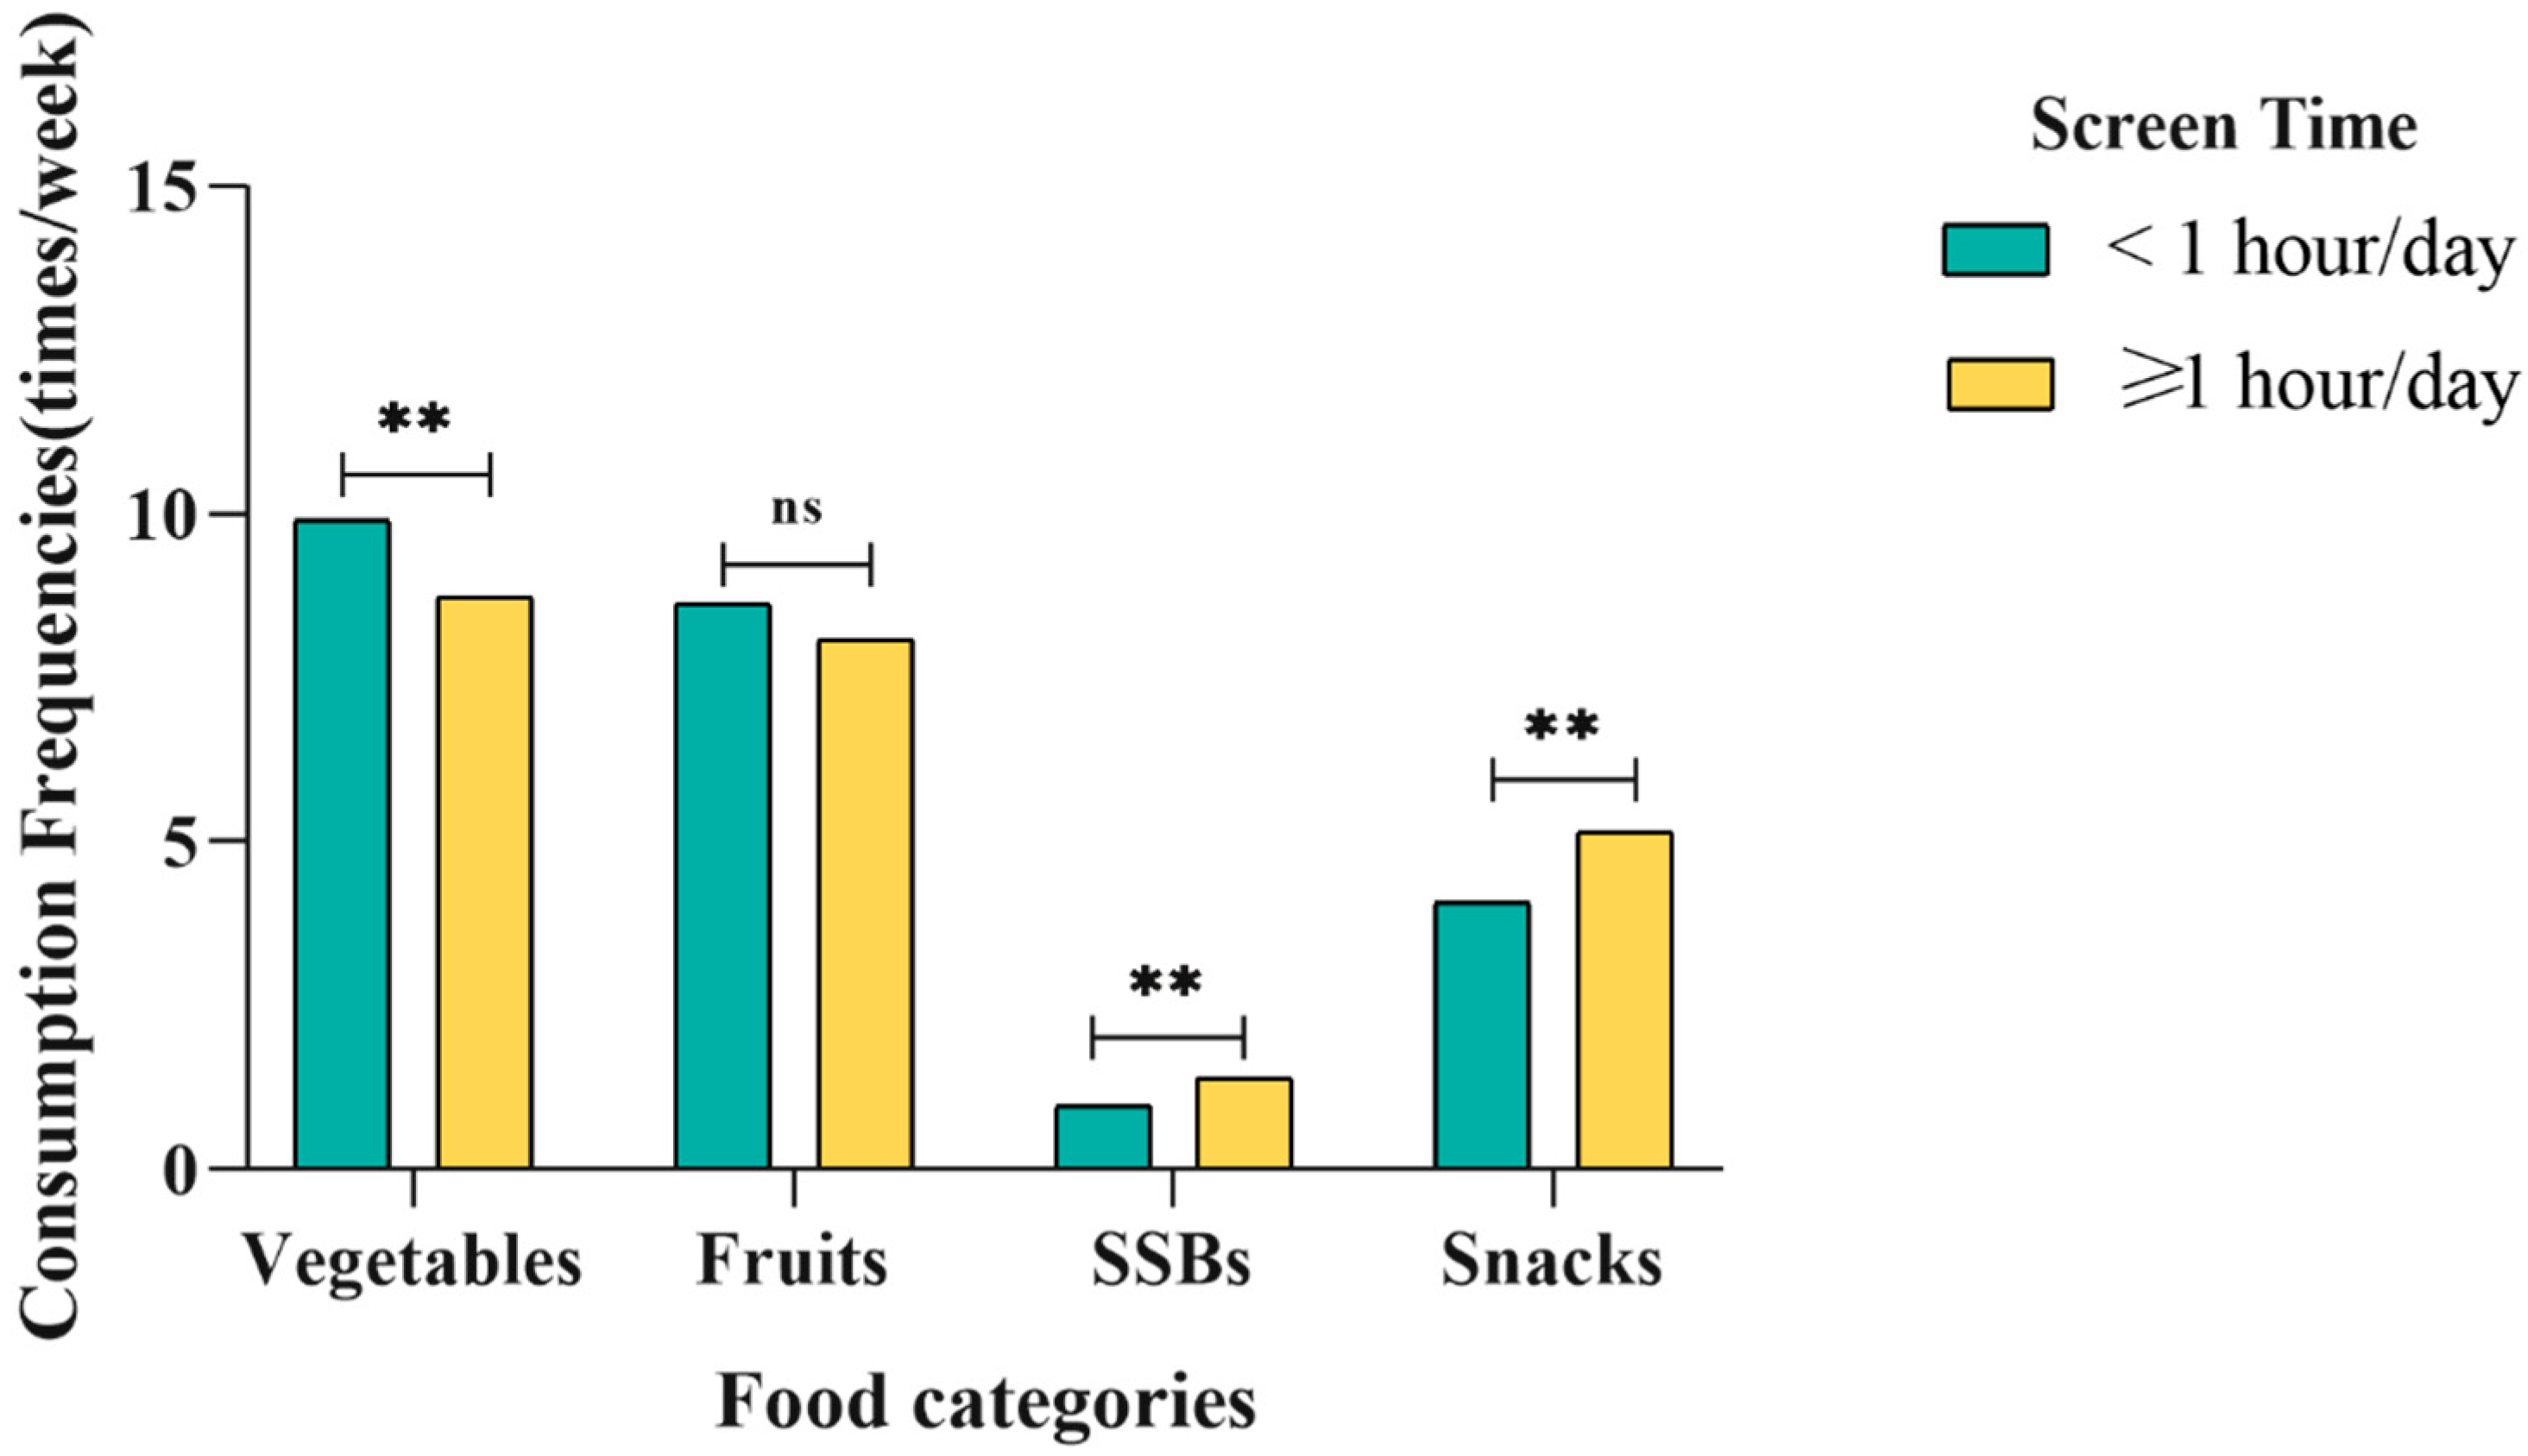
3.2. Food Consumption Frequency of the Participants
3.3. Associations between Screen Time and Consumption of Vegetables, Fruits, Snacks and Sugary Sweetened Beverages
4. Discussion
4.1. The Status of Screen Time among Preschool Children
4.2. Screen Time and Its Associated Factors
4.3. The Status of F&V Consumption and Its Associated Factors
4.4. Association between Screen Time and Consumption Frequency of F&V
4.5. The Status of Snacks and SSB Consumption and Its Associated Factors
4.6. Association between Screen Time and Consumption Frequency of Snacks and SSBs
4.7. Strengths and Limitations
5. Conclusions
Supplementary Materials
Author Contributions
Funding
Institutional Review Board Statement
Informed Consent Statement
Data Availability Statement
Acknowledgments
Conflicts of Interest
References
- Bu, T.; Tang, D.; Liu, Y.; Chen, D. Trends in Dietary Patterns and Diet-related Behaviors in China. Am. J. Health Behav. 2021, 45, 371–383. [Google Scholar] [CrossRef] [PubMed]
- Lian, Y.; Li, C.; Fang, Y.; Lu, X.; He, Y. Effect of children’s dietary behaviors on the consumption of vegetables and fruits among preschool children. Chin. J. Health Educ. 2021, 37, 579–583+592. [Google Scholar] [CrossRef]
- Fang, Y.; He, Y.; Li, C. Evaluation of dietary quality of Chinese preschool children based on Chinese diet balance index for preschool children. Chin. J. Prev. Med. 2020, 54, 662–667. [Google Scholar]
- Xu, J.; Wang, L.; Yang, T.; Xu, P.; Li, L.; Cao, W.; Cao, Q.; Pan, H.; Wang, H.; Hu, X.; et al. Changes of the dietary intake of vegetable and fruit among Chinese children aged 6–17 in 1982 and 2012. Chin. J. Dis. Control Prev. 2021, 25, 509–514. [Google Scholar] [CrossRef]
- Zhang, L.; Ren, J.; He, X.; Yu, C.; Zhang, Y. Investigation on snack and health products consumption of preschool children in Cangzhou urban. Matern. Child Health Care China 2013, 28, 3474–3476. [Google Scholar]
- Avery, A.; Anderson, C.; McCullough, F. Associations between children’s diet quality and watching television during meal or snack consumption: A systematic review. Matern. Child Nutr. 2017, 13, e12428. [Google Scholar] [CrossRef]
- Börnhorst, C.; Wijnhoven, T.M.A.; Kunešová, M.; Yngve, A.; Rito, A.I.; Lissner, L.; Duleva, V.; Petrauskiene, A.; Breda, J. WHO European Childhood Obesity Surveillance Initiative: Associations between sleep duration, screen time and food consumption frequencies. BMC Public Health 2015, 15, 442. [Google Scholar] [CrossRef]
- Rocha, L.L.; Gratão, L.H.A.; Carmo, A.S.d.; Costa, A.B.P.; Cunha, C.d.F.; Oliveira, T.R.P.R.d.; Mendes, L.L. School Type, Eating Habits, and Screen Time are Associated with Ultra-Processed Food Consumption Among Brazilian Adolescents. J. Acad. Nutr. Diet. 2021, 121, 1136–1142. [Google Scholar] [CrossRef]
- Shqair, A.Q.; Pauli, L.A.; Costa, V.P.P.; Cenci, M.; Goettems, M.L. Screen time, dietary patterns and intake of potentially cariogenic food in children: A systematic review. J. Dent. 2019, 86, 17–26. [Google Scholar] [CrossRef]
- Braithwaite, I.; Stewart, A.W.; Hancox, R.J.; Beasley, R.; Murphy, R.; Mitchell, E.A. The worldwide association between television viewing and obesity in children and adolescents: Cross sectional study. PLoS ONE 2013, 8, e74263. [Google Scholar] [CrossRef]
- Montoye, A.H.; Pfeiffer, K.A.; Alaimo, K.; Betz, H.H.; Paek, H.-J.; Carlson, J.J.; Eisenmann, J.C. Junk food consumption and screen time: Association with childhood adiposity. Am. J. Health Behav. 2013, 37, 395–403. [Google Scholar] [CrossRef] [PubMed]
- Li, C.; Cheng, G.; Sha, T.; Cheng, W.; Yan, Y. The Relationships between Screen Use and Health Indicators among Infants, Toddlers, and Preschoolers: A Meta-Analysis and Systematic Review. Int. J. Env. Res. Public Health 2020, 17, 7324. [Google Scholar] [CrossRef] [PubMed]
- Fang, K.; Mu, M.; Liu, K.; He, Y. Screen time and childhood overweight/obesity: A systematic review and meta-analysis. Child Care Health Dev. 2019, 45, 744–753. [Google Scholar] [CrossRef]
- Oude Groeniger, J.; de Koster, W.; van der Waal, J. Time-varying Effects of Screen Media Exposure in the Relationship Between Socioeconomic Background and Childhood Obesity. Epidemiology 2020, 31, 578–586. [Google Scholar] [CrossRef]
- Okely, A.D.; Ghersi, D.; Hesketh, K.D.; Santos, R.; Loughran, S.P.; Cliff, D.P.; Shilton, T.; Grant, D.; Jones, R.A.; Stanley, R.M.; et al. A collaborative approach to adopting/adapting guidelines—The Australian 24-Hour Movement Guidelines for the early years (Birth to 5 years): An integration of physical activity, sedentary behavior, and sleep. BMC Public Health 2017, 17, 869. [Google Scholar] [CrossRef]
- Tamana, S.K.; Ezeugwu, V.; Chikuma, J.; Lefebvre, D.L.; Azad, M.B.; Moraes, T.J.; Subbarao, P.; Becker, A.B.; Turvey, S.E.; Sears, M.R.; et al. Screen-time is associated with inattention problems in preschoolers: Results from the CHILD birth cohort study. PLoS ONE 2019, 14, e0213995. [Google Scholar] [CrossRef] [PubMed]
- Ma, Y.; Jiao, T.; Huang, Y.; Shu, G.; Song, Y.; Jiang, L. Association between screen time and sleep duration and the moderating effect of outdoor activity among preschoolers. Chin. J. Child Health Care 2022, 30, 664–668. [Google Scholar]
- Trofholz, A.C.; Tate, A.; Loth, K.; Neumark-Sztainer, D.; Berge, J.M. Watching Television while Eating: Associations with Dietary Intake and Weight Status among a Diverse Sample of Young Children. J. Acad. Nutr. Diet. 2019, 119, 1462–1469. [Google Scholar] [CrossRef]
- Jensen, M.L.; Dillman Carpentier, F.R.; Corvalán, C.; Popkin, B.M.; Evenson, K.R.; Adair, L.; Taillie, L.S. Television viewing and using screens while eating: Associations with dietary intake in children and adolescents. Appetite 2022, 168, 105670. [Google Scholar] [CrossRef]
- Borghese, M.M.; Tremblay, M.S.; Leduc, G.; Boyer, C.; Bélanger, P.; LeBlanc, A.G.; Francis, C.; Chaput, J.-P. Independent and combined associations of total sedentary time and television viewing time with food intake patterns of 9- to 11-year-old Canadian children. Appl. Physiol. Nutr. Metab. 2014, 39, 937–943. [Google Scholar] [CrossRef]
- Pearson, N.; Biddle, S.J.H. Sedentary behavior and dietary intake in children, adolescents, and adults. A systematic review. Am. J. Prev. Med. 2011, 41, 178–188. [Google Scholar] [CrossRef] [PubMed]
- Lin, Y.-Y.; Lee, W.-T.; Yang, H.-L.; Weng, W.-C.; Lee, C.-C.; Jeng, S.-F.; Tsai, S.-Y. Screen Time Exposure and Altered Sleep in Young Children with Epilepsy. J. Nurs. Sch. 2020, 52, 352–359. [Google Scholar] [CrossRef] [PubMed]
- Biddle, S.J.H.; García Bengoechea, E.; Pedisic, Z.; Bennie, J.; Vergeer, I.; Wiesner, G. Screen Time, Other Sedentary Behaviours, and Obesity Risk in Adults: A Review of Reviews. Curr. Obes. Rep. 2017, 6, 134–147. [Google Scholar] [CrossRef] [PubMed]
- Hale, L.; Guan, S. Screen time and sleep among school-aged children and adolescents: A systematic literature review. Sleep Med. Rev. 2015, 21, 50–58. [Google Scholar] [CrossRef]
- Wang, J.-J.; Lau, W.-C.P.; Wang, H.-J.; Ma, J. Evaluation of a comprehensive intervention with a behavioural modification strategy for childhood obesity prevention: A nonrandomized cluster controlled trial. BMC Public Health 2015, 15, 1206. [Google Scholar] [CrossRef]
- Hu, Y.; Wu, Q.; Zha, D.; Huang, Y.; Fang, G.; Lin, S. Influence of Early Feeding Practices on Consumption of Fruits and Vegetables among Children in Kindergarden. Chin. J. Child Health Care 2017, 25, 24–27. [Google Scholar]
- Guan, H.; Zhao, X.; Qu, S.; Wu, J.; Yang, Y.; Guo, J.; Zhang, T.; Luo, D. Physical Activity Guideline for Chinese Preschoolers Aged 3~6 Years. Chin. J. Child Health Care 2020, 28, 714–720. [Google Scholar]
- Xi, Y.; Liu, Y.; Yang, Q.; Liu, H.; Luo, J.; Ouyang, Y.; Sun, M.; Huo, J.; Zou, J.; Lin, Q. Food neophobia and its association with vegetable, fruit and snack intake among 12- to 36-month toddlers in China: A cross-sectional study. Food Qual. Prefer. 2022, 98, 104513. [Google Scholar] [CrossRef]
- Xiang, C.; Zhang, Y.; Yong, C.; Xi, Y.; Huo, J.; Zou, H.; Liang, J.; Jiang, Z.; Lin, Q. Association between Parents’ Perceptions of Preschool Children’s Weight, Feeding Practices and Children’s Dietary Patterns: A Cross-Sectional Study in China. Nutrients 2021, 13, 3767. [Google Scholar] [CrossRef]
- Song, P.; Wang, J.; Wei, W.; Chang, X.; Wang, M.; An, L. The Prevalence of Vitamin A Deficiency in Chinese Children: A Systematic Review and Bayesian Meta-Analysis. Nutrients 2017, 9, 1285. [Google Scholar] [CrossRef]
- Huang, F.; Wang, H.; Wang, Z.; Zhang, B. Brief Introduction of Guidelines on Snacks for Chinese Children and Adolescents (2018). Acta Nutr. Sin. 2018, 40, 417–418. [Google Scholar] [CrossRef]
- Birch, L.L.; Fisher, J.O.; Grimm-Thomas, K.; Markey, C.N.; Sawyer, R.; Johnson, S.L. Confirmatory factor analysis of the Child Feeding Questionnaire: A measure of parental attitudes, beliefs and practices about child feeding and obesity proneness. Appetite 2001, 36, 201–210. [Google Scholar] [CrossRef]
- Zheng, L.; Song, D.; Chen, C.; Li, F.; Zhu, D. Reliability and validity of a Chinese version of Child Feeding Questionnaire among parents of preschoolers. Chin. J. Child Health Care 2016, 24, 1019–1023. [Google Scholar]
- Xun, K. Research on the Relationship and Risk Factors of Childhood Obesity and Appetite. Ph.D. Thesis, FuDan University, Shanghai, China, 2012. [Google Scholar]
- Sandvik, P.; Ek, A.; Somaraki, M.; Hammar, U.; Eli, K.; Nowicka, P. Picky eating in Swedish preschoolers of different weight status: Application of two new screening cut-offs. Int. J. Behav. Nutr. Phys. Act. 2018, 15, 74. [Google Scholar] [CrossRef] [PubMed]
- Zou, J.; Liu, Y.; Yang, Q.; Liu, H.; Luo, J.; Ouyang, Y.; Wang, J.; Lin, Q. Cross-cultural adaption and validation of the Chinese version of the Child Food Neophobia Scale. BMJ Open 2019, 9, e026729. [Google Scholar] [CrossRef] [PubMed]
- Damsbo-Svendsen, M.; Frøst, M.B.; Olsen, A. Development of novel tools to measure food neophobia in children. Appetite 2017, 113, 255–263. [Google Scholar] [CrossRef]
- Xie, G.; Deng, Q.; Cao, J.; Chang, Q. Digital screen time and its effect on preschoolers’ behavior in China: Results from a cross-sectional study. Ital. J. Pediatr. 2020, 46, 9. [Google Scholar] [CrossRef]
- Teng, X.; Ding, L.; Shao, J.; Yuan, A.; Song, J.; Zhang, C.; Li, L.; Nie, L.; Liu, X.; Zhao, D.; et al. Research on the current status and influencing factors of electronic screen exposure in children aged 4 to 6 years in Shandong. Chin. J. Child Health Care 2019, 27, 1300–1303+1307. [Google Scholar]
- Liu, H.; Shi, T.; Li, X. Research of 3–6 years old preschool children’s screen time status and influencing factors in Urumqi city Xinjiang. Mod. Prev. Med. 2018, 45, 1012–1015+1025. [Google Scholar]
- Zhao, J.; Zhang, Y.; Jiang, F.; Ip, P.; Ho, F.K.W.; Zhang, Y.; Huang, H. Excessive Screen Time and Psychosocial Well-Being: The Mediating Role of Body Mass Index, Sleep Duration, and Parent-Child Interaction. J. Pediatr. 2018, 202, 157–162. [Google Scholar] [CrossRef]
- Chai, J.; Cao, Y.; Yu, T.; Han, M.; Qian, Y.; Liu, X. Investigation on screen time of aged 3–6 years old in Beijing during the epidemic period of coronavirus disease 2019. Cap. J. Public Health 2020, 14, 4. [Google Scholar] [CrossRef]
- Lan, Q.-Y.; Chan, K.C.; Yu, K.N.; Chan, N.Y.; Wing, Y.K.; Li, A.M.; Au, C.T. Sleep duration in preschool children and impact of screen time. Sleep Med. 2020, 76, 48–54. [Google Scholar] [CrossRef] [PubMed]
- Hamer, M.; Stamatakis, E.; Mishra, G. Psychological distress, television viewing, and physical activity in children aged 4 to 12 years. Pediatrics 2009, 123, 1263–1268. [Google Scholar] [CrossRef]
- Schranz, N.K.; Olds, T.; Boyd, R.; Evans, J.; Gomersall, S.R.; Hardy, L.; Hesketh, K.; Lubans, D.R.; Ridgers, N.D.; Straker, L.; et al. Results from Australia’s 2016 Report Card on Physical Activity for Children and Youth. J. Phys. Act. Health 2016, 13, S87–S94. [Google Scholar] [CrossRef]
- Barnes, J.D.; Cameron, C.; Carson, V.; Chaput, J.-P.; Faulkner, G.E.J.; Janson, K.; Janssen, I.; Kramers, R.; LeBlanc, A.G.; Spence, J.C.; et al. Results from Canada’s 2016 ParticipACTION Report Card on Physical Activity for Children and Youth. J. Phys. Act. Health 2016, 13, S110–S116. [Google Scholar] [CrossRef] [PubMed]
- Parkes, A.; Sweeting, H.; Wight, D.; Henderson, M. Do television and electronic games predict children’s psychosocial adjustment? Longitudinal research using the UK Millennium Cohort Study. Arch. Dis. Child. 2013, 98, 341–348. [Google Scholar] [CrossRef] [PubMed]
- Nobre, J.N.P.; Santos, J.N.; Santos, L.R.; Guedes, S.d.C.; Pereira, L.; Costa, J.M.; Morais, R.L.d.S. Determining factors in children’s screen time in early childhood. Cien. Saude Colet. 2021, 26, 1127–1136. [Google Scholar] [CrossRef]
- Hoyos Cillero, I.; Jago, R. Systematic review of correlates of screen-viewing among young children. Prev. Med. 2010, 51, 3–10. [Google Scholar] [CrossRef]
- Xu, H.; Wen, L.M.; Rissel, C. Associations of parental influences with physical activity and screen time among young children: A systematic review. J. Obes. 2015, 2015, 546925. [Google Scholar] [CrossRef]
- Wu, C.S.T.; Fowler, C.; Lam, W.Y.Y.; Wong, H.T.; Wong, C.H.M.; Yuen Loke, A. Parenting approaches and digital technology use of preschool age children in a Chinese community. Ital. J. Pediatr. 2014, 40, 44. [Google Scholar] [CrossRef]
- Hinkley, T.; Salmon, J.; Okely, A.D.; Trost, S.G. Correlates of sedentary behaviours in preschool children: A review. Int. J. Behav. Nutr. Phys. Act. 2010, 7, 66. [Google Scholar] [CrossRef] [PubMed]
- Zhou, X.; Hua, L.; Zhang, M.; Wang, X.; Wang, S.; Zhang, H.; Qin, S.; Huang, X. Analyzing relationship between maternal feeding practice and fruit and vegetable intakes of preschoolers. Chin. J. Sch. Health 2018, 39, 35–37+41. [Google Scholar] [CrossRef]
- Fonseca, P.C.d.A.; Ribeiro, S.A.V.; Andreoli, C.S.; de Carvalho, C.A.; Pessoa, M.C.; de Novaes, J.F.; Priore, S.E.; Franceschini, S.d.C.C. Association of exclusive breastfeeding duration with consumption of ultra-processed foods, fruit and vegetables in Brazilian children. Eur. J. Nutr. 2019, 58, 2887–2894. [Google Scholar] [CrossRef] [PubMed]
- Guenther, P.M.; Dodd, K.W.; Reedy, J.; Krebs-Smith, S.M. Most Americans eat much less than recommended amounts of fruits and vegetables. J. Am. Diet. Assoc. 2006, 106, 1371–1379. [Google Scholar] [CrossRef] [PubMed]
- Lynch, C.; Kristjansdottir, A.G.; Te Velde, S.J.; Lien, N.; Roos, E.; Thorsdottir, I.; Krawinkel, M.; de Almeida, M.D.V.; Papadaki, A.; Hlastan Ribic, C.; et al. Fruit and vegetable consumption in a sample of 11-year-old children in ten European countries—The PRO GREENS cross-sectional survey. Public Health Nutr. 2014, 17, 2436–2444. [Google Scholar] [CrossRef] [PubMed]
- Fildes, A.; van Jaarsveld, C.H.M.; Cooke, L.; Wardle, J.; Llewellyn, C.H. Common genetic architecture underlying young children’s food fussiness and liking for vegetables and fruit. Am. J. Clin. Nutr. 2016, 103, 1099–1104. [Google Scholar] [CrossRef]
- Galloway, A.T.; Fiorito, L.; Lee, Y.; Birch, L.L. Parental pressure, dietary patterns, and weight status among girls who are “picky eaters”. J. Am. Diet. Assoc. 2005, 105, 541–548. [Google Scholar] [CrossRef]
- Birch, L.L. Development of food preferences. Annu. Rev. Nutr. 1999, 19, 41–62. [Google Scholar] [CrossRef]
- Miguel-Berges, M.L.; Santaliestra-Pasias, A.M.; Mouratidou, T.; Androutsos, O.; de Craemer, M.; Pinket, A.-S.; Birnbaum, J.; Koletzko, B.; Iotova, V.; Usheva, N.; et al. Associations between food and beverage consumption and different types of sedentary behaviours in European preschoolers: The ToyBox-study. Eur. J. Nutr. 2017, 56, 1939–1951. [Google Scholar] [CrossRef]
- Santaliestra-Pasías, A.M.; Dios, J.E.L.; Sprengeler, O.; Hebestreit, A.; De Henauw, S.; Eiben, G.; Felsö, R.; Lauria, F.; Tornaritis, M.; Veidebaum, T.; et al. Food and beverage intakes according to physical activity levels in European children: The IDEFICS (Identification and prevention of Dietary and lifestyle induced health Effects in Children and infants) study. Public Health Nutr. 2018, 21, 1717–1725. [Google Scholar] [CrossRef]
- Miguel-Berges, M.L.; Santaliestra-Pasias, A.M.; Mouratidou, T.; De Miguel-Etayo, P.; Androutsos, O.; De Craemer, M.; Galcheva, S.; Koletzko, B.; Kulaga, Z.; Manios, Y.; et al. Combined Longitudinal Effect of Physical Activity and Screen Time on Food and Beverage Consumption in European Preschool Children: The ToyBox-Study. Nutrients 2019, 11, 1048. [Google Scholar] [CrossRef]
- Krølner, R.; Rasmussen, M.; Brug, J.; Klepp, K.-I.; Wind, M.; Due, P. Determinants of fruit and vegetable consumption among children and adolescents: A review of the literature. Part II: Qualitative studies. Int. J. Behav. Nutr. Phys. Act. 2011, 8, 112. [Google Scholar] [CrossRef] [PubMed]
- Rasmussen, M.; Krølner, R.; Klepp, K.-I.; Lytle, L.; Brug, J.; Bere, E.; Due, P. Determinants of fruit and vegetable consumption among children and adolescents: A review of the literature. Part I: Quantitative studies. Int. J. Behav. Nutr. Phys. Act. 2006, 3, 22. [Google Scholar] [CrossRef] [PubMed]
- Hanbazaza, M.A.; Triador, L.; Ball, G.D.C.; Farmer, A.; Maximova, K.; Alexander First, N.; Willows, N.D. The Impact of School Gardening on Cree Children’s Knowledge and Attitudes toward Vegetables and Fruit. Can. J. Diet. Pr. Res. 2015, 76, 133–139. [Google Scholar] [CrossRef] [PubMed]
- Hutchinson, J.; Christian, M.S.; Evans, C.E.L.; Nykjaer, C.; Hancock, N.; Cade, J.E. Evaluation of the impact of school gardening interventions on children’s knowledge of and attitudes towards fruit and vegetables. A cluster randomised controlled trial. Appetite 2015, 91, 405–414. [Google Scholar] [CrossRef] [PubMed]
- Wang, L.; Martínez Steele, E.; Du, M.; Pomeranz, J.L.; O’Connor, L.E.; Herrick, K.A.; Luo, H.; Zhang, X.; Mozaffarian, D.; Zhang, F.F. Trends in Consumption of Ultraprocessed Foods Among US Youths Aged 2–19 Years, 1999–2018. JAMA 2021, 326, 519–530. [Google Scholar] [CrossRef]
- Zhao, W.; Liu, H.; Ma, P. Investigation of the Snack Consumption Behavior among 430 Preschool in Yinchuan. J. Ningxia Med. Univ. 2013, 35, 887–889. [Google Scholar] [CrossRef]
- Nickelson, J.; Lawrence, J.C.; Parton, J.M.; Knowlden, A.P.; McDermott, R.J. What proportion of preschool-aged children consume sweetened beverages? J. Sch. Health 2014, 84, 185–194. [Google Scholar] [CrossRef]
- Al-Dlaigan, Y.H.; Al-Meedania, L.A.; Anil, S. The influence of frequently consumed beverages and snacks on dental erosion among preschool children in Saudi Arabia. Nutr. J. 2017, 16, 80. [Google Scholar] [CrossRef]
- Min, K.; Wang, J.; Liao, W.; Astell-Burt, T.; Feng, X.; Cai, S.; Liu, Y.; Zhang, P.; Su, F.; Yang, K.; et al. Dietary patterns and their associations with overweight/obesity among preschool children in Dongcheng District of Beijing: A cross-sectional study. BMC Public Health 2021, 21, 223. [Google Scholar] [CrossRef]
- Xue, H.; Maguire, R.L.; Liu, J.; Kollins, S.H.; Murphy, S.K.; Hoyo, C.; Fuemmeler, B.F. Snacking frequency and dietary intake in toddlers and preschool children. Appetite 2019, 142, 104369. [Google Scholar] [CrossRef] [PubMed]
- Lissner, L.; Lanfer, A.; Gwozdz, W.; Olafsdottir, S.; Eiben, G.; Moreno, L.A.; Santaliestra-Pasías, A.M.; Kovács, E.; Barba, G.; Loit, H.-M.; et al. Television habits in relation to overweight, diet and taste preferences in European children: The IDEFICS study. Eur. J. Epidemiol. 2012, 27, 705–715. [Google Scholar] [CrossRef] [PubMed]
- Ghimire, N.; Rao, A. Comparative evaluation of the influence of television advertisements on children and caries prevalence. Glob. Health Action 2013, 6, 20066. [Google Scholar] [CrossRef] [PubMed]
- Kelly, B.; Halford, J.C.G.; Boyland, E.J.; Chapman, K.; Bautista-Castaño, I.; Berg, C.; Caroli, M.; Cook, B.; Coutinho, J.G.; Effertz, T.; et al. Television food advertising to children: A global perspective. Am. J. Public Health 2010, 100, 1730–1736. [Google Scholar] [CrossRef]
- Janssen, X.; Martin, A.; Hughes, A.R.; Hill, C.M.; Kotronoulas, G.; Hesketh, K.R. Associations of screen time, sedentary time and physical activity with sleep in under 5s: A systematic review and meta-analysis. Sleep Med. Rev. 2020, 49, 101226. [Google Scholar] [CrossRef]
- McDonald, L.; Wardle, J.; Llewellyn, C.H.; Johnson, L.; van Jaarsveld, C.H.M.; Syrad, H.; Fisher, A. Sleep and nighttime energy consumption in early childhood: A population-based cohort study. Pediatr. Obes. 2015, 10, 454–460. [Google Scholar] [CrossRef]
- Holmes, J.F.; St Laurent, C.W.; Spencer, R.M.C. Unhealthy Diet Is Associated with Poor Sleep in Preschool-Aged Children. J Genet. Psychol. 2021, 182, 289–303. [Google Scholar] [CrossRef]
- Yee, A.Z.H.; Lwin, M.O.; Ho, S.S. The influence of parental practices on child promotive and preventive food consumption behaviors: A systematic review and meta-analysis. Int. J. Behav. Nutr. Phys. Act. 2017, 14, 47. [Google Scholar] [CrossRef]
- Arredondo, E.M.; Elder, J.P.; Ayala, G.X.; Campbell, N.; Baquero, B.; Duerksen, S. Is parenting style related to children’s healthy eating and physical activity in Latino families? Health Educ. Res. 2006, 21, 862–871. [Google Scholar] [CrossRef]
- Haszard, J.J.; Skidmore, P.M.L.; Williams, S.M.; Taylor, R.W. Associations between parental feeding practices, problem food behaviours and dietary intake in New Zealand overweight children aged 4–8 years. Public Health Nutr. 2015, 18, 1036–1043. [Google Scholar] [CrossRef]
- Hennessy, E.; Hughes, S.O.; Goldberg, J.P.; Hyatt, R.R.; Economos, C.D. Permissive parental feeding behavior is associated with an increase in intake of low-nutrient-dense foods among American children living in rural communities. J. Acad. Nutr. Diet. 2012, 112, 142–148. [Google Scholar] [CrossRef] [PubMed]
- Sleddens, E.F.C.; Kremers, S.P.J.; De Vries, N.K.; Thijs, C. Relationship between parental feeding styles and eating behaviours of Dutch children aged 6–7. Appetite 2010, 54, 30–36. [Google Scholar] [CrossRef] [PubMed]
- Wang, L.; van de Gaar, V.M.; Jansen, W.; Mieloo, C.L.; van Grieken, A.; Raat, H. Feeding styles, parenting styles and snacking behaviour in children attending primary schools in multiethnic neighbourhoods: A cross-sectional study. BMJ Open 2017, 7, e015495. [Google Scholar] [CrossRef] [PubMed]
- Yang, Q.; Xi, Y.; Liu, H.; Luo, J.; Ouyang, Y.; Sun, M.; Yong, C.; Xiang, C.; Lin, Q. Free Sugars Intake among Chinese Adolescents and Its Association with Dental Caries: A Cross-Sectional Study. Nutrients 2021, 13, 765. [Google Scholar] [CrossRef] [PubMed]
- Malik, V.S.; Hu, F.B. Sugar-Sweetened Beverages and Cardiometabolic Health: An Update of the Evidence. Nutrients 2019, 11, 1840. [Google Scholar] [CrossRef]


| Variables | Total 1567 (100) | Screen Time | p | |
|---|---|---|---|---|
| <1 h/Day | ≥1 h/Day | |||
| 716 (45.7) | 851 (54.3) | |||
| Gender | 0.800 | |||
| Boys | 836 (53.4) | 379 (52.9) | 457 (53.7) | |
| Girls | 731 (46.6) | 337 (47.1) | 394 (46.3) | |
| Age | 0.776 | |||
| ≤4 years old | 843 (53.8) | 382 (53.4) | 461 (54.2) | |
| 4~5 years old | 431 (27.5) | 203 (28.4) | 228 (26.8) | |
| ≥5 years old | 293 (18.7) | 131 (18.3) | 162 (19.0) | |
| Only child | 0.672 | |||
| Yes | 605 (38.6) | 281 (39.2) | 324 (38.1) | |
| No | 962 (61.4) | 435 (60.8) | 527 (61.9) | |
| Nationality | 0.227 | |||
| Han | 1447 (92.3) | 668 (93.3) | 779 (91.5) | |
| Other | 120 (7.7) | 48 (6.7) | 72 (8.5) | |
| Residence | 0.142 | |||
| Urban | 1472 (93.9) | 680 (95.0) | 792 (93.1) | |
| Rural | 95 (6.1) | 36 (5.0) | 59 (6.9) | |
| Left children behind | 0.782 | |||
| None | 1480 (94.4) | 678 (94.7) | 802 (94.2) | |
| Left children behind | 87 (5.6) | 38 (5.3) | 49 (5.8) | |
| Weight status * | 0.095 | |||
| Underweight | 213 (13.6) | 96 (13.4) | 117 (13.7) | |
| Normal weight | 885 (56.5) | 424 (59.2) | 461 (54.2) | |
| Overweight | 236 (15.1) | 99 (13.8) | 137 (16.1) | |
| Obesity | 108 (6.9) | 40 (5.6) | 68 (8.0) | |
| Caregiver | 0.473 | |||
| Mother | 1392 (88.8) | 641 (89.5) | 751 (88.2) | |
| Father | 175 (11.2) | 75 (10.5) | 100 (11.8) | |
| Caregiver’s nationality | 0.104 | |||
| Han | 1487 (94.9) | 687 (95.9) | 800 (94.0) | |
| Other | 80 (5.1) | 29 (4.1) | 51 (6.0) | |
| Caregiver’s education | <0.001 | |||
| Junior high school or below | 50 (3.2) | 19 (2.7) | 31 (3.6) | |
| High school | 170 (10.8) | 51 (7.1) | 119 (14.0) | |
| College or above | 1347 (86.0) | 646 (90.2) | 701 (82.4) | |
| Food Categories | Total 1567 (100) | Child Age | p | Child Gender | p | |||
|---|---|---|---|---|---|---|---|---|
| ≤4 | 4~5 | ≥5 | Boys | Girls | ||||
| 843 (53.8) | 431 (27.5) | 293 (18.7) | 836 (53.4) | 731 (46.6) | ||||
| Vegetables | 0.124 | 0.816 | ||||||
| ≥1 time (s)/day | 1009 (64.4) | 548 (65.0) | 262 (60.8) | 199 (67.9) | 541 (64.7) | 468 (64.0) | ||
| <1 time (s)/day | 558 (35.6) | 295 (35.0) | 169 (39.2) | 94 (32.1) | 295 (35.3) | 263 (36.0) | ||
| Fruits | 0.742 | 1.000 | ||||||
| ≥1 time (s)/day | 902 (57.6) | 479 (56.8) | 249 (57.8) | 174 (59.4) | 481 (57.5) | 421 (57.6) | ||
| <1 time (s)/day | 665 (42.4) | 364 (43.2) | 182 (42.2) | 119 (40.6) | 355 (42.5) | 310 (42.4) | ||
| Snacks | 0.719 | 0.217 | ||||||
| ≤once/week | 254 (16.2) | 142 (16.8) | 65 (15.1) | 47 (16.0) | 145 (17.3) | 109 (14.9) | ||
| >once/week | 1313 (83.8) | 701 (83.2) | 366 (84.9) | 246 (84.0) | 691 (82.7) | 622 (85.1) | ||
| SSBs | 0.235 | 0.964 | ||||||
| ≤once/week | 1205 (76.9) | 662 (78.5) | 321 (74.5) | 222 (75.8) | 642 (76.8) | 563 (77.0) | ||
| >once/week | 362 (23.1) | 181 (21.5) | 110 (25.5) | 71 (24.2) | 194 (23.2) | 168 (23.0) | ||
| Variables | Vegetables (OR, 95% CI) | Fruits (OR, 95% CI) | Snacks (OR, 95% CI) | SSBs (OR, 95% CI) |
|---|---|---|---|---|
| Crude OR | ||||
| Screen time (<1 h/day = Ref) | ||||
| ≥1 h/day | 1.371 (1.112, 1.690) ** | 1.233 (1.008, 1.509) * | 1.403 (1.071, 1.836) * | 1.566 (1.230, 1.993) *** |
| Model 1 | ||||
| Screen time (<1 h = Ref) | ||||
| ≥1 h/day | 1.318 (1.061, 1.637) * | 1.210 (0.986, 1.486) | 1.406 (1.072, 1.844) * | 1.540(1.206, 1.967) ** |
| Model 2 | ||||
| Screen time (<1 h/day = Ref) | ||||
| ≥1 h/day | 1.259 (1.011, 1.568) * | 1.156 (0.939, 1.423) | 1.279 (0.969, 1.687) | 1.411 (1.098, 1.814) ** |
Publisher’s Note: MDPI stays neutral with regard to jurisdictional claims in published maps and institutional affiliations. |
© 2022 by the authors. Licensee MDPI, Basel, Switzerland. This article is an open access article distributed under the terms and conditions of the Creative Commons Attribution (CC BY) license (https://creativecommons.org/licenses/by/4.0/).
Share and Cite
Huo, J.; Kuang, X.; Xi, Y.; Xiang, C.; Yong, C.; Liang, J.; Zou, H.; Lin, Q. Screen Time and Its Association with Vegetables, Fruits, Snacks and Sugary Sweetened Beverages Intake among Chinese Preschool Children in Changsha, Hunan Province: A Cross-Sectional Study. Nutrients 2022, 14, 4086. https://doi.org/10.3390/nu14194086
Huo J, Kuang X, Xi Y, Xiang C, Yong C, Liang J, Zou H, Lin Q. Screen Time and Its Association with Vegetables, Fruits, Snacks and Sugary Sweetened Beverages Intake among Chinese Preschool Children in Changsha, Hunan Province: A Cross-Sectional Study. Nutrients. 2022; 14(19):4086. https://doi.org/10.3390/nu14194086
Chicago/Turabian StyleHuo, Jiaqi, Xiaoni Kuang, Yue Xi, Caihong Xiang, Cuiting Yong, Jiajing Liang, Hanshuang Zou, and Qian Lin. 2022. "Screen Time and Its Association with Vegetables, Fruits, Snacks and Sugary Sweetened Beverages Intake among Chinese Preschool Children in Changsha, Hunan Province: A Cross-Sectional Study" Nutrients 14, no. 19: 4086. https://doi.org/10.3390/nu14194086
APA StyleHuo, J., Kuang, X., Xi, Y., Xiang, C., Yong, C., Liang, J., Zou, H., & Lin, Q. (2022). Screen Time and Its Association with Vegetables, Fruits, Snacks and Sugary Sweetened Beverages Intake among Chinese Preschool Children in Changsha, Hunan Province: A Cross-Sectional Study. Nutrients, 14(19), 4086. https://doi.org/10.3390/nu14194086