
Predictors of Human Milk Fatty Acids and Associations with Infant Growth in a Norwegian Birth Cohort

 , , ,
, , ,
Abstract
1. Introduction
2. Materials and Methods
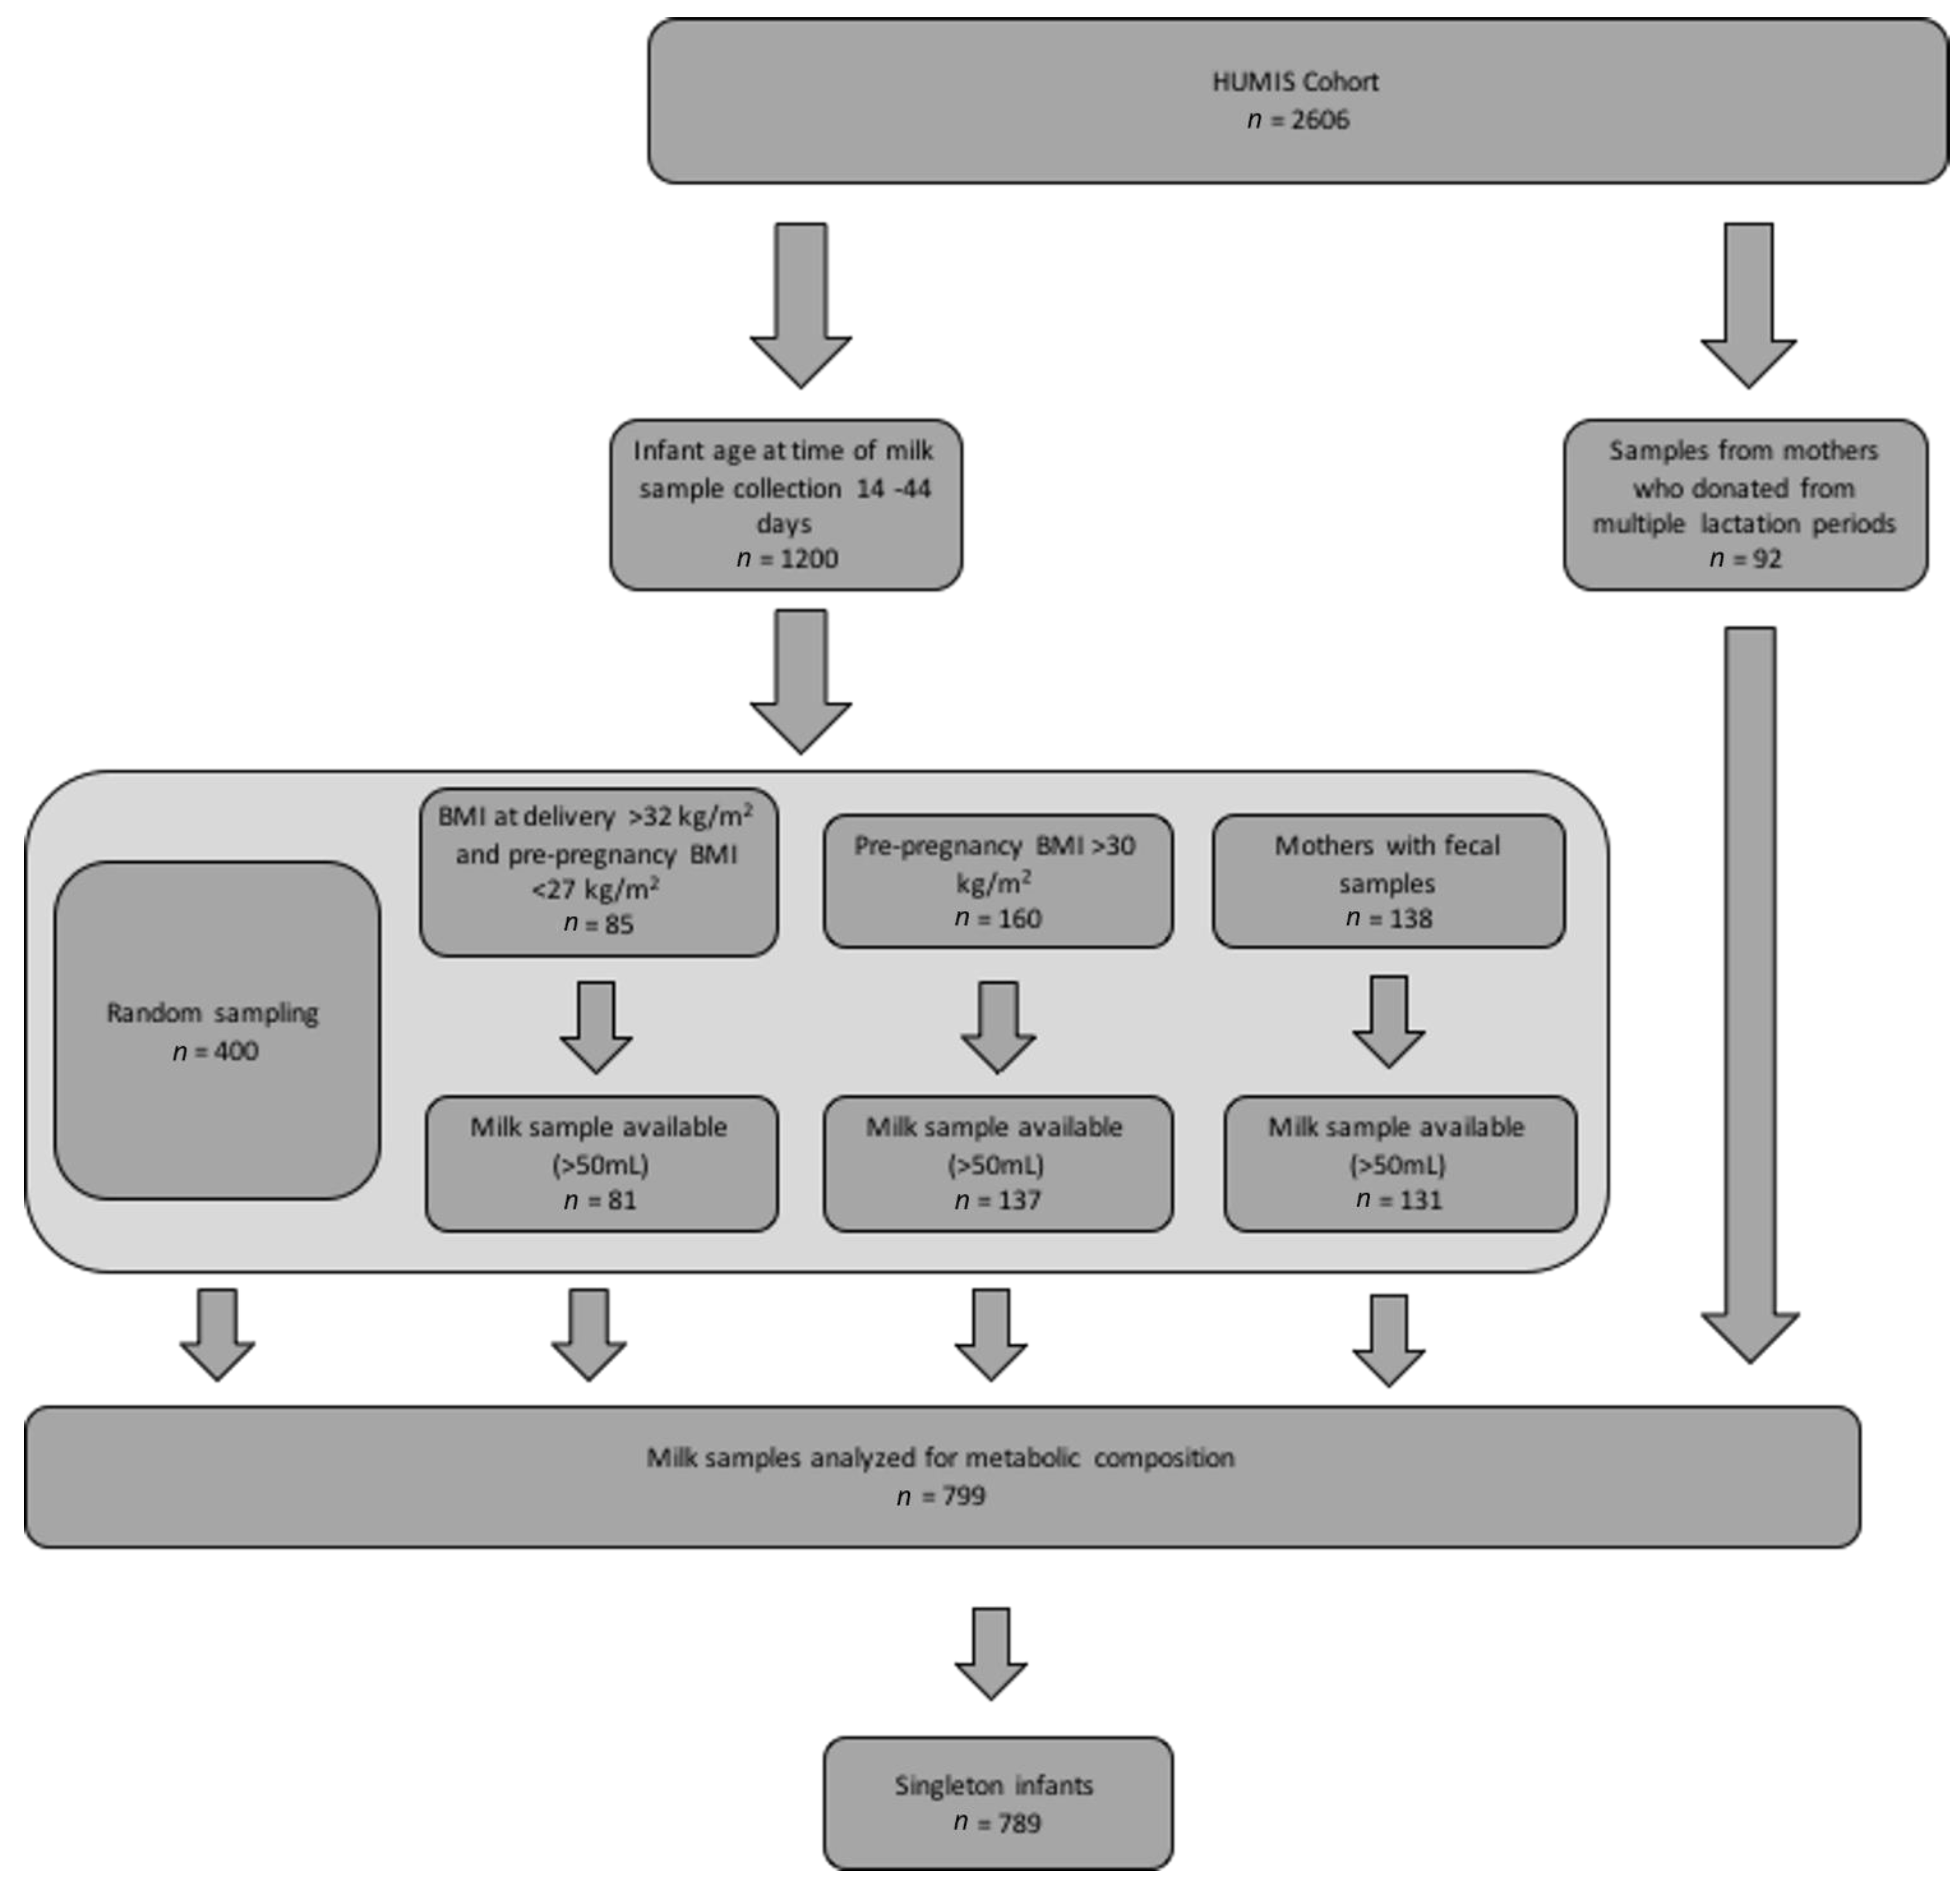
2.1. Study Population
2.2. TGFA Composition Analysis
2.3. Predictors of TGFA Composition
2.4. TGFA Associations with Infant Growth
2.5. Statistical Analysis
2.6. Sensitivity Analyses
3. Results
3.1. Study Population and Milk Composition
3.2. Associations between Predictors and Fatty Acid Composition
3.3. Associations between TGFA Composition and Infant Growth
4. Discussion
4.1. Medium-Chain Fatty Acids
4.2. Monounsaturated Fatty Acids
4.3. Polyunsaturated Fatty Acids
4.4. Strengths and Limitations
5. Conclusions
Supplementary Materials
Author Contributions
Funding
Institutional Review Board Statement
Informed Consent Statement
Data Availability Statement
Conflicts of Interest
References
- Prell, C.; Koletzko, B. Breastfeeding and complementary feeding. Dtsch. Arztebl. Int. 2016, 113, 435–444. [Google Scholar] [CrossRef] [PubMed]
- Koletzko, B. Human milk lipids. Ann. Nutr. Metab. 2016, 69 (Suppl. 2), 28–40. [Google Scholar] [CrossRef] [PubMed]
- Andreas, N.J.; Kampmann, B.; Mehring Le-Doare, K. Human breast milk: A review on its composition and bioactivity. Early Hum. Dev. 2015, 91, 629–635. [Google Scholar] [CrossRef] [PubMed]
- Clandinin, M.T.; Larsen, B.M. Docosahexaenoic acid is essential to development of critical functions in infants. J. Pediatr. 2010, 157, 875–876. [Google Scholar] [CrossRef] [PubMed]
- Fleith, M.; Clandinin, M.T. Dietary pufa for preterm and term infants: Review of clinical studies. Crit. Rev. Food Sci. Nutr. 2005, 45, 205–229. [Google Scholar] [CrossRef] [PubMed]
- Prentice, P.; Ong, K.K.; Schoemaker, M.H.; van Tol, E.A.; Vervoort, J.; Hughes, I.A.; Acerini, C.L.; Dunger, D.B. Breast milk nutrient content and infancy growth. Acta Paediatr. 2016, 105, 641–647. [Google Scholar] [CrossRef] [PubMed]
- Qawasmi, A.; Landeros-Weisenberger, A.; Bloch, M.H. Meta-analysis of lcpufa supplementation of infant formula and visual acuity. Pediatrics 2013, 131, e262–e272. [Google Scholar] [CrossRef]
- Steenweg-de Graaff, J.; Tiemeier, H.; Ghassabian, A.; Rijlaarsdam, J.; Jaddoe, V.W.; Verhulst, F.C.; Roza, S.J. Maternal fatty acid status during pregnancy and child autistic traits: The generation r study. Am. J. Epidemiol. 2016, 183, 792–799. [Google Scholar] [CrossRef]
- Steenweg-de Graaff, J.C.; Tiemeier, H.; Basten, M.G.; Rijlaarsdam, J.; Demmelmair, H.; Koletzko, B.; Hofman, A.; Jaddoe, V.W.; Verhulst, F.C.; Roza, S.J. Maternal lc-pufa status during pregnancy and child problem behavior: The generation r study. Pediatr. Res. 2015, 77, 489–497. [Google Scholar] [CrossRef]
- Vidakovic, A.; Gishti, O.; Graaff, J.S.-d.; Williams, M.; Duijts, L.; Felix, J.; Hodman, A.; Tiemeier, H.; Jaddoe, V.; Gaillard, R. Higher maternal plasma n-3 pufa and lower n-6 pufa concentrations in pregnancy are associated with lower childhood systolic blood pressure. J. Nutr. 2015, 145, 2362–2368. [Google Scholar] [CrossRef]
- Rucci, E.; den Dekker, H.T.; de Jongste, J.C.; Steenweg-de-Graaff, J.; Gaillard, R.; Pasmans, S.G.; Hofman, A.; Tiemeier, H.; Jaddoe, V.W.; Duijts, L. Maternal fatty acid levels during pregnancy, childhood lung function and atopic diseases. The generation r study. Clin. Exp. Allergy 2016, 46, 461–471. [Google Scholar] [CrossRef] [PubMed]
- George, A.D.; Gay, M.C.L.; Wlodek, M.E.; Murray, K.; Geddes, D.T. The fatty acid species and quantity consumed by the breastfed infant are important for growth and development. Nutrients 2021, 13, 4183. [Google Scholar] [CrossRef] [PubMed]
- Gillman, M.W. The first months of life: A critical period for development of obesity. Am. J. Clin. Nutr. 2008, 87, 1587–1589. [Google Scholar] [CrossRef] [PubMed]
- Sengupta, N.; Gerard, P.D.; Baldwin, W.S. Perturbations in polar lipids, starvation survival and reproduction following exposure to unsaturated fatty acids or environmental toxicants in daphnia magna. Chemosphere 2016, 144, 2302–2311. [Google Scholar] [CrossRef]
- Al-Tamer, Y.Y.; Mahmood, A.A. The influence of iraqi mothers’ socioeconomic status on their milk-lipid content. Eur. J. Clin. Nutr. 2006, 60, 1400–1405. [Google Scholar] [CrossRef][Green Version]
- Antonakou, A.; Skenderi, K.P.; Chiou, A.; Anastasiou, C.A.; Bakoula, C.; Matalas, A.L. Breast milk fat concentration and fatty acid pattern during the first six months in exclusively breastfeeding greek women. Eur. J. Nutr. 2013, 52, 963–973. [Google Scholar] [CrossRef]
- Argov-Argaman, N.; Mandel, D.; Lubetzky, R.; Hausman Kedem, M.; Cohen, B.C.; Berkovitz, Z.; Reifen, R. Human milk fatty acids composition is affected by maternal age. J. Matern. Fetal Neonatal Med. 2017, 30, 34–37. [Google Scholar] [CrossRef]
- Genzel-Boroviczényy, O.; Wahle, J.; Koletzko, B. Fatty acid composition of human milk during the first month after term and preterm delivery. Eur. J. Pediatr. 1997, 156, 142–147. [Google Scholar] [CrossRef]
- Krešić, G.; Dujmović, M.; Mandić, M.L.; Delaš, I. Relationship between mediterranean diet and breast milk fatty acid profile: A study in breastfeeding women in croatia. Dairy Sci. Technol. 2013, 93, 287–301. [Google Scholar] [CrossRef]
- Kumar, H.; du Toit, E.; Kulkarni, A.; Aakko, J.; Linderborg, K.M.; Zhang, Y.; Nicol, M.P.; Isolauri, E.; Yang, B.; Collado, M.C.; et al. Distinct patterns in human milk microbiota and fatty acid profiles across specific geographic locations. Front. Microbiol. 2016, 7, 1619. [Google Scholar] [CrossRef]
- Nasser, R.; Stephen, A.M.; Goh, Y.K.; Clandinin, M.T. The effect of a controlled manipulation of maternal dietary fat intake on medium and long chain fatty acids in human breast milk in saskatoon, canada. Int. Breastfeed. J. 2010, 5, 3. [Google Scholar] [CrossRef] [PubMed]
- Nayak, U.; Kanungo, S.; Zhang, D.; Ross Colgate, E.; Carmolli, M.P.; Dey, A.; Alam, M.; Manna, B.; Nandy, R.K.; Kim, D.R.; et al. Influence of maternal and socioeconomic factors on breast milk fatty acid composition in urban, low-income families. Matern. Child. Nutr. 2017, 13, e12423. [Google Scholar] [CrossRef] [PubMed]
- Prentice, A.; Jarjou, L.; Drury, P.; Dewit, O.; Crawford, M. Breast-milk fatty acids of rural gambian mothers: Effects of diet and maternal parity. J. Pediatric Gastroenterol. 1989, 8, 486–490. [Google Scholar] [CrossRef]
- Quinn, E.A.; Kuzawa, C.W. A dose-response relationship between fish consumption and human milk dha content among filipino women in cebu city, philippines. Acta Paediatr. 2012, 101, e439–e445. [Google Scholar] [CrossRef]
- Samur, G.; Topcu, A.; Turan, S. Trans fatty acids and fatty acid composition of mature breast milk in turkish women and their association with maternal diet’s. Lipids 2009, 44, 405–413. [Google Scholar] [CrossRef]
- Weseler, A.R.; Dirix, C.E.; Bruins, M.J.; Hornstra, G. Dietary arachidonic acid dose-dependently increases the arachidonic acid concentration in human milk. J. Nutr. 2008, 138, 2190–2197. [Google Scholar] [CrossRef] [PubMed]
- Brenna, J.; Varamini, B.; Jensen, R.; Diersen-Schade, D.; Boettcher, J.; Arterburn, L. Docosahexaenoic and arachidonic acid concentrations in human breast milk worldwide. Am. J. Clin. Nutr. 2007, 85, 1457–1464. [Google Scholar] [CrossRef] [PubMed]
- Butts, C.A.; Hedderley, D.I.; Herath, T.D.; Paturi, G.; Glyn-Jones, S.; Wiens, F.; Stahl, B.; Gopal, P. Human milk composition and dietary intakes of breastfeeding women of different ethnicity from the manawatu-wanganui region of new zealand. Nutrients 2018, 10, 1231. [Google Scholar] [CrossRef]
- Barrera, C.; Valenzuela, R.; Chamorro, R.; Bascunan, K.; Sandoval, J.; Sabag, N.; Valenzuela, F.; Valencia, M.-P.; Puigrredon, C.; Valenzuela, A. The impact of maternal diet during pregnancy and lactation on the fatty acid composition of erythrocytes and breast milk of chilean women. Nutrients 2018, 10, 839. [Google Scholar] [CrossRef]
- Miliku, K.; Duan, Q.L.; Moraes, T.J.; Becker, A.B.; Mandhane, P.J.; Turvey, S.E.; Lefebvre, D.L.; Sears, M.R.; Subbarao, P.; Field, C.J.; et al. Human milk fatty acid composition is associated with dietary, genetic, sociodemographic, and environmental factors in the child cohort study. Am. J. Clin. Nutr. 2019, 110, 1370–1383. [Google Scholar] [CrossRef]
- Armand, M.; Bernard, J.Y.; Forhan, A.; Heude, B.; Charles, M.A.; Annesi-Maesano, I.; Botton, J.; Dargent-Molina, P.; de Lauzon-Guillain, B.; Ducimetière, P.; et al. Maternal nutritonal determinants of colostrum fatty acids in the eden mother-child cohort. Clin. Nutr. 2018, 37, 2127–2136. [Google Scholar] [CrossRef] [PubMed]
- de la Garza Puentes, A.; Martí Alemany, A.; Chisaguano, A.M.; Montes Goyanes, R.; Castellote, A.I.; Torres-Espínola, F.J.; García-Valdés, L.; Escudero-Marín, M.; Segura, M.T.; Campoy, C.; et al. The effect of maternal obesity on breast milk fatty acids and its association with infant growth and cognition-the preobe follow-up. Nutrients 2019, 11, 2154. [Google Scholar] [CrossRef] [PubMed]
- Siziba, L.P.; Lorenz, L.; Brenner, H.; Carr, P.; Stahl, B.; Mank, M.; Marosvölgyi, T.; Decsi, T.; Szabó, É.; Rothenbacher, D.; et al. Changes in human milk fatty acid composition and maternal lifestyle-related factors over a decade: A comparison between the two ulm birth cohort studies. Br. J. Nutr. 2021, 126, 228–235. [Google Scholar] [CrossRef] [PubMed]
- Eggesbø, M.; Stigum, H.; Longnecker, M.P.; Polder, A.; Aldrin, M.; Basso, O.; Thomsen, C.; Skaare, J.U.; Becher, G.; Magnus, P. Levels of hexachlorobenzene (hcb) in breast milk in relation to birth weight in a norwegian cohort. Environ. Res. 2009, 109, 559–566. [Google Scholar] [CrossRef] [PubMed]
- Eggesbo, M.; Thomsen, C.; Jorgensen, J.V.; Becher, G.; Odland, J.O.; Longnecker, M.P. Associations between brominated flame retardants in human milk and thyroid-stimulating hormone (tsh) in neonates. Environ. Res. 2011, 111, 737–743. [Google Scholar] [CrossRef]
- Lenters, V.; Iszatt, N.; Forns, J.; Čechová, E.; Kočan, A.; Legler, J.; Leonards, P.; Stigum, H.; Eggesbø, M. Early-life exposure to persistent organic pollutants (ocps, pbdes, pcbs, pfass) and attention-deficit/hyperactivity disorder: A multi-pollutant analysis of a norwegian birth cohort. Environ. Int. 2019, 125, 33–42. [Google Scholar] [CrossRef]
- Levels of Pcbs, Pcdds, and Pcdfs in Breast Milk; WHO Regional Office for Europe: Copenhagen, Denmark, 1989.
- World Health Organization. Global Database on Child Growth and Malnutrition: Description: Cut off Points and Summary Statistics. Available online: http://www.who.int/nutgrowthdb/about/introduction/en/index5.html (accessed on 30 July 2022).
- Ahmed, T.B.; Eggesbo, M.; Criswell, R.; Uhl, O.; Demmelmair, H.; Koletzko, B. Total fatty acid and polar lipid species composition of human milk. Nutrients 2021, 14, 158. [Google Scholar] [CrossRef]
- Stimming, M.; Mesch, C.M.; Kersting, M.; Kalhoff, H.; Demmelmair, H.; Koletzko, B.; Schmidt, A.; Bohm, V.; Libuda, L. Vitamin e content and estimated need in german infant and follow-on formulas with and without long-chain polyunsaturated fatty acids (lc-pufa) enrichment. J. Agric. Food Chem. 2014, 62, 10153–10161. [Google Scholar] [CrossRef]
- Gianni, M.L.; Roggero, P.; Baudry, C.; Fressange-Mazda, C.; Galli, C.; Agostoni, C.; Ruyet, P.l.; Mosca, F. An infant formula containing dairy lipids increased red blood cell membrane omega 3 fatty acids in 4 month-old healthy newborns: A randomized controlled trial. BMC Pediatrics 2018, 18, 53. [Google Scholar] [CrossRef]
- Suburu, J.; Shi, L.; Wu, J.; Wang, S.; Samuel, M.; Thomas, M.J.; Kock, N.D.; Yang, G.; Kridel, S.; Chen, Y.Q. Fatty acid synthase is required for mammary gland development and milk production during lactation. Am. J. Physiol. Endocrinol. Metab. 2014, 306, E1132–E1143. [Google Scholar] [CrossRef]
- Bachour, P.; Yafawi, R.; Jaber, F.; Choueiri, E.; Abdel-Razzak, Z. Effects of smoking, mother’s age, body mass index, and parity number on lipid, protein, and secretory immunoglobulin a concentrations of human milk. Breastfeed. Med. 2012, 7, 179–188. [Google Scholar] [CrossRef] [PubMed]
- Grote, V.; Verducci, E.; Scaglioni, S.; Vecchi, F.; Contarini, G.; Giovannini, M.; Koletzko, B.; Agostoni, C. Breast milk composition and infant nutrient intakes during the first 12 months of life. Eur. J. Clin. Nutr. 2016, 70, 250–256. [Google Scholar] [CrossRef] [PubMed]
- Hahn, W.H.; Song, J.H.; Song, S.; Kang, N.M. Do gender and birth height of infant affect calorie of human milk? An association study between human milk macronutrient and various birth factors. J. Matern. Fetal Neonatal Med. 2016, 30, 1608–1612. [Google Scholar] [CrossRef] [PubMed]
- Michaelsen, K.F. Nutrition and growth during infancy: The copenhagen study. Acta Paediatr. 1997, 420, 1–36. [Google Scholar] [CrossRef]
- Nommsen, L.A.; Lovelady, C.A.; Heinig, M.J.; Lonnerdal, B.; Dewey, K.G. Determinants of energy, protein, lipid, and lactose concentrations in human milk during the first 12 months of lactation: The darling study. Am. J. Clin. Nutr. 1991, 53, 457–465. [Google Scholar] [CrossRef]
- van den Ham, E.C.; van Houwelingen, A.C.; Hornstra, G. Evaluation of the relation between n-3 and n-6 fattya cid status and parity in nonpregnant women from the netherlands. Am. J. Clin. Nutr. 2001, 73, 622–627. [Google Scholar] [CrossRef]
- World Health Organization. Available online: http://apps.who.int/bmi/index.jsp?introPage=intro_3.html (accessed on 30 July 2022).
- American College of Obstetricians and Gynecologists. Committee Opinion: Weight Gain during Pregnancy. Available online: http://www.acog.org/Resources-And-Publications/Committee-Opinions/Committee-on-Obstetric-Practice/Weight-Gain-During-Pregnancy (accessed on 30 July 2022).
- Textor, J.; Hardt, J.; Knüppel, S. Dagitty: A graphical tool for analyzing causal diagrams. Epidemiology 2011, 22, 745. [Google Scholar] [CrossRef]
- Iszatt, N.; Stigum, H.; Verner, M.A.; White, R.A.; Govarts, E.; Murinova, L.P.; Schoeters, G.; Trnovec, T.; Legler, J.; Pele, F.; et al. Prenatal and postnatal exposure to persistent organic pollutants and infant growth: A pooled analysis of seven european birth cohorts. Environ. Health Perspect. 2015, 123, 730–736. [Google Scholar] [CrossRef]
- Iszatt, N.; Stigum, H.; Govarts, E.; Murinova, L.P.; Schoeters, G.; Trnovec, T.; Legler, J.; Thomsen, C.; Koppen, G.; Eggesbo, M. Perinatal exposure to dioxins and dioxin-like compounds and infant growth and body mass index at seven years: A pooled analysis of three european birth cohorts. Environ. Int. 2016, 94, 399–407. [Google Scholar] [CrossRef]
- Koletzko, B.; Chourdakis, M.; Grote, V.; Hellmuth, C.; Prell, C.; Rzehak, P.; Uhl, O.; Weber, M. Regulation of early human growth: Impact on long-term health. Ann. Nutr. Metab. 2014, 65, 101–109. [Google Scholar] [CrossRef]
- Monteiro, P.; Victoria, C. Rapid growth in infancy and childhood and obesity in later life-a systematic review. Obes. Rev. 2005, 6, 143–154. [Google Scholar] [CrossRef] [PubMed]
- Rubin, D. Multiple Imputation for Nonresponse in Surveys; John Wiley & Sons, Inc.: New York, NY, USA, 1987. [Google Scholar]
- Lampl, M.; Mummert, A.; Schoen, M. Promoting healthy growth or feeding obesity? The need for evidence-based oversight of infant nutritional supplement claims. Healthcare 2016, 4, 84. [Google Scholar] [CrossRef] [PubMed]
- Rioux, V.; Pedrono, F.; Legrande, P. Regulation of mammalian desaturases by myristic acid: N-terminal myristoylation and other modulations. Biochim. Et Biophys. Acta 2010, 1811, 1–8. [Google Scholar] [CrossRef]
- Temme, E.H.M.; Mensink, R.P.; Hornstra, G. Effects of medium chain fatty acids (mcfa), myristic acid, and oleic acid on serum lipoproteins in healthy subjects. J. Lipid Res. 1997, 38, 1746–1754. [Google Scholar] [CrossRef]
- Yuan, T.; Wang, L.; Jin, J.; Mi, L.; Pang, J.; Liu, Z.; Gong, J.; Sun, C.; Li, J.; Wei, W.; et al. Role medium-chain fatty acids in the lipid metabolism of infants. Front. Nutr. 2022, 9, 804880. [Google Scholar] [CrossRef] [PubMed]
- Schonfeld, P.; Wojtczak, L. Short- and medium-chain fatty acids in energy metabolism: The cellular perspective. J. Lipid Res. 2016, 57, 943–954. [Google Scholar] [CrossRef]
- Visentin, S.; Crotti, S.; Donazzolo, E.; S’Arocono, S.; Nitti, D.; Cosmi, E.; Agostini, M. Medium chain fatty acids in intrauterine growth restricted and small for gestational age pregnancies. Metabolomics 2017, 13, 54. [Google Scholar] [CrossRef]
- Mumme, K.; Stonehouse, W. Effects of medium-chain triglycerides on weight loss and body composition: A meta-analysis of randomized controlled trials. J. Acad. Nutr. Diet. 2014, 115, 249–263. [Google Scholar] [CrossRef]
- Gunasekaran, R.; Shaker, M.R.; Mohd-Zin, S.W.; Abdullah, A.; Annuar, A.; Abdul-Aziz, N.M. Maternal intake of dietary virgin coconut oil modifies essential fatty acids and causes low body weight and spiky fur in mice. BMC Complementary Altern. Med. 2017, 17, 79. [Google Scholar] [CrossRef]
- Warensjo, E.; Ohrvall, M.; Vessby, B. Fatty acid composition and estimated desaturase activities are associated with obesity and lifestyle variables in men and women. Nutr. Metab. Cardiovasc. Dis. 2006, 16, 128–136. [Google Scholar] [CrossRef]
- Rauschert, S.; Uhl, O.; Koletzko, B.; Kirchberg, F.; Mori, T.A.; Huang, R.C.; Beilin, L.J.; Hellmuth, C.; Oddy, W.H. Lipidomics reveals associations of phospholipids with obesity and insulin resistance in young adults. J. Clin. Endocrinol. Metab. 2016, 101, 871–879. [Google Scholar] [CrossRef] [PubMed]
- Warensjo, E.; Riserus, U.; Vessby, B. Fatty acid composition of serum lipids predicts the development of the metabolic syndrome in men. Diabetologia 2005, 48, 1999–2005. [Google Scholar] [CrossRef] [PubMed]
- Sauerwald, T.; Demmelmair, H.; Koletzko, B. Polyunsaturated fatty acid supply with human milk. Lipids 2001, 36, 991–996. [Google Scholar] [CrossRef]
- Yee, J.K.; Lee, W.-N.P.; Han, G.; Ross, M.G.; Desai, M. Organ-specific alterations in fatty acid de novo synthesis and desaturation in a rat model of programmed obesity. Lipids Health Dis. 2011, 10, 72. [Google Scholar] [CrossRef] [PubMed]
- Ruager-Martin, R.; Hyde, M.J.; Modi, N. Maternal obesity and infant outcomes. Early Hum. Dev. 2010, 86, 715–722. [Google Scholar] [CrossRef] [PubMed]
- Li, R.; Fein, S.; Grummer-Strawn, L. Do infants fed from bottles lack self-regulation of milk intake compared with directly breastfed infants? Pediatrics 2010, 125, e1386–e1393. [Google Scholar] [CrossRef]
- Cao, H.; Gerhold, K.; Mayers, J.R.; Wiest, M.M.; Watkins, S.M.; Hotamisligil, G.S. Identification of a lipokine, a lipid hormone linking adipose tissue to systemic metabolism. Cerll 2008, 134, 933–944. [Google Scholar] [CrossRef]
- Frigolet, M.E.; Gutierrez-Aguilar, R. The role of the novel lipokine palmitoleic acid in health and disease. Adv. Nutr. 2017, 8, 173S–181S. [Google Scholar] [CrossRef]
- eAcademy, E.N. Lc-pufas in pregnancy and lactation. In Chemistry, Metabolism, and Biological Action; Ludwig-Maximillian University of Munich: Munich, Germany, 2016. [Google Scholar]
- Ballard, O.; Morrow, A.L. Human milk composition: Nutrients and bioactive factors. Pediatric Clin. North Am. 2013, 60, 49–74. [Google Scholar] [CrossRef]
- Helland, I.B.; Saugstad, O.D.; Smith, L.; Saarem, K.; Solvoll, K.; Ganes, T.; Drevon, C.A. Similar effects on infants of n-3 and n-6 fatty acid supplementation to pregnant and lactating women. Pediatrics 2001, 108, e82. [Google Scholar] [CrossRef]
- La Merrill, M.; Birnbaum, L.S. Childhood obesity and environmental chemicals. Mt. Sinai J. Med. 2011, 78, 22–48. [Google Scholar] [CrossRef]
- Tang-Peronard, J.L.; Andersen, H.R.; Jensen, T.K.; Heitmann, B.L. Endocrine-disrupting chemicals and obesity development in humans: A review. Obes. Rev. 2011, 12, 622–636. [Google Scholar] [CrossRef]
- Criswell, R.; Lenters, V.; Mandal, S.; Stigum, H.; Iszatt, N.; Eggesbø, M. Persistent environmental toxicants in breast milk and rapid infant growth. Ann. Nutr. Metab. 2017, 70, 210–216. [Google Scholar] [CrossRef] [PubMed]
- Grandjean, P.; Landrigan, P. Neurobehavioral effects of developmental toxicity. Lancet Neurol. 2014, 13, 330–338. [Google Scholar] [CrossRef]
- Lindholm, E.S.; Strandvik, B.; Altman, D.; Moller, A.; Kilander, C.P. Different fatty acid pattern in bresat milk of obese compared to normal weight mothers. Prostaglandins Leukot. Essent. Fat. Acids 2013, 88, 211–217. [Google Scholar] [CrossRef] [PubMed]
- Wong, V.W.-S.; Ng, Y.-F.; Chan, S.-M.; Su, Y.-X.; Kwok, K.W.-H.; Chan, H.-M.; Cheung, C.-L.; Lee, H.-W.; Pak, W.-Y.; Li, S.-Y.; et al. Positive relationship between consumption of specific fish type and n-3 pufa in milk of hong kong lactating mothers. Br. J. Nutr. 2019, 121, 1431–1440. [Google Scholar] [CrossRef]
- Giuffrida, F.; Fleith, M.; Goyer, A.; Samuel, T.M.; Elmelegy-Masserey, I.; Fontannaz, P.; Cruz-Hernandez, C.; Thakkar, S.K.; Monnard, C.; De Castro, C.A.; et al. Human milk fatty acid composition and its association with maternal blood and adipose tissue fatty acid content in a cohort of women from europe. Eur. J. Nutr. 2022, 61, 2167–2182. [Google Scholar] [CrossRef]
- Al, M.D.M.; Houwelingen, A.V.; Hornstra, G. Relation between birth order and the maternal and neonatal docohexaenoic acid status. Eur. J. Clin. Nutr. 1997, 51, 548–553. [Google Scholar] [CrossRef]
- Al, M.D.; Van Houwelingen, A.C.; Kester, A.D.; Hasaart, T.H.; De Jong, A.E.; Hornstra, G. Maternal essential fatty acid patterns during normal pregnancy and their relationship to the neonatal essential fatty acid status. Br. J. Nutr. 1995, 74, 55–68. [Google Scholar] [CrossRef]
- Obesity Update; OECD: Paris, France, 2017; pp. 1–12. Available online: https://www.oecd.org/health/health-systems/Obesity-Update-2017.pdf (accessed on 30 July 2022).
- Yuhas, R.; Pramuk, K.; Lien, E.L. Human milk fatty acid composition from nine countries varies most in dha. Lipids 2009, 41, 851–859. [Google Scholar] [CrossRef]
- Koletzko, B.; Thiel, I.; Abiodun, P. The fatty acid composition of human milk in europe and africa. J. Pediatr. 1992, 120, S62–S70. [Google Scholar] [CrossRef]


| Category | TGFAs in Each Category |
|---|---|
| Saturated fatty acids (SFA) 2 | C8:0, C10:0, C12:0, C13:0, C14:0, C15:0, C16:0, C17:0, C18:0, C22:0 |
| Medium chain fatty acids (MCFA) | C8:0, C10:0, C12:0, C14:0 3 |
| Polyunsaturated fatty acids (PUFA) | C18:3n-3, C20:3n-3, C20:5n-3, C22:5n-3, C22:6n-3 C18:2n-6, C18:3n-6, C20:2n-6 4, C20:3n-6, C20:4n-6, C22:4n-6, C22:5n-6 C20:3n-9 |
| N-3 PUFA | C18:3n-3, C20:3n-3, C20:5n-3 C22:5n-3, C22:6n-3 |
| N-6 PUFA | C18:2n-6, C18:3n-6 C20:2n-6, C20:3n-6, C20:4n-6 C22:4n-6, C22:5n-6 |
| Long chain PUFA (LC-PUFA) | C20:3n-3, C20:3n-6, C20:3n-9, C20:4n-6, C20:5n-5 C22:4n-6, C22:5n-6, C22:5n-3, C22:6n-3 |
| Monounsaturated fatty acids (MUFA) | C14:1, C15:1, C16:1n-7, C18:1n-9, C18:1n-7, C20:1n-9 |
| Trans fatty acids | C16:1t, C18:1t, C22:1t |
| Maternal or Infant Characteristic | N (%) or Median (IQR) | Missing |
|---|---|---|
| Pre-pregnancy body mass index (kg/m2) | 24.0 (21.6–27.5) | 28 |
| Underweight (<18.5) | 34 (4.5) | |
| Normal weight (18.5–24.9) | 411 (54.0) | |
| Overweight (25–29.9) | 210 (27.6) | |
| Obese (>30) | 106 (13.9) | |
| Gestational weight gain (kg) | 15.0 (11.0–18.5) | 33 |
| Excess weight gain in pregnancy 1 | 38 | |
| No | 323 (43.0) | |
| Yes | 428 (57.0) | |
| Maternal age at pregnancy start (years) | 30.0 (26.0–33.0) | 0 |
| Parity | 20 | |
| Primiparous | 306 (39.8) | |
| Multiparous | 463 (60.2) | |
| Smoking 2 | 162 | |
| Never/former smoker | 554 (88.4) | |
| Current smoker | 73 (11.6) | |
| Education | 8 | |
| <12 years | 71 (9.1) | |
| 12 years | 105 (13.4) | |
| >12 years | 605 (77.5) | |
| Total fatty fish dinners in one year (servings) | 17.1 (7.1–36.0) | 58 |
| Total cod liver oil intake in one year (servings) | 52 (0–364) | 45 |
| Gestational age (days) | 282 (275–288) | 3 |
| Infant birthweight (g) | 3670 (3280–4030) | 0 |
| Delivery mode | 0 | |
| Vaginal delivery | 667 (84.5) | |
| Cesarean section | 122 (15.5) | |
| Infant age at milk collection (days) | 31 (25–36) | 101 |
| Formula introduced at time of milk collection | 128 | |
| No | 603 (91.2) | |
| Yes | 58 (8.8) |
| Fatty Acid | Absolute Concentration (g/L) | Percent of Total Fatty Acid Content (%) | |
|---|---|---|---|
| Median (IQR) | Median (IQR) | ||
| Saturated fatty acids | 10.91 (8.40–13.92) | 47.0 (44.6–49.5) | |
| C8:0 1 | Caprylic acid | 0.08 (0.06–0.09) | 0.3 (0.3–0.4) |
| C10:0 1 | Capric acid | 0.37 (0.27–0.48) | 1.6 (1.4–1.9) |
| C12:0 1 | Lauric acid | 1.36 (0.93–1.78) | 5.8 (4.7–6.9) |
| C13:0 | Tridecanoic acid | 0.02 (0.02–0.03) | 0.1 (0.1–0.1) |
| C14:0 1 | Myristic acid | 1.36 (0.98–1.81) | 5.9 (5.0–6.9) |
| C15:0 | Pentadecanoic acid | 0.08 (0.06–0.10) | 0.4 (0.3–0.4) |
| C16:0 | Palmitic acid | 5.37 (4.11–6.82) | 23.1 (22.0–24.2) |
| C17:0 | Margaric acid | 0.07 (0.05–0.09) | 0.3 (0.3–0.3) |
| C18:0 | Stearic acid | 2.10 (1.61–2.68) | 9.1 (8.4–9.9) |
| C22:0 | Behenic acid | 0.04 (0.03–0.04) | 0.2 (0.1–0.2) |
| Monounsaturated fatty acids | 8.60 (6.39–10.81) | 36.7 (34.8–38.7) | |
| C14:1 | Myristoleic acid | 0.06 (0.04–0.08) | 0.3 (0.2–0.3) |
| C15:1 | Pentadecanoic acid | 0.02 (0.01–0.02) | 0.1 (0.1–0.1) |
| C16:1n-7 | Palmitoleate | 0.53 (0.38–0.75) | 2.4 (2.0–2.9) |
| C18:1n-9 | Oleic acid | 7.42 (5.57–9.35) | 31.8 (30.1–33.6) |
| C18:1n-7 | Cis-vaccenic acid | 0.38 (0.28–0.48) | 1.6 (1.5–1.8) |
| C20:1n-9 | Eicosenoic acid | 0.11 (0.08–0.14) | 0.4 (0.4–0.5) |
| Trans fatty acids | 0.13 (0.10–0.19) | 0.6 (0.5–0.7) | |
| C16:1t | Palmitoleic acid | 0.02 (0.01–0.03) | 0.1 (0.1–0.1) |
| C18:1t | Elaidic acid | 0.09 (0.06–0.13) | 0.4 (0.3–0.5) |
| C22:1t | Erucic acid | 0.02 (0.01–0.03) | 0.1 (0.1–0.1) |
| Polyunsaturated fatty acids | 3.59 (2.66–4.53) | 15.4 (13.6–17.4) | |
| C20:3n-9 2 | Mead acid | <0.01 (<0.01–0.01) | <0.1 (<0.1–<0.1) |
| N-3 polyunsaturated fatty acids | 0.39 (0.29–0.52) | 1.7 (1.4–2.1) | |
| C18:3n-3 | Alpha-linoleic acid | 0.24 (0.18–0.31) | 1.0 (0.9–1.2) |
| C20:3n-3 2 | Eicosatrienoic acid | 0.01 (0.01–0.01) | 0.1 (<0.1–0.1) |
| C20:5n-3 2 | Eicosapentaenoic acid | 0.02 (0.01–0.03) | 0.1 (0.1–0.1) |
| C22:5n-3 2 | Docosapentaenoic acid | 0.04 (0.03–0.05) | 0.2 (0.1–0.2) |
| C22:6n-3 2 | Docosahexaenoic acid | 0.08 (0.05–0.12) | 0.3 (0.2–0.5) |
| N-6 polyunsaturated fatty acids | 3.18 (2.34–4.00) | 13.7 (11.8–15.4) | |
| C18:2n-6 | Linoleic acid | 2.83 (2.09–3.61) | 12.2 (10.5–13.9) |
| C18:3n-6 | Gamma-linoleic acid | 0.03 (0.02–0.04) | 0.1 (0.1–0.2) |
| C20:2n-6 | Eicosadienoic acid | 0.10 (0.07–0.14) | 0.4 (0.4–0.6) |
| C20:3n-6 2 | Dihomo-gamma-linoleic acid | 0.08 (0.06–0.11) | 0.3 (0.3–0.4) |
| C20:4n-6 2 | Arachidonic acid | 0.08 (0.06–0.11) | 0.4 (0.3–0.4) |
| C22:4n-6 2 | Adrenic acid | 0.01 (0.01–0.02) | 0.1 (0.1–0.1) |
| C22:5n-6 2 | Osbond acid | 0.01 (<0.01–0.01) | <0.1 (<0.1–<0.1) |
| Long chain polyunsaturated fatty acids 3 | 0.35 (0.26–0.46) | 1.5 (1.3–1.7) | |
| Medium chain fatty acids 4 | 3.16 (2.28–4.14) | 13.6 (11.6–16.0) | |
| Saturated fatty acids/Polyunsaturated fatty acids | 3.04 (2.59–3.60) | -- | |
| N-6/n-3 polyunsaturated fatty acids | 8.17 (6.81–9.46) | -- | |
| Total fatty acids | 23.44 (18.03–29.40) | -- | |
| Predictor | Fatty Acid | β-Coefficient (95% Confidence Interval) | |
|---|---|---|---|
| Gestational age 2 | C14:0 | Myristic acid | −0.02 (−0.02–−0.01) |
| Monounsaturated fatty acids | 0.03 (0.02–0.05) | ||
| Cod liver oil intake 3 | C15:0 | Pentadecanoic acid | 0.0001 (4) |
| C20:1n-9 | Eicosenoic acid | 0.0001 (4) | |
| C20:5n-3 | Eicosapentaenoic acid | 0.0002 (4) | |
| C22:1t | Erucic acid | 0.00004 (4) | |
| C22:4n-6 | Adrenic acid | −0.00002 (4) | |
| C22:5n-3 | Docosapentaenoic acid | 0.0001 (4) | |
| C22:6n-3 | Docosahexaenoic acid | 0.001 (<0.001–0.001) | |
| N-3 polyunsaturated fatty acids | 0.001 (4) | ||
| Long chain polyunsaturated fatty acids | 0.001 (<0.001–0.001) | ||
| n-6/n-3 polyunsaturated fatty acids | −0.004 (−0.01–−0.003) | ||
| Fatty fish intake 5 | C20:1n-9 | Eicosenoic acid | 0.001 (4) |
| C20:5n-3 | Eicosapentaenoic acid | 0.001 (<0.001–0.001) | |
| C22:1t | Erucic acid | 0.0002 (4) | |
| C22:5n-3 | Docosapentaenoic acid | 0.001 (<0.001–0.001) | |
| C22:6n-3 | Docosahexaenoic acid | 0.002 (0.001–0.002) | |
| N-3 polyunsaturated fatty acids | 0.004 (0.003–0.01) | ||
| Long chain polyunsaturated fatty acids | 0.003 (0.002–0.004) | ||
| n-6/n-3 polyunsaturated fatty acids | −0.02 (−0.02–−0.01) | ||
| Excess pregnancy weight gain 6 | C16:1n-7 | Palmitoleate | 0.27 (0.19–0.36) |
| C18:0 | Stearic acid | −0.42 (−0.61–−0.23) | |
| C18:1n-7 | Cis-vaccenic acid | 0.10 (0.07–0.13) | |
| Medium chain saturated fatty acids | −1.10 (−1.64–−0.55) | ||
| Parity 7 | C16:1n-7 | Palmitoleate | −0.19 (−0.28–−0.09) |
| C18:0 | Stearic acid | 0.50 (0.30–0.71) | |
| C18:1n-7 | Cis-vaccenic acid | −0.07 (−0.11–−0.04) | |
| C20:5n-3 | Eicosapentaenoic acid | −0.02 (−0.04–−0.01) | |
| C22:6n-3 | Docosahexaenoic acid | −0.08 (−0.12–−0.05) | |
| Obesity 8 | C20:5n-3 | Eicosapentaenoic acid | −0.03 (−0.05–−0.02) |
| C22:6n-3 | Docosahexaenoic acid | −0.10 (−0.15–−0.06) | |
| N-3 polyunsaturated fatty acids | −0.22 (−0.32–−0.11) | ||
| Fatty Acid | Infant Growth 2 | Rapid Growth 3 | |||
|---|---|---|---|---|---|
| β-Coefficient (95% CI) | p-Value | Odds Ratio (95% CI) | p-Value | ||
| Saturated fatty acids | −0.02 (−0.04–<0.01) * | 0.05 | 0.92 (0.87–0.97) * | 0.003 * | |
| C8:0 4 | Caprylic acid | −0.27 (−0.93–0.39) | 0.42 | 0.17 (0.02–1.36) | 0.10 |
| C10:0 4 | Capric acid | −0.11 (−0.29–0.06) | 0.21 | 0.65 (0.38–1.10) | 0.12 |
| C12:0 4 | Lauric acid | −0.05 (−0.08–−0.01) * | 0.02 * | 0.85 (0.75–0.95) * | 0.006 * |
| C13:0 | Tridecanoic acid | −0.62 (−1.86–0.62) | 0.33 | 0.04 (<0.01–2.45) | 0.12 |
| C14:0 4 | Myristic acid | −0.06 (−0.10–−0.01) * | 0.02 * | 0.82 (0.71–0.95) * | 0.007 * |
| C15:0 | Pentadecanoic acid | −0.06 (−0.76–0.64) | 0.86 | 1.46 (0.19–11.2) | 0.72 |
| C16:0 | Palmitic acid | <0.01 (−0.04–0.04) | 0.97 | 0.94 (0.84–11.2) | 0.24 |
| C17:0 | Margaric acid | −0.12 (−1.56–1.32) | 0.87 | 5.55 (0.09–363) | 0.42 |
| C18:0 | Stearic acid | 0.01 (−0.04–0.06) | 0.57 | 1.02 (0.89–1.18) | 0.77 |
| C22:0 | Behenic acid | −0.09 (−1.45–1.26) | 0.89 | 0.43 (0.01–25.3) | 0.69 |
| Monounsaturated fatty acids | 0.02 (<0.01–0.04) * | 0.05 | 1.11 (1.04–1.18) * | 0.002 * | |
| C14:1 | Myristoleic acid | 0.31 (−0.65–1.27) | 0.53 | 8.09 (0.49–113) | 0.14 |
| C15:1 | Pentadecanoic acid | 0.34 (−2.71–3.39) | 0.83 | 33.1 (0.01–2.2 × 10⁵) | 0.44 |
| C16:1n-7 | Palmitoleate | 0.06 (−0.05–0.17) | 0.30 | 1.39 (1.02–1.89) * | 0.04 * |
| C18:1n-9 | Oleic acid | 0.02 (<−0.01–0.05) * | 0.07 | 1.10 (1.03–1.19) * | 0.009 * |
| C18:1n-7 | Cis-vaccenic acid | 0.16 (−0.13–0.45) | 0.28 | 2.87 (1.24–6.64) * | 0.01 * |
| C20:1n-9 | Eicosenoic acid | 0.06 (−0.55–0.67) | 0.85 | 2.99 (0.56–16.0) | 0.20 |
| Trans fatty acids | −0.21 (−0.52–0.11) | 0.20 | 0.72 (0.28–1.82) | 0.48 | |
| C16:1t | Palmitoleic acid | −0.35 (−3.04–2.35) | 0.80 | 34.0 (0.02–7.0 × 10⁴) | 0.37 |
| C18:1t | Elaidic acid | −0.23 (−0.56–0.11) | 0.19 | 0.63 (0.23–1.70) | 0.36 |
| C22:1t | Erucic acid | −0.02 (−1.92–1.89) | 0.99 | 2.80 (0.01–694) | 0.71 |
| Polyunsaturated fatty acids | 0.01 (−0.01–0.03) | 0.50 | 1.03 (0.96–1.10) | 0.45 | |
| C20:3n-9 5 | Mead acid | −2.04 (−11.09–7.02) | 0.66 | 0.05 (<0.01–1.4 × 10¹⁰) | 0.82 |
| N-3 polyunsaturated fatty acids | 0.02 (−0.11–0.15) | 0.73 | 1.15 (0.79–1.67) | 0.47 | |
| C18:3n-3 | Alpha-linoleic acid | 0.07 (−0.15–0.29) | 0.52 | 1.11 (0.59–2.10) | 0.74 |
| C20:3n-3 5 | Eicosatrienoic acid | −2.12 (−7.23–2.99) | 0.42 | 20.1 (<0.01–5.9 × 10⁷) | 0.69 |
| C20:5n-3 5 | Eicosapentaenoic acid | 0.04 (−0.84–0.91) | 0.94 | 2.14 (0.18–25.2) | 0.55 |
| C22:5n-3 5 | Docosapentaenoic acid | −0.16 (−1.24–0.91) | 0.77 | 2.19 (0.10–48.7) | 0.62 |
| C22:6n-3 5 | Docosahexaenoic acid | <0.01 (−0.29–0.29) | >0.99 | 1.40 (0.62–3.17) | 0.41 |
| N-6 polyunsaturated fatty acids | 0.01 (−0.02–0.03) | 0.50 | 1.03 (0.96–1.10) | 0.49 | |
| C18:2n-6 | Linoleic acid | 0.01 (−0.02–0.03) | 0.47 | 1.02 (0.95–1.10) | 0.54 |
| C18:3n-6 | Gamma-linoleic acid | 0.49 (−1.12–2.10) | 0.55 | 4.57 (0.04–496) | 0.53 |
| C20:2n-6 | Eicosadienoic acid | −0.11 (−0.53–0.30) | 0.60 | 1.54 (0.47–5.02) | 0.48 |
| C20:3n-6 5 | Dihomo-gamma-linoleic acid | 0.23 (−0.56–1.02) | 0.57 | 5.61 (0.59–53.7) | 0.14 |
| C20:4n-6 5 | Arachidonic acid | −0.06 (−0.95–0.83) | 0.89 | 1.33 (0.10–17.8) | 0.83 |
| C22:4n-6 5 | Adrenic acid | −2.17 (−4.51–0.16) * | 0.07 | 1.22 (<0.01–1.5 × 10³) | 0.96 |
| C22:5n-6 5 | Osbond acid | 0.45 (−3.70–4.59) | 0.83 | 0.48 (<0.01–1.1 × 10⁵) | 0.91 |
| Long chain polyunsaturated fatty acids 6 | −0.01 (−0.17–0.16) | 0.93 | 1.27 (0.80–2.02) | 0.31 | |
| Medium chain fatty acids 7 | −0.02 (−0.04–<0.01) * | 0.02 * | 0.92 (0.86–0.98) * | 0.006 * | |
| Saturated fatty acids/Polyunsaturated fatty acids 8 | −0.05 (−0.12–0.03) | 0.25 | 0.77 (0.60–0.99) * | 0.04 * | |
| n-6/n-3 polyunsaturated fatty acids 8 | <0.01 (−0.03–0.04) | 0.90 | 1.00 (0.90–1.10) | 0.97 | |
Publisher’s Note: MDPI stays neutral with regard to jurisdictional claims in published maps and institutional affiliations. |
© 2022 by the authors. Licensee MDPI, Basel, Switzerland. This article is an open access article distributed under the terms and conditions of the Creative Commons Attribution (CC BY) license (https://creativecommons.org/licenses/by/4.0/).
Share and Cite
Criswell, R.L.; Iszatt, N.; Demmelmair, H.; Ahmed, T.B.; Koletzko, B.V.; Lenters, V.C.; Eggesbø, M.Å. Predictors of Human Milk Fatty Acids and Associations with Infant Growth in a Norwegian Birth Cohort. Nutrients 2022, 14, 3858. https://doi.org/10.3390/nu14183858
Criswell RL, Iszatt N, Demmelmair H, Ahmed TB, Koletzko BV, Lenters VC, Eggesbø MÅ. Predictors of Human Milk Fatty Acids and Associations with Infant Growth in a Norwegian Birth Cohort. Nutrients. 2022; 14(18):3858. https://doi.org/10.3390/nu14183858
Chicago/Turabian StyleCriswell, Rachel L., Nina Iszatt, Hans Demmelmair, Talat Bashir Ahmed, Berthold V. Koletzko, Virissa C. Lenters, and Merete Å. Eggesbø. 2022. "Predictors of Human Milk Fatty Acids and Associations with Infant Growth in a Norwegian Birth Cohort" Nutrients 14, no. 18: 3858. https://doi.org/10.3390/nu14183858
APA StyleCriswell, R. L., Iszatt, N., Demmelmair, H., Ahmed, T. B., Koletzko, B. V., Lenters, V. C., & Eggesbø, M. Å. (2022). Predictors of Human Milk Fatty Acids and Associations with Infant Growth in a Norwegian Birth Cohort. Nutrients, 14(18), 3858. https://doi.org/10.3390/nu14183858