
Gut Microbiota and Fear Processing in Women Affected by Obesity: An Exploratory Pilot Study
 ,
,  , , , , , ,
  and
and
Abstract
:1. Introduction
2. Materials and Methods
2.1. Study Design, Enrollment and Questionnaires
2.2. Implicit-Facial-Emotion-Recognition Task
2.3. Temperament
2.4. Sample Collection
2.5. Gut Microbiota Profiling by 16S rRNA Amplicon Sequencing
2.6. Biochemical Parameters
2.7. Statistical Analysis
2.7.1. Experimental Task
2.7.2. Temperament
2.7.3. Gut Microbiota Profiling and Correlation with Host Metadata
2.7.4. Sample Size
3. Results
3.1. Participants
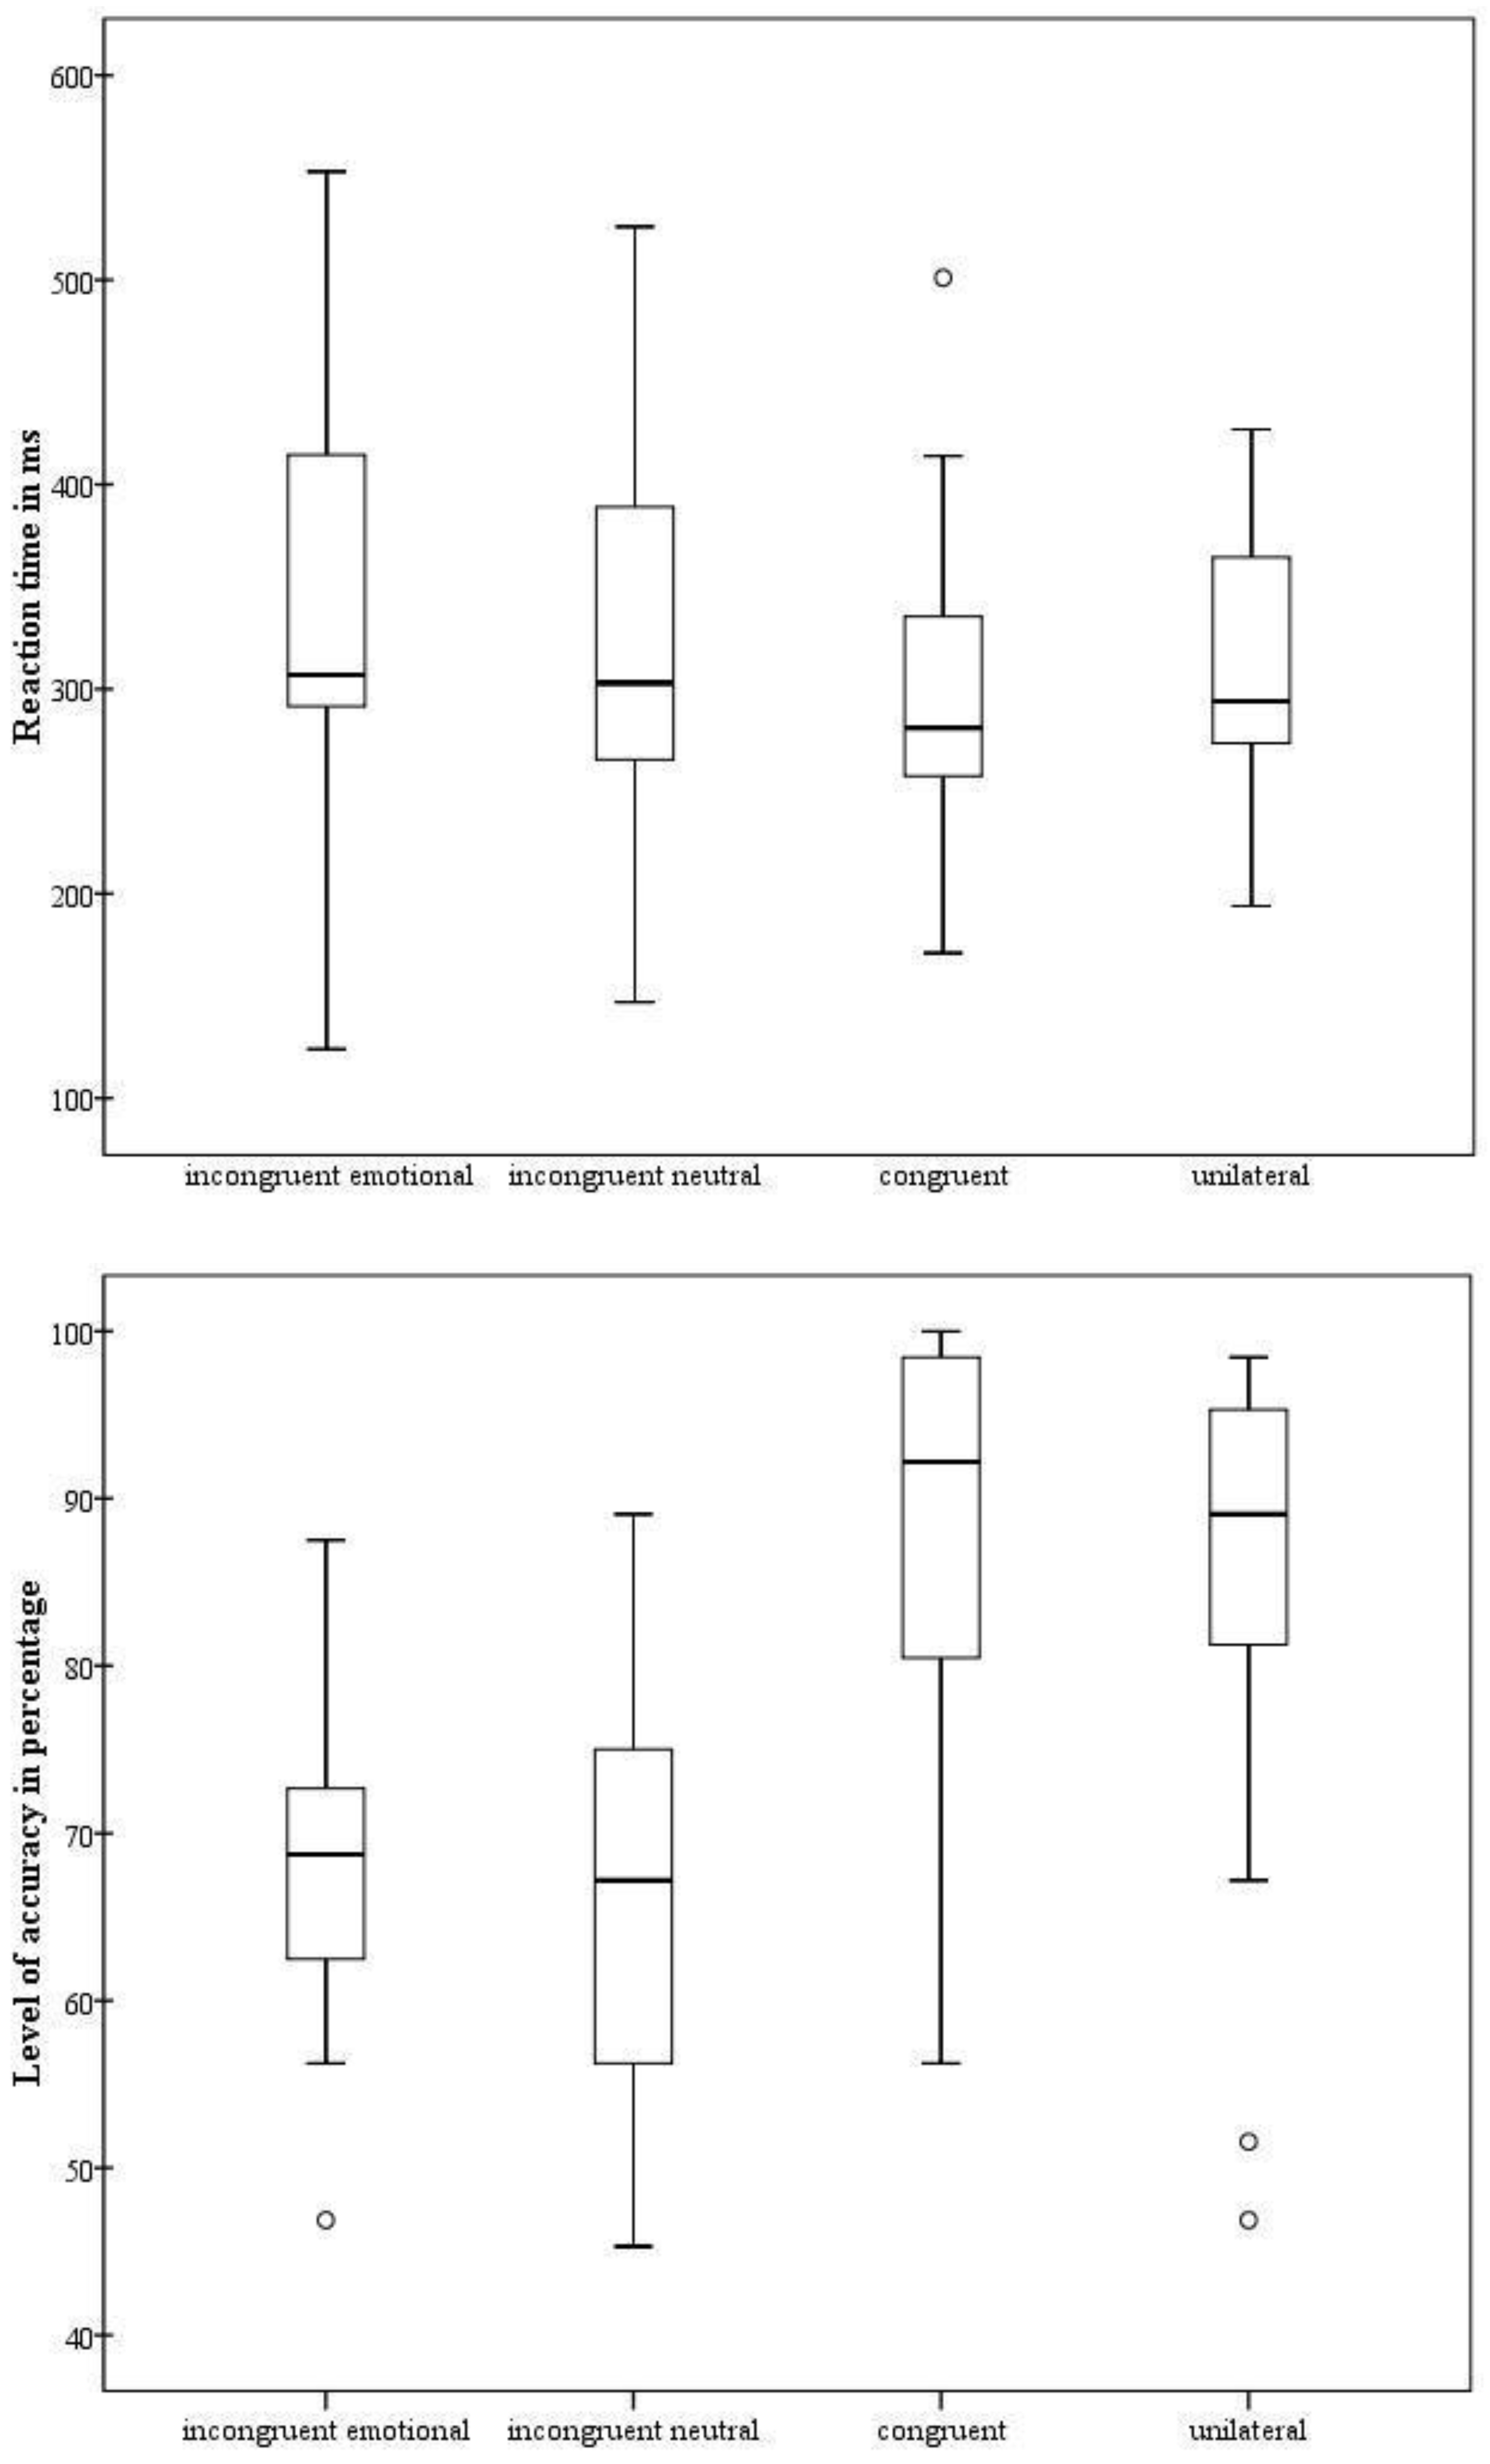
3.2. Implicit-Facial-Emotion-Recognition Task
3.3. Temperament
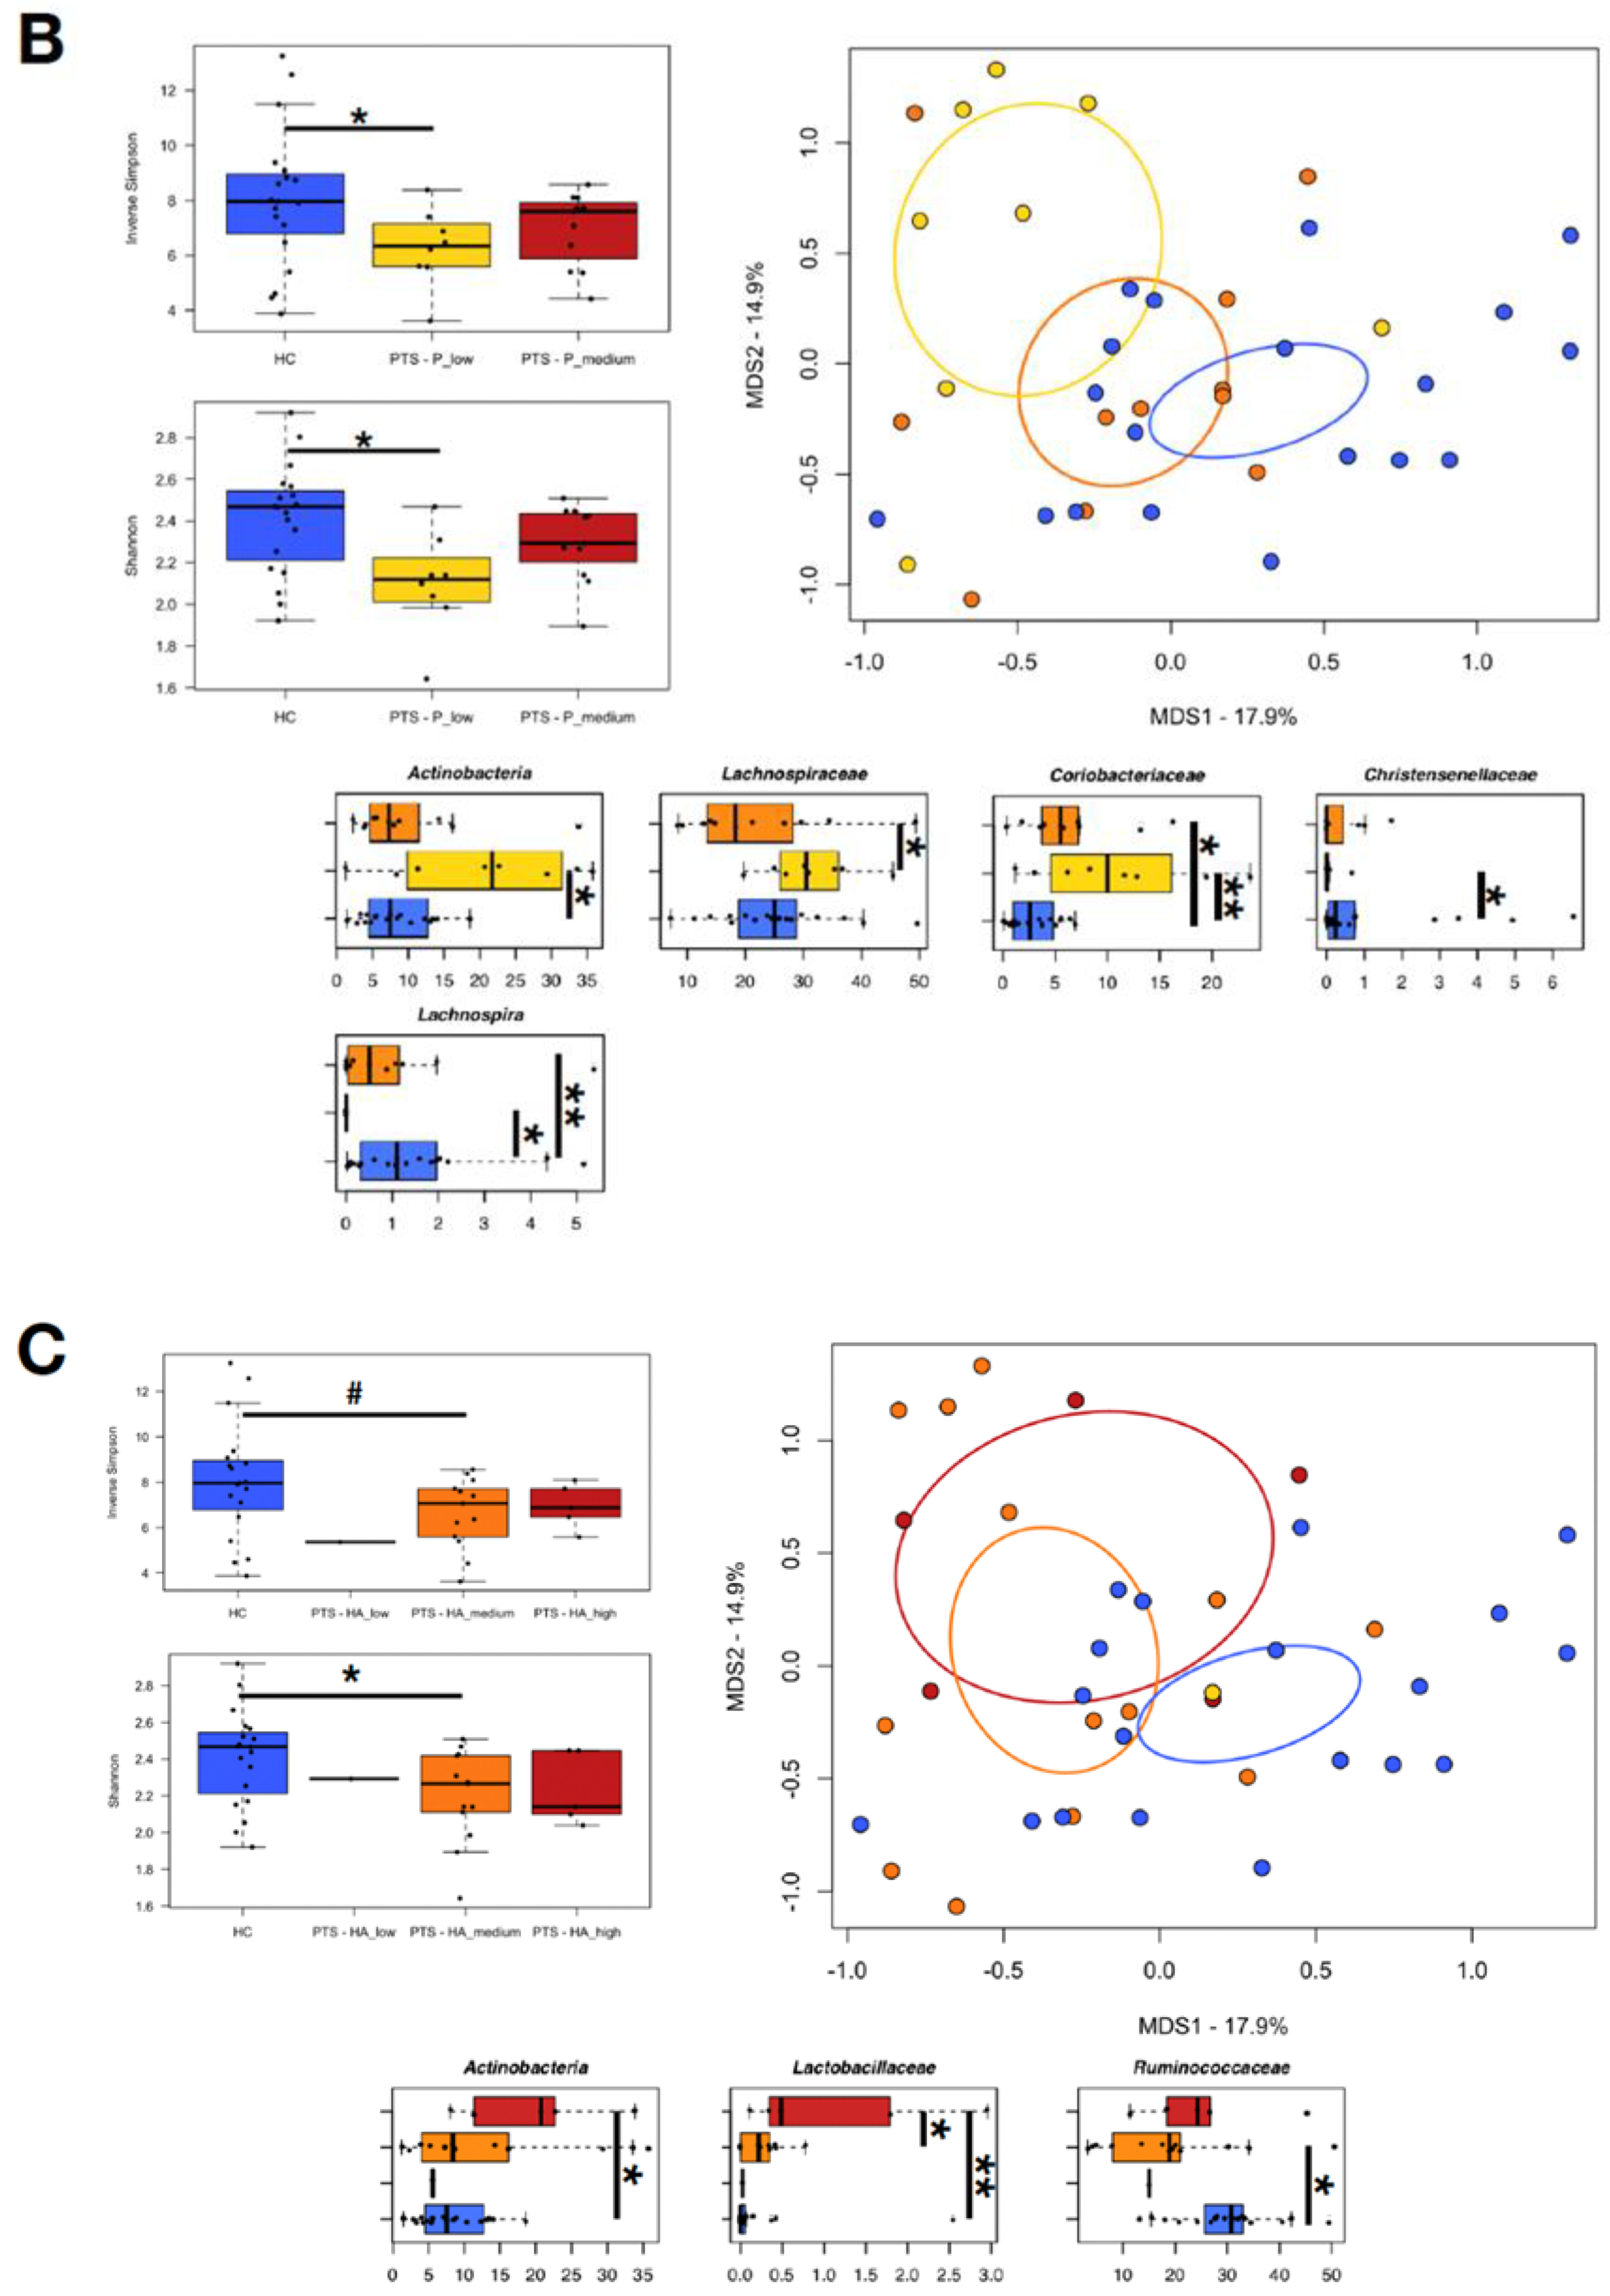
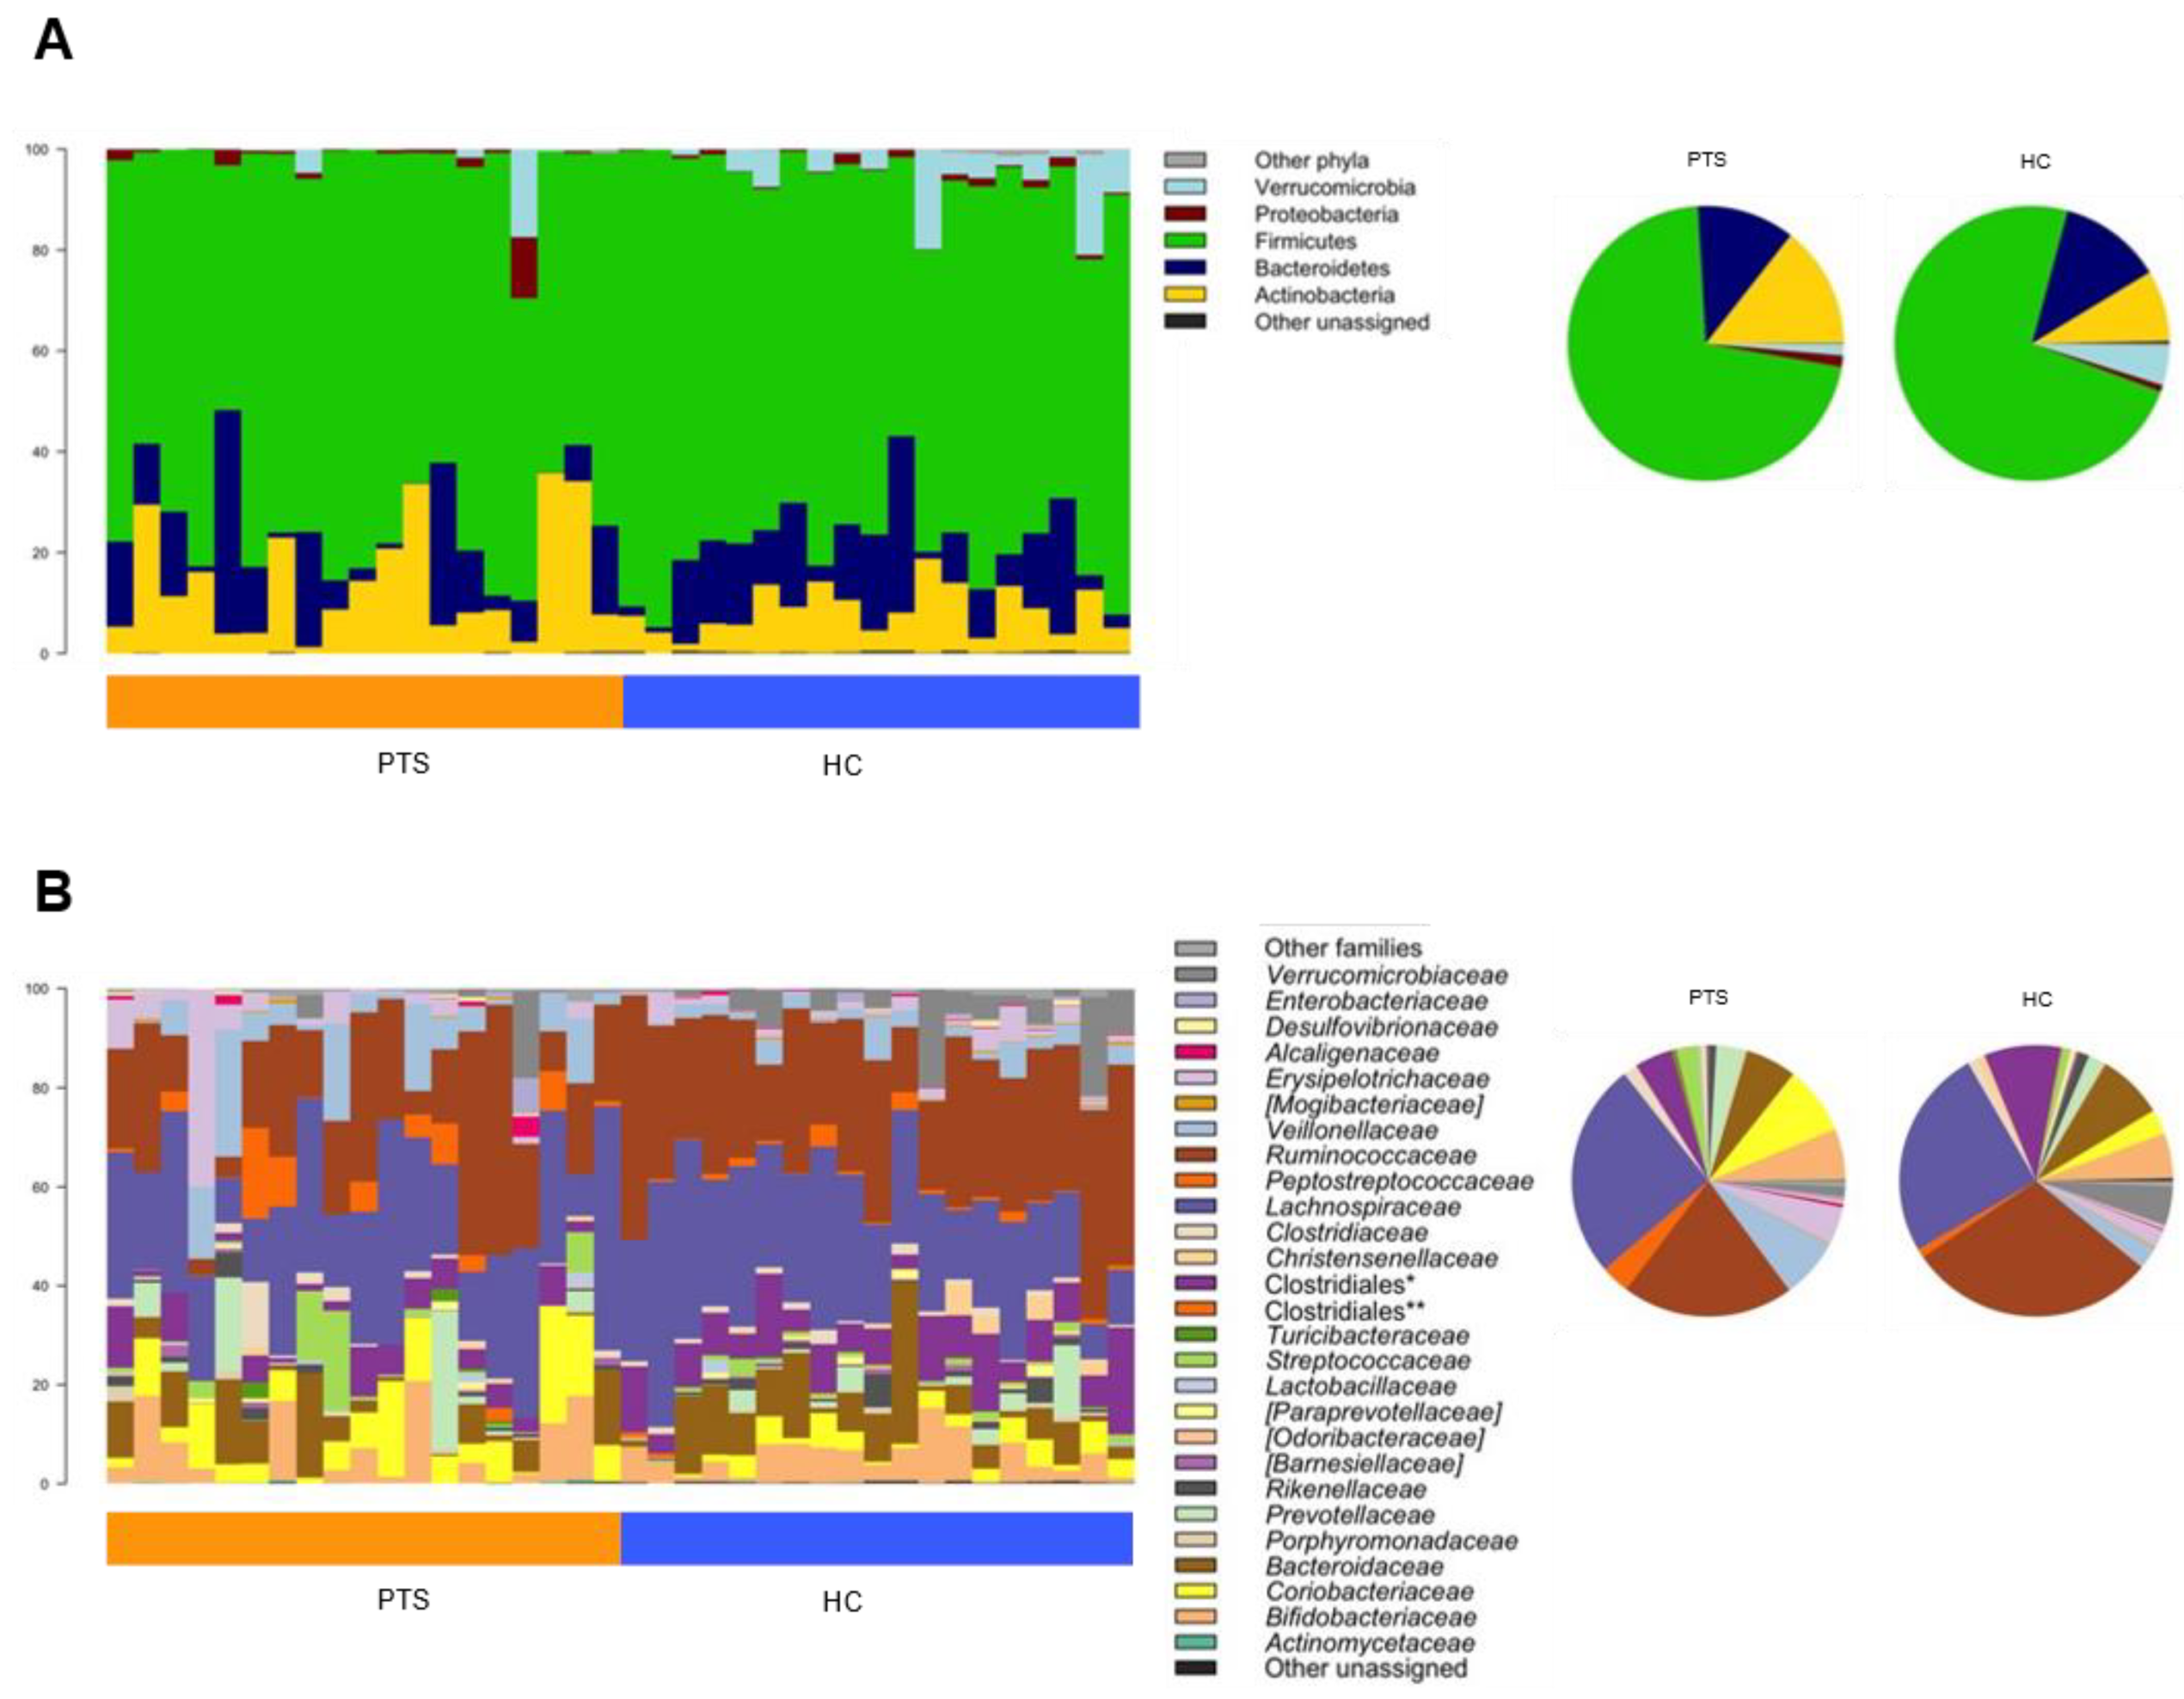
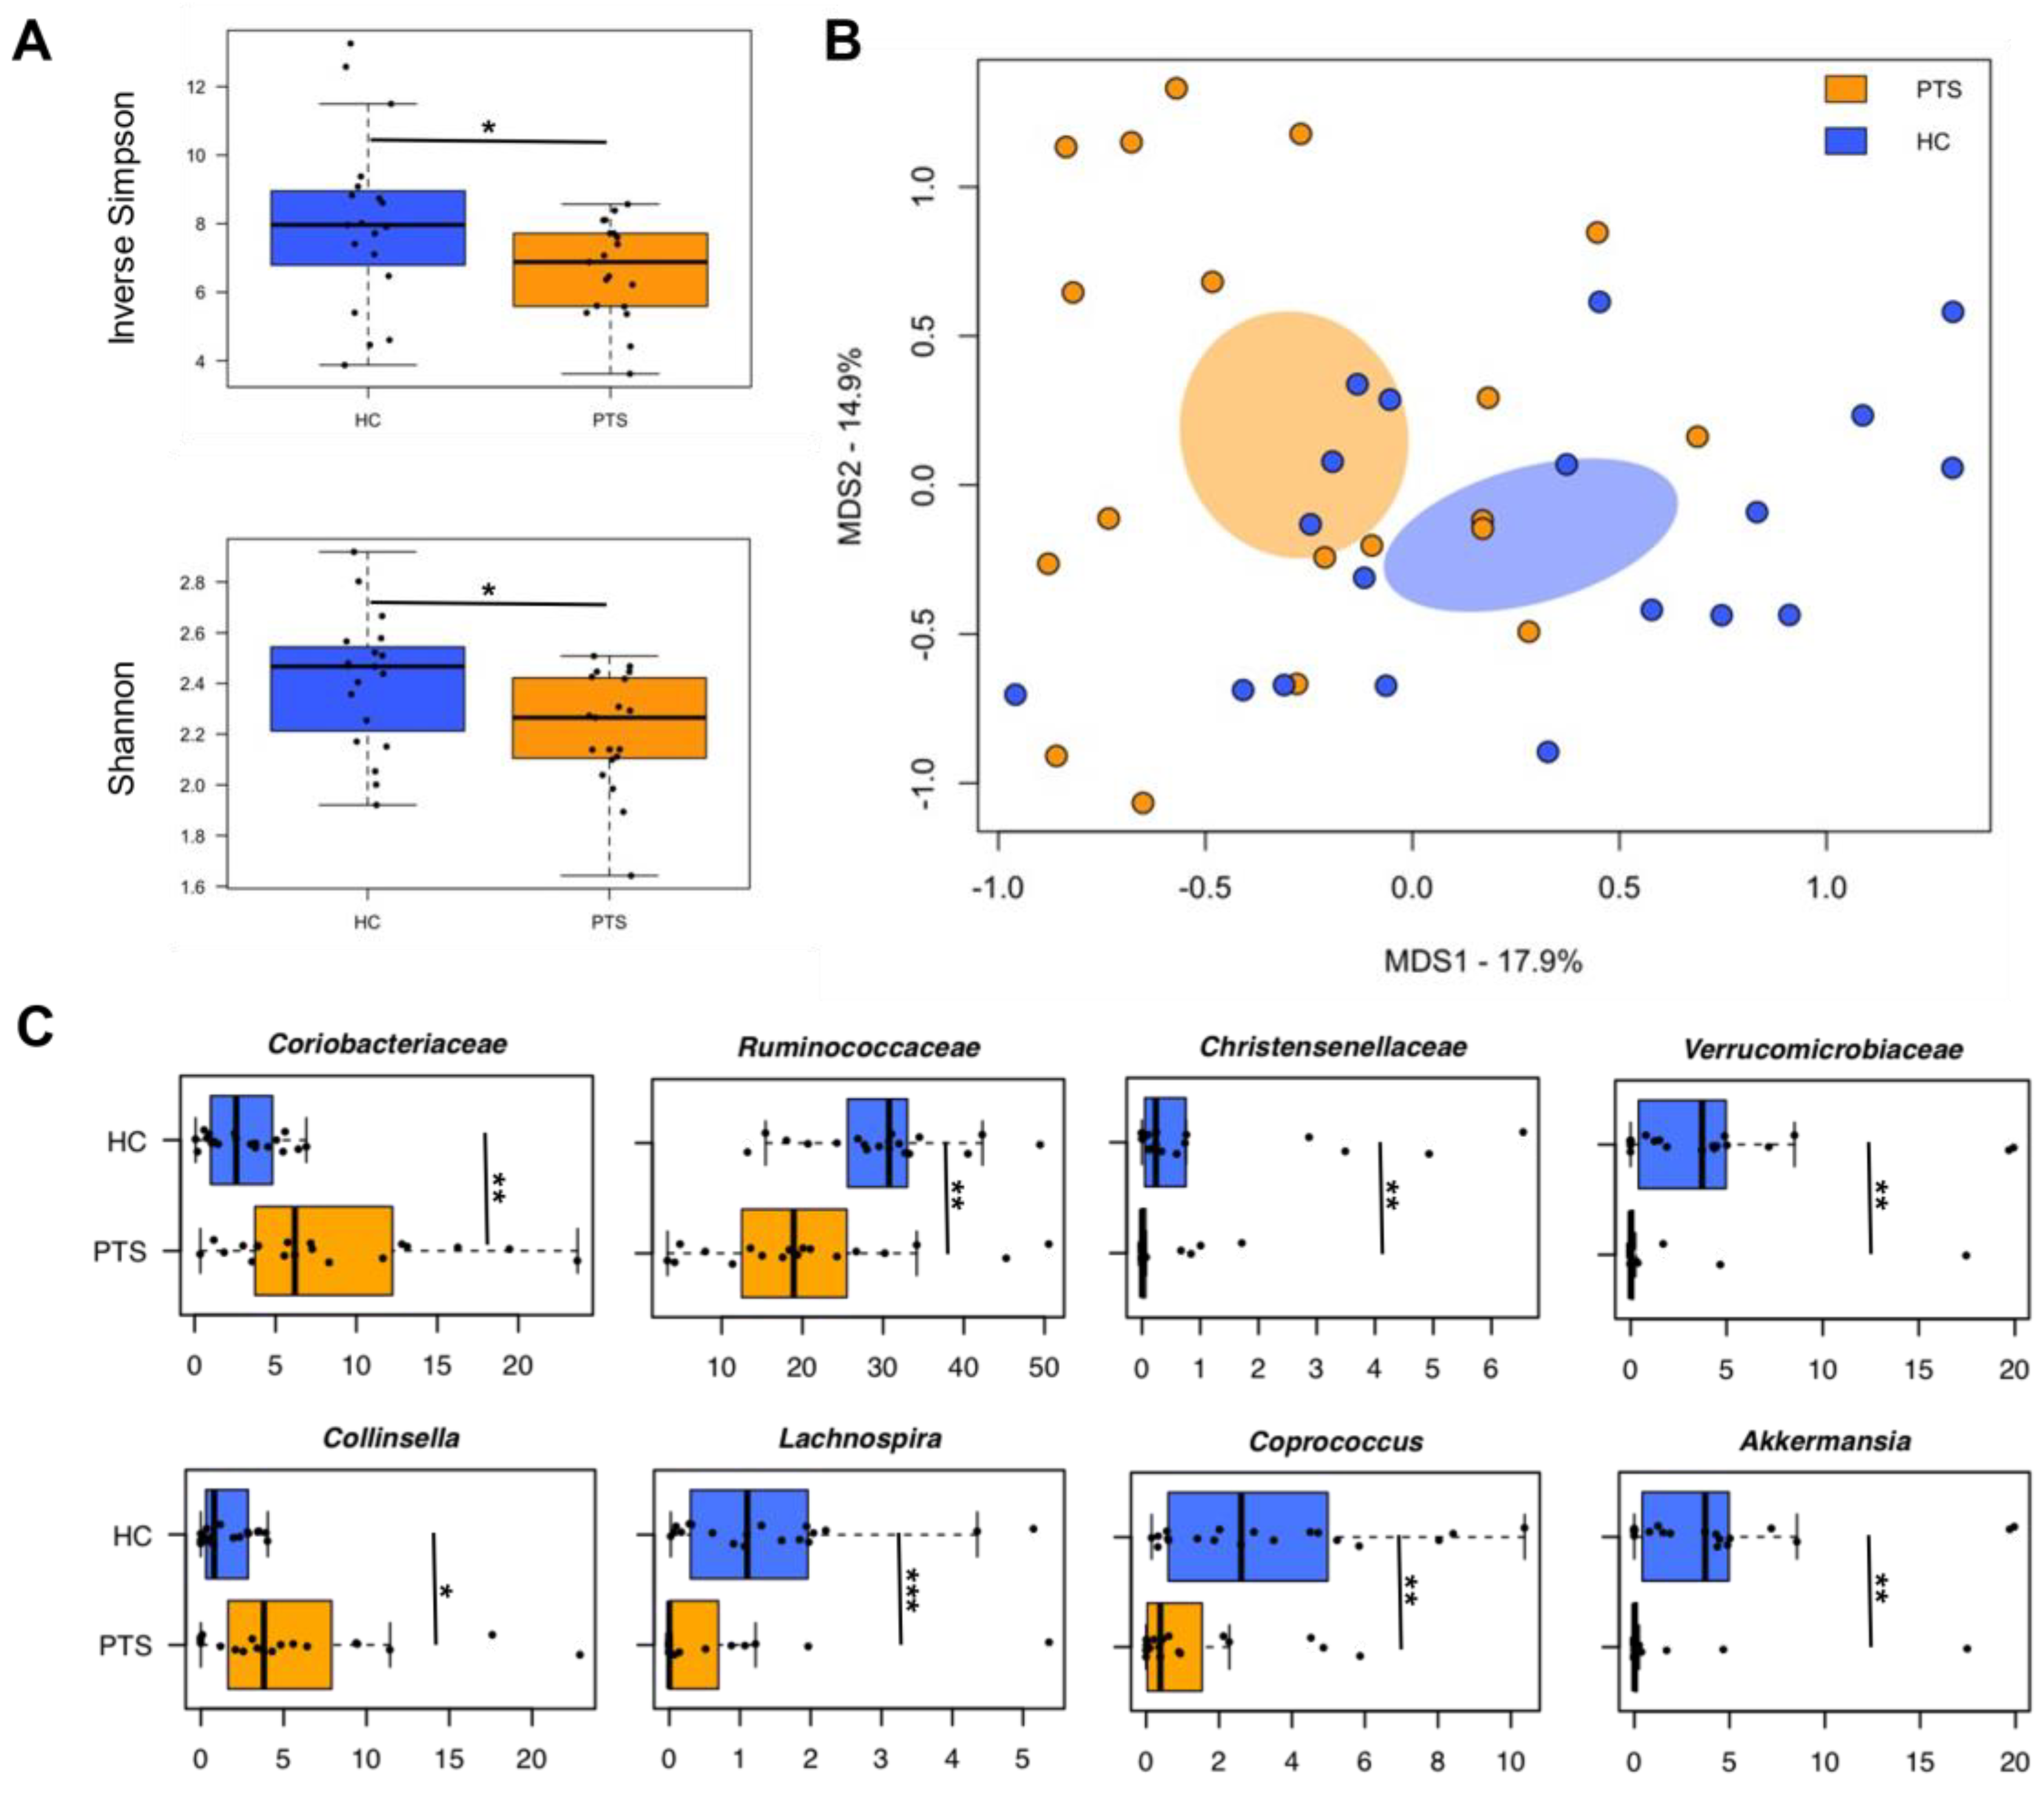
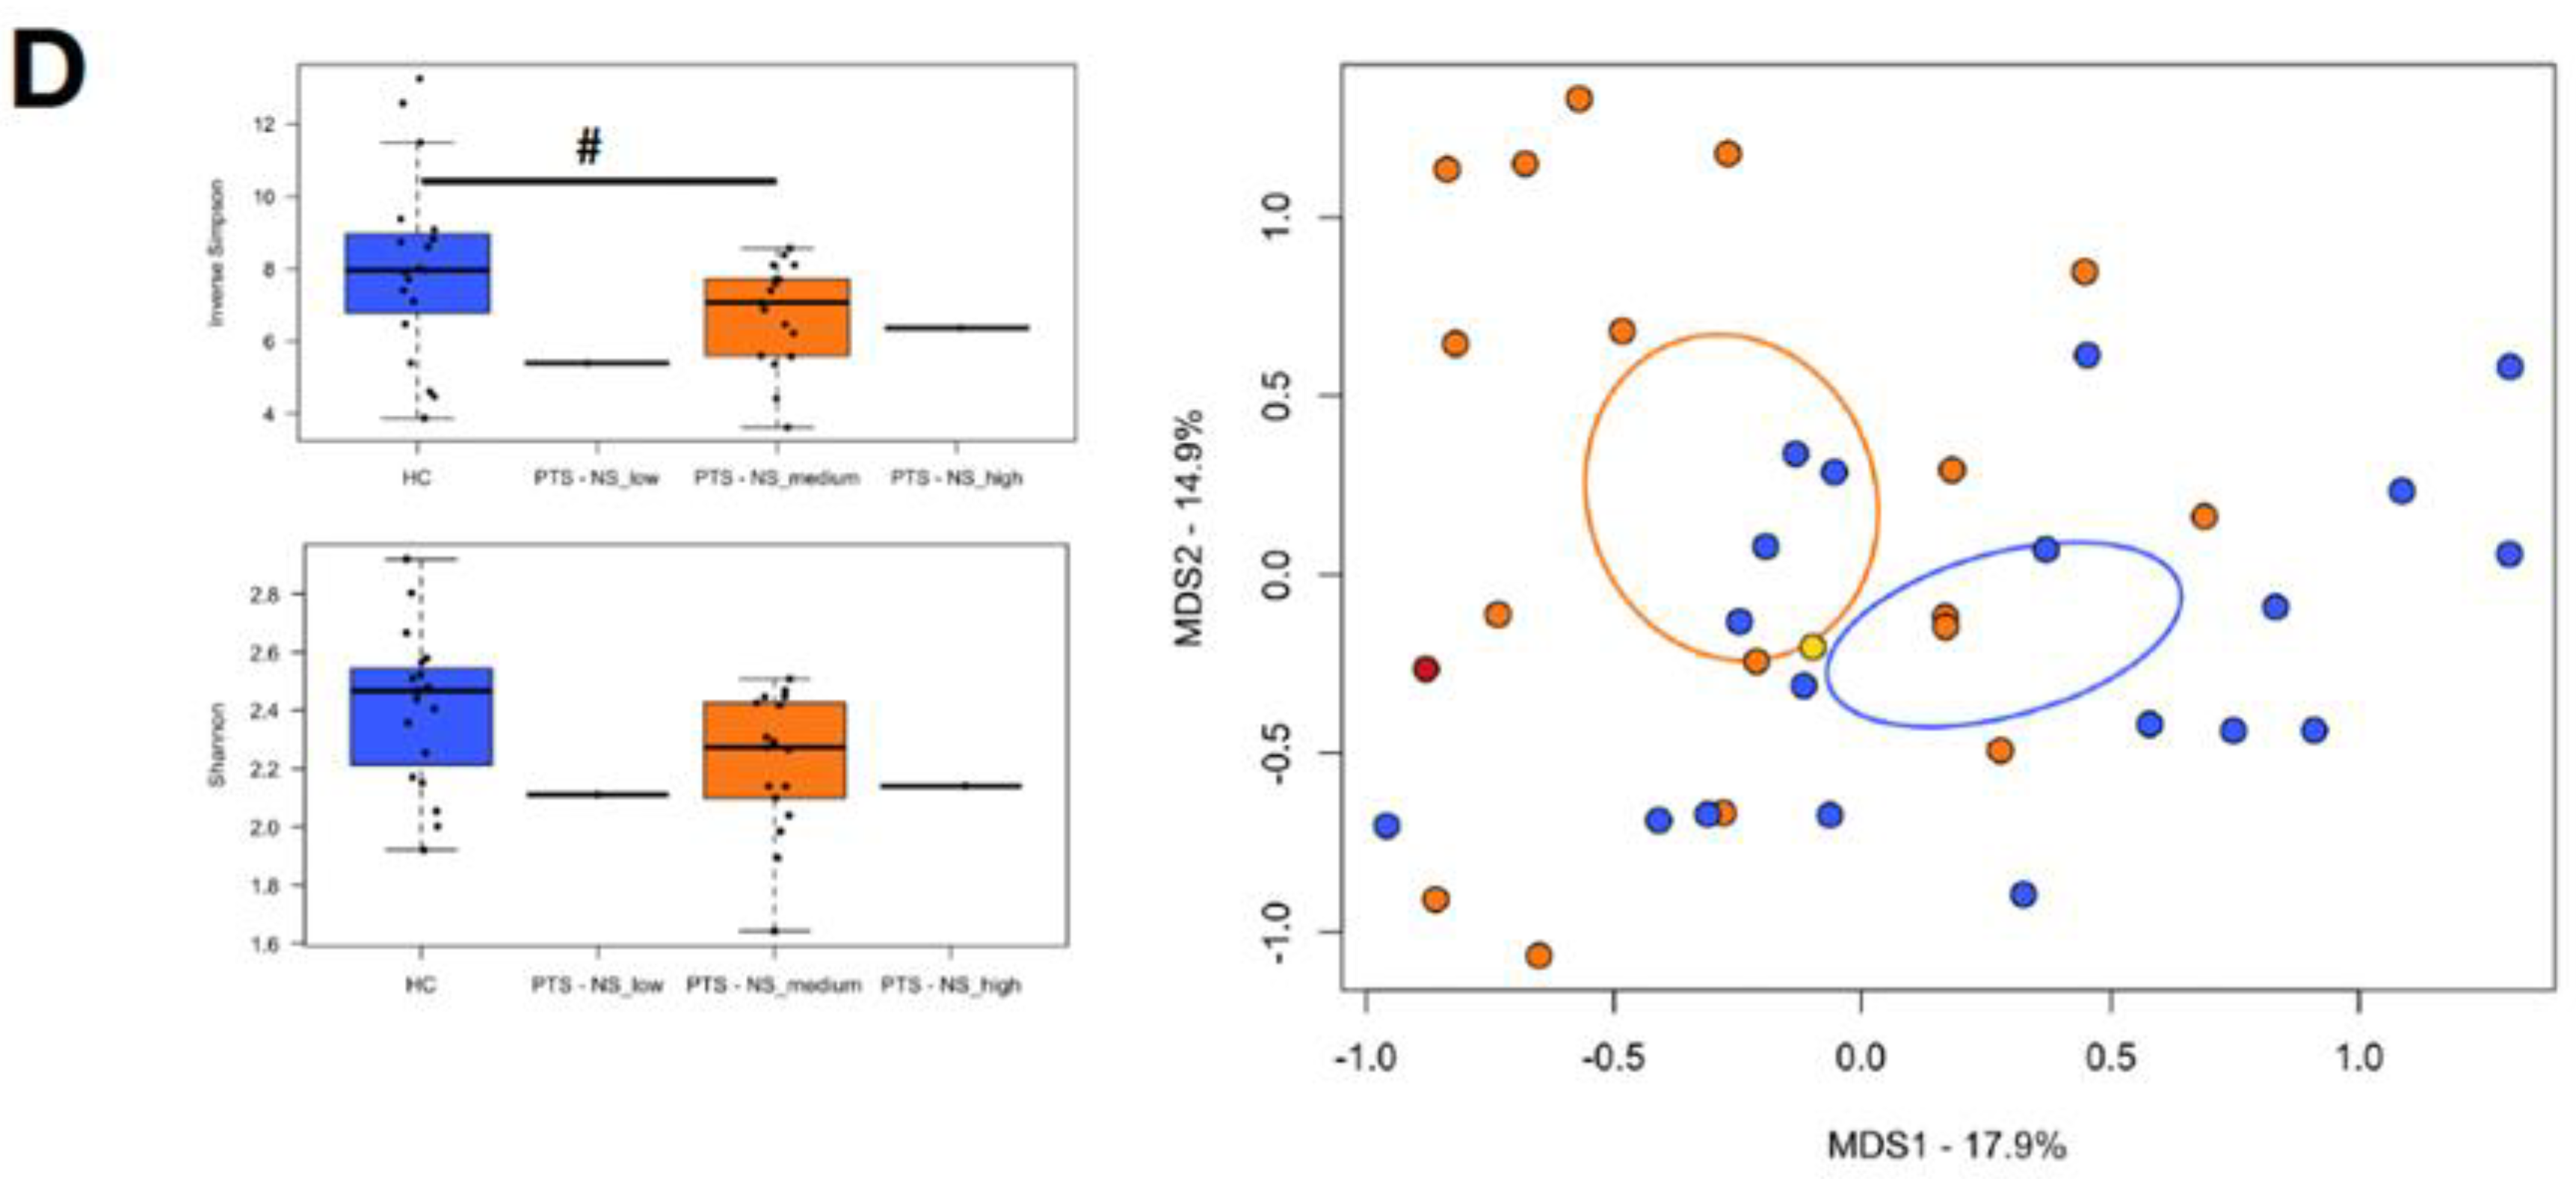
3.4. Gut Microbiota
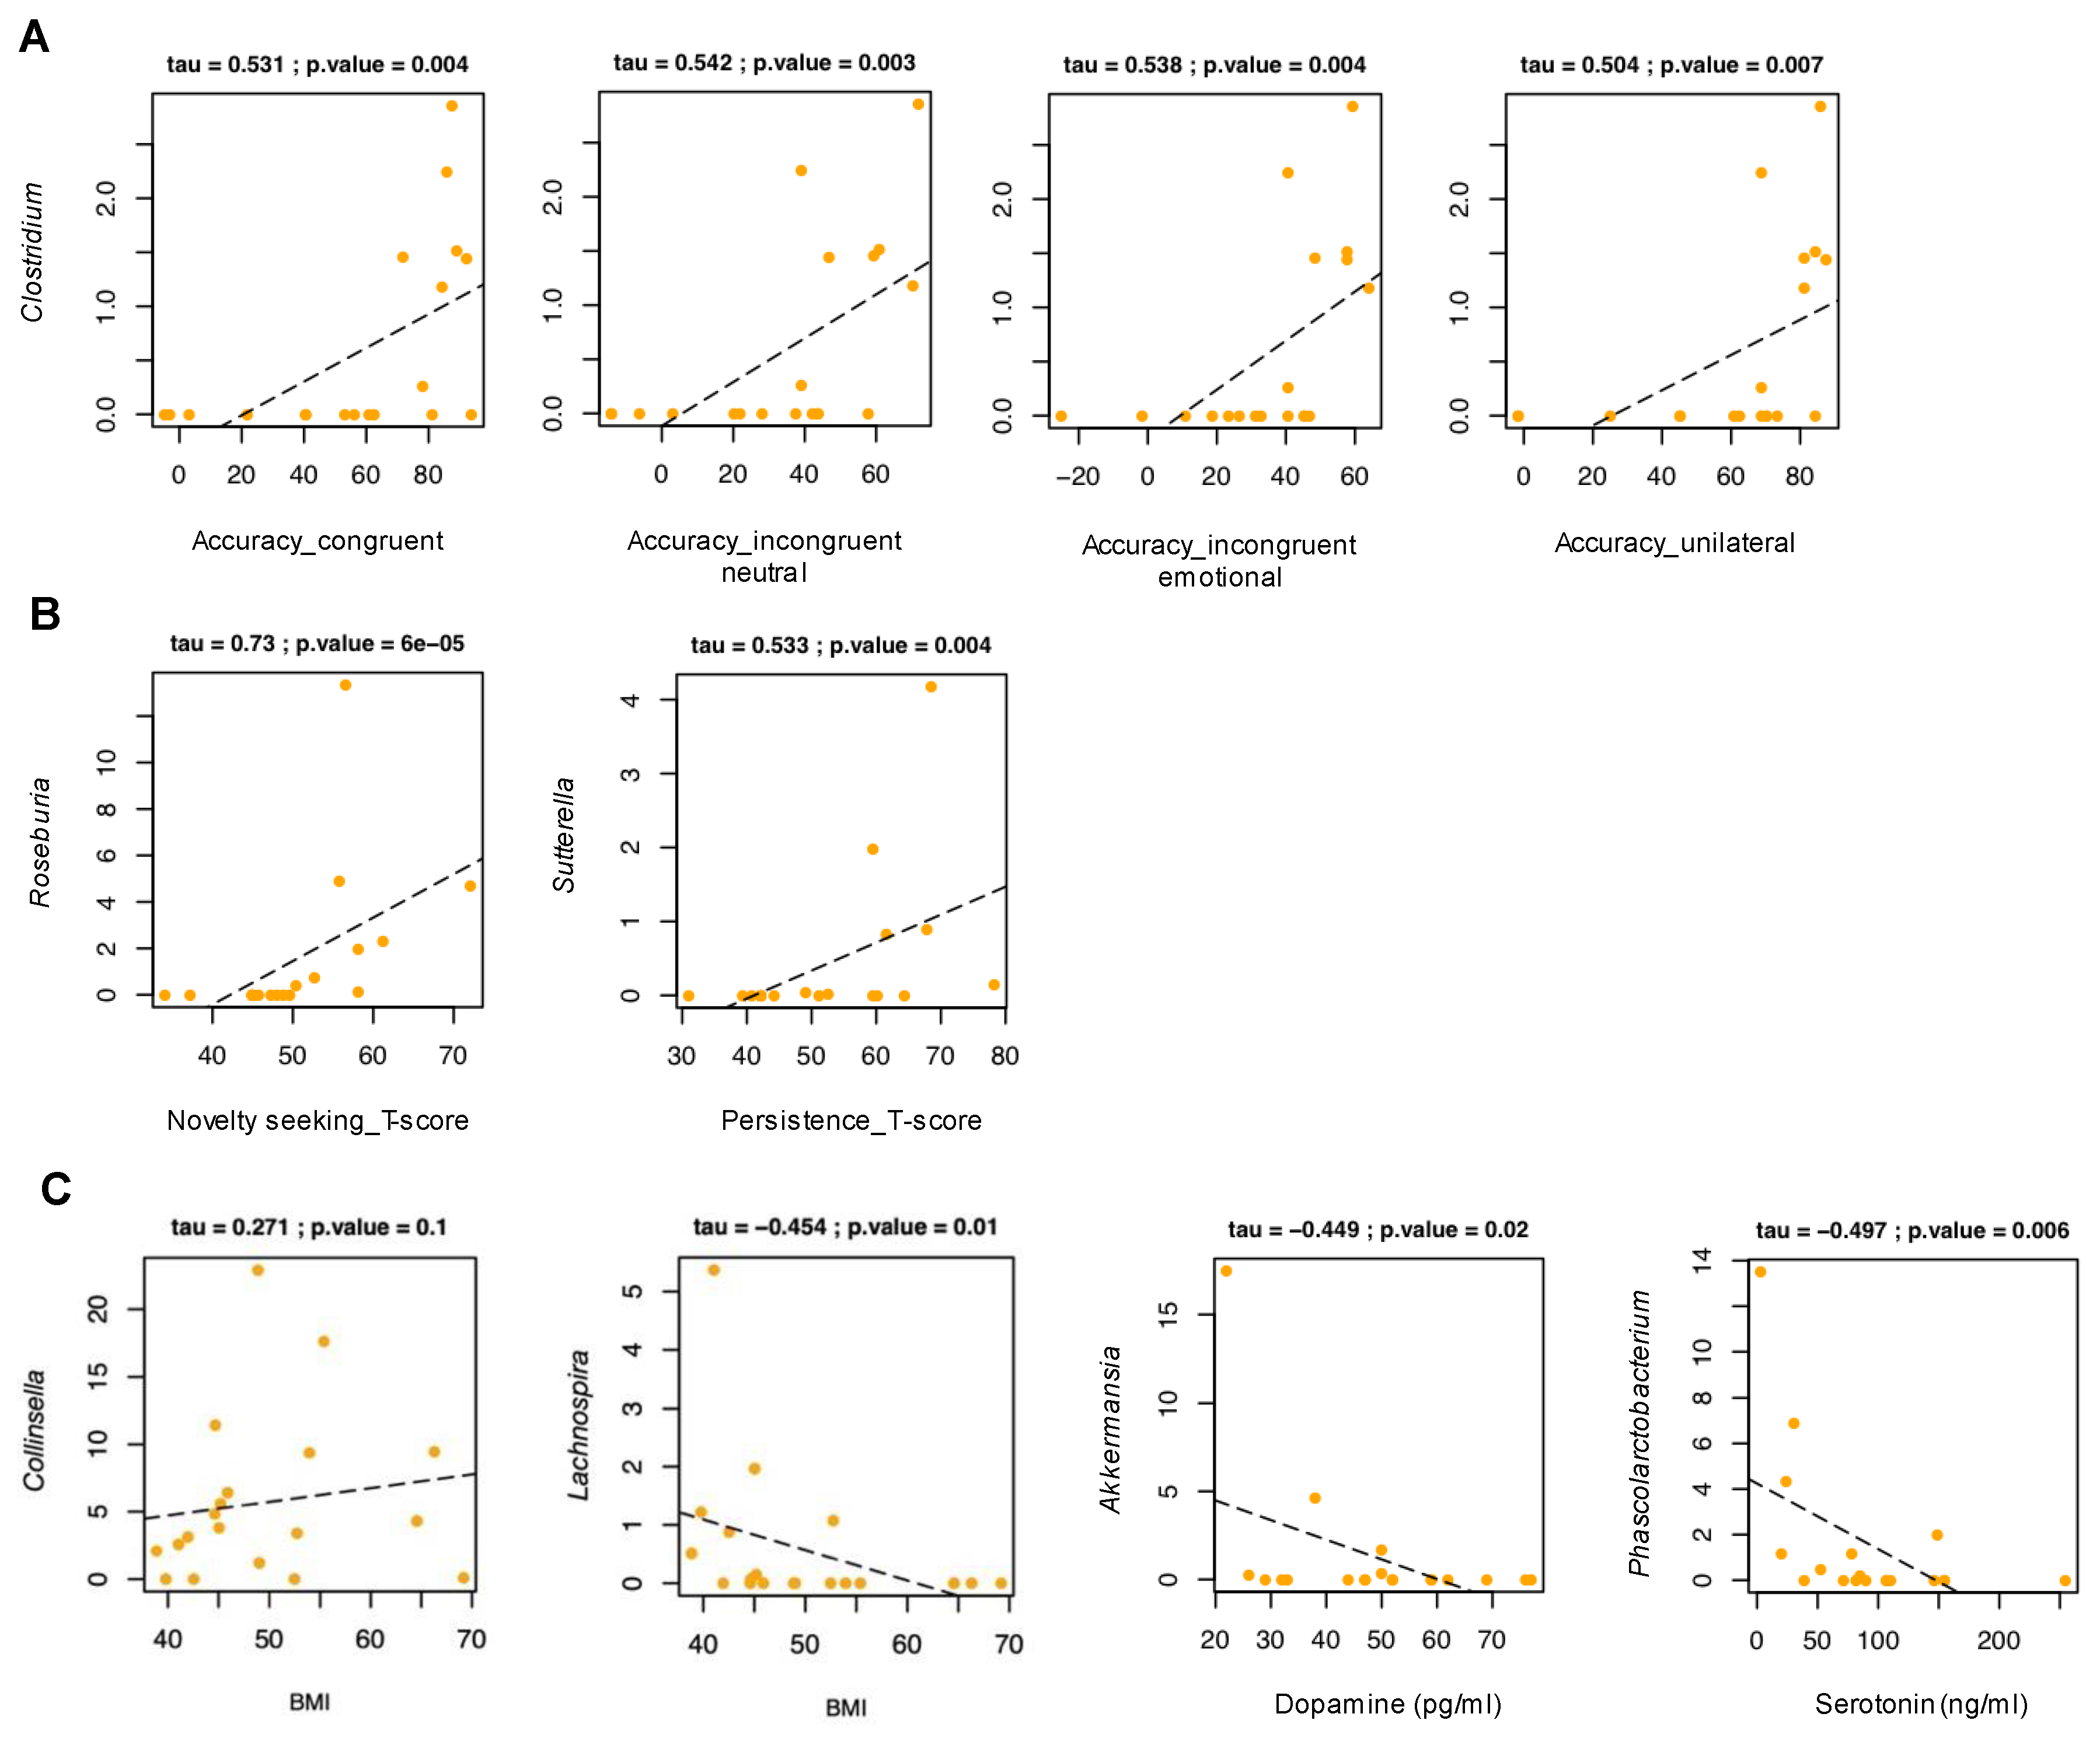
3.5. Relationship between Gut Microbiota and Experimental Task
3.6. Relationship between Gut Microbiota and Temperament
3.7. Anthropometric and Biochemical Parameters
4. Discussion
5. Conclusions
Author Contributions
Funding
Institutional Review Board Statement
Informed Consent Statement
Data Availability Statement
Acknowledgments
Conflicts of Interest
References
- McFarland, D. The Oxford Companion to Animal Behaviour; Oxford University Press: Oxford, UK, 1987. [Google Scholar]
- LeDoux, J. The Emotional Brain, Fear, and the Amygdala. Cell. Mol. Neurobiol. 2003, 23, 727–738. [Google Scholar] [CrossRef] [PubMed]
- Duvarci, S.; Pare, D. Amygdala Microcircuits Controlling Learned Fear. Neuron 2014, 82, 966–980. [Google Scholar] [CrossRef] [PubMed]
- Tovote, P.; Fadok, J.P.; Lüthi, A. Neuronal circuits for fear and anxiety. Nat. Rev. Neurosci. 2015, 16, 317–331. [Google Scholar] [CrossRef]
- Pessoa, L.; Japee, S.; Sturman, D.; Ungerleider, L.G. Target Visibility and Visual Awareness Modulate Amygdala Responses to Fearful Faces. Cereb. Cortex 2006, 16, 366–375. [Google Scholar] [CrossRef] [PubMed]
- Craig, K.J.; Brown, K.J.; Baum, A. Environmental factors in the etiology of anxiety. In Psychopharmacology: The Fourth Generation of Progress; Bloom, F.E., Kupfer, D.J., Eds.; Raven Press: New York, NY, USA, 1995; pp. 1325–1339. [Google Scholar]
- Steimer, T. The biology of fear- and anxiety-related behaviors. Dialogues Clin. Neurosci. 2002, 4, 231–249. [Google Scholar] [CrossRef]
- Hoban, A.E.; Stilling, R.M.; Moloney, G.; Shanahan, F.; Dinan, T.G.; Clarke, G.; Cryan, J.F. The microbiome regulates amygdala-dependent fear recall. Mol. Psychiatry 2018, 23, 1134–1144. [Google Scholar] [CrossRef] [PubMed]
- Chu, C.; Murdock, M.H.; Jing, D.; Won, T.H.; Chung, H.; Kressel, A.; Tsaava, T.; Addorisio, M.E.; Putzel, G.G.; Zhou, L.; et al. The microbiota regulate neuronal function and fear extinction learning. Nature 2019, 574, 543–548. [Google Scholar] [CrossRef] [PubMed]
- Neufeld, K.M.; Kang, N.; Bienenstock, J.; Foster, J.A. Reduced anxiety-like behavior and central neurochemical change in germ-free mice. Neurogastroenterol. Motil. 2011, 23, 255–264, e119. [Google Scholar] [CrossRef]
- Clarke, S.F.; Murphy, E.F.; O'Sullivan, O.; Ross, R.P.; O’Toole, P.W.; Shanahan, F.; Cotter, P.D. Targeting the Microbiota to Address Diet-Induced Obesity: A Time Dependent Challenge. PLoS ONE 2013, 8, e65790. [Google Scholar] [CrossRef]
- Aatsinki, A.-K.; Lahti, L.; Uusitupa, H.-M.; Munukka, E.; Keskitalo, A.; Nolvi, S.; O'Mahony, S.; Pietilä, S.; Elo, L.L.; Eerola, E.; et al. Gut microbiota composition is associated with temperament traits in infants. Brain Behav. Immun. 2019, 80, 849–858. [Google Scholar] [CrossRef]
- Kim, H.; Park, Y.J. The Association Between Temperament and Microbiota in Healthy Individuals: A Pilot Study. Psychosom. Med. 2017, 79, 898–904. [Google Scholar] [CrossRef] [PubMed]
- Kim, H.-N.; Yun, Y.; Ryu, S.; Chang, Y.; Kwon, M.-J.; Cho, J.; Shin, H.; Kim, H.-L. Correlation between gut microbiota and personality in adults: A cross-sectional study. Brain Behav. Immun. 2018, 69, 374–385. [Google Scholar] [CrossRef] [PubMed]
- Cloninger, C.R. A unified biosocial theory of personality and its role in the development of anxiety states. Psychiatr. Dev. 1986, 4, 167–226. [Google Scholar] [PubMed]
- Rea, K.; Dinan, T.G.; Cryan, J.F. The microbiome: A key regulator of stress and neuroinflammation. Neurobiol. Stress 2016, 4, 23–33. [Google Scholar] [CrossRef]
- Aatsinki, A.K.; Kataja, E.L.; Munukka, E.; Lahti, L.; Keskitalo, A.; Korja, R.; Nolvi, S.; Häikiö, T.; Tarro, S.; Karlsson, H.; et al. Infant fecal microbiota composition and attention to emotional faces. Emotion 2022, 22, 1159–1170. [Google Scholar] [CrossRef]
- Gariepy, G.; Nitka, D.; Schmitz, N. The association between obesity and anxiety disorders in the population: A systematic review and meta-analysis. Int. J. Obes. 2010, 34, 407–419. [Google Scholar] [CrossRef]
- Sharafi, S.E.; Garmaroudi, G.; Ghafouri, M.; Bafghi, S.A.; Ghafouri, M.; Tabesh, M.R.; Alizadeh, Z. Prevalence of anxiety and depression in patients with overweight and obesity. Obes. Med. 2020, 17, 100169. [Google Scholar] [CrossRef]
- Scarpina, F.; Varallo, G.; Castelnuovo, G.; Capodaglio, P.; Molinari, E.; Mauro, A. Implicit facial emotion recognition of fear and anger in obesity. Eat. Weight Disord. 2021, 26, 1243–1251. [Google Scholar] [CrossRef]
- Vaioli, G.; Scarpina, F. Facial Emotion Recognition in Obesity and in Fibromyalgia: A Systematic Review. NeuroSci 2021, 2, 339–352. [Google Scholar] [CrossRef]
- Park, B.Y.; Hong, J.; Park, H. Neuroimaging biomarkers to associate obesity and negative emotions. Sci. Rep. 2017, 7, 7664. [Google Scholar] [CrossRef]
- Chao, S.H.; Liao, Y.T.; Chen, V.C.H.; Li, C.-J.; McIntyre, R.S.; Lee, Y.; Weng, J.-C. Correlation between brain circuit segregation and obesity. Behav. Brain Res. 2018, 337, 218–227. [Google Scholar] [CrossRef] [PubMed]
- Dekkers, I.A.; Jansen, P.R.; Lamb, H.J. Obesity, Brain Volume, and White Matter Microstructure at MRI: A Cross-sectional UK Biobank Study. Radiology 2019, 291, 763–771. [Google Scholar] [CrossRef] [PubMed]
- Miller, A.A.; Spencer, S.J. Obesity and neuroinflammation: A pathway to cognitive impairment. Brain Behav. Immun. 2014, 42, 10–21. [Google Scholar] [CrossRef] [PubMed]
- Fassino, S.; Leombruni, P.; Pierò, A.; Daga, G.A.; Amianto, F.; Rovera, G.; Rovera, G.G. Temperament and character in obese women with and without binge eating disorder. Compr. Psychiatry 2002, 43, 431–437. [Google Scholar] [CrossRef] [PubMed]
- Gerlach, G.; Herpertz, S.; Loeber, S. Personality traits and obesity: A systematic review. Obes. Rev. 2015, 16, 32–63. [Google Scholar] [CrossRef]
- Scarpina, F.; Bastoni, I.; Cappelli, S.; Priano, L.; Giacomotti, E.; Castelnuovo, G.; Molinari, E.; Tovaglieri, I.M.A.; Cornacchia, M.; Fanari, P.; et al. Psychological Well-Being in Obstructive Sleep Apnea Syndrome Associated with Obesity: The Relationship with Personality, Cognitive Functioning, and Subjective and Objective Sleep Quality. Front. Psychol. 2021, 12, 588767. [Google Scholar] [CrossRef]
- Scarpina, F.; Bastoni, I.; Cappelli, S.; Priano, L.; Giacomotti, E.; Castelnuovo, G.; Molinari, E.; Tovaglieri, I.M.A.; Cornacchia, M.; Fanari, P.; et al. Short-Term Effects of a Multidisciplinary Residential Rehabilitation Program on Perceived Risks, Confidence Toward Continuous Positive Airway Pressure Treatment, and Self-Efficacy in a Sample of Individuals Affected by Obstructive Sleep Apnea Syndrome. Front. Psychol. 2021, 12, 703089. [Google Scholar] [CrossRef]
- Cani, P.D.; van Hul, M. Gut microbiota and obesity: Causally linked? Expert Rev. Gastroenterol. Hepatol. 2020, 14, 401–403. [Google Scholar] [CrossRef]
- Kim, M.-H.; Yun, K.E.; Kim, J.; Park, E.; Chang, Y.; Ryu, S.; Kim, H.-L.; Kim, H.-N. Gut microbiota and metabolic health among overweight and obese individuals. Sci. Rep. 2020, 10, 19417. [Google Scholar] [CrossRef]
- Million, M.; Maraninchi, M.; Henry, M.; Armougom, F.; Richet, H.; Carrieri, P.; Valero, R.; Raccah, D.; Vialettes, B.; Raoult, D. Obesity-associated gut microbiota is enriched in Lactobacillus reuteri and depleted in Bifidobacterium animalis and Methanobrevibacter smithii. Int. J. Obes. 2012, 36, 817–825. [Google Scholar] [CrossRef] [Green Version]
- Caricilli, A.M.; Saad, M.J. Gut microbiota composition and its effects on obesity and insulin resistance. Curr. Opin. Clin. Nutr. Metab. Care 2014, 17, 312–318. [Google Scholar] [CrossRef]
- Scarpina, F.; Melzi, L.; Castelnuovo, G.; Mauro, A.; Marzoli, S.B.; Molinari, E. Explicit and Implicit Components of the Emotional Processing in Non-organic Vision Loss: Behavioral Evidence About the Role of Fear in Functional Blindness. Front. Psychol. 2018, 9, 494. [Google Scholar] [CrossRef]
- Miniussi, C.; Girelli, M.; Marzi, C.A. Neural Site of the Redundant Target Effect: Electrophysiological Evidence. J. Cogn. Neurosci. 1998, 10, 216–230. [Google Scholar] [CrossRef] [PubMed]
- Tamietto, M.; Latini Corazzini, L.; de Gelder, B.; Geminiani, G. Functional asymmetry and interhemispheric cooperation in the perception of emotions from facial expressions. Exp. Brain Res. 2006, 171, 389–404. [Google Scholar] [CrossRef] [PubMed]
- Tamietto, M.; Adenzato, M.; Geminiani, G.; de Gelder, B. Fast recognition of social emotions takes the whole brain: Interhemispheric cooperation in the absence of cerebral asymmetry. Neuropsychologia 2007, 45, 836–843. [Google Scholar] [CrossRef] [PubMed]
- Vujkovic-Cvijin, I.; Sklar, J.; Jiang, L.; Natarajan, L.; Knight, R.; Belkaid, Y. Host variables confound gut microbiota studies of human disease. Nature 2020, 587, 448–454. [Google Scholar] [CrossRef] [PubMed]
- Blaak, E. Gender differences in fat metabolism. Curr. Opin. Clin. Nutr. Metab. Care 2001, 4, 499–502. [Google Scholar] [CrossRef]
- Haslam, D. Gender-specific aspects of obesity. J. Men's Health Gend. 2005, 2, 179–185. [Google Scholar] [CrossRef]
- Kanter, R.; Caballero, B. Global Gender Disparities in Obesity: A Review. Adv. Nutr. 2012, 3, 491–498. [Google Scholar] [CrossRef]
- Yoon, K.; Kim, N. Roles of Sex Hormones and Gender in the Gut Microbiota. J. Neurogastroenterol. Motil. 2021, 27, 314–325. [Google Scholar] [CrossRef]
- Brody, L.R.; Hall, J.A. Gender and emotion. In Handbook of Emotions; Lewis, M., Haviland, J.M., Eds.; The Guilford Press: New York, NY, USA, 1993; pp. 447–460. [Google Scholar]
- Abbruzzese, L.; Magnani, N.; Robertson, I.H.; Mancuso, M. Age and Gender Differences in Emotion Recognition. Front. Psychol. 2019, 10, 2371. [Google Scholar] [CrossRef] [PubMed]
- Scarpina, F.; Godi, M.; Corna, S.; Seitanidis, I.; Capodaglio, P.; Mauro, A. Psychological functioning in survivors of COVID-19: Evidence from recognition of fearful facial expressions. PLoS ONE 2021, 16, e0254438. [Google Scholar] [CrossRef]
- World Health Organization. Obesity and Overweight; Fact Sheet Number 311; World Health Organization: Geneva, Switzerland, 2006. [Google Scholar]
- Cancello, R.; Turroni, S.; Rampelli, S.; Cattaldo, S.; Candela, M.; Cattani, L.; Mai, S.; Vietti, R.; Scacchi, M.; Brigidi, P.; et al. Effect of Short-Term Dietary Intervention and Probiotic Mix Supplementation on the Gut Microbiota of Elderly Obese Women. Nutrients 2019, 11, 3011. [Google Scholar] [CrossRef] [PubMed]
- Blüher, M. Metabolically Healthy Obesity. Endocr. Rev. 2020, 41, bnaa004. [Google Scholar] [CrossRef]
- Sofi, F.; Macchi, C.; Abbate, R.; Gensini, G.F.; Casini, A. Mediterranean diet and health status: An updated meta-analysis and a proposal for a literature-based adherence score. Public Health Nutr. 2014, 17, 2769–2782. [Google Scholar] [CrossRef] [PubMed]
- Grossi, E.; Groth, N.; Mosconi, P.; Cerutti, R.; Pace, F.; Compare, A.; Apolone, G. Development and validation of the short version of the Psychological General Well-Being Index (PGWB-S). Health Qual. Life Outcomes 2006, 4, 88. [Google Scholar] [CrossRef] [PubMed]
- Dupuy, H.J. The Psychological General Well-Being (PGWB) Index. In Assessment of Quality of Life in Clinical Trials of Cardiovascular Therapies; Wenger, N., Ed.; Le Jacq: New York, NY, USA, 1984; pp. 170–183. [Google Scholar]
- Iacoboni, M.; Zaidel, E. Interhemispheric visuo-motor integration in humans: The effect of redundant targets. Eur. J. Neurosci. 2003, 17, 1981–1986. [Google Scholar] [CrossRef]
- Diano, M.; Celeghin, A.; Bagnis, A.; Tamietto, M. Amygdala Response to Emotional Stimuli without Awareness: Facts and Interpretations. Front. Psychol. 2017, 7, 2029. [Google Scholar] [CrossRef]
- Miller, J. Divided attention: Evidence for coactivation with redundant signals. Cogn. Psychol. 1982, 14, 247–279. [Google Scholar] [CrossRef]
- Ekman, P.; Friesen, W.V. Measuring facial movement. J. Nonverbal Behav. 1976, 1, 56–75. [Google Scholar] [CrossRef]
- Martinotti, G.; Mandelli, L.; Di Nicola, M.; Serretti, A.; Fossati, A.; Borroni, S.; Cloninger, C.R.; Janiri, L. Psychometric characteristic of the Italian version of the Temperament and Character Inventory—Revised, personality, psychopathology, and attachment styles. Compr. Psychiatry 2008, 49, 514–522. [Google Scholar] [CrossRef]
- Rowicka, G.; Dyląg, H.; Chełchowska, M.; Weker, H.; Ambroszkiewicz, J. Serum Calprotectin and Chemerin Concentrations as Markers of Low-Grade Inflammation in Prepubertal Children with Obesity. Int. J. Environ. Res. Public Health 2020, 17, 7575. [Google Scholar] [CrossRef] [PubMed]
- Yu, Z.; Morrison, M. Improved extraction of PCR-quality community DNA from digesta and fecal samples. Biotechniques 2004, 36, 808–812. [Google Scholar] [CrossRef] [PubMed]
- Masella, A.P.; Bartram, A.K.; Truszkowski, J.M.; Brown, D.G.; Neufeld, J.D. PANDAseq: Paired-end assembler for illumina sequences. BMC Bioinformatics 2012, 13, 31. [Google Scholar] [CrossRef]
- Bolyen, E.; Rideout, J.R.; Dillon, M.R.; Bokulich, N.A.; Abnet, C.C.; Al-Ghalith, G.A.; Alexander, H.; Alm, E.J.; Arumugam, M.; Asnicar, F.; et al. Reproducible, Interactive, Scalable and Extensible Microbiome Data Science using QIIME 2. Nat. Biotechnol. 2019, 37, 852–857. [Google Scholar] [CrossRef]
- Callahan, B.J.; Sankaran, K.; Fukuyama, J.A.; McMurdie, P.J.; Holmes, S.P. Bioconductor Workflow for Microbiome Data Analysis: From raw reads to community analyses. F1000Research 2016, 5, 1492. [Google Scholar] [CrossRef] [PubMed]
- Rognes, T.; Flouri, T.; Nichols, B.; Quince, C.; Mahé, F. VSEARCH: A versatile open source tool for metagenomics. PeerJ 2016, 4, e2584. [Google Scholar] [CrossRef] [PubMed]
- Schnorr, S.L.; Candela, M.; Rampelli, S.; Centanni, M.; Consolandi, C.; Basaglia, G.; Turroni, S.; Biagi, E.; Peano, C.; Severgnini, M.; et al. Gut microbiome of the Hadza hunter-gatherers. Nat. Commun. 2014, 5, 3654. [Google Scholar] [CrossRef] [PubMed]
- Peled, J.U.; Gomes, A.L.; Devlin, S.M.; Littmann, E.R.; Taur, Y.; Sung, A.D.; Weber, D.; Hashimoto, D.; Slingerland, A.E.; Slingerland, J.B.; et al. Microbiota as Predictor of Mortality in Allogeneic Hematopoietic-Cell Transplantation. N. Engl. J. Med. 2020, 382, 822–834. [Google Scholar] [CrossRef] [PubMed]
- Faul, F.; Erdfelder, E.; Lang, A.G.; Buchner, A. G* Power 3: A flexible statistical power analysis program for the social, behavioral, and biomedical sciences. Behav. Res. Methods 2007, 39, 175–191. [Google Scholar] [CrossRef]
- Kang, W.; Kim, G.; Kim, H.; Lee, S.-H. The Influence of Anxiety on the Recognition of Facial Emotion Depends on the Emotion Category and Race of the Target Faces. Exp. Neurobiol. 2019, 28, 261. [Google Scholar] [CrossRef]
- Krause, F.C.; Linardatos, E.; Fresco, D.M.; Moore, M.T. Facial emotion recognition in major depressive disorder: A meta-analytic review. J. Affect. Disord. 2021, 293, 320–328. [Google Scholar] [CrossRef] [PubMed]
- Gomez-Arango, L.F.; Barrett, H.L.; Wilkinson, S.A.; Callaway, L.K.; McIntyre, H.D.; Morrison, M.; Nitert, M.D. Low dietary fiber intake increases Collinsella abundance in the gut microbiota of overweight and obese pregnant women. Gut Microbes 2018, 9, 189–201. [Google Scholar] [CrossRef] [PubMed]
- Nirmalkar, K.; Murugesan, S.; Pizano-Zárate, M.L.; Villalobos-Flores, L.E.; García-González, C.; Morales-Hernández, R.M.; Nuñez-Hernández, J.A.; Hernández-Quiroz, F.; Romero-Figueroa, M.d.S.; Hernández-Guerrero, C.; et al. Gut Microbiota and Endothelial Dysfunction Markers in Obese Mexican Children and Adolescents. Nutrients 2018, 10, 2009. [Google Scholar] [CrossRef]
- Frost, F.; Storck, L.J.; Kacprowski, T.; Gärtner, S.; Rühlemann, M.; Bang, C.; Franke, A.; Völker, U.; Aghdassi, A.A.; Steveling, A.; et al. A structured weight loss program increases gut microbiota phylogenetic diversity and reduces levels of Collinsella in obese type 2 diabetics: A pilot study. PLoS ONE 2019, 14, e0219489. [Google Scholar] [CrossRef]
- Turroni, S.; Petracci, E.; Edefonti, V.; Giudetti, A.M.; D'Amico, F.; Paganelli, L.; Giovannetti, G.; Del Coco, L.; Fanizzi, F.; Rampelli, S.; et al. Effects of a Diet Based on Foods from Symbiotic Agriculture on the Gut Microbiota of Subjects at Risk for Metabolic Syndrome. Nutrients 2021, 13, 2081. [Google Scholar] [CrossRef]
- Goodrich, J.K.; Davenport, E.R.; Clark, A.G.; Ley, R.E. The Relationship Between the Human Genome and Microbiome Comes into View. Annu. Rev. Genet. 2017, 51, 413–433. [Google Scholar] [CrossRef]
- Depommier, C.; Everard, A.; Druart, C.; Plovier, H.; van Hul, M.; Vieira-Silva, S.; Falony, G.; Raes, J.; Maiter, D.; Delzenne, N.M.; et al. Supplementation with Akkermansia muciniphila in overweight and obese human volunteers: A proof-of-concept exploratory study. Nat. Med. 2019, 25, 1096–1103. [Google Scholar] [CrossRef] [PubMed]
- Rua, R.; Pujol, N. IL-17: Good fear no tears. Nat. Immunol. 2020, 21, 1315–1316. [Google Scholar] [CrossRef] [PubMed]
- EFSA Panel on Nutrition, Novel Foods and Food Allergens (NDA); Turck, D.; Bohn, T.; Castenmiller, J.; de Henauw, S.; Hirsch-Ernst, K.I.; Maciuk, A.; Mangelsdorf, I.; McArdle, H.J.; Naska, A.; et al. Safety of pasteurised Akkermansia muciniphila as a novel food pursuant to Regulation (EU) 2015/2283. EFSA J. 2021, 19, e06780. [Google Scholar] [CrossRef] [PubMed]
- Wu, T.R.; Lin, C.S.; Chang, C.J.; Lin, T.L.; Martel, J.; Ko, Y.F.; Ojcius, D.M.; Lu, C.-C.; Young, J.D.; Lai, H.-C. Gut commensal Parabacteroides goldsteinii plays a predominant role in the anti-obesity effects of polysaccharides isolated from Hirsutella sinensis. Gut 2019, 68, 248–262. [Google Scholar] [CrossRef] [PubMed]
- Bravo, J.A.; Forsythe, P.; Chew, M.V.; Escaravage, E.; Savignac, H.M.; Dinan, T.G.; Bienenstock, J.; Cryan, J.F. Ingestion of Lactobacillus strain regulates emotional behavior and central GABA receptor expression in a mouse via the vagus nerve. Proc. Natl. Acad. Sci. USA 2011, 108, 16050–16055. [Google Scholar] [CrossRef] [PubMed]
- Silveira-Nunes, G.; Durso, D.F.; de Oliviera, L.R.A., Jr.; Cunha, E.H.M.; Maioli, T.U.; Vieira, A.T.; Speziali, E.; Corrêa-Oliveira, R.; Martins-Filho, O.A.; Teixeira-Carvalho, A.; et al. Hypertension Is Associated with Intestinal Microbiota Dysbiosis and Inflammation in a Brazilian Population. Front. Pharmacol. 2020, 11, 258. [Google Scholar] [CrossRef]
- Fassino, S.; Amianto, F.; Gramaglia, C.; Facchini, F.; Abbate Daga, G. Temperament and character in eating disorders: Ten years of studies. Eat Weight Disord. 2004, 9, 81–90. [Google Scholar] [CrossRef]
- Cloninger, C.R.; Zohar, A.H.; Hirschmann, S.; Dahan, D. The psychological costs and benefits of being highly persistent: Personality profiles distinguish mood disorders from anxiety disorders. J. Affect. Disord. 2012, 136, 758–766. [Google Scholar] [CrossRef] [PubMed]
- Xie, T.; Wang, Y.; Zou, Z.; Wu, Y.; Fan, X.; Dai, J.; Liu, Y.; Bai, J. Relationship between the gut microbiota and temperament in children 1–2 years old in Chinese birth cohort. J. Psychiatr. Res. 2022, 148, 52–60. [Google Scholar] [CrossRef]
- Jaggar, M.; Rea, K.; Spichak, S.; Dinan, T.G.; Cryan, J.F. You’ve got male: Sex and the microbiota-gut-brain axis across the lifespan. Front. Neuroendocrinol. 2020, 56, 100815. [Google Scholar] [CrossRef] [PubMed]
- Jašarević, E.; Morrison, K.E.; Bale, T.L. Sex differences in the gut microbiome–brain axis across the lifespan. Philos. Trans. R. Soc. B: Biol. Sci. 2016, 371, 20150122. [Google Scholar] [CrossRef]
- Shobeiri, P.; Kalantari, A.; Teixeira, A.L.; Rezaei, N. Shedding light on biological sex differences and microbiota–gut–brain axis: A comprehensive review of its roles in neuropsychiatric disorders. Biol. Sex Differ. 2022, 13, 12. [Google Scholar] [CrossRef] [PubMed]
- Baker, J.M.; Al-Nakkash, L.; Herbst-Kralovetz, M.M. Estrogen–gut microbiome axis: Physiological and clinical implications. Maturitas 2017, 103, 45–53. [Google Scholar] [CrossRef] [Green Version]
- Craske, M.G.; Hermans, D.; Vervliet, B. State-of-the-art and future directions for extinction as a translational model for fear and anxiety. Philos. Trans. R. Soc. Lond. B Biol. Sci. 2018, 373, 20170025. [Google Scholar] [CrossRef] [PubMed]
- Ekman, P. Are there basic emotions? Psychol. Rev. 1992, 99, 550–553. [Google Scholar] [CrossRef] [PubMed]
- Vuilleumier, P.; Armony, J.L.; Clarke, K.; Husain, M.; Driver, J.; Dolan, R.; Vuilleumier, P.; Armony, J.; Clarke, K.; Husain, M.; et al. Neural response to emotional faces with and without awareness: Event-related fMRI in a parietal patient with visual extinction and spatial neglect. Neuropsychologia 2002, 40, 2156–2166. [Google Scholar] [CrossRef]
- Albano, G.; Rowlands, K.; Baciadonna, L.; Coco, G.L.; Cardi, V. Interpersonal difficulties in obesity: A systematic review and meta-analysis to inform a rejection sensitivity-based model. Neurosci. Biobehav. Rev. 2019, 107, 846–861. [Google Scholar] [CrossRef] [PubMed]
- Parashar, A.; Udayabanu, M. Gut microbiota regulates key modulators of social behavior. Eur. Neuropsychopharmacol. 2016, 26, 78–91. [Google Scholar] [CrossRef] [PubMed]
- Sherwin, E.; Bordenstein, S.R.; Quinn, J.L.; Dinan, T.G.; Cryan, J.F. Microbiota and the social brain. Science 2019, 366, eaar2016. [Google Scholar] [CrossRef]
- Vindegaard, N.; Benros, M.E. COVID-19 pandemic and mental health consequences: Systematic review of the current evidence. Brain Behav. Immun. 2020, 89, 531–542. [Google Scholar] [CrossRef]
- Fiorenzato, E.; Zabberoni, S.; Costa, A.; Cona, G. Cognitive and mental health changes and their vulnerability factors related to COVID-19 lockdown in Italy. PLoS ONE 2021, 16, e0246204. [Google Scholar] [CrossRef]
- Scarpina, F. Detection and Recognition of Fearful Facial Expressions During the Coronavirus Disease (COVID-19) Pandemic in an Italian Sample: An Online Experiment. Front. Psychol. 2020, 11, 2252. [Google Scholar] [CrossRef]
- Antico, L.; Corradi-Dell’Acqua, C. Far from the eyes, far from the heart: COVID-19 confinement dampened sensitivity to painful facial features. Q. J. Exp. Physiol. (Hove) 2022, 17470218221094772. [Google Scholar] [CrossRef]
- Kendall, P.C.; Sheldrick, R.C. Normative data for normative comparisons. J. Consult. Clin. Psychol. 2000, 68, 767–773. [Google Scholar] [CrossRef] [PubMed]
- Mitrushina, M.; Boone, K.B.; Razani, J.; D’Elia, L.F. Handbook of Normative Data for Neuropsychological Assessment, 2nd ed.; Oxford University Press: Oxford, UK, 2005. [Google Scholar]


| Parameter | Mean | Standard Deviation | Range |
|---|---|---|---|
| Age (years) | 42.78 | 6.11 | 27–53 |
| Education (years) | 14 | 3.5 | 8–18 |
| Body mass index (kg/m2) | 49.58 | 8.98 | 38.85–69.18 |
| Waist circumference (cm) | 126.98 | 17.49 | 100.5–170 |
| Fat-free mass (%) | 42.59 | 5.56 | 31.6–49.1 |
| Fat mass (%) | 57 | 5.72 | 48.5–68.4 |
| Systolic pressure (mmHg) | 135.25 | 12.51 | 120–160 |
| Diastolic pressure (mmHg) | 83 | 8.8 | 70–100 |
| Heart rate (beats per minute) | 86.6 | 11.44 | 63–114 |
| Total cholesterol (mg/dL) | 186.7 | 33.02 | 120–247 |
| HDL cholesterol (mg/dL) | 47.05 | 7.34 | 39–74 |
| LDL cholesterol (mg/dL) | 122.00 | 29.11 | 66–177 |
| Triglycerides (mg/dL) | 131.9 | 41.76 | 55–207 |
| C-Reactive protein (mg/dL) | 1.52 | 1.29 | 0.1–4.8 |
| AST (mg/dL) | 24.55 | 15.32 | 13–67 |
| ALT (mg/dL) | 27.9 | 21.22 | 9–88 |
| Insulin (µU/mL) | 18.52 | 11.22 | 6.2–41.8 |
| Fasting glucose (mg/dL) | 102.50 | 13.62 | 87–129 |
| HbA1c (%) | 5.94 | 0.82 | 4.9–8.9 |
| Psychological General Wellbeing Index | |||
| Anxiety (min-max = 0–25) | 15.84 | 4.48 | 4–21 |
| Depression (min-max = 0–15) | 11.94 | 1.74 | 8–14 |
| Positive wellbeing (min-max = 0–20) | 9.89 | 2.8 | 6–15 |
| Self-control (min-max = 0–15) | 10.36 | 2.69 | 6–15 |
| General health (min-max = 0–15) | 8.42 | 3.35 | 3–15 |
| Vitality (min-max = 0–20) | 10.15 | 3.33 | 1–16 |
| Total score (min-max = 0–100) | 66.63 | 13.22 | 43–94 |
| Biochemical components | |||
| Cortisol (μg/dL) | 14.78 | 5.93 | 7.7–27.5 |
| Adrenaline (pg/mL) | 358.5 | 214.88 | 130–99 |
| Noradrenaline (pg/mL) | 79.6 | 29.97 | 36–138 |
| Dopamine (pg/mL) | 50.3 | 17.34 | 22–82 |
| Serotonin (ng/mL) | 95.32 | 60.97 | 3.06–254.6 |
| N = 19. | |||
| Consumption Frequency | |||
|---|---|---|---|
| fruit | <1 s/d | 1–2 s/d | >2 s/d |
| 46.6% | 40.0% | 13.3% | |
| vegetables | <1 s/d | 1–2 s/d | >2 s/d |
| 26.66% | 66.7% | 6.7% | |
| pulses | <1 s/w | 1–2 s/w | >2 s/w |
| 60.0% | 33.3% | 6.7% | |
| cereals | <1 s/d | 1–1.5 s/d | >1.5 s/d |
| 0% | 13.3% | 86.7% | |
| fish | <1 s/w | 1–2.5 s/w | >2.5 s/w |
| 40.0% | 53.3% | 6.7% | |
| meat and cured meats | <1 s/w | 1–1.5 s/w | >1.5 s/w |
| 0% | 66.7% | 33.3% | |
| dairy products | <1 s/d | 1–1.5 s/d | >1.5 s/d |
| 13.3% | 66.7% | 20.0% | |
| alcohol | <1 s/d | 1–2 s/d | >2 s/d |
| 100% | 0% | 0% | |
| olive oil | occasionally | frequently | regularly |
| 26.7% | 33.3% | 40.0% | |
| Mean | Standard Deviation | Range | Statistical Results | |
|---|---|---|---|---|
| Novelty-Seeking (min–max = 0–175) | 98.89 | 11.28 | 78–127 | t = 0.13; p = 0.89; 95% CI (−5.48; 6.26) |
| Harm Avoidance (min–max = 0–165) | 105.26 | 16.65 | 72–135 | t = 2.63; p = 0.008; 95% CI (2.26; 15.45) |
| Reward Dependence (min–max = 0–150) | 108.36 | 11.96 | 85–127 | t = 2.3; p = 0.02; 95% CI (1.03; 12.88) |
| Persistence (min–max = 0–175) | 119.84 | 18.01 | 89–157 | t = 0.96; p = 0.33; 95% CI (−3.37; 9.85) |
Publisher’s Note: MDPI stays neutral with regard to jurisdictional claims in published maps and institutional affiliations. |
© 2022 by the authors. Licensee MDPI, Basel, Switzerland. This article is an open access article distributed under the terms and conditions of the Creative Commons Attribution (CC BY) license (https://creativecommons.org/licenses/by/4.0/).
Share and Cite
Scarpina, F.; Turroni, S.; Mambrini, S.; Barone, M.; Cattaldo, S.; Mai, S.; Prina, E.; Bastoni, I.; Cappelli, S.; Castelnuovo, G.; et al. Gut Microbiota and Fear Processing in Women Affected by Obesity: An Exploratory Pilot Study. Nutrients 2022, 14, 3788. https://doi.org/10.3390/nu14183788
Scarpina F, Turroni S, Mambrini S, Barone M, Cattaldo S, Mai S, Prina E, Bastoni I, Cappelli S, Castelnuovo G, et al. Gut Microbiota and Fear Processing in Women Affected by Obesity: An Exploratory Pilot Study. Nutrients. 2022; 14(18):3788. https://doi.org/10.3390/nu14183788
Chicago/Turabian StyleScarpina, Federica, Silvia Turroni, Sara Mambrini, Monica Barone, Stefania Cattaldo, Stefania Mai, Elisa Prina, Ilaria Bastoni, Simone Cappelli, Gianluca Castelnuovo, and et al. 2022. "Gut Microbiota and Fear Processing in Women Affected by Obesity: An Exploratory Pilot Study" Nutrients 14, no. 18: 3788. https://doi.org/10.3390/nu14183788
APA StyleScarpina, F., Turroni, S., Mambrini, S., Barone, M., Cattaldo, S., Mai, S., Prina, E., Bastoni, I., Cappelli, S., Castelnuovo, G., Brigidi, P., Scacchi, M., & Mauro, A. (2022). Gut Microbiota and Fear Processing in Women Affected by Obesity: An Exploratory Pilot Study. Nutrients, 14(18), 3788. https://doi.org/10.3390/nu14183788