Article

Quantitative Structure–Activity Relationship Analysis of Isosteviol-Related Compounds as Activated Coagulation Factor X (FXa) Inhibitors

by
Marcin Gackowski
1,*,
Karolina Szewczyk-Golec
2,*,
Katarzyna Mądra-Gackowska
3,
Robert Pluskota
1 and
Marcin Koba
1
1
Department of Toxicology and Bromatology, Faculty of Pharmacy, L. Rydygier Collegium Medicum in Bydgoszcz, Nicolaus Copernicus University in Torun, A. Jurasza 2 Street, PL–85089 Bydgoszcz, Poland
2
Department of Medical Biology and Biochemistry, Faculty of Medicine, L. Rydygier Collegium Medicum in Bydgoszcz, Nicolaus Copernicus University in Torun, Karłowicza 24 Street, PL–85092 Bydgoszcz, Poland
3
Department of Geriatrics, Faculty of Health Sciences, L. Rydygier Collegium Medicum in Bydgoszcz, Nicolaus Copernicus University in Torun, Skłodowskiej Curie 9 Street, PL–85094 Bydgoszcz, Poland
*
Authors to whom correspondence should be addressed.
Nutrients 2022, 14(17), 3521; https://doi.org/10.3390/nu14173521
Submission received: 10 August 2022 / Revised: 19 August 2022 / Accepted: 22 August 2022 / Published: 26 August 2022
(This article belongs to the Special Issue Specialized Diet, Obesity and Associated Metabolic Diseases)

Abstract

:
Stevioside, one of the natural sweeteners extracted from stevia leaves, and its derivatives are considered to have numerous beneficial pharmacological properties, including the inhibition of activated coagulation factor X (FXa). FXa-PAR signaling is a possible therapeutic target to enhance impaired metabolism and insulin resistance in obesity. Thus, the goal of the investigation was a QSAR analysis using multivariate adaptive regression splines (MARSplines) applied to a data set of 20 isosteviol derivatives bearing thiourea fragments with possible FXa inhibitory action. The best MARS submodel described a strong correlation between FXa inhibitory activity and molecular descriptors, such as: B01[C-Cl], E2m, L3v, Mor06i, RDF070i and HATS7s. Five out of six descriptors included in the model are geometrical descriptors quantifying three-dimensional aspects of molecular structure, which indicates that the molecular three-dimensional conformation is of high significance for the MARSplines modeling procedure and obviously for FXa inhibitory activity. High model performance was confirmed through an extensive validation protocol. The results of the study not only confirmed the enhancement in pharmacological activity by the presence of chlorine in a phenyl ring, but also, and primarily, may provide the basis for searching for new active isosteviol analogues, which may serve as drugs or health-beneficial food additives in patients suffering from obesity and comorbidities.

Graphical Abstract

1. Introduction

Terpenoids belong to the largest class of structurally diverse secondary metabolites present in plants, exerting a variety of diverse pharmacological effects [1]. A widely used representative of this class of natural products, especially for its intense sweetness (about 300-times sweeter than regular sugar), is stevioside, a diterpenoid glycoside derived from Stevia rebaudiana Bertoni. Steviol glycosides are composed of a diterpene ent-kaurene core (steviol), linked to one or more glucose units. Stevia leaves have been utilized by Paraguayan Indians for centuries to sweeten Mate tea. Both stevia extract and stevioside have been known for their healthy properties by local people in South America and used in traditional medicine for centuries. Numerous studies have confirmed various therapeutic benefits of rebaudioside A (a related compound) and stevioside and its metabolic components, such as steviol and isosteviol [2,3]. These medical properties include antitumor, antidiarrheal, antihyperglycemic, antihypertensive, anti-inflammatory, diuretic and immunomodulatory activities. The aforementioned effects have driven many researchers to synthetize diverse derivatives of both stevioside and its aglycon steviol [2,4]. Stevioside has been authorized as a food additive in many countries, for instance, Japan, Korea, Brazil, the United States and the European Union [2,5]. It should be emphasized that stevioside and the products of its hydrolysis, i.e., steviol and isosteviol (ISV), are non-toxic, especially at low doses [6].
Acidic hydrolysis of stevioside affords a structural isomer of steviol, a tetracyclic diterpenoid isosteviol (ISV). Isosteviol-related compounds, possessing an ent-beyerane skeleton, have aroused interest because of their numerous pharmacological effects, including antibacterial, anticancer, anti-inflammatory, glucocorticoid agonist and cardioprotective properties [1,6]. Regarding examples of anticancer activity, Mizushina et al. [7] reported that ISV strongly repressed mammalian DNA polymerases and human DNA topoisomerase II. Moreover, in this study, ISV precluded the growth of human cancer cells, with LD50 values of 84–167 µM. In addition to this, 500 µg of ISV caused a noticeable decrease in 12-O-tetradecanoylphorbol-13-acetate (TPA)-induced inflammation (a repressive effect of 53.0%). Accordingly, Takasaki and coworkers reported that isosteviol displayed significant inhibitory activity in a two-step carcinogenesis assay, where TPA and 7,12-dimethylbenz[α]anthracene (DMBA)-induced mouse skin was used [8]. Interestingly, Al-Dhabi et al. [9] investigated in vitro antibacterial, antibiofilm, anticancer, antifungal and antioxidant properties of ISV. The studied compound showed efficacy against bacteria, such as Staphylococcus aureus, Staphylococcus epidermidis and Klebsiella pneumoniae, as well as against Aspergillus niger, Candida albicans and Trichophyton mentagrophytes. ISV also displayed reasonably better antibiofilm activity against Escherichia coli, Salmonella typhi and Pseudomonas aeruginosa. What is more, it showed substantial antioxidant properties and anticancer activity against Vero and MCF7 cell lines. The cardiovascular actions of isosteviol include, among other things, vasodilatation, decreasing cellular reactive oxygen species (ROS) generation and subsequent repressive effects on angiotensin-II-induced cell proliferation and endothelin-1 secretion, protective effect against the development of cardiac hypertrophy through the regulation of transient outward potassium and L-type calcium channels, improvement in H9c2 cardiomyocyte viability, restoring mitochondrial membrane potential and inhibition of cell apoptosis [6]. In addition, a study by Nordenoft et al. [10] proved antidiabetic actions of isosteviol—ISV improved glucose and insulin sensitivity in genetically obese diabetic KKay mice. What is more, it improved the lipid profile and upregulated the gene expression of key beta-cell genes, inter-alia insulin regulatory transcription factors. Thus, ISV could be considered in the prevention of obesity complications.
Obesity is a multifactorial metabolic disease characterized by complexity and chronicity (ICD-10 code E66). In recent decades, its prevalence has reached epidemic proportions, affecting almost 20% of the population worldwide [11]. This entity is mainly classified with body mass index (BMI, kg/m2) and adults with a BMI of 30 kg/m2 and above are considered to suffer from obesity. Unfortunately, obesity is viewed through the prism of the associated pathologies rather than an individual entity and, for that reason, it is often underdiagnosed or inadequately treated. The role of obesity in the development of other noncommunicable chronic diseases, such as dyslipidemia, type 2 diabetes mellitus, hypertension, cardiovascular diseases and cancer, has been well established [12]. It should be noticed that obesity is the second-most-common preventable cause of cancer. At the same time, it possibly constitutes the most common preventable cause of cancer in non-smokers [13].
The abovementioned non-caloric sweeteners used as alternatives to sucrose have attracted huge attention, not only due to a high incidence of obesity, but also diabetes and dental caries. There is constant demand for low-calorie drinks and food. They are widely used in diets for diabetics and phenylketonuria patients and diets aimed at weight loss in obese individuals. What is more, a multitude of possible biological actions of the analogues in the structure of stevioside may potentially enable the use of these compounds as drugs or food additives, playing an important role not only in weight loss, but also in reducing infectious diseases, enhancing cardiovascular protection and slowing the progress of various oxidative-stress-related diseases, diabetes and cancer. In other words, steviol-related compounds may be beneficial for individuals suffering from obesity and comorbidities.
In the present contribution, a series of isosteviol derivatives synthetized and evaluated for activated coagulation factor X (FXa) inhibitory activity by Shi et al. [14] was subjected to molecular modelling studies. In their study, Hayashi et al. [15] revealed a previously unknown role of activated coagulation factor Xa- protease-activated receptor (FXa-PAR) signaling in developing brown adipose tissue (BAT) dysfunction and systemic metabolic disorder in a murine dietary obese model. However, when an FXa inhibitor was administered, it alleviated BAT whitening, enhanced thermogenic response and systemic glucose intolerance upon dietary obesity. Moreover, ROS levels were reduced in BAT. In this light, the suppression of FXa-PAR1 signaling could become a new therapeutic target for the pharmacotherapy of obesity and diabetes. For this reason, this pilot study was conducted on twenty isosteviol derivatives bearing thiourea fragments to establish a mathematical model that may be used for the prediction of FXa inhibitory activity of new potential isosteviol derivatives beneficial for obese patients.

2. Materials and Methods

2.1. Isosteviol Analogues

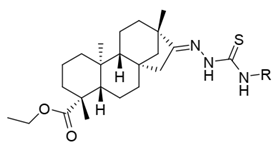
Molecular modeling studies were carried out on the basis of the data on the structure of twenty novel isosteviol ((4α,8β,13β)-13–Methyl-16-oxo-17-norkauran-18-oic acid) derivatives bearing thiourea fragments and FXa inhibitory activity evaluated by Shi et al. [14]. Chemical structures and pharmacological activity are presented in Table 1.

2.2. Geometry Optimization and Structural Descriptors

Optimization was accomplished using semiempirical calculation with molecular mechanics (MM+) and Austin Model 1 (AM1) force fields as implemented in HyperChem 8.0 (Hypercube Inc., Gainesville, FL, USA). The geometry of each compound was smoothly optimized with the MM+ molecular mechanics method and the resulting structure became an initial structure for the AM1 semiempirical method with the application of the Polak–Ribiere algorithm to a maximum energy gradient of 0.01 kcal (Å⋅mol)−1. The optimization was performed for up to 30,000 steps. Calculation of molecular descriptors was performed using Dragon 7 (Talete, Milano, Italy) software. This software is able to calculate numerous molecular descriptors that are grouped into 29 logical blocks [16]. In total, over 4800 descriptors provided by Dragon 7 were subjected to a statistical analysis.

2.3. Statistical Analysis

The analysis is based on the following data: descriptors encoding molecular properties of a particle and the values of the negative decimal logarithm of the half-maximal inhibitory concentration (IC50) denoting FXa inhibitory activity, obtained from the literature data. Statistica 13.3 software (StatSoft, Cracow, Poland) was used for the purpose of the statistical analysis. Raw data comprising 4885 descriptors (acting as independent variables) and negative decimal logarithm values of the IC50 (pIC50, dependent variable) underwent a process of standardization and pre-selection. In this step, 1971 descriptors with constant and near constant values, with standard deviation less than 0.0001 and with at least one missing value were excluded. The analyses were conducted at the 5% significance level (α = 0.05). The whole set of isosteviol-related compounds was divided into a training and a test set on the basis of random sample selection in STATISTICA 13.3 Data Miner (StatSoft, Cracow, Poland). Building quantitative structure–activity relationship (QSAR) models involved applying a multivariate adaptive regression splines (MARSplines) algorithm, as implemented in STATISTICA 13.3 Data Miner. Initial evaluation of elaborated submodels led to the selection of a theoretical model suitable for predictive purposes. This assessment was performed on the basis of basic validation parameters calculated for each model (R2, Q2, MAE) [17], explained in Section 2.5, which provided minimal but satisfactory information about model performance.

2.4. MARSplines Analysis

Multivariate Adaptive Regression Splines (MARS) is an adaptive procedure for regression, capable of solving regression and classification problems. It is a relevant tool for solving high-dimensional problems, such as a large number of inputs. The non-parametric procedure requires no assumptions about the functional association between dependent and independent variables. The algorithm models a relationship with a set of coefficients and basis functions generated only from the data [18] and is also an in-built functionality of STATISTICA 13.3 Data Miner. Defined parameters in the MARSplines analysis are presented in Table 2. A detailed description of the whole procedure can be found in the study of Gackowski et al. [19], where this technique was successfully applied to predict the antitumor activity of anthrapyrazole derivatives.

2.5. Model Validation

The model-building process using the MARSplines procedure usually provides a portfolio of submodels differing in the maximum number of basis functions and the degree of interactions, as well as their predictive power. In the initial model validation, following indices are calculated: the determination coefficient, cross-validated determination coefficient and mean absolute error in order to choose a suitable one for the prediction of inhibition activity against FXa of isosteviol-related compounds under study [17,20].
R 2 = 1 ( Y o b s Y c a l ) 2 ( Y o b s Y ¯ t r a i n i n g ) 2
The coefficient of determination R2 (Equation (1)) is a measure of the variation in observed data with the predicted ones. So-called perfect correlation is noticed when R2 approaches 1. Yobs represents observed response values for the training set and Ycalc represents the calculated response values for the training set of compounds. Ytraining is the mean observed response of the training set of compounds [17,20].
Q 2 ( o r Q L O O 2 ) = 1 ( Y o b s ( t r a i n i n g ) Y p r e d ( t r a i n i n g ) ) 2 ( Y o b s ( t r a i n i n g ) Y ¯ ( t r a i n i n g ) ) 2
The squared leave-one-out cross-validation correlation coefficient for the modeling set (Q2) is presented in Equation (2), where Yobs(training) is the observed response and Ypred (training) is the predicted response in the training set of compounds based on the leave-one-out (LOO) technique. The model is considered acceptable if Q2 exceeds 0.5 [17,20].
M A E = | Y o b s Y p r e d | n
The mean absolute error (MAE) (Equation (3)) is an index for the linear relationship between predicted (Ypred) and observed (Yobs) data. It is regarded as superior to the root mean square error (RMSE) because the lack of the squared term in the formula of MAE provides an equal weight for all errors. Thus, MAE is considered a simple and more straightforward determinant of prediction errors in the context of predictive modeling studies [17,20].
The best submodel, chosen for predictive purposes on the basis of abovementioned parameters, underwent full validation procedure with the parameters as follows: R2, Q2, QF12, QF22, QF32, CCC, ∆rm2, r m 2 ¯ , PRES, SDEP and MAE, which were calculated according to Roy et al. [20].

3. Results

More than 4800 molecular descriptors were derived for geometrically optimized structures using Dragon software, which were used as independent variables to build a model predicting the FXa inhibitory activity of twenty isosteviol analogues (for chemical structures and pharmacological activity, see Table 1).

3.1. Geometry Optimization

The molecular modeling study was based on 20 isosteviol-related compounds, which in the first stage, were subjected to geometry optimization. Samples of 3D structures of studied compounds with defined geometry are presented in Figure 1.

3.2. Statistical Analysis

The development of the equation in the process of model building revealed a set of relevant variables, i.e., B01[C-Cl], E2m, L3v, Mor06i, RDF070i and HATS7s, which are presented in Table 3.

3.2.1. Model Building and Prediction of pIC50 Values

The predictive quantitative structure–activity relationship model was built using the MARS algorithm. MARS built a portfolio of models using a training set of compounds, whose properties were coded as 2914 descriptors as possible predictors to predict FXa inhibitory activity denoted as pIC50. The degree of interaction was set to 3, which led to an incorporation of linear, second- and third-order splines into the submodels, while the maximum number of basis functions was set to 40. Finally, the best MARS submodel was chosen on the basis of validation parameters as mentioned in the Section 2.3. The predictive model comprises six descriptors, characterized in Table 4.
The quantitative structure–activity relationship MARS model is composed of quite a few interactions between molecular properties represented by descriptors as independent variables. The model begins with the constant function B0 and in subsequent steps, functions (Bm) giving the best learning system fit for the current residual are added to the model according to Equation (4):
p I C 50 = B 0 + m = 1 6 a m B m
The elaborated MARS model contains six splines composed of single-basis functions (B1B6). Although high-order basis functions are present in some created models, they do not appear in the predictive submodel. All basis functions (B0B6) and their coefficients am that form the QSAR model are presented in Table 5.
All the descriptors incorporated into the best submodel have an equal contribution, denoted as the number of appearances in a basis function (see Table 4). However, five out of six descriptors describe the molecule’s three-dimensional geometrical properties (two WHIM descriptors, 3D-MoRSE descriptor, RDF descriptor and GETAWAY descriptor) and one descriptor, i.e., a representative of 2D Atom Pairs describes the way a property is distributed along the topological structure. The block of most significance is Weighted Holistic Invariant Molecular descriptors (with a contribution of 33%), which represent a different source of chemical information [21].

3.2.2. Validation and Selection of the Predictive Submodel

The MARS nonparametric procedure allowed for the establishment of a portfolio of QSAR submodels and a subsequent analysis of calculated validation parameters led to the selection of the submodel that best describes the quantitative structure–activity relationship and may be employed to predict the FXa inhibitory activity of thiourea ISV derivatives (see Table 6). The selected MARS model is characterized by the first degree of interaction and is composed of six basis functions. For this model, a perfect correlation was observed, as shown by the highest determination coefficient (R2). The squared leave-one-out cross-validation correlation coefficient exceeded the threshold of 0.5 and the lowest mean absolute error amongst all submodels was obtained (see Table 6). For the best MARS submodel, the preliminary validation was extended in order to confirm its performance. For this purpose, a full validation protocol, typical for QSAR models, was fulfilled, as described by Roy et al. [20] (see Table 7). Considering the above features along with a relatively small set of compounds submitted to the study, it should be noted that the predictive power of the obtained MARS model was relatively high.

3.3. Values of Predicted Data

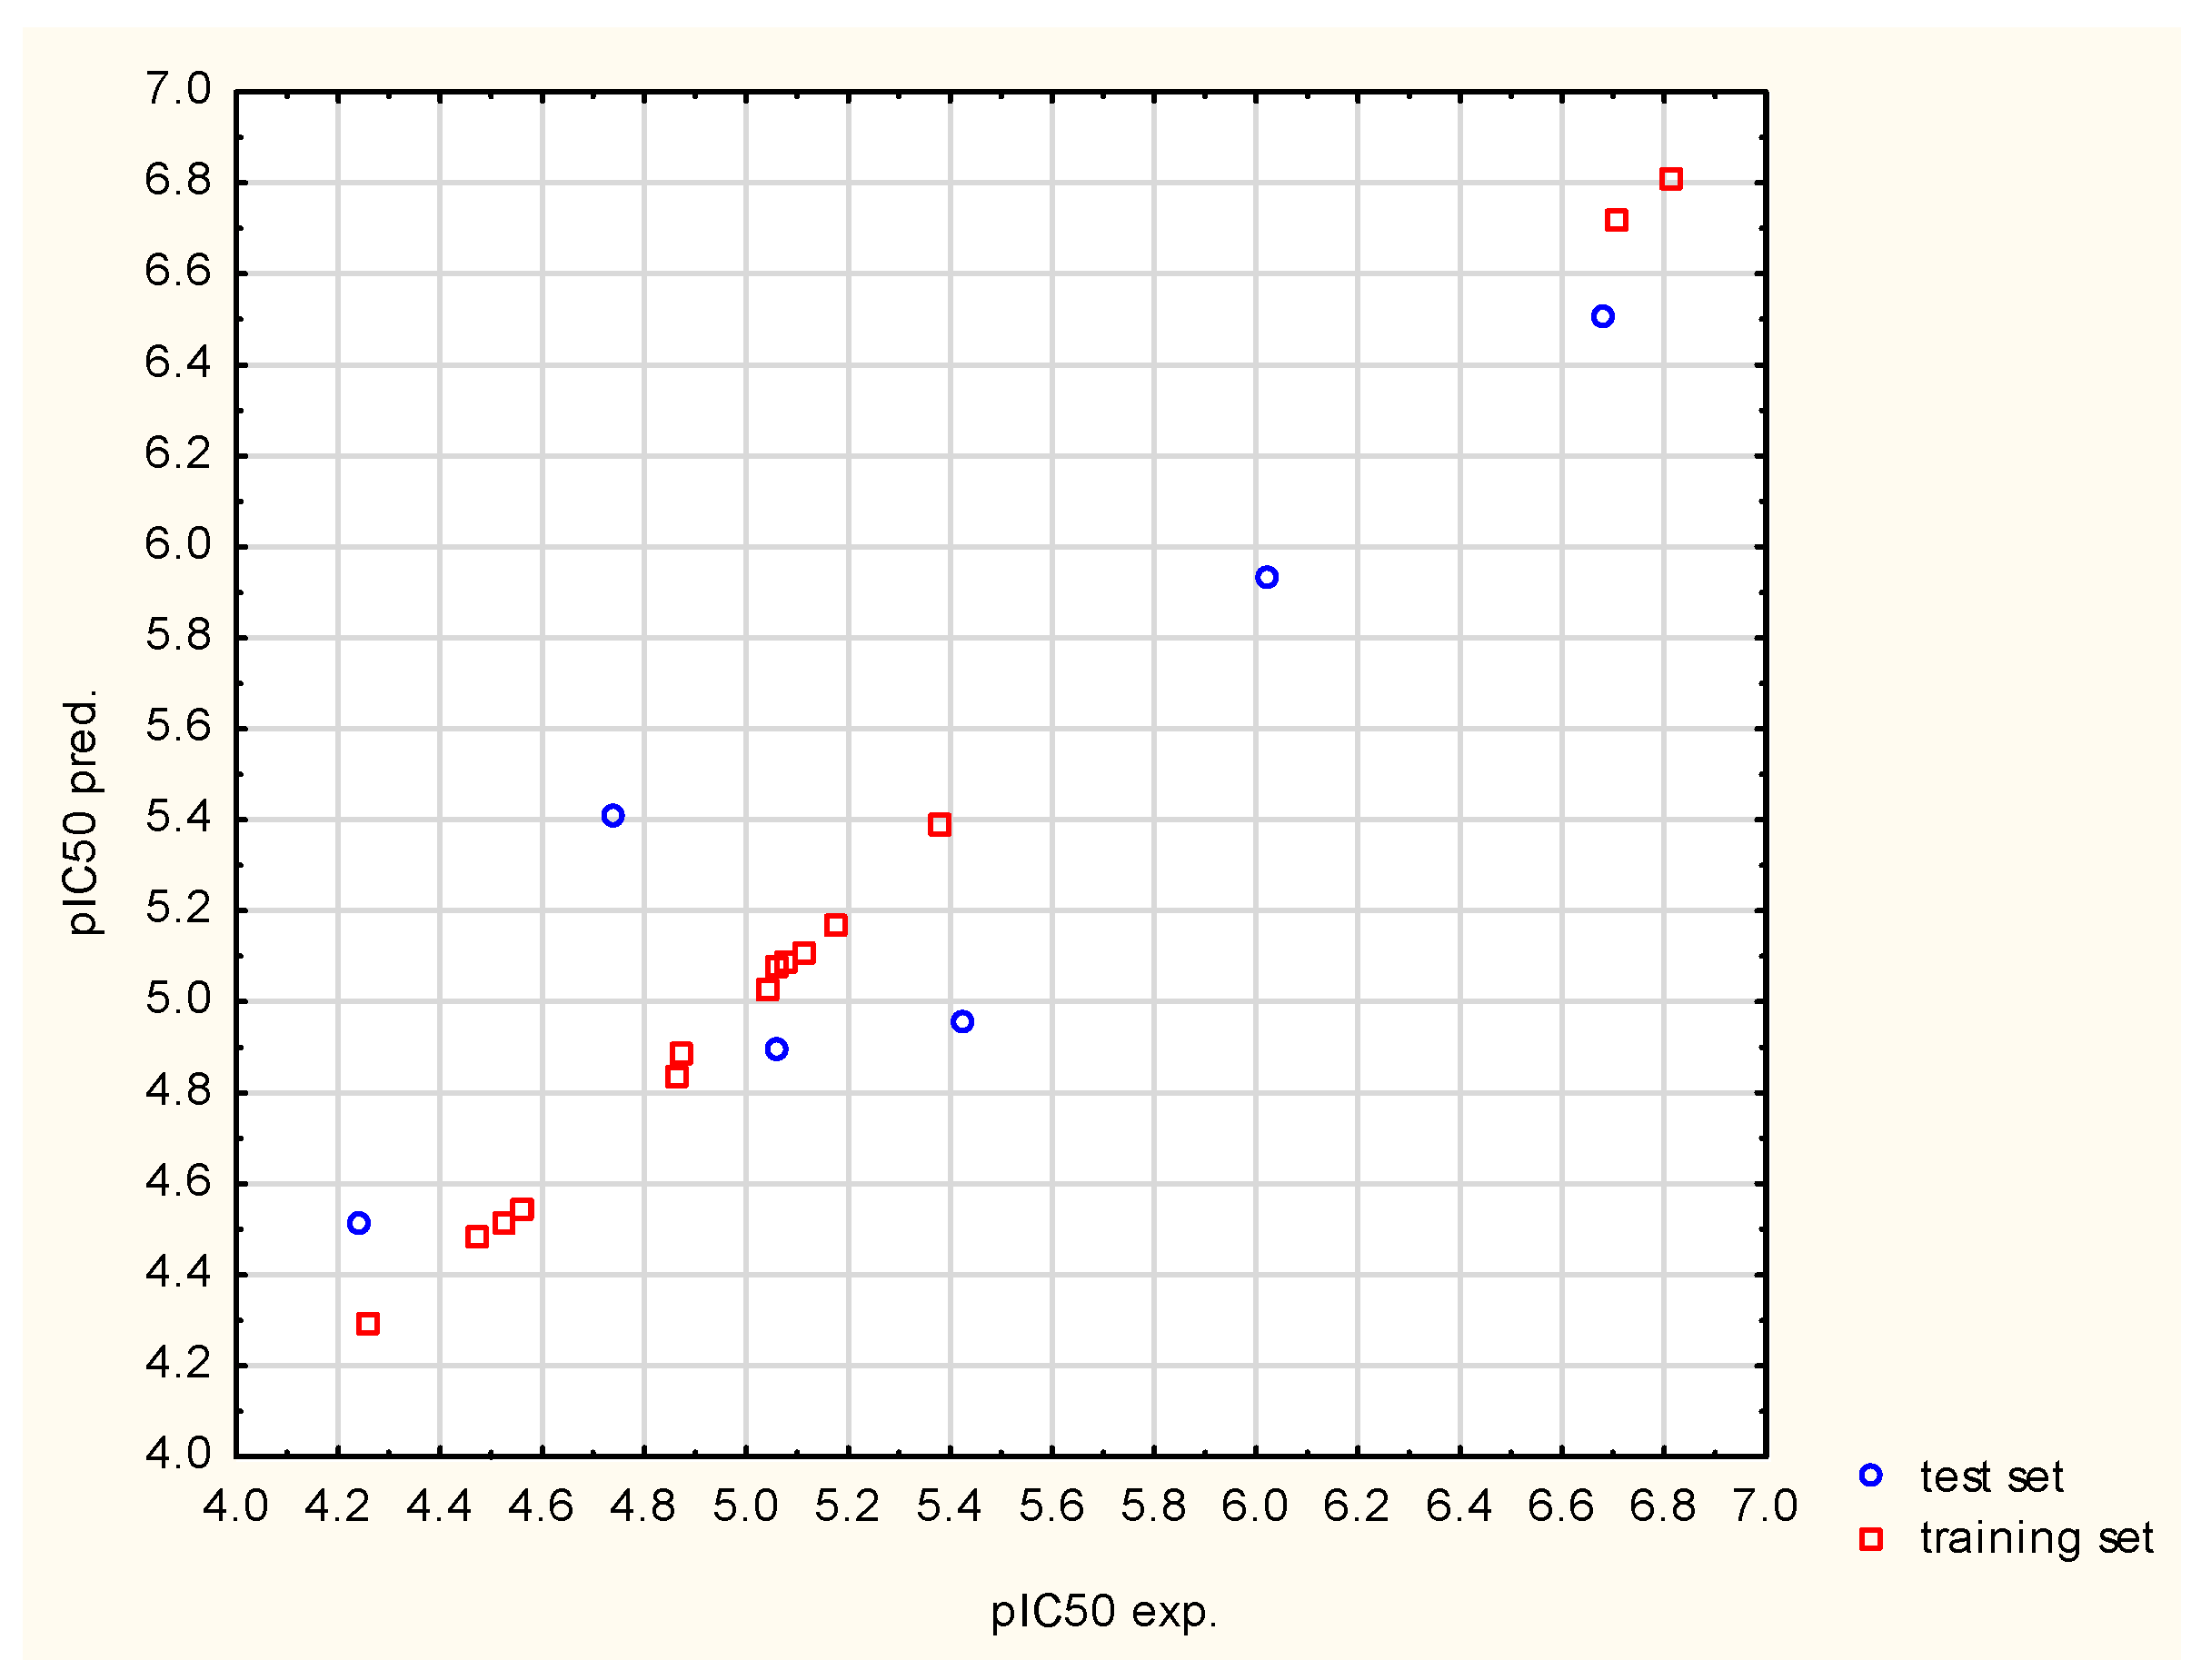
Values of pIC50 ( p I C 50 c a l c ) computed by the elaborated model were compared with the experimental data ( p I C 50 e x p ) in the scatter plot, where a positive relationship is shown (see Figure 2). It can be seen that there is a greater scatter in the experimental data with respect to those determined from the model within the test set (mainly in the middle of the scatter plot) than in the case of the training set.

4. Discussion

Currently, obesity is a serious problem for many societies and its prevalence is increasing worldwide. It is related to a pro-coagulant state, which results in the development of numerous comorbidities, for instance, atherosclerotic disease. Coagulation factor X (FX) is involved in the coagulation cascade, which has become the main target of anticoagulant therapy. Activated FX (FXa) exerts pleiotropic biological activities, mediated through protease-activated receptor (PAR) signaling. Hayashi et al. [15] showed that coagulation factors and protease-activated receptor 1 (PAR1) are upregulated in BAT under metabolic stress. PAR1 is a prevalent form in BAT and coagulation factor-PAR1-mediated signaling contributes to a functional decline in this tissue by excessive mitochondrial production of ROS, resulting in systemic glucose intolerance in a mouse model of diet-induced obesity. According to this study, inhibition of coagulation factor-PAR1 signaling in BAT alleviates metabolic dysfunction [15]. Kaur et al. [22] investigated the involvement of the intestinal FXa-PAR2 axis in the regulation of diet-induced obesity in a murine model. Their results suggested that FXa-PAR2 signaling in the intestinal epithelium is an important factor in the regulation of postprandial glucose-dependent insulinotropic polypeptide (GIP) and early onset obesity. In view of the above observations, new therapies for the treatment of obesity and obesity-related disorders are urgently needed and new FXa inhibitors have enormous potential to be used as drugs or possible food additives.
The application of the multivariate adaptive regression splines procedure for model building in the present molecular modelling study led to the establishment of a portfolio of eight QSAR submodels (see Table 6). It should be noted that five out of eight submodels meet the initial validation requirements and may be used for the prediction of FXa inhibitory activity of isosteviol derivatives bearing thiourea fragments. The submodel that best describes the quantitative structure–activity relationship was selected for predictive purposes. Its precision, accuracy and predictability were additionally confirmed through an extended validation protocol (see Table 7). However, analysis of Figure 2 reveals that there is a greater scatter in the experimental data with respect to those determined from the model within the test than in the case of the training set. This is normal and is due to the fact that the test data were not used during the model training phase. Observed differences between experimental and calculated values are acceptable because validation parameters are within the limits described in the literature (see Table 6). Additionally, it can be noticed that the experimental and calculated values that are oscillating around the straight line represent the complete correlation. This indirectly proves that the residuals in the model values oscillate around the experimental values, which is an expected phenomenon. What attracts great attention is the simplicity of the resulting model, since it incorporates only six basis functions and first-degree interactions. This fact is strongly connected with the algorithm’s operation principle because the relationship is modeled solely on the basis of data, which, in this case, are a set of only twenty compounds [18]. Moreover, an equal contribution of variables to the model, denoted as the number of appearances in a basis function, is observed (see Table 4). In order to explore which molecular properties affect the studied activity the most, it is necessary to analyze the nature and number of individual descriptors forming the QSAR model. The following classes of descriptors may be distinguished: 2D Atom Pairs, Weighted Holistic Invariant Molecular (WHIM) descriptors, 3D-MoRSE (Molecular Representation of Structures based on Electron diffraction) descriptors, Radial Distribution Function (RDF) descriptors and GETAWAY (Geometry, Topology, and Atom-Weights Assembly) descriptors. Interestingly, five out of six predictive descriptors encode the molecule’s 3D geometrical properties (two WHIM descriptors, 3D-MoRSE descriptor, RDF descriptor and GETAWAY descriptor) and the last descriptor, i.e., a representative of 2D Atom Pairs, describes the way a property is distributed along the topological structure.
The representative of 2D Atom Pairs, i.e., B01[C-Cl], is the first to appear in the established QSAR model. This class of substructure descriptors, applicable to any pair of atoms and bond types between them, is founded on a two-dimensional representation of a molecule. Those descriptors frequently are Boolean variables encoding the presence or absence of a particular atom pair in each molecule [23]. The B01[C-Cl] descriptor included in the model is based on counting a chlorine atom in an individual compound and has a positive impact on FXa inhibitory activity. It should be noted that the reported phenomenon is consistent with the results of a study conducted by Shi et al. [14], in which the positive impact of the introduction of a chlorine atom on the inhibitory activity of studied compounds was also emphasized. The introduction of electron-donating groups into the phenyl ring had a negative influence on FXa inhibitory activity, but the introduction of the chlorine atom had the exact opposite effect.
Weighted holistic invariant molecular descriptors contain global and directional information and are estimated by a principal component analysis on Cartesian coordinates of the atoms weighted in different ways. They encode relevant molecular 3-dimensional information concerning molecular size, shape, symmetry, and atom distribution with respect to invariant reference frames [21]. There are two types of WHIM descriptors (E2m and L3v) incorporated into the obtained model, with their largest cumulative contribution as about 33%. L3v reflects the size of the molecule, whereas E2m is a variable encoding atomic distribution.
3D-MoRSE (Molecular Representation of Structures based on Electron diffraction) descriptors were designed for encoding the 3D structure of a molecule by a fixed number of variables. Despite the fact that descriptors from this block comprise information pertaining to the whole molecule, they are defined mainly by short-distance atom pairs [24]. Descriptor Mor06i is a signal 06/weighted by ionization potential, which, in the case of the studied compounds, may increase contributions of chlorine.
Radial distribution function descriptors with RDF070i, included in the elaborated model, are based on the distance distribution in the geometrical representation of a molecule and constitute a radial distribution function code, which exhibits similar characteristics as the 3D-MoRSE code. In addition to information about interatomic distances of a whole molecule, they contain information on bond distances, ring types, planar and nonplanar systems and atom types. RDF descriptors are unique, concerning the three-dimensional arrangement of the atoms, invariable against the translation and rotation of the entire molecule and independent of the number of atoms [25,26]. In this study, the presence of the RDF070i descriptor in the QSAR model suggests a certain dependence between FXa inhibitory activity of thiourea isosteviol analogues and the 3D distribution of ionization potential.
The last variable belongs to GETAWAY descriptors. This block of descriptors has been proposed in order to match 3D-molecular geometry, atom relatedness and chemical information with the use of various atomic weighting schemes. These descriptors are a source of local or/and distributed information on molecular structure [27]. The HATS7s descriptor, which is included in the resulting model, is calculated from the leverage matrix, obtained by the centered atomic coordinates and related to intrinsic properties of an individual molecule.
To summarize, the accomplished model contains one 2D and five 3D descriptors, which suggests that the molecular 3D conformation is very important for the MARSplines modeling process and, as a consequence, for FXa inhibitory activity. In addition, what should be emphasized is the joint use of GETAWAY and WHIM descriptors, with a cumulative share in the model of 50%. This combination of variables provides more predictive models, especially in the case of biological activities, as suggested by Consonni et al. [27]. The elaborated model has a very high application value, confirmed by an extensive validation protocol and, for that reason, it may be employed to predict FXa inhibitory activity of new isosteviol analogues bearing thiourea fragments. In light of this fact, the MARSplines procedure presented in this study may become either a part of a computer-aided drug design or a QSAR strategy for searching new health-beneficial food additives.

5. Conclusions

A set of isosteviol thiourea derivatives was subjected to a molecular modeling study and an approach of MARSplines was employed for predicting FXa inhibitory activity. The developed QSAR model reveals information about the importance of the presence of chlorine atoms (B01[C-Cl]), the uniform distribution of the atomic mass (E2m), the molecular volume (L3v), the 3D molecular distribution of ionization potential (Mor06i and RDF070i) and the intrinsic properties of a molecule (HATS7s). Five out of six descriptors are geometrical descriptors quantifying three-dimensional aspects of molecular structure. Despite a relatively small set of studied compounds, the high application value of the obtained model was confirmed through an extensive validation protocol typical of QSAR models. Consequently, all calculated validation coefficients reflect the predictive power of regression. As FXa-PAR signaling is a possible therapeutic target to enhance impaired metabolism and insulin resistance in obesity, the predictive model may represent a valuable tool in searching for new active isosteviol analogues. Finally, the results of the present study confirmed an enhancement in pharmacological activity of isosteviol analogues by the presence of chlorine in the phenyl ring. Nevertheless, future studies are necessary to investigate the influence of a wider variety of substituents.

Author Contributions

Conceptualization, M.G. and K.S.-G.; methodology, M.G. and R.P.; validation, R.P. and M.G.; formal analysis, M.G. and K.S.-G.; investigation, M.G. and K.M.-G.; resources, M.G. and M.K.; data curation, M.G.; writing—original draft preparation, M.G.; writing—review and editing, M.G, K.M.-G. and K.S.-G.; visualization, K.M.-G.; supervision, M.K.; project administration, M.G.; funding acquisition, K.S.-G. All authors have read and agreed to the published version of the manuscript.

Funding

This research received no external funding.

Institutional Review Board Statement

Not applicable.

Informed Consent Statement

Not applicable.

Data Availability Statement

Not applicable.

Acknowledgments

Not applicable.

Conflicts of Interest

The authors declare no conflict of interest.

References

  1. Ozsvár, D.; Nagy, V.; Zupkó, I.; Szakonyi, Z. Synthesis and Biological Application of Isosteviol-based 1,3-aminoalcohols. Int. J. Mol. Sci. 2021, 22, 11232. [Google Scholar] [CrossRef] [PubMed]
  2. Chatsudthipong, V.; Muanprasat, C. Stevioside and Related Compounds: Therapeutic Benefits beyond Sweetness. Pharmacol. Ther. 2009, 121, 41–54. [Google Scholar] [CrossRef] [PubMed]
  3. Hanson, J.R.; De Oliveira, B.H. Stevioside and Related Sweet Diterpenoid Glycosides. Nat. Prod. Rep. 1993, 10, 301–309. [Google Scholar] [CrossRef] [PubMed]
  4. Moons, N.; De Borggraeve, W.; Dehaen, W. Stevioside and Steviol as Starting Materials in Organic Synthesis. Curr. Org. Chem. 2012, 16, 1986–1995. [Google Scholar] [CrossRef]
  5. Corporate Authors. EC Regulation No. 231/2012, C.R. Commission Regulation (EU) No 231/2012. Off. J. Eur. Union 2012, 55, 1–295. [Google Scholar]
  6. Wang, M.; Li, H.; Xu, F.; Gao, X.; Li, J.; Xu, S.; Zhang, D.; Wu, X.; Xu, J.; Hua, H.; et al. Diterpenoid Lead Stevioside and Its Hydrolysis Products Steviol and Isosteviol: Biological Activity and Structural Modification. Eur. J. Med. Chem. 2018, 156, 885–906. [Google Scholar] [CrossRef]
  7. Mizushina, Y.; Akihisa, T.; Ukiya, M.; Hamasaki, Y.; Murakami-Nakai, C.; Kuriyama, I.; Takeuchi, T.; Sugawara, F.; Yoshida, H. Structural Analysis of Isosteviol and Related Compounds as DNA Polymerase and DNA Topoisomerase Inhibitors. Life Sci. 2005, 77, 2127–2140. [Google Scholar] [CrossRef]
  8. Takasaki, M.; Konoshima, T.; Kozuka, M.; Tokuda, H.; Takayasu, J.; Nishino, H.; Miyakoshi, M.; Mizutani, K.; Lee, K.H. Cancer Preventive Agents. Part 8: Chemopreventive Effects of Stevioside and Related Compounds. Bioorg. Med. Chem. 2009, 17, 600–605. [Google Scholar] [CrossRef]
  9. Abdullah Al-Dhabi, N.; Valan Arasu, M.; Rejiniemon, T.S. In Vitro Antibacterial, Antifungal, Antibiofilm, Antioxidant, and Anticancer Properties of Isosteviol Isolated from Endangered Medicinal Plant Pittosporum Tetraspermum. Evid.-Based Complement. Altern. Med. 2015, 2015, 164261. [Google Scholar] [CrossRef]
  10. Nordentoft, I.; Jeppesen, P.B.; Hong, J.; Abudula, R.; Hermansen, K. Isosteviol Increases Insulin Sensitivity and Changes Gene Expression of Key Insulin Regulatory Genes and Transcription Factors in Islets of the Diabetic KKAy Mouse. Diabetes Obes. Metab. 2008, 10, 939–949. [Google Scholar] [CrossRef]
  11. Yumuk, V.; Tsigos, C.; Fried, M.; Schindler, K.; Busetto, L.; Micic, D.; Toplak, H. European Guidelines for Obesity Management in Adults. Obes. Facts 2015, 8, 402–424. [Google Scholar] [CrossRef] [PubMed]
  12. Carretero Gómez, J.; Ena, J.; Arévalo Lorido, J.C.; Seguí Ripoll, J.M.; Carrasco-Sánchez, F.J.; Gómez-Huelgas, R.; Pérez Soto, M.I.; Delgado Lista, J.; Pérez Martínez, P. Obesity Is a Chronic Disease. Positioning Statement of the Diabetes, Obesity and Nutrition Workgroup of the Spanish Society of Internal Medicine (SEMI) for an Approach Centred on Individuals with Obesity. Rev. Clínica Española 2021, 221, 509–516. [Google Scholar] [CrossRef] [PubMed]
  13. Lazarus, E.; Bays, H.E. Cancer and Obesity: An Obesity Medicine Association (OMA) Clinical Practice Statement (CPS). Obes. Pillars 2022, 2022, 100026. [Google Scholar] [CrossRef]
  14. Shi, Y.; Pan, B.W.; Li, W.C.; Wang, Q.; Wu, Q.; Pan, M.; Fu, H.Z. Synthesis and Biological Evaluation of Isosteviol Derivatives as FXa Inhibitors. Bioorg. Med. Chem. Lett. 2020, 30, 126585. [Google Scholar] [CrossRef]
  15. Hayashi, Y.; Shimizu, I.; Yoshida, Y.; Ikegami, R.; Suda, M.; Katsuumi, G.; Fujiki, S.; Ozaki, K.; Abe, M.; Sakimura, K.; et al. Coagulation Factors Promote Brown Adipose Tissue Dysfunction and Abnormal Systemic Metabolism in Obesity. iScience 2022, 25, 104547. [Google Scholar] [CrossRef]
  16. Talete SRL List of Molecular Descriptors Calculated by Dragon. Available online: http://www.talete.mi.it/products/dragon_molecular_descriptor_list.pdf (accessed on 4 July 2022).
  17. Tropsha, A. Best Practices for QSAR Model Development, Validation, and Exploitation. Mol. Inform. 2010, 29, 476–488. [Google Scholar] [CrossRef]
  18. Friedman, J.H. Multivariate Adaptive Regression Splines. Ann. Stat. 1991, 19, 1–67. [Google Scholar] [CrossRef]
  19. Gackowski, M.; Szewczyk-Golec, K.; Pluskota, R.; Koba, M.; Madra-Gackowska, K.; Woźniak, A. Application of Multivariate Adaptive Regression Splines (MARSplines) for Predicting Antitumor Activity of Anthrapyrazole Derivatives. Int. J. Mol. Sci. 2022, 23, 5132. [Google Scholar] [CrossRef]
  20. Roy, K.; Ambure, P.; Kar, S.; Ojha, P.K. Is It Possible to Improve the Quality of Predictions from an “Intelligent” Use of Multiple QSAR/QSPR/QSTR Models? J. Chemom. 2018, 32, e2992. [Google Scholar] [CrossRef]
  21. Todeschini, R.; Gramatica, P. The Whim Theory: New 3D Molecular Descriptors for Qsar in Environmental Modelling. SAR QSAR Environ. Res. 1997, 7, 89–115. [Google Scholar] [CrossRef]
  22. Kaur, D.; Thati, M.; Ruf, W. Factor X—Protease Activated Receptor-2 Signaling in the Regulation of Diet-Induced Obesity. Available online: https://abstracts.isth.org/abstract/factor-x-protease-activated-receptor-2-signaling-in-the-regulation-of-diet-induced-obesity (accessed on 21 July 2022).
  23. Cao, D.S.; Liang, Y.Z.; Xu, Q. Molecular Descriptors Guide Description of the Molecular Descriptors Appearing in the ChemoPy Software Package © 2012 China Computational Biology Drug Design Group Table of Contents. Man. Chemopy 2012. Available online: https://www.researchgate.net/profile/Dong-Sheng-Cao/publication/235919348_manual_for_chemopy/links/0912f5142d38a4eeb9000000/manual-for-chemopy.pdf?origin=publication_list (accessed on 9 August 2022).
  24. Devinyak, O.; Havrylyuk, D.; Lesyk, R. 3D-MoRSE Descriptors Explained. J. Mol. Graph. Model. 2014, 54, 194–203. [Google Scholar] [CrossRef] [PubMed]
  25. Todeschini, R.; Consonni, V. Handbook of Molecular Descriptors; Wiley-VCH: Weinheim, Germany; New York, NY, USA; Chichester, UK; Brisbane, Australia; Sigapore; Toronto, ON, Canada, 2000; Volume 11, ISBN 3527299130. [Google Scholar]
  26. Suleiman, M.; Klenina, O.V.; Ogurtsov, V. Synthesis, Biological Activity Evaluation and QSAR Studies of Novel 3- Synthesis, Biological Activity Evaluation and QSAR Studies of Novel. J. Chem. Pharm. Res. 2014, 6, 1219–1235. [Google Scholar]
  27. Consonni, V.; Todeschini, R.; Pavan, M.; Gramatica, P. Structure/Response Correlations and Similarity/Diversity Analysis by GETAWAY Descriptors. 2 Application of the Novel 3D Molecular Descriptors to QSAR/QSPR Studies. J. Chem. Inf. Comput. Sci. 2002, 42, 693–705. [Google Scholar] [CrossRef] [PubMed]
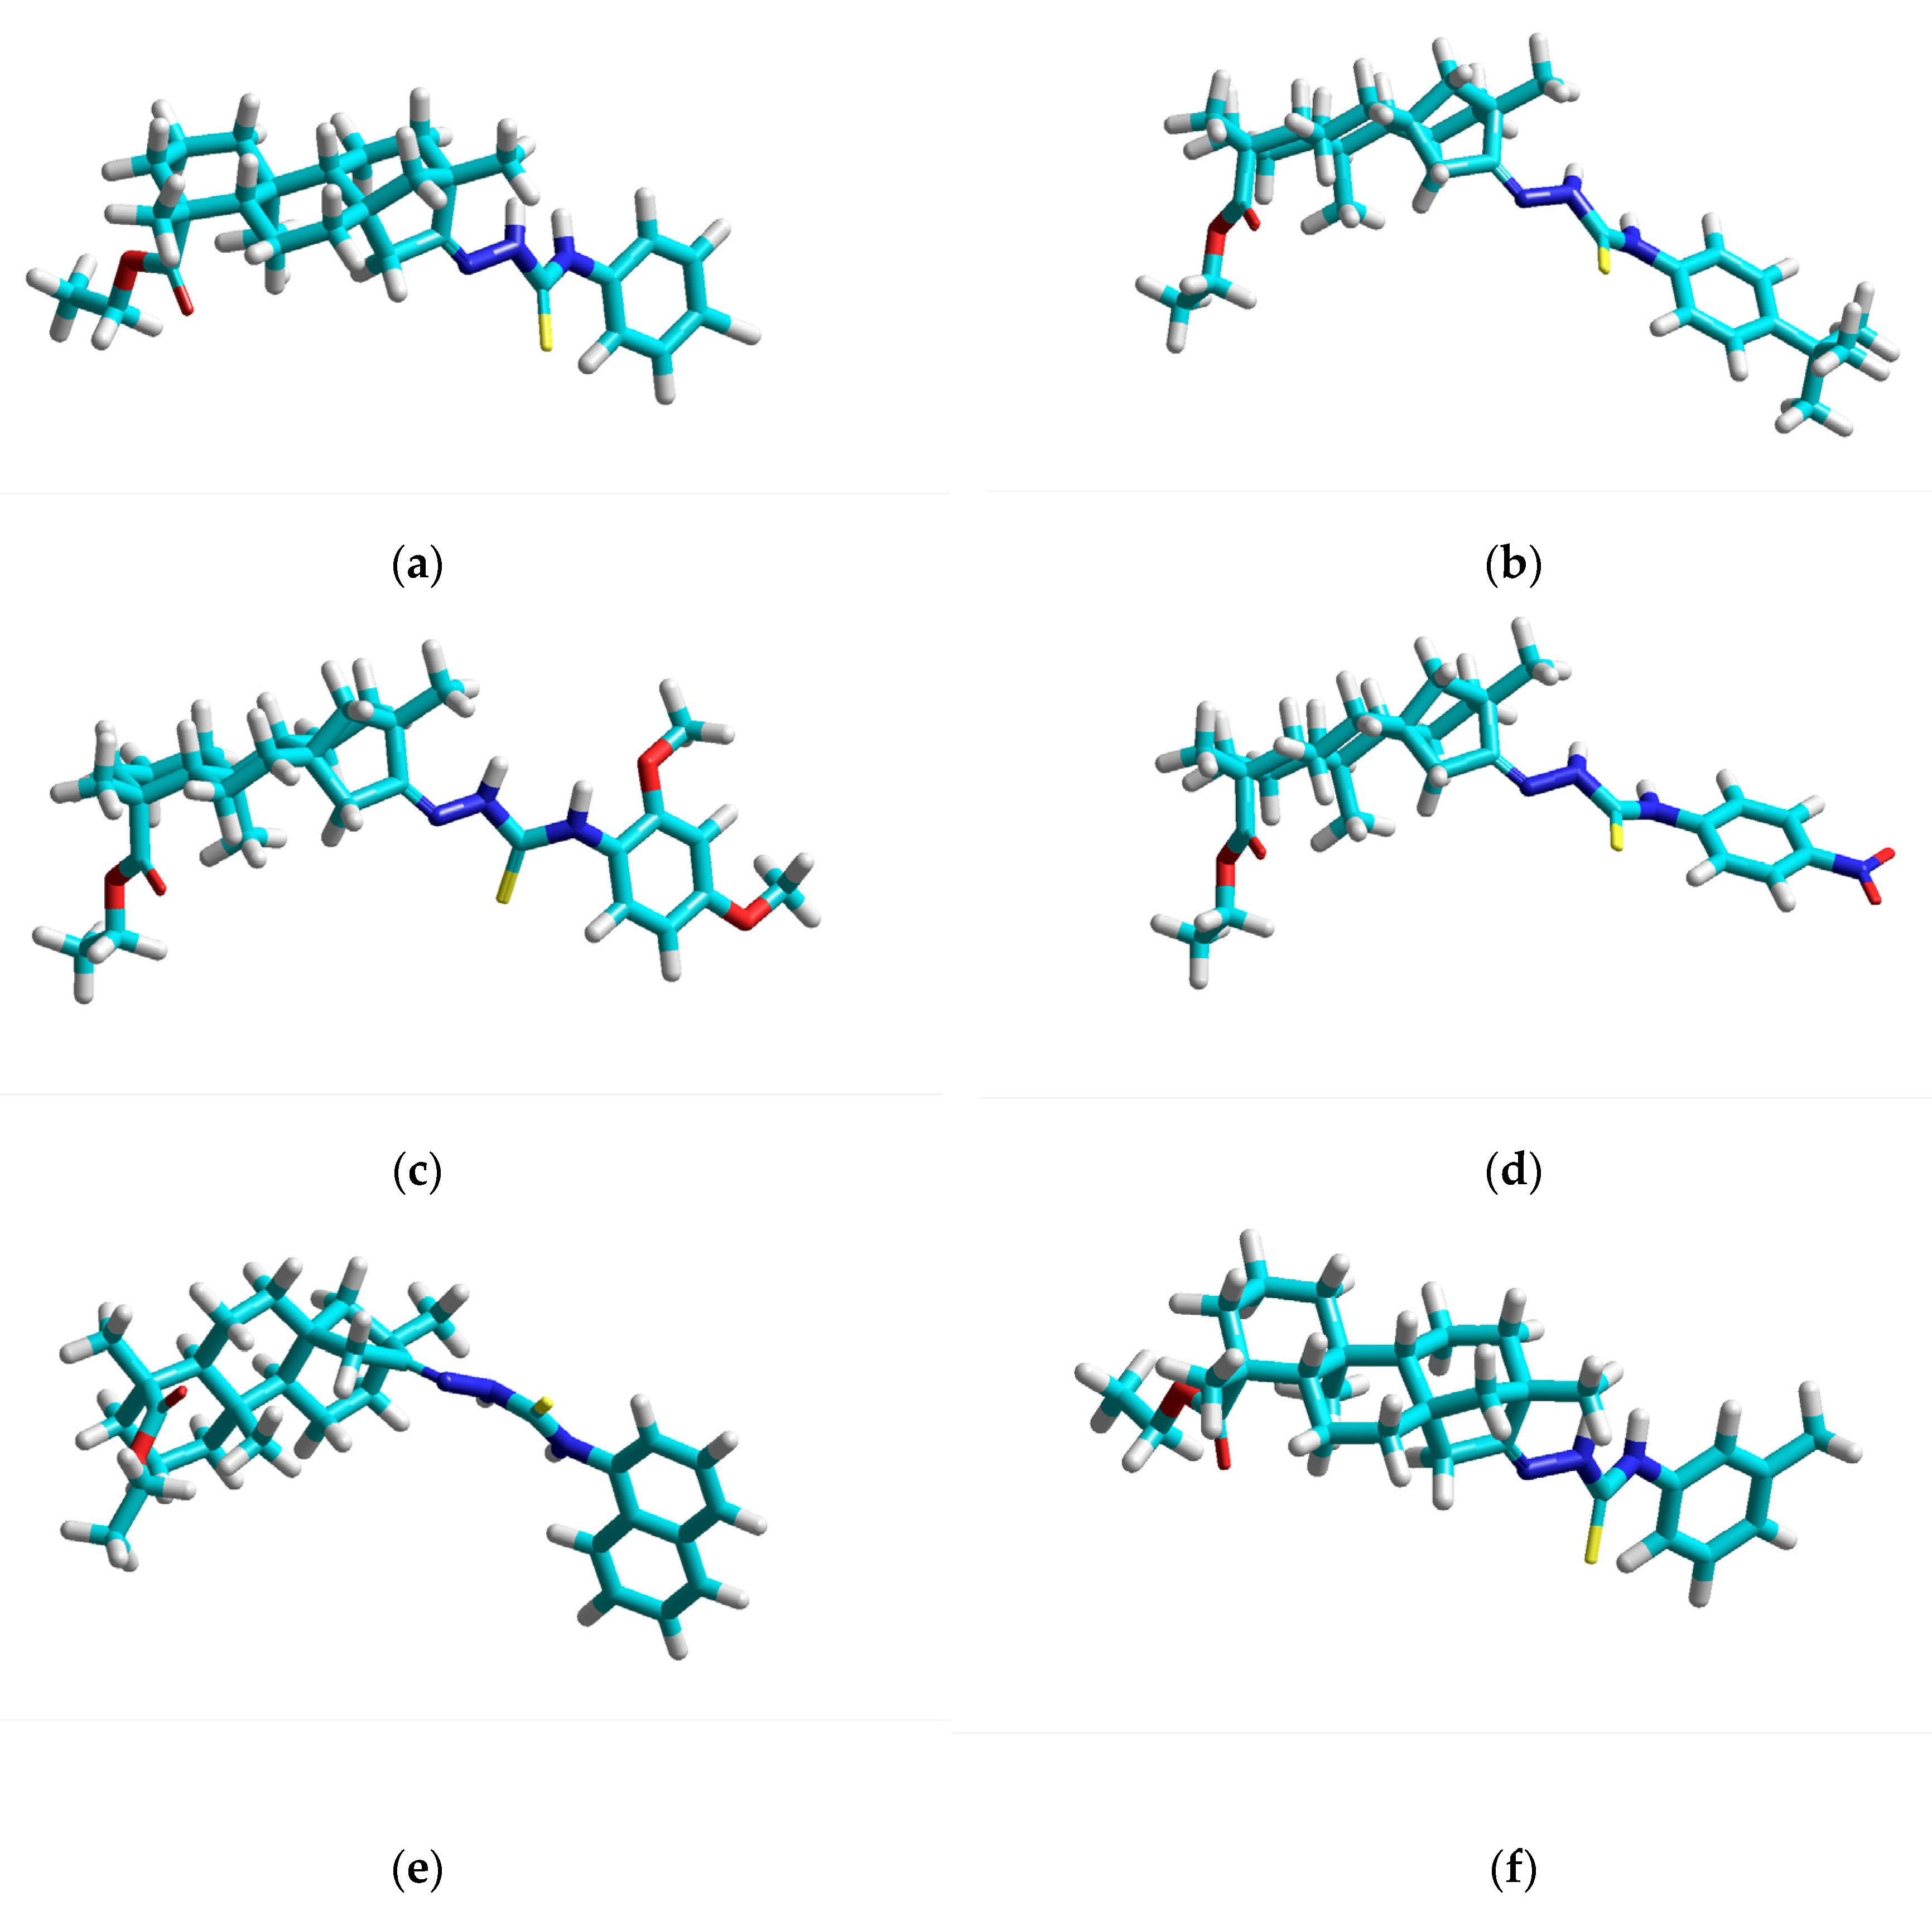
Figure 1. Geometrically optimized structures of selected isosteviol thiourea analogues: (a) i-22; (b) i-25; (c) i-29; (d) i-32; (e) i-34; (f) i-39.
Nutrients 14 03521 g001
Figure 2. Correlation between the calculated and experimental FXa inhibitory activity of thiourea isosteviol analogues for training and test data sets. (pIC50-negative decimal logarithm of the half-maximal inhibitory concentration).
Nutrients 14 03521 g002
Table 1. Chemical structures and FXa inhibitory activity of isosteviol derivatives studied.
Nutrients 14 03521 i001
CompoundSetR *Inhibition Activity Against FXa **: IC50 ***, M ****
i20training Nutrients 14 03521 i00213,382.4 ± 183.85
i21test Nutrients 14 03521 i00357,733.6 ± 315.07
i22training Nutrients 14 03521 i004152.78 ± 3.18
i23training Nutrients 14 03521 i00527,546.6 ± 391.27
i24training Nutrients 14 03521 i0068772.8 ± 25.43
i25training Nutrients 14 03521 i0079034.4 ± 16.58
i26training Nutrients 14 03521 i00854,893.0 ± 588.77
i27test Nutrients 14 03521 i0098658.8 ± 40.20
i28training Nutrients 14 03521 i0106651.8 ± 40.00
i29training Nutrients 14 03521 i01133,578.2 ± 275.65
i30test Nutrients 14 03521 i01218,409.0 ± 435.88
i31training Nutrients 14 03521 i01329,616.6 ± 349.80
i32training Nutrients 14 03521 i0148463.4 ± 21.64
i33training Nutrients 14 03521 i01513,591.6 ± 410.15
i34test Nutrients 14 03521 i016955.12 ± 18.74
i35training Nutrients 14 03521 i017196.34 ± 5.37
i36training Nutrients 14 03521 i0187727.8 ± 11.63
i37training Nutrients 14 03521 i0194154.2 ± 50.22
i38test Nutrients 14 03521 i020209.38 ± 4.76
i39test Nutrients 14 03521 i0213759.2 ± 28.12
* a side chain of a particular isosteviol thiourea analogue; ** activated coagulation factor X; *** the half-maximal inhibitory concentration; **** molarity.
Table 2. User-defined parameters of MARSplines procedure.
OptionsValues
Maximum number of basis functions40
Degree of interactions3
Penalty2
Threshold0.0005
Apply pruningYES
Table 3. Values of significant molecular descriptors for the tested isosteviol derivatives.
CompoundSetDescriptors
B01[C-Cl] *E2m **L3v ***Mor06i ****RDF070i *****HATS7s ******
i20training00.1661.551−4.42850.0270.614
i21test00.1641.477−4.30255.2310.592
i22training10.1391.525−3.42150.4270.677
i23training00.1531.518−3.90951.8340.757
i24training00.1141.519−3.61950.990.650
i25training00.1551.54−4.57854.0790.477
i26training00.1831.468−4.29454.8970.585
i27test00.1331.485−4.32153.8270.645
i28training00.1511.62−4.44552.2510.577
i29training00.1941.444−4.45147.9550.559
i30test00.1521.685−4.56849.9180.600
i31training00.1571.469−4.43459.6220.525
i32training00.1341.577−3.92550.960.633
i33training00.1481.495−4.19650.6490.646
i34test00.1782.086−5.57852.7890.566
i35training10.1471.574−3.51554.9230.629
i36training10.2811.716−1.04444.5790.597
i37training00.1611.824−4.69557.5520.546
i38test10.1911.296−4.03745.9680.597
i39test00.1651.648−4.63855.4290.609
* Presence/absence of C-Cl at topological distance 1; ** 2nd component accessibility directional WHIM index/weighted by mass; *** 3rd component size directional WHIM index/weighted by van der Waals volume; **** signal 06/weighted by ionization potential; ***** Radial Distribution Function—070/weighted by ionization potential; ****** leverage-weighted autocorrelation of lag 7/weighted by I-state.
Table 4. Selected descriptors and the number of their appearances in the basis functions of the MARS model.
SymbolDefinitionBlockDimensionalityNumber in the Basis Function
B01[C-Cl]Presence/absence of C-Cl at topological distance 12D Atom Pairs2D1
E2m2nd component accessibility directional WHIM index/weighted by massWHIM * descriptors3D1
L3v3rd component size directional WHIM index/weighted by van der Waals volumeWHIM descriptors3D1
Mor06isignal 06/weighted by ionization potential3D-MoRSE ** descriptors3D1
RDF070iRadial Distribution Function—070/weighted by ionization potentialRDF *** descriptors3D1
HATS7sleverage-weighted autocorrelation of lag 7/weighted by I-stateGETAWAY **** descriptors3D1
* Weighted Holistic Invariant Molecular descriptors; ** Molecular Representation of Structures based on Electron diffraction; *** Radial Distribution Function; **** Geometry, Topology and Atom-Weights Assembly.
Table 5. The basis spline functions.
Bm *Definitionam **
B015.74300
B1(B01[C-Cl])+2.08922
B2(E2m-0.11400)+−1.17409
B3(L3v-1.44400)+2.16641
B4(Mor06i+4.69500)+−3.32023
B5(RDF070i-44.57900)+−4.22030
B6(HATS7s-0.47700)+−1.17824
* basis function ** coefficient of a basis function.
Table 6. Values of validation parameters of models obtained with the MARSplines procedure (the optimal model marked in blue).
Degree of InteractionNumber of Basis FunctionsR2Q2MAE
120.992720.152080.2973
60.998460.792230.1017
210.989840.173750.4235
50.997450.671950.1635
120.996310.501170.1476
310.989840.173750.4235
50.997510.671950.1635
120.997470.658400.1313
Table 7. Values of validation parameters of the best MARS submodel.
ParameterValueThresholdMeaning [20]
R 2 = 1 ( Y o b s Y c a l ) 2 ( Y o b s Y ¯ t r a i n i n g ) 2 0.9985~1a measure of the variation of observed with the predicted data
Q 2 ( o r Q L O O 2 ) = 1 ( Y o b s ( t r a i n i n g ) Y p r e d ( t r a i n i n g ) ) 2 ( Y o b s ( t r a i n i n g ) Y ¯ ( t r a i n i n g ) ) 2 0.7922≥0.5cross-validated R2 (Q2) tested for internal validation
Q F 1 2 = 1 ( Y o b s ( t e s t ) Y p r e d ( t e s t ) ) 2 ( Y o b s ( t e s t ) Y ¯ ( t r a i n i n g ) ) 2 0.9874≥0.5it measures the correlation between the observed and predicted data of the test set
Q F 2 2 = 1 ( Y o b s ( t e s t ) Y p r e d ( t e s t ) ) 2 ( Y o b s ( t e s t ) Y ¯ ( t e s t ) ) 2 0.7927≥0.5almost equal or closer values of Q2(F2) and Q2(F1) infer that the training set mean lies in the close propinquity to that of the test set
Q F 3 2 = 1 [ ( Y o b s ( t e s t ) Y p r e d ( t e s t ) ) 2 ] / n t e s t [ ( Y o b s ( t r a i n ) Y ¯ ( t r a i n ) ) 2 ] / n t r a i n   0.9706≥0.5it is a measure of the model predictability
C C C = 2 i = 1 n ( x i x ¯ ) ( y i y ¯ ) i = 1 n ( x i x ¯ ) 2 + i = 1 n ( y i y ¯ ) + n ( x ¯ y ¯ ) 0.9635~1concordance correlation coefficient (CCC) measures both precision and accuracy, detecting the distance of the observations from the fitting line and the degree of deviation of the regression line from that passing through the origin, respectively
r m 2 ¯ = ( r m 2 + r m 2 ) 2   and   r m 2 = | r m 2 r m 2 | ,
where   r m 2 = r 2 × ( 1 r 2 r 0 2 )
r m 2 = r 2 × ( 1 r 2 r 0 2 )
And   parameters   r 2   and   r 0 2   are   denoted   as   follows :
r 0 2 = 1 ( Y o b s k × Y p r e d ) 2 ( Y o b s Y ¯ o b s ) 2   and
r 0 2 = 1 ( Y p r e d k × Y o b s ) 2 ( Y p r e d Y ¯ p r e d ) 2
The terms k and k′ are explained as follows:
k = ( Y o b s × Y p r e d ) ( Y p r e d ) 2   and   k = ( Y o b s × Y p r e d ) ( Y o b s ) 2
0.0196 and 0.9216 r m 2   <   0.2   provided   that   the   value   of   r m 2 ¯ 2 > 0.5they reflect the overall predictability of the model for the whole data set
P R E S S = ( Y o b s Y p r e d ) 2 0.8154 assesses the model using the predicted residual sum of squares
S D E P = PRESS n 0.2020 standard deviation of error of prediction (SDEP) is calculated from PRESS
M A E = | Y o b s Y p r e d | n 0.1017 index of errors in the context of predictive modeling studies
Publisher’s Note: MDPI stays neutral with regard to jurisdictional claims in published maps and institutional affiliations.